Where this fits
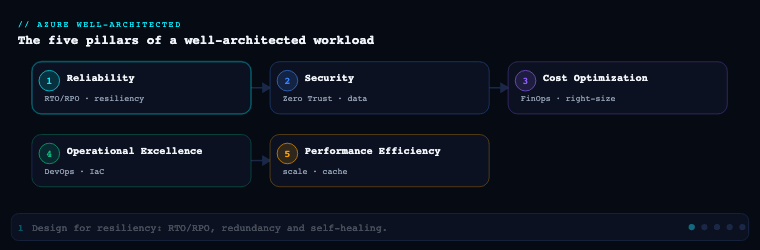
The Azure Well-Architected Framework (WAF) is built on five pillars — Reliability, Security, Cost Optimization, Operational Excellence, and Performance Efficiency — and Performance Efficiency is the pillar that asks “can the workload meet its performance targets as demand grows, and do so without throwing money at the problem?” Where Reliability (part 1) asked “will it stay up?” and Cost Optimization (part 3) asked “are we paying a fair price?”, Performance Efficiency is the discipline of matching supply (compute, memory, IO, concurrency) to demand efficiently — scaling out before scaling up, removing redundant work through caching and partitioning, and proving it under load rather than assuming. It is organized around official design principles and the checklist items PE:01 through PE:12 in the Microsoft documentation, and it is deliberately the pillar most in tension with Cost Optimization: every performance decision is also a money decision. This article goes deep on the seven sub-components that, together, are how a real Azure workload earns a passing grade on this pillar.
Performance design principles
The Performance Efficiency pillar is anchored by a small set of design principles, and every concrete decision later in this article traces back to one of them. They are not platitudes — each maps to checklist items you can audit.
| Principle | What it means in practice | WAF checklist anchor |
|---|---|---|
| Negotiate realistic performance targets | Define numeric, measurable targets (latency percentiles, throughput, concurrency) agreed with the business — not “fast”. | PE:01 |
| Design to meet capacity requirements | Plan capacity for normal, peak, and growth using demand data, and choose services that can supply it. | PE:02, PE:03 |
| Achieve and sustain performance | Validate targets continuously through testing and monitoring; performance degrades silently without it. | PE:04, PE:05 |
| Improve efficiency through optimization | Do less work: scale appropriately, partition data, cache, and remove hot paths. | PE:06, PE:07, PE:08, PE:09 |
| Make tradeoffs | Performance trades against cost, reliability, security and operational complexity — make the tradeoff explicitly. | PE:10, PE:11, PE:12 |
Four cross-cutting mental models sit on top of these:
- Define the target before you optimize. Performance work without a numeric target is endless. The unit of a target is a Service Level Objective (SLO) expressed as a percentile — e.g. “P95 server-side latency under 200 ms at 5,000 requests/sec” — not an average, because averages hide the tail that users actually feel.
- Performance is a per-flow property, not a per-system property. A workload has many critical flows (checkout, search, login), each with its own target, its own bottleneck, and its own scaling behavior. You analyze and optimize flows, not “the app”.
- Scale out before you scale up. Horizontal scaling is the cloud-native default because it is elastic, fault-isolating, and (above a point) cheaper than ever-larger single instances. Vertical scaling is a tactical lever with a hard ceiling.
- The cheapest, fastest work is the work you don’t do. Caching, partitioning, async offloading, and right-sized queries beat raw horsepower. Optimize the code and data path before you buy more capacity.
Artifacts you produce here: a documented set of performance targets per critical flow (the SLO catalog), a list of the critical user/system flows with their expected load, the agreed performance budget, and the explicit tradeoff decisions (e.g. “we accept eventual consistency on the read replica to hit the latency SLO”). These feed every later decision.
Capacity planning
Capacity planning (PE:02, PE:03) is the discipline of determining how much of each resource the workload needs across normal load, peak load, and projected growth — then selecting Azure services and SKUs that can supply it, with headroom, without over-provisioning.
Why it matters: under-provisioning produces throttling, queueing, and SLO breaches at exactly the worst moment (peak); over-provisioning quietly burns budget every hour of every day. Both are failures of this pillar. Good capacity planning is what lets you size the floor (minimum instances) and the ceiling (maximum instances / SKU) of every autoscaling component on evidence rather than guesswork.
How to do it well in Azure:
- Model demand from data, not intuition. Use historical telemetry from Azure Monitor and Application Insights (request rates, concurrent users, payload sizes) and business inputs (campaign calendars, seasonal peaks, onboarding forecasts). Distinguish organic growth (linear, predictable) from event-driven spikes (Black Friday, product launches, batch windows).
- Characterize the workload shape. Is it steady-state, diurnal (business-hours), bursty, or batch? The shape dictates the strategy: steady-state favors reserved capacity / savings plans; bursty favors autoscale + consumption/serverless; batch favors spot/low-priority capacity and schedule-based scaling.
- Quantify the unit of scale. Establish a capacity model: “1 vCPU + 2 GB RAM sustains ~120 requests/sec for this service at P95 < 200 ms.” This linear (or near-linear) relationship, derived from load testing, is what turns a demand forecast into an instance count.
- Respect platform limits. Subscription and service quotas/limits (vCPU quotas per region/family, App Service plan instance caps, Cosmos DB RU ceilings, Event Hubs throughput units, SNAT ports) are real capacity boundaries. Check them with Azure Quotas and request increases before a launch, not during one.
- Choose the SKU on the bottleneck dimension. Compute-bound, memory-bound, IO-bound, and network-bound workloads need different VM families (e.g. F-series for compute, E-series for memory, L-series for storage/IO) or different PaaS tiers (App Service P-series, Premium Functions, Cosmos DB autoscale vs. provisioned).
| Capacity input | Source / Azure tool | Used to size |
|---|---|---|
| Historical request rate & concurrency | Application Insights, Azure Monitor metrics | Floor/ceiling instance counts, autoscale rules |
| Per-instance throughput (unit of scale) | Azure Load Testing results | Instances-per-1000-RPS, RU/s, throughput units |
| Business growth & event calendar | Product/marketing forecasts | Headroom, scheduled scale-out, reservation sizing |
| Platform quotas | Azure Quotas, Service Limits docs | Maximum achievable scale; quota increase requests |
| Cost per unit of capacity | Azure Pricing / Cost Management | Reserved vs. on-demand vs. spot tradeoff |
Decisions to make: the floor and ceiling for each autoscaling component; the commitment posture (reserved instances / savings plan for the steady baseline, on-demand or serverless for the variable top); the buffer/headroom percentage (commonly 20–30% above forecast peak for the autoscale ceiling); and which workloads tolerate spot VMs for cost. Artifacts: a capacity model document, a quota checklist with requested increases, and a sizing rationale per component tied back to the SLO catalog.
Scaling vertically and horizontally
Scaling (PE:05) is how the workload supplies more capacity in response to demand. The two axes — vertical (scale up/down: bigger instances) and horizontal (scale out/in: more instances) — have very different elasticity, cost, and failure characteristics, and a mature design knows when to use each.
Vertical scaling changes the size of an instance (more vCPU/RAM/IO). It is simple, requires no application changes, and is the right tool for stateful components that are hard to distribute (a primary database, a legacy monolith, a cache node) or to relieve a memory/CPU bottleneck quickly. Its limits are decisive: there is a maximum SKU, changes often require a restart/failover (brief downtime), and cost grows non-linearly at the top of the range. Vertical scaling is a coarse, occasional lever.
Horizontal scaling adds or removes identical instances behind a load balancer. It is the cloud-native default because it is elastic (fine-grained), fault-isolating (one instance failing is one of N), and effectively unbounded. It demands that the component be stateless (or externalize state to a shared store) so any instance can serve any request — which is why session state goes to Azure Cache for Redis or Azure Cosmos DB, not instance memory.
Autoscaling is horizontal scaling made automatic and is where most of the engineering lives:
- Metric-based (reactive) scaling responds to a signal crossing a threshold (CPU, memory, queue length, requests/sec, custom App Insights metric). Queue length and requests-per-instance are usually better scale signals than CPU for web and event-driven workloads because they correlate directly with user-facing backlog.
- Schedule-based (proactive) scaling pre-warms capacity ahead of a known peak (business hours, a sale) — essential because instances take time to provision and warm up, so reactive scaling alone arrives late.
- Event-driven scaling, via KEDA on AKS and Azure Container Apps (and the scale-to-zero consumption model in Functions and Container Apps), scales on the depth of an event source (Service Bus, Event Hubs, Kafka, Storage Queue) — the gold standard for asynchronous workloads.
| Service | Horizontal scaling mechanism | Vertical scaling | Scale-to-zero |
|---|---|---|---|
| Azure App Service | Autoscale rules / automatic scaling (Premium v3) | Change plan tier (P1v3→P3v3) | No (Always On) |
| Azure Functions | Event-driven (Consumption / Flex Consumption) | Premium plan instance size | Yes (Consumption) |
| Azure Container Apps | KEDA scalers, HTTP concurrency rules | CPU/memory per replica | Yes |
| AKS | Horizontal Pod Autoscaler + Cluster Autoscaler / Karpenter + KEDA | Node pool VM size | Pods yes; nodes via autoscaler |
| Virtual Machine Scale Sets | Autoscale profiles + Flexible orchestration | VM SKU resize | No |
| Azure SQL Database | Read scale-out replicas; Hyperscale named replicas | vCore/DTU resize; serverless auto-scale | Serverless auto-pause |
| Cosmos DB | Add physical partitions automatically; multi-region | Autoscale RU/s (10x band) | No (autoscale floor) |
Decisions to make: which components are stateless and therefore horizontally scalable (and how to externalize state for those that aren’t); the scale metric and thresholds per component; scale-out vs. scale-in cooldowns and step sizes to avoid flapping; whether to combine scheduled pre-warm + reactive scaling; and the maximum instance count (tied to the capacity model and quotas). Artifact: an autoscale design per component — signal, thresholds, min/max, cooldown — version-controlled in IaC (Bicep/Terraform).
Data partitioning
Data partitioning (PE:08, and a core scalability technique) splits data and its workload across multiple partitions so that no single store, node, or key becomes the bottleneck. It is the technique that lets the data tier scale horizontally, which matters because the database is the most common ceiling on overall workload throughput.
Why it matters: a single database instance has a finite ceiling on connections, IOPS, CPU, and lock contention. Once you exceed it, no amount of application-tier scale-out helps — requests queue at the data tier. Partitioning removes that ceiling by spreading load, and it also improves manageability (smaller indexes, faster maintenance) and can localize data for residency and latency.
The three partitioning strategies (often combined):
| Strategy | What it does | Best for | Azure expression |
|---|---|---|---|
| Horizontal (sharding) | Splits rows across partitions by a key | Scaling write/read throughput beyond one node | Cosmos DB partition key; SQL Elastic Database tools / sharding; Table Storage PartitionKey |
| Vertical | Splits columns by access pattern (hot vs. cold, frequently vs. rarely read) | Reducing row width, isolating large blobs | Separate tables/containers; move blobs to Storage; column store |
| Functional | Splits data by bounded context / service | Microservices, isolating noisy domains | Database-per-service; separate Cosmos accounts/containers |
Choosing the partition (shard) key is the single highest-leverage decision and the hardest to change later:
- It must spread both storage and throughput evenly to avoid a hot partition — the failure mode where one partition (e.g. a “TenantId = BigCustomer” or a monotonically increasing timestamp key) absorbs a disproportionate share of traffic and throttles while others sit idle. In Cosmos DB this surfaces as
429 (Request rate too large)on a specific physical partition even when total provisioned RU/s looks adequate. - It should align with the most common query’s filter so reads stay single-partition (cheap, fast) rather than cross-partition fan-out (expensive). In Cosmos DB, a query that includes the partition key is routed to one partition; one that omits it fans out to all.
- High cardinality and even access distribution beat low-cardinality keys. Synthetic/composite keys (e.g.
tenantId-region-hashbucket) are a common remedy for skew.
Azure-specific mechanics: Cosmos DB auto-manages physical partitions (each capped at 50 GB and a throughput share) behind your chosen logical partition key — so the key choice is yours and irreversible per container. Azure SQL offers Hyperscale (which scales storage to 100 TB and adds read replicas without classic sharding), partitioned tables within an instance, and application-level sharding via Elastic Database tools for true multi-instance scale. Event Hubs/Kafka partition the stream by partition key, which determines parallelism and ordering. Azure Storage tables/blobs partition by PartitionKey/path.
Decisions and artifacts: the partition key per data store (with the skew analysis that justifies it), the consistency model (Cosmos DB’s five levels — Strong → Bounded Staleness → Session → Consistent Prefix → Eventual — traded against latency and cost), a cross-partition query inventory (and how to avoid them), and a re-partitioning/rebalancing plan for when a key turns out to be hot. Artifact: a data-partitioning design document with the chosen key, the access patterns it serves, and the hot-partition mitigation.
Caching
Caching (PE:08 optimization) stores the results of expensive work — query results, computed values, rendered fragments, session state — close to the consumer so that subsequent requests are served from fast memory instead of recomputing or re-fetching. It is the highest-ROI performance technique because it simultaneously reduces latency and removes load from downstream systems (database, APIs), which in turn reduces the capacity you need to provision.
Why it matters: most read-heavy workloads have strong locality — a small fraction of items account for most reads. Serving those from a cache turns a multi-hundred-millisecond database round trip into a sub-millisecond memory lookup and can cut backend load by an order of magnitude, deferring or eliminating the need to scale the data tier.
The cache tiers in an Azure architecture (use several together):
| Cache tier | Azure service | Caches | Typical latency win |
|---|---|---|---|
| Edge / CDN | Azure Front Door, Azure CDN | Static assets, cacheable API responses (per Cache-Control) |
Tens→single ms (served from PoP) |
| Application data cache | Azure Cache for Redis (Basic→Enterprise), Azure Managed Redis | Query results, computed objects, session/token state | DB round trip → sub-ms |
| Database-integrated | Cosmos DB integrated cache (dedicated gateway); SQL result/plan cache | Repeated point reads/queries | RU charge → near-zero on hit |
| In-process | IMemoryCache, output caching |
Per-instance hot objects, rendered fragments | Network hop → in-memory |
| Materialized views | Precomputed read models (CQRS) | Expensive aggregations/joins | Query-time compute → read |
Patterns that separate good from bad:
- Cache-aside (lazy loading) is the default: the app checks the cache, and on a miss reads the source and populates the cache. Pair with a Time-To-Live (TTL) so data eventually refreshes.
- Invalidation is the hard part. Decide explicitly between TTL-based expiry (simple, tolerates staleness) and event-driven invalidation (write-through or publish-on-change for data that must be fresh). Stale-cache bugs are the most common caching defect.
- Defend against the failure modes. Cache stampede / dogpile (many requests recomputing the same expired key at once) is mitigated by request coalescing or staggered TTLs. Cache penetration (repeated misses for non-existent keys hitting the DB) is mitigated by caching negative results. Hot keys in Redis are mitigated by clustering and client-side caching (
RedisJSON/near-cache). - Right-size and right-tier Redis. Choose the tier (Basic/Standard/Premium/Enterprise) for the SLA, clustering, persistence, zone redundancy, and active geo-replication you need; size memory so the working set fits with headroom (eviction thrash destroys hit ratio); and monitor cache hit ratio, server load, and evicted-keys.
- Session and token caching externalizes state from app instances (enabling horizontal scaling) into Redis — a frequent first use of a distributed cache.
Decisions and artifacts: what is cacheable per flow and at which tier; the TTL and invalidation strategy per cached item; the Redis tier/size/redundancy; and the target cache hit ratio (commonly 80–95% for hot read paths) as a monitored KPI. Artifact: a caching strategy document mapping each expensive read path to a cache tier, TTL, and invalidation mechanism.
Performance testing
Performance testing (PE:04, PE:05) is how you prove the workload meets its targets and discover its real bottlenecks and breaking points — before users do. Capacity models and scaling rules are hypotheses; load testing is the experiment that validates them.
Why it matters: performance is emergent and counter-intuitive. Bottlenecks move (relieve the CPU and the database becomes the limit; fix the database and connection-pool exhaustion or SNAT-port exhaustion appears). The only reliable way to find the next bottleneck and to validate the unit-of-scale used in capacity planning is to drive realistic load and measure.
The test types, each answering a different question:
| Test type | Question it answers | When to run |
|---|---|---|
| Load test | Does it meet SLOs at expected peak load? | Pre-release; on perf-relevant changes |
| Stress test | Where does it break, and how does it fail? | Before major launches |
| Spike test | Does autoscale react fast enough to a sudden surge? | When traffic is bursty/event-driven |
| Soak (endurance) test | Does it degrade over hours (leaks, fragmentation)? | Before long-running production exposure |
| Benchmark / capacity test | What is the per-instance throughput (unit of scale)? | When building the capacity model |
How to do it well in Azure:
- Azure Load Testing is the managed, fully cloud service: it runs Apache JMeter and Locust scripts at scale from Azure, correlates the client-side results with server-side Azure Monitor metrics on the app under test in a single dashboard (so you see latency and the CPU/RU/queue that caused it), and supports pass/fail criteria that gate a release.
- Define the test on the critical flows and the SLOs from the design-principles phase — realistic request mixes, think-times, and data, not a single hammered endpoint. Synthetic-but-realistic test data must respect partition keys so you exercise real partition distribution.
- Test in a production-like environment (same SKUs, autoscale config, networking) or production carefully — results from an undersized environment are misleading.
- Shift performance left and gate releases. Wire Azure Load Testing into the CI/CD pipeline (Azure DevOps/GitHub Actions) so a regression in P95 latency or throughput fails the build via pass/fail criteria — preventing performance regressions from reaching production.
- Establish a baseline and compare every run to it so you detect regression, not just absolute pass/fail. A 15% latency increase that still passes the SLO is still a regression worth investigating.
Decisions and artifacts: the test plan per critical flow (load profile, data, pass/fail thresholds), the test environment definition, the cadence (per-PR smoke, pre-release full, periodic soak), and the baseline result set. Artifact: versioned JMeter/Locust scripts, an Azure Load Testing test configuration with pass/fail criteria, and a results history showing trend against baseline.
Continuous performance monitoring
Continuous performance monitoring (PE:04, PE:05) closes the loop: it confirms the workload keeps meeting its targets in production, surfaces regressions and saturation before they breach SLOs, and feeds real demand data back into capacity planning. Without it, performance erodes silently as data grows, code changes, and traffic shifts.
Why it matters: test environments and forecasts are approximations; production is ground truth. Monitoring is what detects the slow memory leak, the query that degraded as a table grew, the autoscale rule that never fires, the cache hit ratio that has quietly collapsed, and the partition that turned hot. It is also the evidence base for the next capacity-planning cycle.
The Azure observability stack and what each part does:
- Application Insights (an Azure Monitor capability) is the application-performance-monitoring (APM) core: request and dependency durations, failure rates, the application map (showing where latency accrues across services and dependencies), end-to-end distributed tracing, and Live Metrics. Smart Detection flags anomalous latency/failure spikes automatically. Modern instrumentation uses the OpenTelemetry-based Azure Monitor distributed tracing.
- Azure Monitor metrics provide the resource-level saturation signals — CPU, memory, IOPS, Cosmos DB RU consumption and 429s, Redis server load and hit ratio, queue lengths, SNAT port usage — visualized in Azure Monitor Workbooks and Azure Managed Grafana.
- Log Analytics (KQL) is where you query traces and metrics together to root-cause — e.g. correlating a P95 spike with a specific dependency or partition.
- Alerts on the right signals: metric alerts with dynamic thresholds (ML-baselined) for saturation, and log/query alerts for SLO-percentile breaches. Alert on leading indicators (queue depth, RU consumption %, cache hit ratio) not just lagging ones (latency already breached).
Measure the RED/USE signals, percentile-first:
| KPI | Signal type | Why it matters | Azure source |
|---|---|---|---|
| P50 / P95 / P99 latency per flow | Rate/Duration | The user-felt SLO; tails reveal the worst experience | Application Insights requests |
| Requests/sec & error rate | Rate/Errors | Throughput and failure under load | Application Insights, Front Door metrics |
| CPU / memory / IOPS utilization | Saturation (USE) | Compute headroom; triggers scaling | Azure Monitor platform metrics |
| Cosmos DB RU consumption & 429 count | Saturation | Data-tier throttling / hot partition | Cosmos DB metrics |
| Redis cache hit ratio & evictions | Efficiency | Caching effectiveness; undersized cache | Azure Cache for Redis metrics |
| Dependency duration | Duration | Which downstream call dominates latency | Application Insights dependencies |
| Autoscale events | Behavior | Is scaling firing correctly and in time? | Azure Monitor autoscale logs |
Decisions and artifacts: the KPI/SLI catalog mapped to SLOs, the dashboards (Workbooks/Grafana) per critical flow, the alert rules (signal, threshold strategy, action group, severity), and the periodic performance review cadence that feeds findings back into capacity planning and the backlog. Artifact: an observability design — instrumentation plan, dashboard set, alert catalog — and a recurring performance-review ritual.
Real-world enterprise scenario
Helios Streaming is a fictional pan-Asian over-the-top (OTT) video and live-sports streaming provider with 14 million registered users, 1.2 million concurrent viewers at peak, a personalized recommendations API, and a live-event ingestion and metrics pipeline. They run on Azure across three regions (Central India, Southeast Asia, Australia East). The trigger for a Performance Efficiency program is a marquee event — a cricket tournament expected to 5x normal peak concurrency in 90-second surges at wicket/goal moments — combined with a finding that the recommendations API breaches its latency SLO at peak and the database is the bottleneck. The Platform Performance team makes the following decisions, sub-component by sub-component.
-
Performance design principles. They catalog the critical flows and negotiate numeric SLOs with the business: playback start (manifest) P95 < 120 ms, recommendations API P95 < 200 ms at 60,000 RPS, live-metrics ingestion sustaining 250,000 events/sec with < 5 s end-to-end lag. They explicitly accept Session consistency on the recommendations read path (a documented tradeoff: eventual freshness for latency and cost) and set a performance budget per flow.
-
Capacity planning. Using twelve months of Application Insights data they model the unit of scale: recommendations sustains ~110 RPS per vCPU at P95 < 200 ms, so 60,000 RPS needs ~545 vCPU, sized to 160 instances of a 4-vCPU SKU with 25% headroom (ceiling 200). They size the steady baseline (40 instances) on a 1-year savings plan and let the variable top run on-demand. They request vCPU quota increases in all three regions and raise Cosmos DB and Event Hubs ceilings eight weeks before the event.
-
Scaling vertically and horizontally. The recommendations API (App Service Premium v3) and the manifest service (Azure Container Apps) are made stateless — session/token state moves to Redis — and scale horizontally: Container Apps uses HTTP-concurrency KEDA scaling; App Service uses scheduled pre-warm (capacity raised 20 minutes before scheduled match start) plus reactive requests-per-instance autoscale for the unpredictable in-match spikes. The single stateful primary SQL instance is scaled vertically to a larger Hyperscale tier as a stopgap while partitioning lands. KEDA on the ingestion AKS cluster scales pods on Event Hubs partition lag.
-
Data partitioning. The recommendations store is migrated to Azure Cosmos DB with autoscale RU/s; the partition key is changed from
userIdalone (which produced a hot partition for power users binge-watching) to a compositeuserId-contentRegionsynthetic key, and queries are rewritten to always include it so reads stay single-partition. The live-metrics pipeline partitions Event Hubs bymatchId-segmentto parallelize the surge across 32 partitions while preserving per-segment ordering. Hot-partition429s are monitored as a leading indicator. -
Caching. A four-tier cache strategy is deployed: Azure Front Door caches video segments and the static catalog at the edge (per
Cache-Control); Azure Cache for Redis Enterprise (clustered, zone-redundant, active geo-replication across the three regions) caches recommendation results (TTL 60 s, event-driven invalidation on profile change) and all session state; the Cosmos DB integrated cache serves repeated point reads at near-zero RU; andIMemoryCacheholds per-instance hot config. They target and monitor an 88% Redis hit ratio, and add staggered TTLs to prevent a stampede when a popular recommendation expires mid-surge. -
Performance testing. Using Azure Load Testing with JMeter scripts modeling the real request mix (with test data that respects the new composite partition key), they run load tests to peak, spike tests that replicate the 90-second 5x surge, and an 8-hour soak test (which catches a Redis connection leak). The test correlates client P95 with server-side Cosmos RU and Redis load in one dashboard. Pass/fail criteria (P95 < 200 ms, error rate < 0.5%) are wired into the GitHub Actions pipeline to gate releases; every run is compared to a baseline.
-
Continuous performance monitoring. Application Insights instruments every flow with OpenTelemetry distributed tracing and the application map; Azure Managed Grafana dashboards show per-flow P50/P95/P99, Cosmos RU% and 429s, Redis hit ratio and evictions, and autoscale events. Dynamic-threshold metric alerts fire on saturation leading indicators (RU > 80%, cache hit ratio < 80%, queue lag rising), and Smart Detection watches for anomalous latency. A weekly performance review feeds real demand back into the capacity model.
Measurable outcome (after the tournament): recommendations API P95 fell from 640 ms to 150 ms at peak and held the SLO through every surge; Cosmos DB 429 errors on the hot partition went from ~4,200/min to under 10/min after the composite key change; the Redis cache hit ratio stabilized at 91%, cutting database read load by roughly 9x and avoiding an estimated 70 additional SQL/Cosmos units of capacity; the spike test proved autoscale + pre-warm absorbed the 5x surge with zero SLO breaches during the actual event’s 1.2M-concurrent peak; and the soak-test-discovered Redis leak — which would have caused a slow degradation across a multi-hour broadcast — was fixed before launch.
Deliverables & checklist
Common pitfalls
- Optimizing without a numeric target. “Make it faster” is unbounded and unfalsifiable. Avoid it by defining percentile-based SLOs per critical flow first (P95/P99, not averages) and treating any change against the baseline as the test of done.
- Scaling up when you should scale out. Reaching for a bigger SKU hits a hard ceiling and grows cost non-linearly, and it leaves a single point of failure. Avoid it by making components stateless (externalize session/state to Redis or Cosmos DB) and scaling horizontally with autoscale, reserving vertical scaling for genuinely non-distributable stateful tiers as a tactical lever.
- A hot partition from a bad shard key. Choosing
userIdfor a power user, a tenant ID for your biggest customer, or a monotonic timestamp concentrates load on one partition and throttles (429) while total capacity looks fine. Avoid it by selecting a high-cardinality, evenly-distributed (often composite/synthetic) partition key that aligns with the dominant query, and monitoring per-partition RU and 429s. - Caching without an invalidation strategy. Stale data and cache stampedes are the top caching defects. Avoid it by deciding TTL-vs-event-driven invalidation explicitly per item, staggering TTLs and coalescing requests to prevent dogpile, caching negative results, and monitoring the hit ratio as a KPI.
- Reactive autoscale alone for bursty traffic. Instances take time to provision and warm, so purely reactive scaling arrives after the surge has already breached the SLO. Avoid it by combining schedule-based pre-warm for known peaks with reactive scaling for the unpredictable remainder, and validating with a spike test.
- No load testing in production-like conditions / no CI gate. Validating in an undersized environment, or never load-testing at all, lets regressions reach production. Avoid it by using Azure Load Testing against production-like SKUs and config, gating releases with pass/fail criteria in the pipeline, and comparing every run to a baseline to catch regression — not just absolute failure.
What’s next
Part 6 of the Azure Well-Architected Framework series turns to Operational Excellence — DevOps practices, safe deployment, observability, and automation that keep the workload healthy and evolvable in production.