There are two skills in this lesson, and they are joined at the hip. The first is making a program do many slow things at once without threads. The second is finding out where a program actually spends its time so you speed up the part that matters. They belong together because the biggest performance question you will ever ask — “is this slow because it’s waiting, or because it’s computing?” — has two completely different answers, and picking the wrong one wastes days. Async is the fix for waiting. It does precisely nothing for computing, and this lesson proves both with a stopwatch.
Everything below targets Python 3.12+. Every number is real — copied from a 3.12.3 run on an 8-core machine, not paraphrased — and because timings depend on your hardware and network, the rule throughout is: trust the ratios, not the absolute milliseconds. Where a feature needs a newer Python than the macOS system python3 (still 3.9), there’s a version note. The modern async ergonomics are recent, so it’s worth knowing the floor for each one up front:
| Feature | Added in | Falls back to | Why it matters |
|---|---|---|---|
asyncio.run() |
3.7 | manual loop management | ✅ The entry point — assume it |
asyncio.to_thread() |
3.9 | loop.run_in_executor(None, …) |
Offload blocking work off the loop |
asyncio.TaskGroup |
3.11 | asyncio.gather |
✅ Structured concurrency; cancels siblings on error |
asyncio.timeout() |
3.11 | asyncio.wait_for |
Deadline for a whole block |
ExceptionGroup / except* |
3.11 | catch a single exception | Surface all failures from a TaskGroup |
⚠️ On the macOS system python3 (3.9), asyncio.TaskGroup doesn’t exist — it’s an AttributeError, not a syntax error. Use a real 3.12 binary (/usr/local/bin/python3.12 or a venv) for anything in this lesson’s Part A.
Two of the demos hit the network. To keep them deterministic and free, they run against a tiny local HTTP server you’ll start yourself — no account, no paid API, no dependency on some public sandbox being up. One pip install httpx is the only outside package, and only for the async HTTP client.
Why this matters
Picture a program that has to fetch 100 URLs. Each one takes 50 milliseconds — not because your CPU is busy, but because the bytes are physically travelling across a network and back. Do them one after another and you wait 100 × 50ms = 5 seconds, and for essentially all of those 5 seconds your CPU is idle, sitting on its hands waiting for a socket. That idle time is the entire opportunity. If you could start all 100 requests, then let each one wake you up when its answer arrives, the whole batch would finish in about the time of the single slowest one. That is what async is for, and in this lesson it turns those ~6 seconds into 0.30 — measured.
The trap is that the mechanism which makes this possible is also a loaded gun. asyncio runs your coroutines on one thread, taking turns. A task runs until it politely says “I’m about to wait — someone else go” (that’s what await means), and only then does the next task get a turn. This is cooperative multitasking, and the word cooperative is doing enormous work: if any single task refuses to cooperate — if it calls a slow function that doesn’t await, or grinds through a big calculation — it holds the one thread hostage and every other task freezes with it. No preemption comes to save you. The most common async bug in the world is a time.sleep() or a synchronous database call sitting inside a coroutine, quietly serialising a program its author believed was concurrent.
So the mental model to carry through Part A has three parts, and blurring them is where the bugs live:
- One thread, taking turns. Async gives you concurrency (many things in progress), not parallelism (many things executing at the same instant). The turns are handed off at
awaitpoints and nowhere else. awaitis the only place control changes hands. Between twoawaits, your code has the thread entirely to itself — which is why you rarely need locks, and also why one long stretch with noawaitstalls the world.- Async is for waiting, not for working. Thousands of network waits: yes, spectacular. A heavy computation: no gain at all, because there is still only one thread doing the computing.
Then Part B answers the other half. Before you make anything faster, you measure — because programmer intuition about “the slow part” is wrong often enough that guessing is a coin flip, and optimising the wrong function is worse than doing nothing (you spent time and added complexity for a rounding error). cProfile will show you, in this lesson, a report where one function accounts for 1.319 of 1.322 seconds. Once you can see that, the fix is obvious and the payoff is a measured 126x. Get the measuring habit and the optimising takes care of itself.
The event loop: one thread, cooperative multitasking
The event loop is the engine. It is a single loop, on a single thread, that keeps a queue of ready tasks. Each tick it takes one ready task and runs it — runs your ordinary, synchronous Python at full native speed — until that task hits an await on something that isn’t ready yet (a socket with no data, a timer that hasn’t fired, a lock someone else holds). At that await, the task suspends: its stack frame freezes in place, locals and all, its pending I/O is registered with the operating system, and the loop is free to grab the next ready task. When the OS later reports that the I/O is done, the suspended task is put back on the ready queue and, on some future tick, resumes on the exact line after its await. That cycle — pick, run-until-await, suspend, reschedule — repeated thousands of times a second, is the whole thing.
The reason this scales to tens of thousands of connections on one thread, where one-thread-per-connection would collapse, is the selector: instead of a thread blocked on each socket, the loop hands the whole set of sockets to the kernel (epoll on Linux, kqueue on macOS) and asks one question — “which of these are ready?” — in a single call.
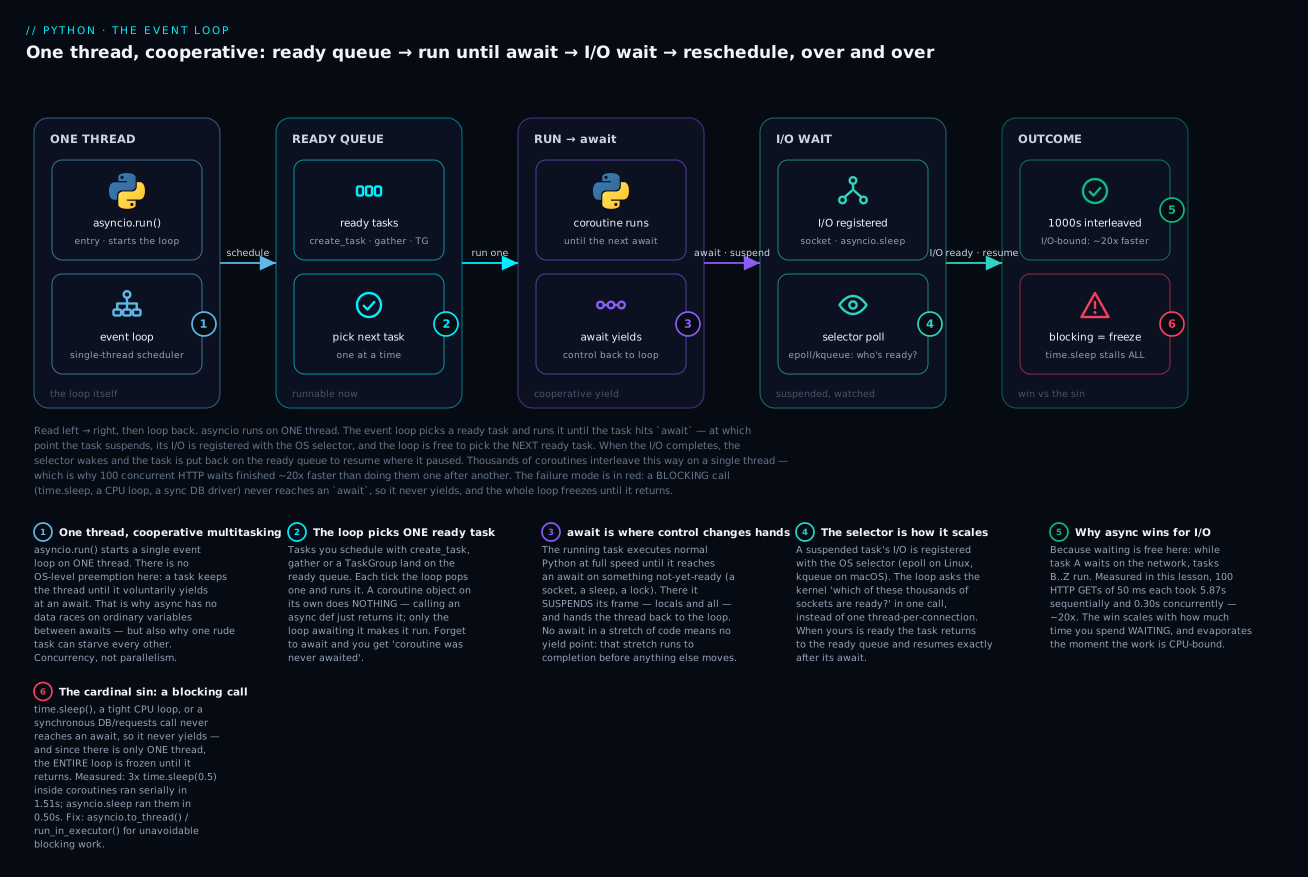
Follow it left to right and the design falls out. Your call is just an intent; asyncio.run starts the loop; the loop picks one ready task and runs it until an await; the await is where control changes hands; the selector is how the loop knows, cheaply, when to wake a suspended task. The green badge is the win — thousands interleaved on one thread — and the red badge is the sin this whole lesson keeps returning to: a blocking call never reaches an await, so it never yields, and the single thread is frozen until it returns.
Three consequences of “one thread, cooperative” are worth stating outright, because they surprise people coming from threads:
| Property | Threads (preemptive) | asyncio (cooperative) |
|---|---|---|
| Who decides when to switch | The OS, at any instant | Your code, only at await |
| Parallel execution | Yes (but Python’s GIL limits CPU) | ❌ Never — one thread |
| Data races on shared state | Yes — need locks | ⚠️ Only across await; none within a run |
| Cost per concurrent unit | ~MBs of stack, a real OS thread | A cheap Python object — 10k+ is fine |
| One unit hogs the CPU | Others still get scheduled | ⚠️ Everything freezes |
| Blocking call | Blocks one thread, others run | ❌ Blocks the entire loop |
That last row is the price of the model. Threads are forgiving of a blocking call — the OS just schedules around the stuck thread. Async is not: cooperation is mandatory, and the compiler will not enforce it for you.
Coroutines: the object that does nothing
A coroutine function is a function defined with async def. Here is the single most important fact about it, and the one beginners trip on first: calling it does not run it. It builds and hands back a coroutine object, inert, like a wound-up toy nobody has let go of. Nothing inside the body executes until something awaits or schedules that object.
import asyncio

async def greet(name):
    await asyncio.sleep(0.01)
    return f"hello {name}"

c = greet("ada")               # this line runs NO code inside greet
print("type:", type(c).__name__)
print("repr:", repr(c))
type: coroutine
repr: <coroutine object greet at 0x1012ad9c0>
You got an object, not "hello ada". To actually run it you need the event loop, and at the top level that means asyncio.run(), which starts a loop, drives your coroutine to completion, and shuts the loop down:
result = asyncio.run(greet("ada"))
print(result)
hello ada
asyncio.run is the one entry point you should use, and it has rules. It creates a fresh loop, runs your coroutine, and tears the loop down — so calling it twice in sequence is fine, but calling it inside a running loop raises RuntimeError: asyncio.run() cannot be called from a running event loop. Here’s the whole entry/access surface:
| Call | Does | Use / avoid |
|---|---|---|
asyncio.run(coro) |
✅ Create a loop, run coro, close the loop |
The only top-level entry point |
asyncio.get_running_loop() |
Return the loop you’re currently inside | ✅ Inside a coroutine, when you need the loop |
asyncio.get_event_loop() |
Get/create the thread’s loop | ⚠️ Deprecated with no running loop; in 3.12 it raises RuntimeError |
asyncio.new_event_loop() |
A fresh loop you manage by hand | Rarely — frameworks, tests |
asyncio.run(...) inside a coroutine |
❌ RuntimeError: ... from a running event loop |
Just await instead |
Now watch what happens if you build a coroutine and never await it — the classic bug, and Python’s most useful async warning:
async def greet(name):
    await asyncio.sleep(0.01)
    return f"hello {name}"

def make_orphan():
    greet("bob")               # result discarded, never awaited

make_orphan()
RuntimeWarning: coroutine 'greet' was never awaited
  greet("bob")   # result discarded, never awaited
That RuntimeWarning: coroutine '...' was never awaited is Python telling you a coroutine was created and dropped on the floor without running. It is almost always a forgotten await: you wrote save(record) when you meant await save(record), and the save silently never happened. The warning is easy to miss because it goes to stderr and the program keeps running — so treat it as an error, not a note.
await, and the three things you can await
await does two jobs at once: it says “suspend me here until this is ready” and “give me the value when it is.” You can only use it inside an async def. What you’re allowed to await is any awaitable, of which there are three you’ll actually meet:
| Awaitable | What it is | How you get one | Runs concurrently? |
|---|---|---|---|
| Coroutine | The object from calling an async def |
greet("ada") |
❌ Not until scheduled — await runs it now, inline |
| Task | A coroutine the loop is already running | asyncio.create_task(greet("ada")) |
✅ Yes — scheduled the moment you create it |
| Future | A low-level “result, eventually” box | Rarely by hand; libraries return them | ✅ Yes |
The distinction between a bare coroutine and a Task is the crux of concurrency, and it catches everyone once. await greet("ada") runs greet right now and waits for it — sequential. asyncio.create_task(greet("ada")) schedules greet to run alongside the current task and returns immediately; it only runs concurrently because it’s now a Task on the loop. Await two coroutines in a row and you get sequential execution; wrap them in tasks first and they overlap. Everything about “doing things at once” reduces to this.
⚠️ A coroutine is single-use. Once awaited, it’s spent — you cannot await it again:
async def once():
    return 1

async def main():
    c = once()
    print("first :", await c)
    print("second:", await c)      # re-awaiting the SAME coroutine object

asyncio.run(main())
first : 1
RuntimeError: cannot reuse already awaited coroutine
If you need to run the same logic twice, call the function twice to get two fresh coroutine objects. This is exactly the iterable-vs-iterator distinction from Iterators & Generators wearing an async coat — a coroutine, like a generator, is a one-shot thing.
The “function colour” problem
Here is the tax async charges, and it’s worth naming because it shapes whole codebases. await only works inside async def. So the moment one function becomes async, every function that wants its result must also become async — the “asyncness” is contagious, spreading up the call stack. People call this the function colour problem: functions come in two colours, sync and async, and calling an async function from a sync one is not free.
| From \ To | Call a sync function | Call an async function |
|---|---|---|
| From sync code | ✅ Just call it | ⚠️ Can’t await. Need asyncio.run(...) — starts a whole loop |
| From async code | ✅ Just call it (⚠️ but a blocking sync call freezes the loop) | ✅ await it() |
You can’t sprinkle await into ordinary code and you can’t call asyncio.run() from inside a running loop (you’ll see that error shortly). This is why libraries like httpx ship two clients — a sync Client and an async AsyncClient — and why adopting async is often an all-or-nothing decision for a code path rather than a local tweak. It is a real design cost, not just syntax, and it’s the honest reason not to reach for async unless you actually have concurrent waiting to exploit.
Running many at once: gather vs create_task vs TaskGroup
Three tools schedule multiple coroutines to run concurrently. They look similar and differ in exactly the thing that matters under failure: what happens to the other tasks when one of them raises.
asyncio.gather — the old workhorse
gather takes several awaitables, runs them concurrently, and returns their results in the order you passed them (not the order they finished):
import asyncio

async def timed(name, delay):
    await asyncio.sleep(delay)
    return name

async def main():
    results = await asyncio.gather(timed("slow", 0.2), timed("fast", 0.01))
    print("results:", results)

asyncio.run(main())
results: ['slow', 'fast']
'slow' is first in the list even though 'fast' finished 190ms earlier — gather preserves argument order, which is what makes it convenient. But its error behaviour has a sharp edge. By default, the first exception is re-raised to you immediately — while the other tasks keep running in the background, their results (or their own exceptions) silently discarded:
async def work(name, delay, boom=False):
    await asyncio.sleep(delay)
    if boom:
        raise ValueError(f"{name} exploded")
    print(f"  {name} finished after {delay}s")
    return name

async def main():
    try:
        await asyncio.gather(work("A", 0.1, boom=True), work("B", 0.3))
    except ValueError as e:
        print("  caught:", e)
    await asyncio.sleep(0.4)          # give B time to reveal it kept running

asyncio.run(main())
  caught: A exploded
  B finished after 0.3s
Read that carefully: A raised at 0.1s and you caught it, but B kept going and finished at 0.3s anyway — after the except block. gather did not cancel it. In a real system that orphaned task is a resource leak and a source of “why did this run after I handled the error?” mysteries. You can opt into a gentler mode with return_exceptions=True, which never raises and instead returns each outcome — result or exception object — in the results list:
async def main():
    results = await asyncio.gather(
        work("C", 0.1, boom=True), work("D", 0.2), return_exceptions=True,
    )
    print("results:", [type(r).__name__ if isinstance(r, Exception) else r for r in results])

asyncio.run(main())
  D finished after 0.2s
results: ['ValueError', 'D']
Now nothing is lost — you get the ValueError and D’s result, and you inspect each. The catch: it’s on you to loop through and check which entries are exceptions, and it’s easy to forget and treat an exception object as data.
asyncio.create_task — fire it, then await it
create_task schedules a coroutine to run right away, concurrently, and hands you a Task handle. This is the building block: you create several tasks (they start running), then await them when you need the results.
async def main():
    t1 = asyncio.create_task(timed("A", 0.1))    # starts NOW
    t2 = asyncio.create_task(timed("B", 0.1))    # starts NOW, alongside t1
    # ... other work could happen here while both run ...
    print(await t1, await t2)                    # ~0.1s total, not 0.2s

asyncio.run(main())
A B
⚠️ You must keep a reference to the task. The loop holds only a weak reference, so a task you create but don’t store can be garbage-collected mid-flight and vanish. Store it in a variable or a set. And a bare create_task whose exception you never await will surface only as a noisy “Task exception was never retrieved” message at shutdown — which is the raw-create_task version of the swallowed-error problem.
A Task is a handle you can inspect and control while it runs:
| Task method | Returns / does | Use for |
|---|---|---|
await task |
The task’s result (or re-raises its exception) | Get the value |
task.result() |
Result if done; ⚠️ raises InvalidStateError if not |
After you know it’s done (e.g. post-TaskGroup) |
task.done() |
bool — has it finished? |
Poll without awaiting |
task.cancel() |
Request cancellation → CancelledError in the task |
Stop it early |
task.cancelled() |
bool — did it end via cancellation? |
Distinguish cancel from error |
task.exception() |
The exception it raised, or None |
Inspect failure without re-raising |
task.add_done_callback(fn) |
Call fn(task) when it finishes |
Fire-and-forget completion hooks |
asyncio.TaskGroup — the modern default (3.11+)
TaskGroup is structured concurrency: a context manager that owns a group of tasks and will not exit until all of them are done. Its failure semantics are the opposite of gather’s, and much safer: if any task raises, every sibling is cancelled, and the errors are re-raised together as an ExceptionGroup (which you catch with except*).
async def main():
    try:
        async with asyncio.TaskGroup() as tg:
            tg.create_task(work("E", 0.1, boom=True))
            tg.create_task(work("F", 0.3))     # gets cancelled — never prints 'finished'
    except* ValueError as eg:
        print("  ExceptionGroup:", eg.exceptions)
    await asyncio.sleep(0.4)
    print("  (F never printed 'finished' — it was cancelled)")

asyncio.run(main())
  ExceptionGroup: (ValueError('E exploded'),)
  (F never printed 'finished' — it was cancelled)
F was cancelled the instant E failed — no orphaned task, no leaked work, no “why did that run later.” That is why TaskGroup is the default you should reach for. Here’s the whole comparison:
gather() |
gather(return_exceptions=True) |
create_task (raw) |
TaskGroup (3.11+) |
|
|---|---|---|---|---|
| Starts tasks | On await | On await | ✅ Immediately | Immediately, inside the block |
| Waits for all | Yes | Yes | Only what you await | ✅ Always, at block exit |
| One task raises | Raises first, others keep running | Never raises; collects all | Task holds its own exception | ✅ Cancels siblings, raises ExceptionGroup |
| Results order | Argument order | Argument order | However you await | Via the task handles |
| Orphaned tasks on error | ⚠️ Yes — leak | No | ⚠️ Easy to leak | ✅ None |
| Catch with | except |
inspect the list | except per task |
except* |
| Use when | Legacy / simple all-succeed | You want every outcome | One-off background task | ✅ Default for concurrent work |
Version note:
TaskGroup,ExceptionGroupand theexcept*syntax all arrived in Python 3.11. On 3.9/3.10 (including the macOS systempython3) you fall back togather. If you’re on 3.11+, preferTaskGroup— it exists precisely becausegather’s leak-on-error behaviour caused real bugs.
One more helper for a different need: when you want to process results as they finish rather than waiting for all of them, use asyncio.as_completed, which yields awaitables in completion order:
async def timed(name, d):
    await asyncio.sleep(d); return name

async def main():
    order = []
    for fut in asyncio.as_completed([timed("slow", 0.2), timed("fast", 0.01), timed("mid", 0.1)]):
        order.append(await fut)
    print("as_completed (by finish time):", order)

asyncio.run(main())
as_completed (by finish time): ['fast', 'mid', 'slow']
The four “wait for many” tools, side by side:
| Helper | Order results arrive | Errors | Reach for it when |
|---|---|---|---|
TaskGroup (3.11+) |
All at once, at block exit | ✅ Cancels siblings → ExceptionGroup |
✅ Default — atomic, structured |
gather(*aws) |
All at once, argument order | First raises; siblings leak | You need results indexed to inputs |
as_completed(aws) |
As each finishes | Per-future, as you await it | ✅ Stream results; act on the fastest first |
asyncio.wait(aws, ...) |
Sets of done/pending |
Never raises — inspect each | return_when=FIRST_COMPLETED, low-level control |
The cardinal sin: blocking the loop
This is the one that turns a “concurrent” program back into a sequential one without any error to warn you. The rule: inside a coroutine, never call a function that blocks. A blocking call — time.sleep, a synchronous DB driver, requests.get, a heavy CPU loop, a big hashlib digest — does not await, so it never yields the thread, so the single event loop is frozen solid until it returns. Every other task waits, not because it’s their turn to wait, but because the loop itself is stuck.
Watch the difference between the blocking time.sleep and the cooperative asyncio.sleep, running what looks like the same “three concurrent half-second waits”:
import asyncio, time

async def main():
    # Version 1: three coroutines that call the BLOCKING time.sleep
    async def blocking(n):
        time.sleep(0.5)                 # ❌ freezes the whole loop
    t = time.perf_counter()
    await asyncio.gather(blocking(1), blocking(2), blocking(3))
    print(f"3x time.sleep(0.5)  : {time.perf_counter()-t:.2f}s  <- SERIAL, loop frozen")

    # Version 2: three coroutines that AWAIT asyncio.sleep
    async def cooperative(n):
        await asyncio.sleep(0.5)        # ✅ yields — others run meanwhile
    t = time.perf_counter()
    await asyncio.gather(cooperative(1), cooperative(2), cooperative(3))
    print(f"3x asyncio.sleep(0.5): {time.perf_counter()-t:.2f}s  <- overlapped")

asyncio.run(main())
3x time.sleep(0.5)  : 1.51s  <- SERIAL, loop frozen
3x asyncio.sleep(0.5): 0.50s  <- overlapped
Same shape, gather in both, but time.sleep took 1.51s (three half-seconds back to back — no concurrency at all) while asyncio.sleep took 0.50s (all three overlapped). The time.sleep version looks async and runs serial. This is the bug, and on a real server it manifests as “our async service handles one request at a time under load” — because someone put a synchronous call in a hot coroutine.
The offenders are the everyday functions you reach for without thinking. Each has an async-safe replacement:
| Blocking call (❌ in a coroutine) | Async-safe replacement | Notes |
|---|---|---|
time.sleep(s) |
await asyncio.sleep(s) |
The textbook example |
requests.get(url) |
await httpx.AsyncClient().get(url) |
Or aiohttp |
open(f).read() / file I/O |
await asyncio.to_thread(path.read_text) |
No async file I/O in the stdlib; thread it |
| A synchronous DB driver | An async driver (asyncpg, aiosqlite) or to_thread |
Sync drivers block hard |
A big json.loads / hashlib / parse |
await asyncio.to_thread(fn, data) |
CPU work — thread (or process) it |
subprocess.run(...) |
await asyncio.create_subprocess_exec(...) |
asyncio has native subprocess support |
input() at a prompt |
await asyncio.to_thread(input) |
stdin blocks the loop otherwise |
The fix: push blocking work off the loop
Sometimes you can’t avoid a blocking call — a library has no async version, or you genuinely have CPU work. The fix is to run it somewhere other than the loop’s thread and await the result. asyncio.to_thread (3.9+) sends the call to a background thread pool and gives you back an awaitable:
import asyncio, time

def blocking_io(secs):
    time.sleep(secs)                    # a stand-in for a sync DB / hashlib / requests call
    return "done"

async def main():
    t = time.perf_counter()
    await asyncio.gather(
        asyncio.to_thread(blocking_io, 0.5),
        asyncio.to_thread(blocking_io, 0.5),
        asyncio.to_thread(blocking_io, 0.5),
    )
    print(f"3x to_thread(time.sleep, 0.5): {time.perf_counter()-t:.2f}s  <- loop stayed free")

asyncio.run(main())
3x to_thread(time.sleep, 0.5): 0.51s <- loop stayed free
Back to 0.51s: the three blocking sleeps ran in parallel threads while the event loop stayed free to do other things. Which tool depends on why the call blocks:
| The blocking work is… | Use | Why | ⚠️ Watch out |
|---|---|---|---|
I/O-bound & synchronous (sync DB, requests, file read) |
asyncio.to_thread(fn, *args) |
Threads release the GIL during I/O, so they overlap | Thread pool default is limited; don’t fire 10k |
| Same, older Python / need a specific executor | loop.run_in_executor(None, fn, *args) |
The pre-3.9 form; to_thread wraps it |
More verbose; None = default thread pool |
| CPU-bound (parse, compress, crunch numbers) | run_in_executor(ProcessPoolExecutor(), fn, …) |
A separate process sidesteps the GIL for real parallelism | Args/results must be picklable; process startup cost |
| Truly unavoidable and rare | Accept the block, keep it tiny | Not everything needs solving | A 1ms block is fine; a 500ms one is not |
to_thread and run_in_executor do the same job — to_thread is just the modern, readable wrapper:
r1 = await asyncio.to_thread(blocking_io, 0.01)             # modern (3.9+)
r2 = await loop.run_in_executor(None, blocking_io, 0.01)    # older, identical effect
# both -> 'done'
⚠️ Threads help I/O-bound blocking because the GIL is released while waiting on the OS. They do not parallelise CPU-bound Python — for that you need processes, which is the subject of the next section’s harder truth.
When async wins — and when it does nothing
Time for the measurement the whole first half has been promising. We fetch 100 URLs from a local server where each request takes 50ms of I/O, once sequentially and once concurrently with a TaskGroup. The stub server is itself written with asyncio (one loop, no threads) and runs in a background thread — that matters, and we’ll come back to why right after the result.
import asyncio, time, threading
import httpx

# A tiny ASYNC stub server (one loop, no threads) so the SERVER isn't the bottleneck.
async def handle(reader, writer):
    await reader.read(1024)                                 # read + ignore the request
    await asyncio.sleep(0.05)                               # 50ms of pretend I/O
    body = b'{"ok": true}'
    writer.write(b"HTTP/1.1 200 OK\r\nContent-Length: %d\r\nConnection: close\r\n\r\n%s"
                 % (len(body), body))
    await writer.drain(); writer.close()

def run_server():                                          # its own loop, in a bg thread
    loop = asyncio.new_event_loop(); asyncio.set_event_loop(loop)
    async def serve():
        srv = await asyncio.start_server(handle, "127.0.0.1", 8790)
        async with srv:
            await srv.serve_forever()
    loop.run_until_complete(serve())

BASE, N = "http://127.0.0.1:8790", 100

def fetch_sequential():
    t = time.perf_counter()
    with httpx.Client(timeout=30) as c:
        for i in range(N):
            c.get(f"{BASE}/{i}")                           # one at a time
    return time.perf_counter() - t

async def fetch_concurrent():
    t = time.perf_counter()
    async with httpx.AsyncClient(timeout=30, limits=httpx.Limits(max_connections=100)) as c:
        async with asyncio.TaskGroup() as tg:
            for i in range(N):
                tg.create_task(c.get(f"{BASE}/{i}"))       # all in flight together
    return time.perf_counter() - t

async def main():
    threading.Thread(target=run_server, daemon=True).start()
    time.sleep(0.3)
    seq = fetch_sequential()
    con = await fetch_concurrent()
    print(f"sequential : {seq:.2f}s")
    print(f"concurrent : {con:.2f}s")
    print(f"speedup    : {seq/con:.0f}x")

asyncio.run(main())
sequential : 5.87s
concurrent : 0.30s
speedup    : 20x
20x, for free, because the CPU was idle the whole time anyway. Sequentially, 100 requests waited 50ms each in series: nearly 6 seconds of doing nothing. Concurrently, all 100 waits overlapped on one thread, and the batch finished in about the time of the slowest request plus overhead. This is the canonical async win, and the more you have that’s waiting — sockets, HTTP calls, database round-trips — the bigger it gets. ⚠️ Trust the shape, not the digits: across runs this measured 18–21x on a loaded machine; on a real network with real latency the ratio is often larger still.
Why an async server, not a simpler threaded one? Because your concurrency is only as good as what you’re calling. A threaded http.server spawning 100 OS threads to serve this burst becomes its own bottleneck — thread-scheduling and GIL contention drag the “concurrent” run back toward sequential, and you’d measure a disappointing 2–3x that says more about the toy server than about async. The async stub handles 100 overlapping waits on one loop for almost nothing, so the number reflects the client’s concurrency, which is what we’re actually measuring. (That the server benefits from the same trick is the whole lesson, one level down.)
Now the humbling half. Swap the waiting for computing — a tight numeric loop — and run four of them “concurrently” with gather:
import asyncio, time, math

def cpu_heavy(n):
    total = 0.0
    for i in range(1, n):
        total += math.sqrt(i) * math.sin(i)               # real CPU work, no I/O
    return total

async def main():
    # sequential
    t = time.perf_counter()
    for _ in range(4):
        cpu_heavy(1_000_000)
    seq = time.perf_counter() - t
    # 'concurrent' with gather
    async def wrap(n):
        return cpu_heavy(n)                                # never awaits — never yields
    t = time.perf_counter()
    await asyncio.gather(*[wrap(1_000_000) for _ in range(4)])
    con = time.perf_counter() - t
    print(f"sequential     : {seq:.2f}s")
    print(f"'async' gather : {con:.2f}s")
    print(f"speedup        : {seq/con:.2f}x")

asyncio.run(main())
sequential     : 0.31s
'async' gather : 0.31s
speedup        : 1.00x
Identical. 1.00x. Async did absolutely nothing. Each cpu_heavy call has no await inside it, so it runs start-to-finish before the next one gets a turn — the gather is theatre. There is one thread, the work is CPU, and one thread can only compute one thing at a time. This is the single most important limit to internalise: async is concurrency for waiting, not parallelism for working. For CPU-bound work you need multiple processes, and that’s a different tool.
The concurrency trilemma: async vs threads vs processes
Three tools, three different jobs. The honest decision table, with the numbers this lesson measured on an 8-core machine (yours will differ; the pattern won’t):
| asyncio | Threads | Processes | |
|---|---|---|---|
| Parallelism | ❌ One thread, concurrency only | ❌ GIL serialises Python bytecode | ✅ True — separate interpreters |
| Best for | I/O-bound at scale (thousands of sockets) | I/O-bound with blocking libraries | CPU-bound (crunching, parsing) |
| I/O speedup (measured) | ✅ 20x (100 waits, 1 thread) | ✅ Big too — GIL frees on I/O | ✅ Works, but heavyweight |
| CPU speedup (measured) | ❌ 1.00x | ❌ ~1x (GIL) | ✅ 1.9x on 4 workers |
| Cost per unit | Cheapest — a Python object; 10k+ fine | An OS thread — ~MBs of stack; ~hundreds | A whole process — MBs + startup |
| Shared state | Safe between awaits; no locks needed |
⚠️ Needs locks — real races | Isolated; pass via pickling / queues |
| The catch | ⚠️ One blocking call freezes all | ⚠️ Races, GIL ceiling on CPU | ⚠️ Startup + pickling overhead |
| Python API | asyncio, async/await |
threading, ThreadPoolExecutor |
multiprocessing, ProcessPoolExecutor |
Two measured facts anchor that table honestly. Processes really do parallelise CPU work — the same four cpu_heavy calls that async left at 1.00x dropped from 2.70s to 1.39s (1.9x) across a 4-worker ProcessPoolExecutor. But the parallelism isn’t free: ⚠️ when the per-task work is small, process startup and argument-pickling overhead can make a ProcessPoolExecutor slower than sequential — in one run of tiny tasks I measured 0.9x, an actual slowdown. Processes pay off only when each task’s compute dwarfs the ~tens-of-milliseconds it costs to ship it to another process.
The rule of thumb that falls out: waiting on many things → asyncio (cheapest, scales furthest); a few blocking calls you can’t make async → threads (to_thread); heavy computation → processes. And you can combine them — an async server that offloads the occasional CPU job to a process pool is a common, healthy shape.
Queues, timeouts and cancellation
Three more pieces turn the toys above into real programs: a way to hand work between tasks, a way to give up on something slow, and a way to stop a task cleanly.
asyncio.Queue — a pipeline between coroutines
An asyncio.Queue is the async-native producer/consumer buffer: await q.put(x) blocks (cooperatively) when the queue is full, await q.get() blocks when it’s empty, and neither ever freezes the loop. It’s how you fan work out to a pool of workers:
import asyncio

async def producer(q, n):
    for i in range(n):
        await q.put(i)
    for _ in range(3):
        await q.put(None)                 # one sentinel per worker to tell it to stop

async def worker(name, q, done):
    while True:
        item = await q.get()
        if item is None:
            q.task_done(); break
        await asyncio.sleep(0.01)         # "process" the item
        done.append(item)
        q.task_done()

async def main():
    q, done = asyncio.Queue(maxsize=5), []
    async with asyncio.TaskGroup() as tg:
        tg.create_task(producer(q, 9))
        for w in ("w1", "w2", "w3"):
            tg.create_task(worker(w, q, done))
    print(f"9 items drained by 3 workers -> {len(done)} processed")

asyncio.run(main())
9 items drained by 3 workers -> 9 processed
The maxsize=5 gives you backpressure — a fast producer can’t run away and buffer a million items in memory, because put blocks once the queue is full. That single argument is often the difference between a streaming pipeline and an out-of-memory crash.
Queue is one of a family of async-native coordination primitives. They mirror the threading ones by name but are not interchangeable — an asyncio.Lock is awaited and never blocks the loop, a threading.Lock would freeze it:
| Primitive | Await to | Use for | ⚠️ Note |
|---|---|---|---|
asyncio.Queue(maxsize=N) |
q.get() / q.put(x) |
Producer/consumer with backpressure | The workhorse |
asyncio.Semaphore(k) |
async with sem: |
Cap concurrency to k (politeness — see the lab) |
✅ Rate-limiting fan-out |
asyncio.Lock() |
async with lock: |
Guard a critical section across awaits |
Rarely needed — no races within a run |
asyncio.Event() |
await ev.wait() / ev.set() |
One task signals many “go now” | Broadcast, not a counter |
asyncio.Condition() |
await cond.wait() |
Wait for a predicate, then re-check | Advanced coordination |
⚠️ Never use the threading versions (threading.Lock, queue.Queue) inside a coroutine — their blocking acquire/get freezes the whole loop. Reach for the asyncio. ones, which suspend cooperatively.
Timeouts — asyncio.timeout (3.11+) and wait_for
Never let an await wait forever. Two APIs bound it. asyncio.timeout (3.11+) is a context manager wrapping a whole block; asyncio.wait_for wraps a single awaitable. Both cancel the operation and raise TimeoutError when the clock runs out:
import asyncio

async def slow_op():
    await asyncio.sleep(5)
    return "never"

async def main():
    try:
        async with asyncio.timeout(0.2):          # 3.11+: deadline for the block
            await slow_op()
    except TimeoutError:
        print("asyncio.timeout(0.2) fired -> TimeoutError")

    try:
        await asyncio.wait_for(slow_op(), timeout=0.2)   # any version: one awaitable
    except TimeoutError:
        print("wait_for(timeout=0.2) fired -> TimeoutError")

asyncio.run(main())
asyncio.timeout(0.2) fired -> TimeoutError
wait_for(timeout=0.2) fired -> TimeoutError
Version note: since 3.11,
asyncio.TimeoutErroris a plain alias of the builtinTimeoutError(asyncio.TimeoutError is TimeoutError→True), soexcept TimeoutErrorcatches both. On older code you’ll seeexcept asyncio.TimeoutError— still fine. Preferasyncio.timeout()for anything spanning more than one call; it reads better and nests correctly.
| API | Wraps | Added | Raises | Use for |
|---|---|---|---|---|
async with asyncio.timeout(s) |
A whole block | 3.11 | TimeoutError |
✅ The modern default; multiple awaits |
async with asyncio.timeout_at(when) |
A block, absolute deadline | 3.11 | TimeoutError |
A fixed wall-clock deadline |
await asyncio.wait_for(aw, timeout=s) |
One awaitable | old | TimeoutError |
A single call; pre-3.11 code |
Cancellation and CancelledError
Cancelling a task doesn’t kill it dead — it throws asyncio.CancelledError into it at its current await, giving the task a chance to clean up. You handle it like any exception, but with one iron rule:
import asyncio

async def cancellable():
    try:
        await asyncio.sleep(10)
    except asyncio.CancelledError:
        print("task saw CancelledError, cleaning up...")
        raise                              # ⚠️ MUST re-raise — never swallow it

async def main():
    task = asyncio.create_task(cancellable())
    await asyncio.sleep(0.05)
    task.cancel()                          # request cancellation
    try:
        await task
    except asyncio.CancelledError:
        print("await task re-raised CancelledError, as expected")

asyncio.run(main())
task saw CancelledError, cleaning up...
await task re-raised CancelledError, as expected
⚠️ The iron rule: catch CancelledError to clean up, then raise it again. If you swallow it — except asyncio.CancelledError: pass — you have told a lie: the task was asked to stop, cleaned up, and then kept running as if nothing happened. That breaks TaskGroup (which cancels siblings on error and relies on them actually stopping), breaks timeouts (the thing you timed out on doesn’t die), and produces tasks that refuse to shut down. In 3.8+ CancelledError inherits from BaseException, not Exception, specifically so a blanket except Exception: won’t catch it by accident — don’t defeat that protection with an explicit catch-and-pass.
Async HTTP clients, briefly
You’ve been using httpx.AsyncClient already. It’s the async-capable sibling of requests, with a nearly identical API — if you know requests, you know this:
import asyncio, httpx

async def main():
    async with httpx.AsyncClient(timeout=10) as client:
        r = await client.get("http://127.0.0.1:8791/hello")     # note: await
        print(r.status_code, r.json())

asyncio.run(main())
| Library | Sync or async | Notes |
|---|---|---|
httpx.AsyncClient |
✅ Async | requests-like API, HTTP/2, sync Client too. ✅ Easiest migration |
aiohttp |
✅ Async | Mature, battle-tested; also ships a server. Slightly lower-level API |
requests |
❌ Sync only | ⚠️ Calling it in a coroutine blocks the loop — wrap in to_thread if you must |
⚠️ The trap that ties this section back to the cardinal sin: dropping a synchronous requests.get() into a coroutine is the number-one way to accidentally freeze an async server. If a code path is async, its HTTP calls must be async too (or offloaded with to_thread). Everything you learned about timeouts, retries and raise_for_status in the requests lesson applies here unchanged — async changes how you wait, not what a good HTTP client does.
Measure before you optimise
Now Part B, and it opens with the only performance rule that is never wrong: measure first. Not because measuring is virtuous, but because human intuition about “the slow part” is genuinely unreliable — the bottleneck is routinely somewhere you’d never look, and the function you’re sure is slow is often 2% of the runtime. Optimise without measuring and you’ll spend an afternoon making the wrong function 10x faster, add complexity and bugs, and move the total runtime by nothing. Worse, you’ll believe you helped.
There are three questions and a tool for each. How long does this tiny snippet take? → timeit. Which function eats the runtime? → cProfile. Where does the memory go? → tracemalloc. Start at the top only when you already know the line; otherwise profile the whole thing and let it point. Profiling answers where the time goes; when the problem is that the code does the wrong thing rather than the slow thing, that’s a job for the debugger and structured logs — see Logging & Debugging.
timeit — micro-benchmarks done right
Timing a fast operation by hand with time.perf_counter() is a trap: it’s dominated by noise, one-off import costs, and whatever else the OS was doing. timeit runs the snippet many times, reports the best, and disables the garbage collector so runs don’t interfere. The clean way is the command line:
python3 -m timeit -s "data = list(range(10000)); target = 9999" "target in data"
python3 -m timeit -s "data = set(range(10000));  target = 9999" "target in data"
5000 loops, best of 5: 45.5 usec per loop
20000000 loops, best of 5: 14.7 nsec per loop
The -s setup runs once; the last argument runs in the timed loop. And the result is a lesson in itself: membership in a 10,000-element list took 45.5 microseconds (it scans, worst case all 10,000 elements); the same test on a set took 14.7 nanoseconds — about 3,000x faster — because a set is a hash table and membership is O(1). No micro-tuning on earth beats picking the right data structure, which is the whole point of Algorithms: search, sort & complexity.
timeit form |
Example | Use for |
|---|---|---|
| CLI | python -m timeit -s "setup" "stmt" |
✅ Quick one-liners; auto-picks loop count |
timeit.timeit(stmt, setup, number=N) |
Returns total seconds for N runs | In a script |
timeit.repeat(..., repeat=5) |
List of timings — take the min | ✅ Report the min, not the mean (noise is one-sided) |
%timeit (Jupyter/IPython) |
%timeit target in data |
✅ Interactive exploration |
⚠️ Report the minimum, not the average. A slow run means something else stole the CPU; it tells you nothing about your code. The fastest run is the one with the least interference — the closest to your code’s true cost.
cProfile + pstats: find the hot function
timeit is for code you can already point at. cProfile is for when you can’t — it runs your whole program and records how long was spent in every function, so the bottleneck reveals itself. Here’s a deliberately slow report builder. Where does its time actually go?
# slow_report.py
"""A deliberately slow report. Where is the time REALLY going? Let cProfile answer."""

def is_prime(n):
    if n < 2:
        return False
    for d in range(2, n):              # O(n) trial division
        if n % d == 0:
            return False
    return True

def count_primes(limit):
    return sum(1 for n in range(limit) if is_prime(n))

def build_report(limit):
    return {"limit": limit, "primes": count_primes(limit)}

if __name__ == "__main__":
    print(build_report(30000))
Run it under cProfile from the command line, sorted by cumulative time:
python3 -m cProfile -s cumtime slow_report.py
{'limit': 30000, 'primes': 3245}
         33253 function calls in 1.322 seconds

   Ordered by: cumulative time

   ncalls  tottime  percall  cumtime  percall filename:lineno(function)
        1    0.000    0.000    1.322    1.322 {built-in method builtins.exec}
        1    0.000    0.000    1.322    1.322 slow_report.py:1(<module>)
        1    0.000    0.000    1.322    1.322 slow_report.py:17(build_report)
        1    0.000    0.000    1.322    1.322 slow_report.py:13(count_primes)
        1    0.000    0.000    1.322    1.322 {built-in method builtins.sum}
     3246    0.003    0.000    1.321    0.000 slow_report.py:14(<genexpr>)
    30000    1.319    0.000    1.319    0.000 slow_report.py:4(is_prime)
        1    0.000    0.000    0.000    0.000 {method 'disable' of ...}
Read that bottom-heavy: is_prime was called 30,000 times and its tottime is 1.319 seconds — out of 1.322 total. That’s it. That one function is essentially the entire runtime; everything else rounds to zero. You didn’t guess, you didn’t stare at the code hoping — the profile handed you the culprit. The two columns that matter:
| Column | Means | Read it to find |
|---|---|---|
ncalls |
How many times the function was called | Surprising call counts (called 30k times?!) |
tottime |
Time in this function itself, excluding sub-calls | ✅ The hot function — where CPU actually burns |
cumtime |
Time in this function plus everything it calls | ✅ The expensive path — which high-level call is costly |
percall |
tottime/ncalls (or cumtime/ncalls) |
Cost of a single call |
The mental model: sort by cumtime to see which top-level operation is expensive; sort by tottime to see which leaf function to actually fix. Here build_report, count_primes and sum all show cumtime 1.322 — they’re “expensive” only because they call is_prime. The tottime column cuts through it: the real work, the thing to change, is is_prime.
You can also profile programmatically and post-process with pstats — useful when you want just the top offenders:
import cProfile, pstats, io
pr = cProfile.Profile()
pr.enable()
build_report(30000)
pr.disable()
s = io.StringIO()
pstats.Stats(pr, stream=s).sort_stats("tottime").print_stats(5)
print(s.getvalue())
pstats sort key |
Orders by |
|---|---|
"tottime" |
✅ Time in the function itself — find the leaf to optimise |
"cumulative" |
✅ Time including sub-calls — find the expensive path |
"ncalls" |
Call count — find something called too often |
"nfl" |
name/file/line — stable diff between runs |
⚠️ cProfile adds per-call overhead, so absolute times under it run slower than reality (function-heavy code inflates most). Use it to find relative hot spots and to compare before/after — never quote a cProfile millisecond as your program’s real speed. For that, timeit the fixed function on its own.
Beyond the standard library
cProfile is function-level and it’s built in, which makes it the right first reach. When it isn’t enough:
| Tool | Adds | When you reach for it |
|---|---|---|
cProfile + pstats |
Per-function time, no install | ✅ Always start here |
line_profiler (@profile) |
Time per line inside one function | The hot function is big and you need the exact line |
py-spy |
Sampling profiler; attaches to a running process, no code change | ✅ A prod process is hot right now and you can’t restart it |
scalene |
CPU and memory, line-level, low overhead, separates Python vs native | A thorough modern audit in one tool |
tracemalloc |
Memory allocations by line (stdlib) | ✅ Memory growth, not CPU |
py-spy deserves the callout: because it samples a running process from the outside, it’s the tool for “the server is pegged at 100% CPU and I have no idea why” — you attach, watch, and detach, with no restart and near-zero overhead on the target. For local debugging of a known-slow function, cProfile then line_profiler is the usual path.
tracemalloc: where the memory goes
Slow isn’t always about time — sometimes a process quietly balloons until the OS kills it. tracemalloc (standard library) records where allocations happen, so you can point at the line that’s eating RAM. The pattern is: start it, take a snapshot, do the work, take another, and compare.
import tracemalloc

def build_list(n):
    return [i * i for i in range(n)]          # materialises ALL n ints at once

tracemalloc.start()
snap1 = tracemalloc.take_snapshot()
data = build_list(1_000_000)
snap2 = tracemalloc.take_snapshot()

current, peak = tracemalloc.get_traced_memory()
print(f"peak traced memory: {peak/1e6:.1f} MB")
for stat in snap2.compare_to(snap1, "lineno")[:1]:
    print(" ", stat)
tracemalloc.stop()
peak traced memory: 40.4 MB
  slow_report.py:4: size=38.6 MiB (+38.6 MiB), count=999984 (+999984), average=40 B
(Path trimmed for readability.) The comparison points straight at the list comprehension line: 38.6 MiB in 999,984 objects, each averaging 40 bytes (a Python int is chunky). Now the payoff — the same computation with a generator, which streams one value at a time instead of materialising the list:
import tracemalloc
tracemalloc.start()
gen = (i * i for i in range(1_000_000))       # lazy — nothing materialised
total = sum(gen)                              # streamed through
_, peak = tracemalloc.get_traced_memory()
print(f"generator peak: {peak/1e6:.3f} MB  (vs 40.4 MB for the list)")
tracemalloc.stop()
generator peak: 0.000 MB (vs 40.4 MB for the list)
Forty megabytes to 0.000 — same answer, because the generator never holds more than one value at a time. That’s the memory version of the lazy-pipeline story from Iterators & Generators, and tracemalloc is how you prove the win instead of asserting it.
⚠️ tracemalloc only tracks allocations made after tracemalloc.start(). Start it too late and you’ll see a suspiciously empty snapshot and conclude, wrongly, that nothing allocates — a real gotcha in the troubleshooting table below.
The optimisation levers, in priority order
Once the profile names the hot spot, you have a menu — and the order matters enormously, because the levers differ in payoff by orders of magnitude. Work top to bottom and stop when you’re fast enough.
Lever 1 (biggest): a better algorithm or data structure
This is where the real wins live. Our profile fingered is_prime, which trial-divides all the way up to n — O(n) per number. A prime has no factor above its square root, so we only need to check up to √n, and only odd divisors. Same answer, radically less work:
import time

def is_prime_slow(n):
    if n < 2: return False
    for d in range(2, n):                     # O(n)
        if n % d == 0: return False
    return True

def is_prime_fast(n):
    if n < 2: return False
    if n % 2 == 0: return n == 2
    d = 3
    while d * d <= n:                         # O(sqrt n), odd divisors only
        if n % d == 0: return False
        d += 2
    return True

def count(fn, limit):
    return sum(1 for n in range(limit) if fn(n))

t = time.perf_counter(); a = count(is_prime_slow, 30000); slow = time.perf_counter() - t
t = time.perf_counter(); b = count(is_prime_fast, 30000); fast = time.perf_counter() - t
assert a == b                                 # SAME result — correctness preserved
print(f"{a} primes below 30000")
print(f"  O(n)      : {slow:.3f}s")
print(f"  O(sqrt n) : {fast:.4f}s")
print(f"  speedup   : {slow/fast:.0f}x")
3245 primes below 30000
  O(n)      : 1.410s
  O(sqrt n) : 0.0112s
  speedup   : 126x
126x — and not one clever trick, just a better bound on the loop. The assert a == b is non-negotiable: an optimisation that changes the answer isn’t an optimisation, it’s a bug, and the assert catches it instantly. No amount of the lower-priority levers below would have gotten you a fraction of this. Always fix the algorithm first. (Complexity, O(n) vs O(√n) vs O(1), is the whole story in the algorithms lesson.)
Levers 2–4: caching, vectorisation, and micro-tuning
The remaining levers, measured together, in descending payoff:
import time, math
from functools import lru_cache
import numpy as np

# Lever 2: cache repeated work
def slow_call(n): time.sleep(0.001); return n * n
@lru_cache(maxsize=None)
def cached_call(n): time.sleep(0.001); return n * n

inputs = [i % 50 for i in range(500)]         # 500 calls, only 50 distinct -> repeats
t = time.perf_counter(); [slow_call(x) for x in inputs];   unc = time.perf_counter()-t
t = time.perf_counter(); [cached_call(x) for x in inputs]; cac = time.perf_counter()-t
print(f"Lever 2 lru_cache : {unc:.3f}s -> {cac:.3f}s  ({unc/cac:.0f}x)  {cached_call.cache_info()}")

# Lever 3: vectorise with numpy (push the loop into C)
def py_sq(n):  return sum(i*i for i in range(n))
def np_sq(n):  a = np.arange(n, dtype=np.int64); return int((a*a).sum())
t = time.perf_counter(); py_sq(2_000_000); py = time.perf_counter()-t
t = time.perf_counter(); np_sq(2_000_000); npt = time.perf_counter()-t
print(f"Lever 3 numpy     : {py:.3f}s -> {npt:.4f}s  ({py/npt:.0f}x)")

# Lever 4: local-variable binding (micro — only in a proven hot loop)
def attr_lookup():
    for i in range(2_000_000): math.sqrt(i)   # resolve math.sqrt every iteration
def local_bind():
    sqrt = math.sqrt                          # bind once
    for i in range(2_000_000): sqrt(i)
t = time.perf_counter(); attr_lookup(); g = time.perf_counter()-t
t = time.perf_counter(); local_bind(); l = time.perf_counter()-t
print(f"Lever 4 local-bind: {g:.3f}s -> {l:.3f}s  ({(g-l)/g*100:.0f}% less)")
Lever 2 lru_cache : 0.641s -> 0.063s  (10x)  CacheInfo(hits=450, misses=50, maxsize=None, currsize=50)
Lever 3 numpy     : 0.077s -> 0.0037s  (21x)
Lever 4 local-bind: 0.071s -> 0.065s  (8% less)
Notice the descending scale, which is exactly why priority order matters:
| Lever | Measured here | When it applies | Watch out |
|---|---|---|---|
| 1. Algorithm / data structure | ✅ 126x | Almost always the biggest win; O(n)→O(√n), list→set |
Must preserve the result — assert it |
2. Caching (functools.lru_cache) |
10x | Pure function, repeated inputs (450 hits / 50 misses here) | ⚠️ Only for pure fns; unbounded cache = memory leak |
3. Vectorisation (numpy) |
21x | Bulk numeric work over arrays | Adds a dependency; not for scalar/branchy logic |
| 4. Avoiding repeated work / local binding | ~8% | Proven hot loops only | ⚠️ A rounding error unless the loop is genuinely hot |
Lever 4 is the honest anticlimax: local-variable binding, the kind of tip that fills “Python performance” listicles, bought 8%. It’s real (a local lookup is a faster bytecode than resolving math.sqrt each iteration), but it’s a rounding error next to fixing the algorithm — and it makes code less readable. Reach for it only after a profile proves you’re in a loop hot enough to care, never as a default habit.
The trap: optimising the wrong thing
The whole of Part B exists to prevent one specific waste: pouring effort into a function that isn’t the bottleneck. If is_prime is 99.8% of your runtime, then making the other 0.2% twice as fast — however clever the trick — improves the total by 0.1%, which no user will ever perceive. You added complexity and risk for nothing. There are two flavours of this mistake and the profile guards against both:
- Optimising a cold path. The function feels slow (it’s gnarly, it’s long) but the profile shows it runs once and costs 3ms. Leave it; readable beats fast for code that isn’t hot.
- Optimising a warmed path you measured cold (or vice versa). The first call pays import, cache-fill and JIT-of-the-OS-file-cache costs; steady-state calls don’t. ⚠️ Measure the state you actually run in — profile a cold path if it runs once, a warm one if it runs in a loop — or your numbers describe a situation that never happens in production.
The discipline is dull and it is undefeated: profile, fix the top line, re-profile, stop when it’s fast enough. Fast enough is a real target — past it, you’re spending complexity you’ll pay interest on forever.
Hands-on lab
You’ll build a small async fetcher that pulls N URLs concurrently with a TaskGroup and a Semaphore, measure it against the sequential version, reproduce the blocking-call bug and fix it with to_thread, then profile a slow function and make it measurably faster. Everything runs locally — no account, no paid API.
Step 1 — Set up
mkdir async-lab && cd async-lab
python3 -m venv .venv
source .venv/bin/activate            # Windows: .venv\Scripts\activate
python -m pip install httpx
⚠️ Needs Python 3.11+ for TaskGroup and asyncio.timeout. Check with python --version; the macOS system python3 is 3.9 and will AttributeError on asyncio.TaskGroup.
What just happened: an isolated environment with httpx (the only outside dependency; everything else is standard library).
Step 2 — A local server that’s slow on purpose
# server.py
"""A tiny ASYNC stub API — one event loop, no threads, so it handles high
concurrency cheaply and stays a fair stand-in for a fast remote service."""
import asyncio

async def handle(reader, writer):
    await reader.read(1024)                       # read + ignore the request
    await asyncio.sleep(0.05)                     # 50 ms of pretend I/O, cooperatively
    body = b'{"ok": true}'
    writer.write(
        b"HTTP/1.1 200 OK\r\n"
        b"Content-Type: application/json\r\n"
        b"Content-Length: %d\r\n"
        b"Connection: close\r\n\r\n%s" % (len(body), body)
    )
    await writer.drain()
    writer.close()

async def main():
    srv = await asyncio.start_server(handle, "127.0.0.1", 8791)
    print("stub API on http://127.0.0.1:8791  (Ctrl-C to stop)")
    async with srv:
        await srv.serve_forever()

if __name__ == "__main__":
    asyncio.run(main())
Run it in a second terminal (same venv): python server.py.
What just happened: a deterministic slow API. It’s written with asyncio on purpose — a threaded http.server spawning an OS thread per request becomes its own bottleneck under a burst of 100, dragging the “concurrent” run back toward sequential and giving you a misleading number. The async stub serves the whole burst on one loop, so what you measure is the client’s concurrency, not the server’s limits.
Step 3 — Sequential vs concurrent, measured
# fetch.py
import asyncio, time, httpx

BASE, N, CONCURRENCY = "http://127.0.0.1:8791", 100, 20

def fetch_sequential():
    t = time.perf_counter()
    with httpx.Client(timeout=30) as client:
        for i in range(N):
            client.get(f"{BASE}/item/{i}").raise_for_status()
    return time.perf_counter() - t

async def fetch_concurrent():
    sem = asyncio.Semaphore(CONCURRENCY)          # politeness: cap in-flight requests
    limits = httpx.Limits(max_connections=CONCURRENCY)

    async def one(client, i):
        async with sem:                           # never more than CONCURRENCY at once
            r = await client.get(f"{BASE}/item/{i}")
            r.raise_for_status()
            return r.json()

    t = time.perf_counter()
    async with httpx.AsyncClient(timeout=30, limits=limits) as client:
        async with asyncio.TaskGroup() as tg:     # structured: all succeed or all cancel
            tasks = [tg.create_task(one(client, i)) for i in range(N)]
    results = [t.result() for t in tasks]
    return time.perf_counter() - t, len(results)

def main():
    seq = fetch_sequential()
    con, got = asyncio.run(fetch_concurrent())
    print(f"{N} requests, 50ms each, concurrency={CONCURRENCY}")
    print(f"  sequential : {seq:.2f}s")
    print(f"  concurrent : {con:.2f}s  ({got} results)")
    print(f"  speedup    : {seq/con:.0f}x")

if __name__ == "__main__":
    main()
100 requests, 50ms each, concurrency=20
  sequential : 5.97s
  concurrent : 0.51s  (100 results)
  speedup    : 12x
What just happened: 100 sequential 50ms waits took 5.97s; concurrently, capped at 20 in flight, they took 0.51s — 12x. The Semaphore is the politeness knob: without the cap you’d fire all 100 at once (faster still, but rude to a real API and a good way to get rate-limited). With CONCURRENCY=20, at most 20 requests are ever in flight — the floor is ⌈100/20⌉ × 50ms = 250ms plus overhead, which is the ballpark you see. ⚠️ Your ratio will differ with load; the shape — a ~10x collapse — won’t.
Step 4 — Reproduce the blocking bug, then fix it
# blocking.py
import asyncio, time

def blocking_hash(n):                             # a stand-in for a sync CPU/IO call
    time.sleep(0.3)
    return n

async def buggy():
    async def task(n):
        return blocking_hash(n)                   # ❌ blocks the loop — no await
    t = time.perf_counter()
    await asyncio.gather(task(1), task(2), task(3))
    return time.perf_counter() - t

async def fixed():
    async def task(n):
        return await asyncio.to_thread(blocking_hash, n)   # ✅ off the loop
    t = time.perf_counter()
    await asyncio.gather(task(1), task(2), task(3))
    return time.perf_counter() - t

async def main():
    print(f"buggy (blocking in coroutine): {await buggy():.2f}s  <- serial")
    print(f"fixed (to_thread)            : {await fixed():.2f}s  <- overlapped")

asyncio.run(main())
buggy (blocking in coroutine): 0.92s  <- serial
fixed (to_thread)            : 0.32s  <- overlapped
What just happened: the buggy version put a blocking time.sleep inside coroutines, so three “concurrent” tasks ran back-to-back — 3 × 0.3 ≈ 0.9s. Moving the blocking call to asyncio.to_thread freed the loop and the three overlapped into ~0.3s. This is the single most common async performance bug, reproduced and fixed in twenty lines.
Step 5 — Profile a slow function and speed it up
Save the slow_report.py from the profiling section, then:
python -m cProfile -s tottime slow_report.py
Read the report: is_prime dominates tottime. Now swap in the O(√n) version (the is_prime_fast from Lever 1) and time both:
python optimise.py # the before/after script from Lever 1
3245 primes below 30000
  O(n)      : 1.410s
  O(sqrt n) : 0.0112s
  speedup   : 126x
What just happened: you let the profiler point at the hot function instead of guessing, changed the algorithm (not micro-tuned), verified the answer was identical with an assert, and measured a 126x win. That four-step loop — profile, fix the top line, verify correctness, re-measure — is the entire discipline of performance work.
⚠️ Clean up. The server holds a socket; stop it with Ctrl-C in its terminal when you’re done. To remove the whole lab: deactivate && cd .. && rm -rf async-lab (⚠️ rm -rf is irreversible — check you’re in the right directory first).
Common mistakes and troubleshooting
| Symptom / traceback | Cause | Fix |
|---|---|---|
RuntimeWarning: coroutine '...' was never awaited |
Called an async def but forgot await — it never ran |
Add await, or asyncio.create_task(...) to schedule it |
RuntimeError: asyncio.run() cannot be called from a running event loop |
Called asyncio.run() while already inside a coroutine |
You’re in the loop already — just await the coroutine |
| The “async” program runs at sequential speed | A blocking call (time.sleep, requests, sync DB) in a coroutine freezes the loop |
await asyncio.sleep, an async client, or asyncio.to_thread(...) |
RuntimeError: cannot reuse already awaited coroutine |
Awaited the same coroutine object twice | Call the function again for a fresh coroutine |
A create_task result / error just vanished |
No reference kept — task GC’d; or its exception never awaited | Store the task; prefer TaskGroup, which won’t lose it |
| One task fails, others keep running after you handled it | gather() default doesn’t cancel siblings |
Use TaskGroup (cancels on error), or return_exceptions=True |
| Only one of several exceptions surfaces | gather() raises the first and drops the rest |
TaskGroup → ExceptionGroup surfaces all; catch with except* |
A cancelled task refuses to stop / TaskGroup hangs |
CancelledError was swallowed (except ...: pass) |
Catch to clean up, then raise it again — always |
AttributeError: module 'asyncio' has no attribute 'TaskGroup' |
Running Python < 3.11 | Upgrade to 3.11+, or fall back to gather |
| CPU-bound code no faster under async | Async is one thread — no parallelism for computing | Use ProcessPoolExecutor / multiprocessing |
cProfile says everything is fast, but the app is slow |
You profiled a warm path, or the slow part is I/O wait | Profile the real (cold vs warm) path; time the actual scenario |
| Optimised a function, total runtime unchanged | Optimised a non-hot function | Re-read the profile — fix the top tottime line, not a hunch |
tracemalloc snapshot shows nothing allocated |
tracemalloc.start() called after the allocation |
Start it before the code you’re measuring |
numpy/vectorised result differs slightly |
Float accumulation order / dtype overflow (int32 wrap) |
Use dtype=np.int64/float64; assert against the scalar version |
Task exception was never retrieved at shutdown |
A raw create_task raised and was never awaited |
Await it, or wrap it in a TaskGroup |
Three of these are worth more than a table row.
The blocking call is the one with no error to grep for. Every other bug here throws something — a warning, a RuntimeError, a traceback. A blocking call inside a coroutine throws nothing. The program is correct, the output is right, and it’s simply slow, silently serialising work you believe is concurrent. The tell is a load test: an async service that should scale to hundreds of concurrent requests but stubbornly handles them one at a time almost always has a synchronous call — a legacy DB driver, a requests.get, a time.sleep, a fat json.loads on a huge payload — sitting in a hot path. Hunt it with a profiler, or by auditing every non-await call in your coroutines, and wrap it in to_thread.
Swallowing CancelledError breaks the whole cooperative contract. It’s tempting to write except asyncio.CancelledError: pass to “handle” cancellation quietly, and it is always wrong. Cancellation is a request the task must honour: clean up, then let the CancelledError propagate so the machinery that cancelled you — a TaskGroup, a timeout, a shutdown — knows you actually stopped. Swallow it and you get tasks that ignore timeouts, TaskGroups that hang waiting for a sibling that won’t die, and shutdowns that never complete. The 3.8 change making CancelledError a BaseException (so except Exception skips it) was specifically to protect you here — don’t undo it with an explicit catch.
Profiling a warm path and shipping the number is a subtle lie. The first time a function runs, it pays for imports, first-touch of the OS file cache, cold branch predictors, an empty lru_cache. Steady-state runs pay none of that. If you timeit a function that’s warm but your production calls it cold (once per request, say), your “it’s 5μs” is fiction — the real cost includes the cold-start tax. The fix is to measure the state you actually run in: loop it if it runs in a loop, run it once-from-cold if it runs once. Match the benchmark to reality or the reality will surprise you.
Cheat-sheet
| asyncio | What it does |
|---|---|
async def f(): ... |
Define a coroutine function — calling it returns an inert coroutine |
await x |
Suspend until awaitable x is ready; yields the loop to others |
asyncio.run(coro) |
✅ Top-level entry — start a loop, run coro, shut down. ⚠️ Not inside a loop |
asyncio.create_task(coro) |
✅ Schedule coro to run now, concurrently; returns a Task. Keep the ref |
await asyncio.gather(*aws) |
Run concurrently, results in arg order. ⚠️ Leaks siblings on error |
gather(*aws, return_exceptions=True) |
Never raises — returns results and exception objects |
async with asyncio.TaskGroup() as tg: |
✅ 3.11+ default — structured; cancels siblings on error → ExceptionGroup |
except* ValueError as eg: |
Catch from an ExceptionGroup (3.11+) |
async with asyncio.timeout(s): |
✅ 3.11+ deadline for a block → TimeoutError |
await asyncio.wait_for(aw, timeout=s) |
Deadline for a single awaitable → TimeoutError |
await asyncio.sleep(s) |
✅ Cooperative sleep — yields. ❌ Never time.sleep in a coroutine |
await asyncio.to_thread(fn, *a) |
✅ 3.9+ — run a blocking call off the loop, in a thread |
loop.run_in_executor(pool, fn, *a) |
Older form; pool=None = thread pool; a ProcessPoolExecutor for CPU |
q = asyncio.Queue(maxsize=N) |
Producer/consumer buffer with backpressure; await q.get()/q.put(x) |
task.cancel() |
Request cancellation → CancelledError in the task. ⚠️ Catch-then-raise |
asyncio.as_completed(aws) |
Iterate results in completion order, not arg order |
| Profiling | What it does |
|---|---|
python -m timeit -s "setup" "stmt" |
✅ Micro-benchmark a one-liner; auto loop count. Report the min |
timeit.repeat(stmt, setup, repeat=5) |
List of timings — take min(...) |
python -m cProfile -s cumtime app.py |
✅ Profile a whole run; sort by cumulative time |
python -m cProfile -s tottime app.py |
Sort by self-time — find the leaf to fix |
pstats.Stats(pr).sort_stats("tottime").print_stats(10) |
Post-process a cProfile.Profile() in code |
tottime vs cumtime |
Self-time (the hot function) vs including sub-calls (the expensive path) |
tracemalloc.start() → take_snapshot() → compare_to(...) |
Find the line allocating memory. ⚠️ Start first |
functools.lru_cache(maxsize=N) |
✅ Cache a pure function’s results; .cache_info() shows hit rate |
py-spy dump --pid PID / py-spy top |
Sample a running process, no restart, no code change |
line_profiler (kernprof -l) |
Per-line timing inside one function |
Interview and exam questions
Q: What does async def actually return when you call it, and when does the code run?
A: Calling an async def returns a coroutine object — inert. None of the body runs yet. It only executes when the event loop drives it: when you await it, wrap it in asyncio.create_task(...), or pass it to asyncio.run(...)/gather. The proof is that calling one and discarding it gives RuntimeWarning: coroutine '...' was never awaited — the code never ran. This is the opposite of a normal function call, and forgetting await (so a coroutine is created but never driven) is the most common async bug there is.
Q: Explain “one thread, cooperative multitasking.” Why does one blocking call freeze everything?
A: asyncio runs all your coroutines on a single thread. The event loop runs one task until it hits an await, at which point the task suspends and the loop picks another. Control only changes hands at await points — there’s no OS preemption. So a call that doesn’t await — time.sleep, a sync DB driver, a tight CPU loop — never yields the thread, and since there’s only one thread, every other task is frozen until it returns. Measured: three time.sleep(0.5) calls inside coroutines ran serially in 1.51s; three asyncio.sleep(0.5) overlapped in 0.50s. Fix unavoidable blocking with asyncio.to_thread.
Q: gather vs TaskGroup — how do they differ when one task raises?
A: With asyncio.gather (default), the first exception is raised to you immediately, the other tasks keep running in the background (a leak), and any further exceptions are dropped. asyncio.TaskGroup (3.11+) is structured: if any task raises, it cancels all siblings and raises an ExceptionGroup containing every error, caught with except*. I proved it — with two failing tasks, gather surfaced only boom-1 while TaskGroup surfaced both. TaskGroup is the modern default precisely because gather’s leak-and-drop behaviour caused real bugs. gather(return_exceptions=True) is the middle ground: it never raises and returns each result-or-exception in order.
Q: When does async give a speedup, and when does it give none? Put numbers on it.
A: Async speeds up I/O-bound work — anything that spends its time waiting (sockets, HTTP, DB). Measured: 100 HTTP requests of 50ms each took 5.87s sequentially and 0.30s concurrently — 20x (18–21x across runs), because the waits overlapped on one idle thread. It gives zero speedup for CPU-bound work: four numeric loops took 0.31s sequentially and 0.31s under gather — 1.00x — because one thread can only compute one thing at a time and none of the tasks await. For CPU parallelism you need processes.
Q: You have a CPU-bound function to parallelise. asyncio, threads, or processes — and why?
A: Processes (ProcessPoolExecutor / multiprocessing). asyncio is one thread — no parallelism for computing (measured 1.00x). Threads don’t help CPU-bound Python either, because the GIL serialises bytecode execution (only one thread runs Python at a time). Processes each have their own interpreter and GIL, so they run in true parallel — measured 1.9x across 4 workers on real work. ⚠️ The catch: process startup and argument pickling cost real time, so for tiny tasks a process pool can be slower than sequential (I measured 0.9x on trivial work). Processes pay off only when each task’s compute dwarfs the overhead. Threads remain the right tool for blocking I/O libraries (the GIL releases during I/O).
Q: What’s the rule for CancelledError, and what breaks if you ignore it?
A: When a task is cancelled, asyncio.CancelledError is raised into it at its current await. The rule: you may catch it to run cleanup, but you must re-raise it. If you swallow it (except asyncio.CancelledError: pass), the task cleans up and then keeps running as if never cancelled — which breaks TaskGroup (it cancels siblings on error and waits for them to actually stop), breaks timeouts (the timed-out operation doesn’t die), and hangs shutdowns. Since 3.8 CancelledError subclasses BaseException, not Exception, so a blanket except Exception: won’t catch it — a deliberate protection you shouldn’t defeat.
Q: Before optimising, what do you do, and which tool answers which question?
A: Measure — never optimise on intuition, because the real bottleneck is routinely not where you’d guess, and optimising a cold function wastes effort while adding complexity. Three questions, three tools: how long does this snippet take? → timeit (many runs, report the min); which function eats the runtime? → cProfile + pstats (sort by cumtime for the expensive path, tottime for the leaf to fix); where does the memory go? → tracemalloc (snapshot, compare). Only after the profile names the hot spot do you change anything — then re-measure to confirm.
Q: In a cProfile report, what’s the difference between tottime and cumtime?
A: tottime is time spent in that function itself, excluding calls it makes; cumtime is time in the function plus everything it calls. Sort by cumtime to find which high-level operation is expensive; sort by tottime to find the actual leaf function to optimise. In this lesson’s profile, build_report, count_primes and sum all showed cumtime ≈ 1.32s — but only because they call is_prime, whose tottime was 1.319s. The tottime column cut through the call chain and named the real culprit. ⚠️ cProfile adds overhead, so its absolute times are inflated — use it for relative hot spots, then timeit the fixed function for a true number.
Q: Rank the optimisation levers by payoff, with the numbers you measured.
A: (1) Algorithm / data structure — biggest by far: changing is_prime from O(n) to O(√n) was 126x, and list→set membership is ~3,000x. (2) Caching (lru_cache) for pure functions with repeated inputs — 10x here (450 hits / 50 misses). (3) Vectorisation (numpy) for bulk numeric work — 21x. (4) Micro-tuning like local-variable binding — 8%, a rounding error. Work top-down and stop when fast enough; the top lever routinely beats everything below it combined, which is why you fix the algorithm before touching anything else. And always assert the optimised result equals the original — a faster wrong answer is a bug.
Q (coding): Fetch N URLs concurrently, but never more than K at once, and fail atomically. A:
import asyncio, httpx

async def fetch_all(urls, k=20):
    sem = asyncio.Semaphore(k)                    # cap in-flight requests
    async def one(client, url):
        async with sem:
            r = await client.get(url)
            r.raise_for_status()
            return r.json()
    async with httpx.AsyncClient(timeout=10) as client:
        async with asyncio.TaskGroup() as tg:     # all succeed, or all cancel
            tasks = [tg.create_task(one(client, u)) for u in urls]
    return [t.result() for t in tasks]
The points tested: TaskGroup for structured, atomic concurrency (one failure cancels the rest — no orphans); a Semaphore for politeness so you never exceed k simultaneous requests; await client.get on the async client (a sync requests.get here would freeze the loop); and raise_for_status() so a bad status becomes an error inside the group. Measured against a sequential loop over a 50ms endpoint, the concurrent version was ~12x faster at k=20.
Q: Why can’t you just call an async function from ordinary sync code, and what does that imply?
A: await only works inside an async def, and you can’t await from sync code. Your only bridge is asyncio.run(coro), which starts a whole event loop — fine at a program’s top level, but you can’t call it from inside a running loop (RuntimeError: asyncio.run() cannot be called from a running event loop). This is the function-colour problem: once a function is async, its callers must be async too, and the asyncness spreads up the stack. The implication is that adopting async is often an all-or-nothing decision for a code path, not a local tweak — which is the honest reason not to reach for it unless you genuinely have concurrent waiting to exploit.
Key takeaways
- Async is one thread taking turns, cooperatively. A task runs until it
awaits, then yields control; betweenawaits it owns the thread. That’s concurrency (many things in progress), not parallelism (many things executing at once). - Calling an
async defruns nothing — it returns an inert coroutine. It executes only when awaited or scheduled (asyncio.run,create_task,gather,TaskGroup). A dropped coroutine givesRuntimeWarning: coroutine was never awaited, which is almost always a forgottenawait. - ⚠️ The cardinal sin: a blocking call in a coroutine freezes the whole loop.
time.sleep,requests, a sync DB driver, a tight CPU loop — none of themawait, so the single thread stalls and every task waits. Measured: 1.51s serial vs 0.50s cooperative. Fix withawait asyncio.sleep, an async client, orasyncio.to_thread. - Prefer
TaskGroup(3.11+) overgather. It’s structured: one failure cancels the siblings and raises anExceptionGroupwith all errors.gather’s default leaks the other tasks and drops all but the first exception. - Async wins for I/O, does nothing for CPU. Measured: 100 HTTP waits went ~20x faster concurrently; four CPU loops were 1.00x — unchanged. The trilemma: asyncio for I/O at scale, threads for a few blocking calls, processes for CPU-bound work (measured 1.9x, but with real startup/pickle overhead).
- Catch
CancelledErrorto clean up, thenraiseit. Swallowing it breaksTaskGroup, timeouts and shutdown — the task ignores the request to stop. - ⚠️ Measure before you optimise — always.
timeitfor snippets,cProfile/pstatsfor the hot function (tottime= the leaf to fix,cumtime= the expensive path),tracemallocfor memory. Optimising the wrong (non-hot) function adds complexity for a rounding error. - Fix the algorithm first. The levers descend by orders of magnitude: algorithm/data-structure (126x here), caching (10x), vectorisation (21x), micro-tuning like local binding (8%). Work top-down,
assertthe answer is unchanged, re-measure, and stop when it’s fast enough.