There is a moment in every programmer’s life when the print() statements stop working. Not literally — they still print. But you have fourteen of them, they all say things like here and x = 5, half of them are inside a loop that runs 40,000 times, you can’t tell which module wrote which line, and you are about to commit the lot to main because you forgot to take them out. The bug is still there. You just added a second problem on top of it.
This lesson is about the two tools that replace that moment. Logging is how a program tells you what it is doing while it runs, at a verbosity you choose, with a timestamp and a source, into a file that outlives the crash. Debugging — real debugging, with breakpoint() and pdb — is how you stop a program mid-flight and ask it questions instead of guessing at answers.
They are not competitors. Logging is what you leave in the code forever; the debugger is what you reach for when logging has narrowed the bug to a room and you need to know which chair it’s sitting in. Most working Python developers use both every day, and the ones who don’t are usually the ones still adding print("here5").
Everything here targets Python 3.12+, uses only the standard library — no pip install, no virtual environment needed — and runs the same on macOS, Linux, and Windows unless noted. Every snippet below was executed; the outputs are real.
Why this matters
Here is the uncomfortable truth about print debugging: it works. For small enough programs it works well enough to get you quite far — which is exactly why it’s a trap. It scales beautifully right up to the point where it doesn’t, and that point is roughly where your code becomes worth debugging: when it has modules, when it runs on a server you can’t see, when the failure happens at 03:00 and nobody is watching the terminal.
Think about what you actually need to know when something breaks. What happened? — a message. When? — a timestamp. Where? — a module and a line. How bad is it? — a severity. What was the state? — the variables. And can I see this later, from a machine I don’t have open right now? A print() gives you exactly one of those six. The logging module gives you all of them, for about the same typing.
The mental model to carry through this lesson is this: a log call is not a print. It is a record that gets offered to a pipeline, and the pipeline can refuse it. When you write log.info("order placed") you are not writing to a screen. You are constructing a thing — a LogRecord — and handing it to a chain of objects that each get a vote on whether it lives, where it goes, and what it looks like when it gets there. Almost every confusing logging behaviour in this lesson comes from not knowing which link in that chain ate your message.
And the debugger’s model is just as simple, and just as commonly missed: your program is a stack of frames, and each frame has its own variables. When you crash four calls deep, the value that caused the crash is often not in the frame that raised — it’s two frames up, in the loop that chose the bad row. A debugger’s real superpower isn’t stepping line by line. It’s walking up the stack and looking at the caller.
Why print debugging doesn’t scale
Let’s be fair to print first, because the honest case matters more than the sermon. Here is the same debugging session done with prints. This is orders_print.py, a script that averages some order amounts:
# orders_print.py — "debugging" with print(). Watch the pain.
def parse_amount(raw: str) -> float:
    print("parse_amount", raw)            # which module? what time? what level?
    return float(raw.strip().replace(",", ""))

def total(orders: list[dict]) -> float:
    running = 0.0
    for o in orders:
        print("loop", o)                  # noisy, and you cannot switch it off
        running += parse_amount(o["amount"])
    return running
$ python3 orders_print.py
loop {'id': 1001, 'amount': '249.50'}
parse_amount 249.50
loop {'id': 1002, 'amount': '1,199.00'}
parse_amount 1,199.00
loop {'id': 1003, 'amount': ' 75.25 '}
parse_amount  75.25
loop {'id': 1004, 'amount': '12a.00'}
parse_amount 12a.00
Traceback (most recent call last):
  ...
ValueError: could not convert string to float: '12a.00'
It found the bug: the fourth order has '12a.00' in it. So what’s wrong?
Count the things this output cannot tell you. There is no timestamp, so you cannot say how long the parse took or correlate it with an alert. There is no module name, so when parse_amount is one of two hundred functions across twelve files, loop tells you nothing about who said it. There is no level, so you can’t say “show me only the bad stuff” — every line is equally loud. You cannot switch it off without editing the source — so you either delete these lines (and re-add them next month) or ship them. It goes to stdout, mixed into your program’s real output — pipe this into a CSV and your data now has loop {'id': 1001...} in it. And it is gone forever the moment the terminal scrolls, because nothing wrote it down.
print() |
logging |
|
|---|---|---|
| Timestamp | ❌ You’d have to add it by hand | ✅ %(asctime)s |
| Source (module/function/line) | ❌ | ✅ %(name)s %(funcName)s %(lineno)d |
| Severity | ❌ Every line is equal | ✅ DEBUG → CRITICAL, five levels |
| Switch off without editing code | ❌ Delete or comment out | ✅ One setLevel() — or a config file |
| Turn up verbosity in production | ❌ Redeploy | ✅ Change a level, no code change |
| Goes to | stdout — mixed into your real output | stderr by default; file, syslog, HTTP, anywhere |
| Survives the crash | ❌ Scrollback only | ✅ It’s in a file |
| Multiple destinations at once | ❌ | ✅ Console at INFO and file at DEBUG |
| Traceback included | ❌ Not unless you build it | ✅ log.exception() |
| Per-library control | ❌ | ✅ Silence urllib3, keep your own at DEBUG |
| Gets committed by accident | ⚠️ Constantly | ✅ It’s meant to stay |
| Cost when switched off | Always pays full cost | ~72 ns and no formatting |
| Structured output for cloud tooling | ❌ | ✅ JSON formatter |
That last-but-one row is the philosophical difference, and it’s worth saying plainly. Print statements are written to be deleted. Log statements are written to stay. That single change of intent is why logging code tends to be better code: you write log.debug("parse_amount raw=%r", raw) once, thoughtfully, and it is still earning its keep a year later when someone else is on call.
When print is genuinely fine
Now the honest half. print is not a code smell, and anyone who tells you to never use it is selling something. print is a fine tool with a narrow job:
| Situation | Use | Why |
|---|---|---|
| A script’s actual output (the answer) | print |
This is not diagnostics, it’s the product. logging would be wrong |
| A CLI’s user-facing messages | print |
Users shouldn’t read log formatting |
| A 20-line throwaway script | print |
Configuring logging costs more than the script is worth |
| Exploring in a REPL or notebook | print / bare expression |
The session is the terminal |
| Teaching / demos (this lesson!) | print |
The reader needs to see it, plainly |
| Anything that runs unattended | logging |
You will not be watching |
| Anything with more than one module | logging |
You’ll want %(name)s |
| Anything a colleague will run | logging |
They need a verbosity dial |
| Anything you’d be sad to lose | logging |
It goes to a file |
| Library code | logging (+ NullHandler) |
Never print from a library — see below |
The rule of thumb: print is for output, logging is for diagnostics. If the line answers “what is the result?”, print it. If it answers “what is the program doing?”, log it. The two get confused because in a small script they land in the same terminal — but they have different audiences, and one of them isn’t watching.
The logging model: Logger → Handler → Formatter → output
Nearly everyone who finds logging confusing is confused by the same thing: they think it’s a function. It isn’t. It is four small object types with clearly split jobs, and once you can name them, the module stops being mysterious.
| Object | You get it from | Its one job | Where its level matters |
|---|---|---|---|
| Logger | logging.getLogger("shop.orders") |
The thing you call. Decides whether the message is worth making a record of | ✅ Gate 1 |
| LogRecord | Created for you | A data object: message, args, level, time, module, line, exception info | — |
| Handler | logging.StreamHandler(), RotatingFileHandler(...) |
Sends a record somewhere: console, file, syslog, HTTP | ✅ Gate 2 |
| Formatter | logging.Formatter("%(asctime)s ...") |
Turns a record into a string. Attached to a handler, never a logger | ❌ No level |
| Filter | logging.Filter subclass |
Fine-grained yes/no (or enrich the record). Can sit on either | ❌ No level |
The flow reads like a sentence: you call a Logger; if it agrees, a LogRecord is created and offered to Handlers; each Handler that accepts it asks its Formatter for a string and writes that string somewhere.
Here is that path for a single call to log.info(...), including the two places your message can silently die:
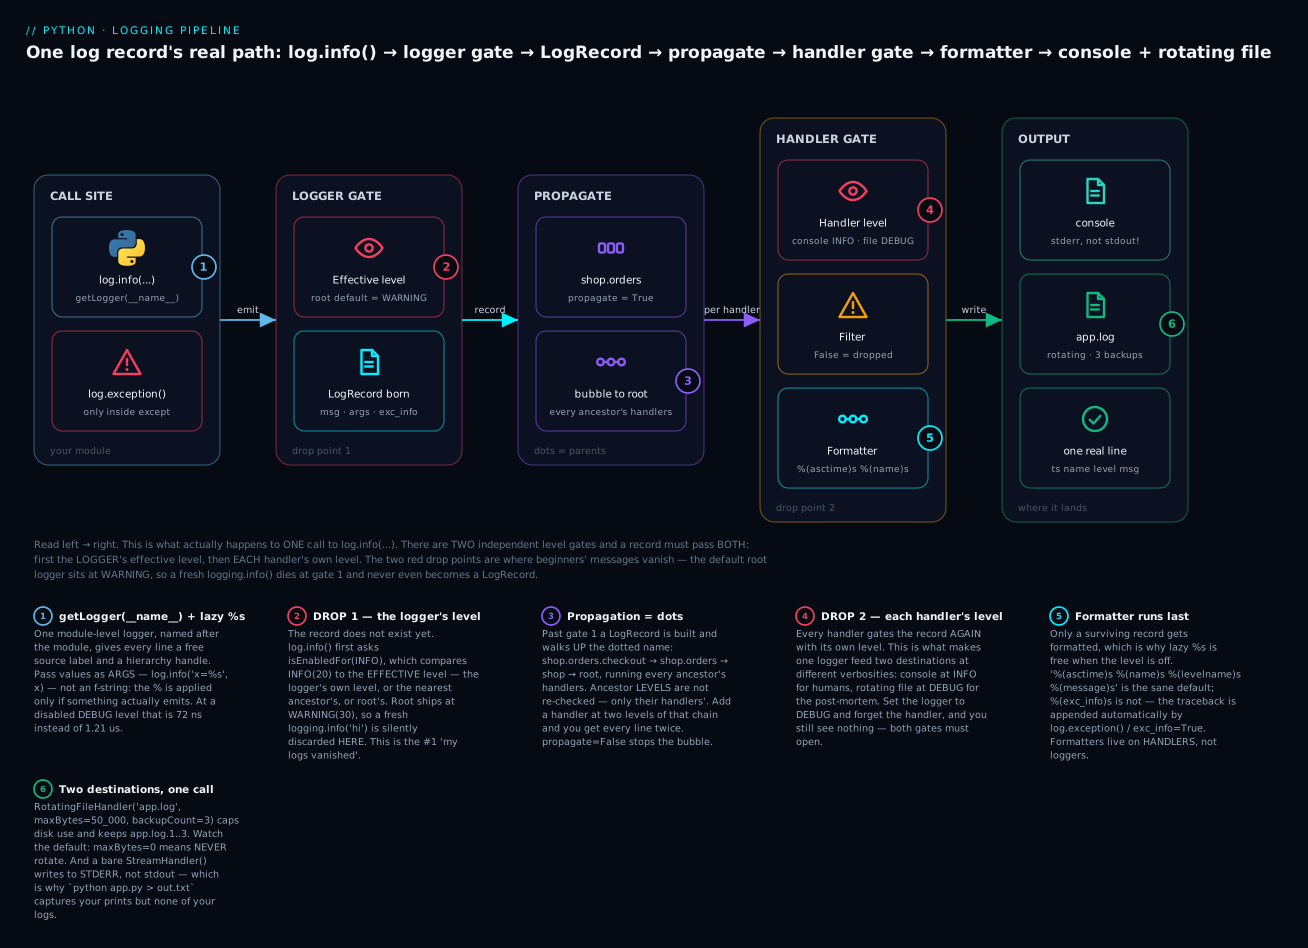
Follow it left to right. Your log.info("x=%s", x) hits gate 1 — the logger’s effective level — and if INFO doesn’t clear it, nothing further happens: no record, no formatting, no cost. Past that gate a LogRecord is born and propagates up the dotted hierarchy (shop.orders.checkout → shop.orders → shop → root), running every ancestor’s handlers. Each handler applies gate 2 — its own level — plus any filters, and only a survivor reaches the Formatter and gets written.
The badges mark the six things that actually bite: the getLogger(__name__) + lazy %s idiom (1); the drop at the logger’s level, which is where your logging.info() went (2); propagation, which is where duplicate lines come from (3); the second level check on every handler (4); the formatter running last, which is what makes lazy %s free (5); and two destinations from one call, with the maxBytes=0 and stderr-not-stdout traps (6).
The two gates — the #1 confusion in Python logging
This deserves its own demonstration, because it is the single most common “logging is broken” bug report, and it is not a bug. A record must clear BOTH the logger’s level AND the handler’s level. They are independent. Setting one to DEBUG does nothing if the other is at WARNING:
import logging, sys

log = logging.getLogger("shop.orders")
log.setLevel(logging.DEBUG)          # gate 1: wide open
h = logging.StreamHandler(sys.stdout)
h.setLevel(logging.WARNING)          # gate 2: narrow
h.setFormatter(logging.Formatter("%(name)s %(levelname)s %(message)s"))
log.addHandler(h)

log.debug("debug: passes the logger, DIES at the handler")
log.info("info: passes the logger, DIES at the handler")
log.warning("warning: passes BOTH -> printed")
shop.orders WARNING warning: passes BOTH -> printed
The logger was at DEBUG. The debug and info calls were allowed by the logger, a LogRecord was built for each, they were handed to the handler — and the handler threw them away. Now flip it:
log.setLevel(logging.ERROR)          # gate 1: narrow
h.setLevel(logging.DEBUG)            # gate 2: wide open
log.warning("warning: DIES at the logger; the handler never sees it")
log.error("error: passes both")
print("effective level :", logging.getLevelName(log.getEffectiveLevel()))
print("isEnabledFor(DEBUG):", log.isEnabledFor(logging.DEBUG))
shop.orders ERROR error: passes both
effective level : ERROR
isEnabledFor(DEBUG): False
Same lesson from the other side. Here is the whole interaction as a matrix — bookmark this one:
| Logger level | Handler level | log.debug() |
log.info() |
log.warning() |
log.error() |
|---|---|---|---|---|---|
DEBUG |
DEBUG |
✅ | ✅ | ✅ | ✅ |
DEBUG |
INFO |
❌ handler | ✅ | ✅ | ✅ |
DEBUG |
WARNING |
❌ handler | ❌ handler | ✅ | ✅ |
INFO |
DEBUG |
❌ logger | ✅ | ✅ | ✅ |
WARNING (root default) |
DEBUG |
❌ logger | ❌ logger | ✅ | ✅ |
ERROR |
DEBUG |
❌ logger | ❌ logger | ❌ logger | ✅ |
NOTSET (default on a new logger) |
any | inherits — see below |
The practical shape you almost always want falls straight out of this table: logger at DEBUG (let everything through), then let each handler choose its own verbosity. Console handler at INFO so a human isn’t drowned; file handler at DEBUG so the post-mortem has everything. One log.debug() call, two different fates. That is the entire reason there are two gates, and once you see it that way it stops feeling like a trick.
Effective level: what a new logger actually does
A logger you just made has level NOTSET (0), which does not mean “log everything”. It means “ask my parent”. getEffectiveLevel() walks up the dotted chain until it finds a logger with a level actually set, and falls back to root:
import logging
child = logging.getLogger("shop.orders.checkout")
mid   = logging.getLogger("shop")
print("child's own level:", child.level, "(0 = NOTSET)")
print("effective        :", logging.getLevelName(child.getEffectiveLevel()))
mid.setLevel(logging.CRITICAL)
print("after shop=CRITICAL, child effective:", logging.getLevelName(child.getEffectiveLevel()))
print("child.isEnabledFor(INFO):", child.isEnabledFor(logging.INFO))
child's own level: 0 (0 = NOTSET)
effective        : WARNING
after shop=CRITICAL, child effective: CRITICAL
child.isEnabledFor(INFO): False
Read that carefully: the child never had a level set, so it inherited WARNING from root — and the moment shop got a level, the child inherited that instead. This is the mechanism that lets you write logging.getLogger("urllib3").setLevel(logging.WARNING) and silence an entire library’s subtree in one line.
| Level resolution | Result |
|---|---|
| Logger has its own level set | Use it. Inheritance stops here |
Logger is NOTSET (0) |
Walk up the dotted name to the nearest ancestor with a level set |
| No ancestor has one | Use root’s level — which is WARNING unless you changed it |
| Setting a parent’s level | Instantly changes every NOTSET descendant’s effective level |
| Setting the child’s own level | Pins it — the parent no longer affects it |
The five levels — and why your logging.info() vanished
Levels are just integers with names. That’s the whole story, and knowing it explains a lot:
import logging
for name in ("CRITICAL", "ERROR", "WARNING", "INFO", "DEBUG", "NOTSET"):
    print(f"{name:9} = {getattr(logging, name)}")
CRITICAL  = 50
ERROR     = 40
WARNING   = 30
INFO      = 20
DEBUG     = 10
NOTSET    = 0
A gate at level N passes any record whose level is >= N. That’s it. WARNING (30) is the root default, so INFO (20) and DEBUG (10) fail the comparison and disappear. Because they’re plain ints you can invent your own (logging.addLevelName(25, "NOTICE")), but resist — every tool that reads your logs understands the standard five and nothing else.
Choosing the right level is a real skill, and getting it wrong is why so many production logs are useless. The test isn’t “how do I feel about this line?” — it’s “who needs to wake up?”:
| Level | Int | Means | Use it for | Who reads it |
|---|---|---|---|---|
DEBUG |
10 | Developer detail | Values, branches taken, “raw=%r”, cache hits, SQL | You, during a hunt. Off in production (usually) |
INFO |
20 | Normal, notable progress | “service started”, “processed 412 orders”, “config loaded” | Ops, confirming it’s alive and doing work |
WARNING |
30 | Something is off, we coped | Retried, fell back to a default, deprecated call, disk 80% | Someone, eventually — no one wakes up |
ERROR |
40 | This operation failed | Unhandled row, API call failed after retries, bad data | On-call, during hours. Almost always with exc_info |
CRITICAL |
50 | The program can’t continue | Can’t reach the DB at startup, config is invalid, out of disk | Wake someone up. Rare — if it’s frequent, it’s an ERROR |
Two anti-patterns to name. Level inflation: everything becomes ERROR because it “seems important”, so ERROR means nothing and nobody looks. Level deflation: real failures logged at INFO or, worse, WARNING, so a genuine data-loss bug scrolls past in the noise. The discipline that fixes both: WARNING means we recovered; ERROR means we didn’t. If the code handled it and moved on, it is not an ERROR.
The classic: logging.info() prints nothing
This is the first thing that happens to everyone who tries the module. Fresh interpreter, no config:
import logging
logging.debug("debug msg")
logging.info("info msg")
logging.warning("warning msg")
logging.error("error msg")
logging.critical("critical msg")
WARNING:root:warning msg
ERROR:root:error msg
CRITICAL:root:critical msg
The debug and info lines are gone, and the survivors are wearing a format nobody chose. Three separate facts explain this, and all three are worth knowing:
- The root logger’s level is
WARNING.INFO(20) <WARNING(30), so those two records die at gate 1. This is a deliberate default: it means a library that logs INFO can’t spam a program that never configured logging. rootis the logger’s name because the module-levellogging.info(...)functions are shortcuts that call the root logger. That’s therootinWARNING:root:warning msg.WARNING:root:...is the default format, from aStreamHandlerwriting to stderr — not stdout. Prove it by throwing stderr away:
$ python3 v1_root.py 2>/dev/null
                                  # nothing at all — it was ALL on stderr
That stderr default surprises people who redirect: python3 app.py > out.txt captures your prints and none of your logs. Both are fixable, but you have to know which one you’re looking at.
The nastiest version of this: basicConfig silently ignored
Here is the trap that this default sets for you, and it’s a good one. Those module-level shortcuts (logging.info, logging.warning, …) have a hidden behaviour: if root has no handlers, they call basicConfig() for you. So a single stray logging.info(...) before your setup code quietly installs a default handler — and basicConfig() is a one-shot no-op if root already has handlers:
import logging
logging.info("this vanishes — root is at WARNING")   # <-- but it INSTALLS a handler!
print("handlers now:", logging.getLogger().handlers)
logging.basicConfig(level=logging.DEBUG, format="%(levelname)s %(message)s")  # NO-OP!
logging.info("did basicConfig take effect?")
print("root level:", logging.getLevelName(logging.getLogger().level))
handlers now: [<StreamHandler <stderr> (NOTSET)>]
root level: WARNING
Read that output twice. Your basicConfig(level=DEBUG, ...) did absolutely nothing — no error, no warning — because an implicit basicConfig() had already run on line 2. The level is still WARNING, the format is still the default, and your second logging.info vanished too. Debugging this by staring at the basicConfig line will never work; the culprit is a line above it.
Since Python 3.8 there is an escape hatch — force=True removes and closes any existing root handlers first:
logging.basicConfig(level=logging.ERROR, format="forced %(message)s", force=True)
But force=True is a fix for a mess, not a design. The real rule is configure logging exactly once, as early as possible, in your entry point — not at import time in a library module, not twice, not conditionally.
The other default: lastResort
What about a named logger with no handlers anywhere? Python 3 doesn’t stay silent and doesn’t crash — there’s a fallback handler of last resort:
import logging
log = logging.getLogger("mylib")     # not root, no handlers anywhere
log.warning("no handler configured anywhere — who prints this?")
log.info("info is dropped — lastResort is at WARNING")
print("lastResort:", logging.lastResort, "level:", logging.getLevelName(logging.lastResort.level))
no handler configured anywhere — who prints this?
lastResort: <_StderrHandler <stderr> (WARNING)> level: WARNING
Note the message printed bare — no WARNING:mylib: prefix — because lastResort has no formatter. If you’ve ever seen a naked sentence appear in your terminal and couldn’t find the print that made it, this was probably it. (In Python 2 this printed No handlers could be found for logger "mylib" instead. If you find that string in an old answer online, the advice is out of date.)
getLogger(__name__), the hierarchy, and propagation
Here is the single most important line of logging code you will write, and it goes at the top of every module:
import logging
log = logging.getLogger(__name__)      # module-level, once, right after the imports
Why __name__? Because it is already the module’s dotted path — shop.orders.checkout in a package, or "__main__" in the script you ran. That gives you three things for free: every log line is stamped with its origin via %(name)s; you get a hierarchy you can control from outside; and you never have to invent a naming scheme. (If dotted module names are still fuzzy, the Modules & Packages lesson is the one that makes __name__ click.)
import logging, sys
logging.basicConfig(level=logging.DEBUG, format="%(asctime)s %(name)s %(levelname)s %(message)s",
                    stream=sys.stdout)
log = logging.getLogger(__name__)
print("logger name when run as a script:", log.name)
logger name when run as a script: __main__
getLogger is a registry, not a constructor — the same name always returns the same object, from anywhere in your program. This is why you never pass loggers around as arguments:
import logging
a = logging.getLogger("shop.orders")
b = logging.getLogger("shop.orders")
print("same object?", a is b)
same object? True
| Naming pattern | Verdict |
|---|---|
logging.getLogger(__name__) |
✅ The idiom. Module path, free hierarchy, zero thought |
logging.getLogger() (no name) |
⚠️ That’s root. Configure it; don’t log to it from library code |
logging.info(...) / logging.warning(...) |
⚠️ Also root, plus an implicit basicConfig(). Fine in a 20-line script, wrong in an app |
logging.getLogger("myapp.db") (hand-written) |
✅ Fine — useful for a subsystem that isn’t one module |
logging.getLogger(__file__) |
❌ An absolute path as a logger name. No hierarchy, ugly output |
| One logger passed around as an argument | ❌ Pointless — getLogger already returns the same object |
| A new logger per class instance | ❌ Loggers are never garbage-collected. That’s a leak |
Dots are parents
The dotted name is the hierarchy. shop.orders.checkout is a child of shop.orders, which is a child of shop, which is a child of root. You never declare this; the name declares it.
import logging, sys
logging.basicConfig(level=logging.DEBUG, format="ROOT|%(name)s|%(levelname)s|%(message)s",
                    stream=sys.stdout)
child = logging.getLogger("shop.orders.checkout")
child.info("bubbles up to root's handler")

mid = logging.getLogger("shop")                       # add a SECOND handler mid-chain
h = logging.StreamHandler(sys.stdout)
h.setFormatter(logging.Formatter("SHOP|%(name)s|%(message)s"))
mid.addHandler(h)
child.info("printed twice: shop's handler + root's handler")

mid.propagate = False                                 # stop the bubble at 'shop'
child.info("only the shop handler now")
ROOT|shop.orders.checkout|INFO|bubbles up to root's handler
SHOP|shop.orders.checkout|printed twice: shop's handler + root's handler
ROOT|shop.orders.checkout|INFO|printed twice: shop's handler + root's handler
SHOP|shop.orders.checkout|only the shop handler now
There is your duplicate log lines bug, manufactured on purpose. Nothing is broken — the record genuinely visited two handlers, because that is what propagation is for. It’s how one basicConfig() at the top of your app captures every module’s logs without any module knowing.
Now the subtlety that trips up even experienced people. During propagation, ancestor loggers’ levels are NOT re-checked — only their handlers’ levels are. The level gate is applied once, at the logger you called:
import logging, sys
child = logging.getLogger("shop.orders.checkout")
mid   = logging.getLogger("shop")
child.setLevel(logging.DEBUG)             # the child has its OWN level now
mid.setLevel(logging.CRITICAL)            # the parent is nearly closed...
h = logging.StreamHandler(sys.stdout)
h.setFormatter(logging.Formatter("SHOP-HANDLER|%(name)s|%(levelname)s|%(message)s"))
mid.addHandler(h)                         # ...but its HANDLER has no level (NOTSET)
child.info("does this reach shop's handler even though shop.level=CRITICAL?")
SHOP-HANDLER|shop.orders.checkout|INFO|does this reach shop's handler even though shop.level=CRITICAL?
It printed. shop.setLevel(CRITICAL) did not block an INFO record that originated at shop.orders.checkout, because that record already passed its gate. shop’s level only governs records logged to shop itself, plus the effective level of NOTSET descendants. To actually block that record at shop you’d set a level on shop’s handler, or set propagate = False.
| Propagation rule | Detail |
|---|---|
| Direction | Up the dotted name: a.b.c → a.b → a → root |
| What runs | Every handler of every ancestor, in order |
| Ancestor levels | ❌ Not re-checked. Only the originating logger’s effective level gates |
| Ancestor handler levels | ✅ Checked, each one independently |
logger.propagate = False |
Stops the bubble at that logger — its own handlers still run |
| Handler at two chain levels | ✅ Two output lines. Not a bug — that’s the design |
| Missing intermediate loggers | Fine. a.b is auto-filled with a placeholder and re-parented when it appears |
That last row explains something you might otherwise trip over: if you create shop.orders.checkout before shop.orders exists, its parent is temporarily root, and Python silently re-parents it the moment getLogger("shop.orders") is called. You never have to create loggers in order.
Configuring logging properly
There are three ways to configure logging, and they suit three different sizes of program.
1. basicConfig — for scripts
One call, sets up the root logger, done. Perfect for a script; too blunt for an app.
import logging, sys
logging.basicConfig(
    level=logging.DEBUG,
    format="%(asctime)s %(name)s %(levelname)s %(message)s",
    datefmt="%Y-%m-%d %H:%M:%S",
    stream=sys.stdout,          # default is sys.stderr
)
logging.getLogger("shop.orders").info("order placed id=%s", 1001)
2026-07-15 14:59:56 shop.orders INFO order placed id=1001
basicConfig parameter |
Does | Notes |
|---|---|---|
level= |
Sets the root logger’s level | Not the handler’s. The handler is left at NOTSET = pass everything |
format= |
The format string for the auto-created formatter | Default: %(levelname)s:%(name)s:%(message)s |
datefmt= |
strftime format for %(asctime)s |
Without it you get 2026-07-15 14:56:18,082 (comma-milliseconds) |
style= |
"%" (default), "{", or "$" |
Must match your format= string |
stream= |
Where the StreamHandler writes |
Default sys.stderr. Mutually exclusive with filename= |
filename= |
Log to a file instead | ⚠️ Then nothing goes to the console |
filemode= |
"a" (default) or "w" |
"w" truncates your log on every run |
encoding= |
File encoding (3.9+) | Pass "utf-8" — same reasoning as any file |
handlers= |
A list of ready-made handlers | Mutually exclusive with stream=/filename=. This is the useful one |
force= |
Remove + close existing root handlers first (3.8+) | The escape hatch for “basicConfig did nothing” |
Two hard edges worth repeating: basicConfig() does nothing at all if root already has handlers (unless force=True), and filename= sends everything to the file and nothing to your terminal, which is its own little “where did my logs go?” mystery.
2. Explicit handlers — for anything real
When you want two destinations at two verbosities, build the objects yourself. This is the shape to memorise, and it’s exactly the diagram in code:
import logging, sys
from logging.handlers import RotatingFileHandler

def setup_logging() -> None:
    """Wire Logger -> Handlers -> Formatters. Call ONCE, from the entry point."""
    root = logging.getLogger()                      # configure ROOT; children propagate to it
    root.setLevel(logging.DEBUG)                    # gate 1: let everything through

    console = logging.StreamHandler(sys.stdout)
    console.setLevel(logging.INFO)                  # gate 2: humans see INFO+
    console.setFormatter(logging.Formatter("%(levelname)-8s %(name)s: %(message)s"))

    logfile = RotatingFileHandler("app.log", maxBytes=50_000, backupCount=3, encoding="utf-8")
    logfile.setLevel(logging.DEBUG)                 # gate 2: the file keeps EVERYTHING
    logfile.setFormatter(logging.Formatter(
        "%(asctime)s %(name)s %(levelname)s %(message)s", datefmt="%Y-%m-%d %H:%M:%S"))

    root.addHandler(console)
    root.addHandler(logfile)
One logger call now produces two different outcomes: a clean console for the human, a complete app.log for the post-mortem. That is the payoff of the two-gate design.
There’s no magic in a file handler — under the hood it is open(filename, "a", encoding=...). That explains its defaults: mode="a" (a restart never truncates your history) and encoding=None (the platform’s locale — so pass "utf-8", for the reasons the File I/O lesson spells out).
Rotation matters more than it sounds. A log file with no rotation is a disk-full outage waiting for a quiet weekend. RotatingFileHandler caps the size and keeps N backups:
from logging.handlers import RotatingFileHandler
h = RotatingFileHandler("app.log", maxBytes=200, backupCount=2, encoding="utf-8")
# ... write 20 lines through it ...
$ ls -la app.log*
-rw-r--r--  126 app.log      <- newest
-rw-r--r--  189 app.log.1
-rw-r--r--  189 app.log.2    <- oldest kept; everything older was DELETED
Note what that means: with backupCount=2 you keep app.log plus two backups and the oldest is deleted on each rotation. That’s the trade — bounded disk, bounded history.
| Handler | Sends to | Key parameters |
|---|---|---|
StreamHandler |
A stream — sys.stderr by default |
stream=sys.stdout to change it |
FileHandler |
One file, forever | filename, mode="a", encoding=None — ⚠️ grows without limit |
RotatingFileHandler |
File, rotate by size | maxBytes=0, backupCount=0 — ⚠️ both default to 0 = never rotates |
TimedRotatingFileHandler |
File, rotate by clock | when="h", interval=1, backupCount=0, utc=False |
WatchedFileHandler |
File, reopened if moved | For external logrotate on Linux |
NullHandler |
Nowhere | For libraries — see the etiquette section |
QueueHandler + QueueListener |
A queue → real handlers on another thread | Keeps slow I/O off the hot path; the async/multiprocessing answer |
SMTPHandler |
⚠️ Tempting, then your inbox has 40,000 mails | |
SysLogHandler |
syslog / journald | Linux daemons |
HTTPHandler |
An HTTP endpoint | Blocking — usually prefer a queue + real agent |
That maxBytes=0 default is a genuinely mean one: RotatingFileHandler("app.log") looks like it rotates and never does. Both maxBytes and backupCount must be non-zero for rotation to happen at all.
Formatters: what you can put in a format string
The formatter’s %(...)s names are just attributes of the LogRecord. Here are the ones worth knowing:
import logging, sys
fmt = "%(asctime)s|%(name)s|%(levelname)s|%(module)s|%(funcName)s|%(lineno)d|%(process)d|%(threadName)s|%(message)s"
logging.basicConfig(level=logging.INFO, format=fmt, stream=sys.stdout)
def demo(): logging.getLogger("shop.orders").info("all attrs")
demo()
2026-07-15 15:02:09,787|shop.orders|INFO|<string>|demo|5|82148|MainThread|all attrs
| Attribute | Gives you | Notes |
|---|---|---|
%(asctime)s |
2026-07-15 15:02:09,787 |
Comma-milliseconds unless you pass datefmt |
%(name)s |
shop.orders |
The logger name — the payoff of getLogger(__name__) |
%(levelname)s / %(levelno)s |
INFO / 20 |
%(levelname)-8s pads it into a neat column |
%(message)s |
The formatted message | msg % args, computed here and only here |
%(module)s / %(filename)s / %(pathname)s |
orders / orders.py / /full/path.py |
|
%(funcName)s / %(lineno)d |
demo / 5 |
Where the call was made |
%(process)d / %(threadName)s |
82148 / MainThread |
Essential once you’re concurrent |
%(exc_info)s |
— | ❌ Don’t. The traceback is appended automatically |
style="{" |
"{levelname} {name} {message}" |
str.format style, if you prefer braces |
A note on %(funcName)s: if you wrap logging in a helper, it will report your helper’s name, which is useless. stacklevel= (3.8+) fixes that by blaming the caller:
def helper(msg):  log.warning(msg)                    # funcName = 'helper'  <- useless
def helper2(msg): log.warning(msg, stacklevel=2)      # funcName = 'caller'  <- correct
WARNING helper:5 without stacklevel
WARNING caller:7 with stacklevel=2
3. dictConfig — for real applications
For an actual app, config belongs in data, not in a function — so you can load it from YAML/JSON and change verbosity without touching code. logging.config.dictConfig is the supported way:
import logging.config

logging.config.dictConfig({
    "version": 1,                          # always 1. It's the schema version
    "disable_existing_loggers": False,     # ⚠️ default True silently kills import-time loggers
    "formatters": {
        "console":  {"format": "%(levelname)-8s %(name)s: %(message)s"},
        "detailed": {"format": "%(asctime)s %(name)s %(levelname)s %(message)s",
                     "datefmt": "%Y-%m-%d %H:%M:%S"},
    },
    "handlers": {
        "stderr": {"class": "logging.StreamHandler", "level": "INFO",
                   "formatter": "console", "stream": "ext://sys.stdout"},
        "file":   {"class": "logging.handlers.RotatingFileHandler", "level": "DEBUG",
                   "formatter": "detailed", "filename": "app.log",
                   "maxBytes": 2000, "backupCount": 3, "encoding": "utf-8"},
    },
    "loggers": {
        "urllib3": {"level": "WARNING"},    # tame a noisy dependency, declaratively
    },
    "root": {"level": "DEBUG", "handlers": ["stderr", "file"]},
})

log = logging.getLogger("shop.orders")
log.debug("cart loaded id=%s", 42)                       # file only
log.info("order placed id=%s total=%s", 1001, 249.5)     # console + file
INFO shop.orders: order placed id=1001 total=249.5
$ cat app.log
2026-07-15 14:57:37 shop.orders DEBUG cart loaded id=42
2026-07-15 14:57:37 shop.orders INFO order placed id=1001 total=249.5
The DEBUG line is in the file and not on the console — the two gates, declared in data.
dictConfig key |
Purpose | Gotcha |
|---|---|---|
version |
Schema version | Must be 1. It’s the only legal value |
disable_existing_loggers |
Disable loggers created before this call | ⚠️ Defaults to True — set it False or your import-time module loggers go mute |
formatters |
Named format strings | Referenced by name from handlers |
handlers |
class, level, formatter, plus that class’s kwargs |
class is a dotted import path, as a string |
loggers |
Per-logger level, handlers, propagate |
Where you silence noisy libraries |
root |
The root logger’s level + handlers |
Everything propagates here |
ext://sys.stdout |
The “external object” syntax | How you name a Python object from JSON/YAML |
incremental |
Only apply levels to existing config | Rarely useful; usually you want a full re-config |
⚠️ disable_existing_loggers defaulting to True is the classic dictConfig mystery: every module that did log = logging.getLogger(__name__) at import time — i.e. all of them — gets disabled the moment you configure, and your app goes silent except for whatever you named explicitly. Set it to False unless you know you want otherwise.
Writing log calls that don’t hurt
Knowing the machinery isn’t the same as writing good log lines. Four habits separate logs that help from logs that are just noise with timestamps.
1. Lazy %s formatting, and the honest story about f-strings
logging takes a format string plus args, and applies the % only if a handler actually emits. Compare:
log.info("order placed id=%s total=%s", 1001, 249.5)   # ✅ lazy — % applied only if emitted
log.info(f"order placed id={1001} total={249.5}")      # ⚠️ f-string — built RIGHT NOW, always
The f-string is evaluated before log.info is even called. That work happens whether or not the level is enabled. Here’s the proof, with an object that announces when it’s stringified:
import logging, sys
logging.basicConfig(level=logging.WARNING, format="%(levelname)s %(message)s", stream=sys.stdout)
log = logging.getLogger("lazy")

class Expensive:
    def __str__(self):
        print("  !! __str__ ACTUALLY RAN (expensive) !!")
        return "expensive-result"

print("1) f-string at DEBUG (logger is at WARNING -> message dropped):")
log.debug(f"value={Expensive()}")      # __str__ runs ANYWAY — wasted
print("2) %s at DEBUG (dropped):")
log.debug("value=%s", Expensive())     # __str__ does NOT run
print("3) %s at WARNING (emitted):")
log.warning("value=%s", Expensive())   # __str__ runs, correctly
1) f-string at DEBUG (logger is at WARNING -> message dropped):
  !! __str__ ACTUALLY RAN (expensive) !!
2) %s at DEBUG (dropped):
3) %s at WARNING (emitted):
  !! __str__ ACTUALLY RAN (expensive) !!
WARNING value=expensive-result
Case 2 is the point: nothing happened at all. The record was never built, so __str__ was never called.
Now be honest about the size of this. Measured with timeit on a disabled DEBUG call with a 20-item dict as the argument:
| Call at a disabled level | Cost | vs lazy |
|---|---|---|
log.debug("processing %s", x) |
71.9 ns | baseline |
log.debug(f"processing {x}") |
1.21 µs | ~17× slower |
log.isEnabledFor(logging.DEBUG) |
33.2 ns | the manual guard |
Seventeen times slower sounds dramatic; 1.2 microseconds does not. At 1,000 log calls per second that’s 0.1% of one core — genuinely irrelevant. So let’s be clear-eyed: f-strings in log calls are extremely common, and in most code the cost is noise. You will see them in good codebases. If your team prefers them for readability, that is a defensible choice.
But prefer %s anyway, for three reasons that aren’t about microseconds:
- The hot path is real. A
log.debug()inside a loop that runs a million times, or one whose argument is a DataFrame, an ORM object, or anything with an expensive__repr__, turns “irrelevant” into seconds. You don’t want to audit which is which. - Security and injection. With
%s, user data goes intoargs, never into the template. A username of"%(asctime)s"or"{__class__}"is inert data. Interpolate untrusted input into the format string yourself and you’ve handed a user control of your format string — the logging equivalent of an injection bug, and the reason it’s a lint rule (W1203in pylint,G004in ruff). - Structured logging needs the template. JSON/aggregation tooling groups by the unformatted message: 10,000 records sharing
"order placed id=%s"collapse into one group with a count. Ten thousand distinct f-strings collapse into nothing.
And a happy side effect: a broken format string cannot crash your program. Logging catches it, complains on stderr, and carries on:
log.warning("user %s did %s", "vinod")   # too few args!
print("   ...program still alive")
--- Logging error ---
Traceback (most recent call last):
  ...
TypeError: not enough arguments for format string
Call stack:
  File "v10_lazy.py", line 18, in <module>
    log.warning("user %s did %s", "vinod")   # too few args!
Message: 'user %s did %s'
Arguments: ('vinod',)
   ...program still alive
An observability bug should never take down the thing it’s observing, and logging takes that seriously.
2. log.exception() — the single most useful call in this lesson
If you remember one line from this whole lesson, make it this one. Inside an except block, log.exception() logs your message plus the full traceback.
import logging, sys
logging.basicConfig(level=logging.DEBUG, format="%(asctime)s %(name)s %(levelname)s %(message)s",
                    stream=sys.stdout)
log = logging.getLogger(__name__)

def parse(v):
    return int(v)

try:
    parse("12a")
except ValueError:
    log.error("error(): no traceback, just this line")
    log.exception("exception(): full traceback, level ERROR")
2026-07-15 14:57:01,078 __main__ ERROR error(): no traceback, just this line
2026-07-15 14:57:01,078 __main__ ERROR exception(): full traceback, level ERROR
Traceback (most recent call last):
  File "/home/vinod/py-log-lab/v6_exc.py", line 10, in <module>
    parse("12a")
  File "/home/vinod/py-log-lab/v6_exc.py", line 7, in parse
    return int(v)
           ^^^^^^
ValueError: invalid literal for int() with base 10: '12a'
Look at what log.error() gave you: a sentence. You know something failed. You don’t know what failed, where, or why. Now look at log.exception(): the exception type, the message, the file, the line numbers, and the whole call chain — the difference between a bug report and a shrug.
The classic mistake is writing except Exception as e: log.error(f"failed: {e}"). That gives you failed: invalid literal for int() with base 10: '12a' — the message, but no traceback and no line number, so you have no idea which of the nine int() calls in that function blew up. It is the most common way people accidentally throw away the information they most need.
| Call | Level | Traceback? | Use where |
|---|---|---|---|
log.exception("msg") |
ERROR (fixed) | ✅ Yes | Inside except. The default choice |
log.error("msg", exc_info=True) |
ERROR | ✅ Yes | Identical to exception() — just explicit |
log.warning("msg", exc_info=True) |
WARNING | ✅ Yes | You recovered but want the traceback |
log.critical("msg", exc_info=True) |
CRITICAL | ✅ Yes | Fatal, on the way out |
log.error("msg") |
ERROR | ❌ No | You genuinely have no exception |
log.error(f"failed: {e}") |
ERROR | ❌ No | ❌ The anti-pattern. You threw the traceback away |
log.exception("msg") outside except |
ERROR | ⚠️ NoneType: None |
Meaningless — there’s no live exception |
log.error("msg", stack_info=True) |
ERROR | Stack, not traceback | “How did we get here?” with no exception |
One caveat worth its own line: log.exception() is hard-wired to ERROR. If you handled the problem and recovered, log.warning("retrying", exc_info=True) says so honestly. Reserve ERROR for “this operation failed.”
3. Structured (JSON) logging, briefly
Once your logs go to a cloud platform — CloudWatch, Stackdriver, Datadog, an ELK stack — a line of text is a liability. Something has to regex it back apart. Structured logging skips that: emit JSON, and every field is queryable (level:ERROR AND order_id:1004) with no parsing at all.
You don’t need a library for the basic version — a Formatter subclass does it:
import json, logging, sys

class JsonFormatter(logging.Formatter):
    def format(self, record: logging.LogRecord) -> str:
        payload = {
            "ts": self.formatTime(record, "%Y-%m-%dT%H:%M:%S"),
            "level": record.levelname,
            "logger": record.name,
            "msg": record.getMessage(),          # applies msg % args
            "line": record.lineno,
        }
        if record.exc_info:
            payload["exc"] = self.formatException(record.exc_info)
        if hasattr(record, "order_id"):          # anything passed via extra=
            payload["order_id"] = record.order_id
        return json.dumps(payload)

h = logging.StreamHandler(sys.stdout)
h.setFormatter(JsonFormatter())
log = logging.getLogger("shop.api")
log.setLevel(logging.INFO)
log.addHandler(h)
log.info("order placed total=%s", 249.5, extra={"order_id": 1001})
{"ts": "2026-07-15T14:59:11", "level": "INFO", "logger": "shop.api", "msg": "order placed total=249.5", "line": 24, "order_id": 1001}
The star is extra=: a dict whose keys become attributes on the LogRecord, so you can attach a request ID, a user ID, a trace ID to every line and query by it later. (⚠️ extra= keys must not collide with built-in record attributes — message, asctime, name, levelname and friends raise KeyError.) For production, structlog or python-json-logger do this properly; the point here is that it’s the same pipeline — just a different Formatter at the end of it.
4. Library vs application etiquette
This one is a rule, not a preference, and breaking it makes people hate your library.
An application configures logging. A library never does. If you’re writing code that someone else imports, you have no right to decide where their logs go, what format they’re in, or what level is interesting. You just log; they decide.
# In YOUR LIBRARY: mylib/__init__.py
import logging
logging.getLogger(__name__).addHandler(logging.NullHandler())   # the whole etiquette
# ❌ Never do this in library code:
logging.basicConfig(level=logging.DEBUG)      # you just hijacked the app's root logger
logging.getLogger().addHandler(...)           # ...and added a handler nobody asked for
print("mylib: connecting...")                 # ...and there's no way to switch it off
NullHandler is a handler that does nothing. Its only purpose is to stop the lastResort handler from printing your library’s warnings into the terminal of an app that never configured logging. It costs one line and it is the entire contract.
| Library code | Application code | |
|---|---|---|
getLogger(__name__) |
✅ Yes | ✅ Yes |
basicConfig() / dictConfig() |
❌ Never | ✅ Once, in the entry point |
addHandler(...) |
❌ Only NullHandler() |
✅ Yes |
setLevel(...) |
❌ Never — not your call | ✅ Yes |
print() for diagnostics |
❌ Never | ⚠️ For real output only |
| Configure at import time | ❌ Never | ❌ Do it in main(), not at import |
The flip side is your right as an application: you get to silence a noisy dependency, and the hierarchy makes it one line.
import logging, sys
logging.basicConfig(level=logging.DEBUG, format="%(name)s %(levelname)s %(message)s", stream=sys.stdout)
noisy = logging.getLogger("urllib3.connectionpool")
noisy.debug("Starting new HTTPS connection (1): api.example.com:443")

logging.getLogger("urllib3").setLevel(logging.WARNING)   # the parent gate covers all children
noisy.debug("this one is gone")
noisy.warning("but warnings still get through")
urllib3.connectionpool DEBUG Starting new HTTPS connection (1): api.example.com:443
urllib3.connectionpool WARNING but warnings still get through
Set your own app to DEBUG and you’ll find urllib3, botocore, matplotlib and asyncio burying you in their internals. One setLevel per library subtree, ideally in your dictConfig, and the noise is gone while your own DEBUG stays.
Debugging: breakpoint(), pdb, and walking the frames
Logging tells you what happened. A debugger lets you ask. The difference matters when the question is “what is in this dict right now?” — a question you cannot answer by adding another log line without another edit-run cycle.
Since Python 3.7 the entry point is a built-in:
breakpoint() # that's it. No import, no pdb.set_trace()
breakpoint() beats the old import pdb; pdb.set_trace() in three ways: nothing to import, it’s shorter, and — the real win — it obeys the PYTHONBREAKPOINT environment variable. PYTHONBREAKPOINT=0 makes every breakpoint() in your codebase a no-op, which is exactly what you want in CI. PYTHONBREAKPOINT=ipdb.set_trace routes them all to ipdb instead. It’s a level of indirection that pdb.set_trace() never had.
Drop one in and you land in the debugger, stopped, with the program alive around you:
> /home/vinod/py-log-lab/bp.py(3)parse_amount()
-> return float(raw.strip().replace(",", ""))
(Pdb)
That’s the prompt. > is the current frame — file, line number, function. -> is the line about to run (it has not executed yet). Now you can ask questions:
| Command | Short | Does |
|---|---|---|
list |
l |
Show source around the current line (-> marks it). Repeat for more |
longlist |
ll |
The whole current function. Usually what you wanted |
print expr |
p |
Evaluate and print. p o["amount"], p len(orders) — any expression |
pp expr |
pp |
Pretty-print (via pprint) — sorts dict keys, wraps big structures |
args |
a |
All arguments of the current frame |
whatis expr |
The type of an expression | |
next |
n |
Run the current line, stop at the next one in this function (steps over calls) |
step |
s |
Step into the call on this line |
until [line] |
unt |
Run until a line greater than the current one — escapes a loop |
return |
r |
Run until the current function returns |
continue |
c |
Resume until the next breakpoint (or the end) |
where |
w / bt |
The stack. > marks your frame. The most under-used command |
up |
u |
Move up one frame — to the caller |
down |
d |
Move back down |
break file:line |
b |
Set a breakpoint. b 42, b orders.py:9, b parse_amount |
break line, cond |
b |
Conditional: b 4, "a" in raw — stops only when it matters |
tbreak |
Same, but fires once then clears itself | |
clear / disable |
cl |
Remove / switch off breakpoints |
display expr |
Auto-print expr every time execution stops |
|
interact |
Drop into a full REPL with this frame’s variables. Exit with exit() |
|
quit |
q |
Kill the program (raises bdb.BdbQuit) |
help cmd |
h |
pdb’s own docs |
⚠️ The gotcha that catches everyone: pdb evaluates a bare name as a command first. Have a variable called c, n, s, p, l, r, or b? Typing n steps instead of showing your variable. Use p n — or !n — to force it to be Python.
Walking the frames is the actual skill
Here is the technique that makes a debugger worth learning, and it’s why w/u/d matter more than n. Suppose parse_amount crashed. You’re in its frame, so you can see raw — but raw doesn’t tell you which order it came from. That’s in the caller.
Watch what happens when you ask for the wrong frame’s variable:
> /home/vinod/py-log-lab/bp.py(3)parse_amount()
-> return float(raw.strip().replace(",", ""))
(Pdb) p raw
'249.50'
(Pdb) p o
*** NameError: name 'o' is not defined      <-- 'o' lives in total()'s frame, not here
(Pdb) w                                     <-- so LOOK at the stack
  /home/vinod/py-log-lab/bp.py(12)<module>()
-> print(total(ORDERS))
  /home/vinod/py-log-lab/bp.py(8)total()
-> running += parse_amount(o["amount"])
> /home/vinod/py-log-lab/bp.py(3)parse_amount()
-> return float(raw.strip().replace(",", ""))
(Pdb) u                                     <-- move UP into total()
> /home/vinod/py-log-lab/bp.py(8)total()
-> running += parse_amount(o["amount"])
(Pdb) p o                                   <-- now it exists
{'id': 1001, 'amount': '249.50'}
(Pdb) p o["id"]
1001
That NameError isn’t a bug — it is the frame model working. Each frame has its own locals, and p only sees the frame you’re standing in. w shows you the whole call chain, u walks toward the caller, d walks back. This is how you answer “which input caused this?” — the crash is in the leaf, the cause is usually two frames up. (If frames and the call stack are still hazy, the Functions lesson builds that model properly.)
Conditional breakpoints: stop only when it’s broken
breakpoint() inside a loop over 40,000 rows is a punishment — you’d press c all afternoon. Set a condition and the debugger does the searching:
$ python3 -m pdb orders.py
(Pdb) b 4, not raw.strip().replace(",","").replace(".","").isdigit()
Breakpoint 1 at /home/vinod/py-log-lab/orders.py:4
(Pdb) c
> /home/vinod/py-log-lab/orders.py(4)parse_amount()
-> return float(raw.strip().replace(",", ""))
(Pdb) p raw
'12a.00'                                    <-- straight to the bad row
(Pdb) u
> /home/vinod/py-log-lab/orders.py(9)total()
-> running += parse_amount(o["amount"])
(Pdb) pp o
{'amount': '12a.00', 'id': 1004}            <-- the culprit, by id
(Pdb) p [x["id"] for x in orders]
[1001, 1002, 1003, 1004]
One c and we’re standing on the bad row with its id. Notice pp sorted the dict’s keys alphabetically (amount before id) while p earlier showed insertion order — that’s pprint at work, and on a big nested structure it’s the difference between readable and not.
interact goes further: it drops you into a real REPL with the frame’s variables loaded, so you can try a fix before you write it.
(Pdb) interact
*interactive*
>>> sorted(o.keys())
['amount', 'id']
>>> exit()
(Pdb)
Post-mortem: debug the crash you already had
Best-kept secret in the standard library. Your program crashed, the stack is gone — except it isn’t. Post-mortem debugging rewinds you to the exact moment of the exception, with every frame intact. No re-run, no breakpoint(), no guessing where to put one:
$ python3 -m pdb -c continue orders.py
Traceback (most recent call last):
  ...
ValueError: could not convert string to float: '12a.00'
Uncaught exception. Entering post mortem debugging
Running 'cont' or 'step' will restart the program
> /home/vinod/py-log-lab/orders.py(4)parse_amount()
-> return float(raw.strip().replace(",", ""))
(Pdb) p raw
'12a.00'
(Pdb) u
> /home/vinod/py-log-lab/orders.py(9)total()
-> running += parse_amount(o["amount"])
(Pdb) p o
{'id': 1004, 'amount': '12a.00'}
(Pdb) u
> /home/vinod/py-log-lab/orders.py(13)average()
-> return total(orders) / len(orders)
(Pdb) p len(orders)
4
-c continue means “run to the crash, then hand me the wreckage.” Three commands and we have the bad value, the row it came from, and the fact that the caller thinks there are 4 orders. Compare that to adding a print and re-running.
| Entry point | Use when |
|---|---|
breakpoint() in the source |
You know roughly where to look. The everyday tool |
python3 -m pdb script.py |
Start under the debugger, from line 1 — set breakpoints before anything runs |
python3 -m pdb -c continue script.py |
✅ Run to the crash, then post-mortem. Best default for a crash |
python3 -m pdb -c "b 42" -c continue s.py |
Pre-load commands before it runs |
import pdb; pdb.post_mortem() |
In an except, or on sys.last_traceback in a REPL |
pdb.pm() |
In a REPL right after a crash — post-mortem on the last traceback |
python3 -i script.py |
Crash → interactive prompt with globals (then import pdb; pdb.pm()) |
PYTHONBREAKPOINT=0 python3 app.py |
Disable every breakpoint() — CI, production |
PYTHONBREAKPOINT=ipdb.set_trace |
Route every breakpoint() to a nicer debugger |
One honest note about -m pdb: because pdb is running your script, w will show pdb’s own internal frames (pdb.py, bdb.py, <string>) above yours. That’s cosmetic — your frames are at the bottom, where you’d read them anyway. breakpoint() gives a clean stack with none of that.
Debugging strategy: the loop that actually finds bugs
Tools are the easy half. When debugging feels awful, the cause is almost never the tool — it’s changing things before you understand the problem. Here is the loop professionals run; the discipline is not skipping steps.
| Step | Do | The failure mode it prevents |
|---|---|---|
| 1. Reproduce | Get a reliable, minimal command that fails every time. Write it down | “Fixing” something you can’t observe, and never knowing if you did |
| 2. Read the traceback — bottom-up | Last line = ExceptionType: message. Then the lowest frame in your own code |
Skimming the top, panicking, guessing |
| 3. Isolate (bisect) | Halve the search space: comment half the data, git bisect, delete inputs until it stops failing |
Reading 400 lines hoping to spot it |
| 4. Form a hypothesis | Say it out loud, falsifiably: “o['amount'] for id 1004 is not numeric” |
“Something’s wrong with the parsing” — untestable, so unfixable |
| 5. Test exactly ONE thing | One change. p raw, one log line, one conditional breakpoint |
Changing five things, it works, you don’t know why |
| 6. Verify the fix | Re-run step 1’s command. Then run the whole suite | Fixing the symptom; breaking two other things |
| 7. Keep the evidence | Turn the good print into a log.debug; add a test for the bad row |
Doing this whole dance again in three months |
Step 2 deserves expansion, because reading a traceback is a learnable skill and most beginners read them backwards. Python prints the traceback oldest-call-first, so the actual crash is the LAST frame, and the error is the LAST line. Read it bottom-up:
Traceback (most recent call last):
  File "/home/vinod/py-log-lab/orders.py", line 23, in <module>
    print(f"average = {average(ORDERS):.2f}")     # 4th: where it all started
  File "/home/vinod/py-log-lab/orders.py", line 13, in average
    return total(orders) / len(orders)            # 3rd: called through here
  File "/home/vinod/py-log-lab/orders.py", line 9, in total
    running += parse_amount(o["amount"])          # 2nd: ...and here  <- often the REAL fix site
  File "/home/vinod/py-log-lab/orders.py", line 4, in parse_amount
    return float(raw.strip().replace(",", ""))    # 1st: it blew up HERE
           ^^^^^^^^^^^^^^^^^^^^^^^^^^^^^^^^^^^
ValueError: could not convert string to float: '12a.00'
Read it in this order: (a) the last line — what went wrong (ValueError) and the value ('12a.00'); (b) the frame just above it — where (parse_amount, line 4), and note those ^^^^ carets, which since 3.11 point at the exact sub-expression; © now walk up to the lowest frame you actually wrote — because parse_amount is probably fine, and the bug is that total fed it a bad row. The crash site and the fix site are frequently different functions, and steps (b) and © are how you tell them apart.
assert is not validation
assert looks like a cheap way to check inputs. It is not, and this is a genuine security footgun:
def withdraw(balance: float, amount: float) -> float:
    assert amount > 0, "amount must be positive"      # NOT validation!
    return balance - amount
$ python3 v12_assert.py
AssertionError: amount must be positive               # looks like it works...

$ python3 -O v12_assert.py
with -O: 150 <- the check VANISHED, money created
__debug__ = False
The -O flag strips every assert statement at compile time. Not “skips” — they aren’t in the bytecode at all. withdraw(100, -50) now returns 150, cheerfully inventing ₹50. Anything you rely on for correctness, security, or input validation must be a real if ... raise:
def withdraw(balance: float, amount: float) -> float:
    if amount <= 0:
        raise ValueError(f"amount must be positive, got {amount}")   # survives -O
    return balance - amount
Use assert for |
Use if ... raise for |
|---|---|
| Internal invariants you believe are always true | Anything from a user, a file, a request, an API |
| “This can’t happen” sanity checks | Input validation of any kind |
| Cheap contracts in your own code | Security or permission checks |
| Test assertions (pytest rewrites them) | Business rules (amount > 0, balance >= amount) |
| Documenting an assumption in-line | Anything whose absence changes behaviour |
The rule: an assert states something you believe is already true. A validation checks something you fear might be false. Never let money, permissions, or data integrity depend on a statement the interpreter is allowed to delete.
pdb vs an IDE debugger
Let’s not be romantic about the terminal. An IDE debugger is genuinely better for most day-to-day work:
pdb / breakpoint() |
IDE debugger (VS Code, PyCharm) | |
|---|---|---|
| Setup | Zero. It’s in the stdlib | Config, a launch profile, sometimes a fight |
| Breakpoints | Typed, or a breakpoint() line |
✅ Click in the gutter, no source edit |
| Watching variables | p x each time (or display x) |
✅ A live panel, always current |
| Reading the stack | w, u, d |
✅ Clickable frames |
| Over SSH / in a container / on a server | ✅ Works. Nothing else does | ❌ Needs remote-debug plumbing |
| CI / a colleague’s machine | ✅ Always there | ❌ Not installed |
| Post-mortem on a crash | ✅ -m pdb -c continue |
✅ Usually (“break on exception”) |
| Conditional breakpoints | ✅ b 4, cond |
✅ In a dialog |
| Learning curve | A command table (see above) | Mostly obvious |
| Debugging a one-file script fast | ✅ breakpoint(), done |
Slight overhead |
Use the IDE at your desk on your own project — it’s faster, and the live variable panel is worth a lot. Learn pdb because it’s the one that’s always there: on the production box at 03:00, inside a container with no editor, over SSH, in CI. It’s the crowbar in the boot of the car — you hope not to need it; you’d hate not to have it.
Hands-on lab
You’ll take a small buggy script, “debug” it with prints and feel the pain, replace them with real logging (console at INFO + a rotating file at DEBUG), capture a traceback with log.exception(), and then use pdb to find a second, silent bug that logging alone will not catch. Everything is stdlib — no pip install, no venv needed. About 15 minutes.
Step 1 — Make a lab directory and check your Python.
mkdir ~/py-log-lab && cd ~/py-log-lab
python3 -V
# Python 3.12.3        # any 3.12+ is fine. On Windows use: py -3 -V
What just happened: Your cwd is ~/py-log-lab, so app.log will be written right here in Step 4.
Step 2 — The buggy script (orders.py). Run it and read the traceback.
# orders.py — compute the average order value. It has one bug. (Actually two.)
def parse_amount(raw: str) -> float:
    """'1,199.00' -> 1199.0"""
    return float(raw.strip().replace(",", ""))

def total(orders: list[dict]) -> float:
    running = 0.0
    for o in orders:
        running += parse_amount(o["amount"])
    return running

def average(orders: list[dict]) -> float:
    return total(orders) / len(orders)

ORDERS = [
    {"id": 1001, "amount": "249.50"},
    {"id": 1002, "amount": "1,199.00"},
    {"id": 1003, "amount": " 75.25 "},
    {"id": 1004, "amount": "12a.00"},
]

if __name__ == "__main__":
    print(f"average = {average(ORDERS):.2f}")
$ python3 orders.py
Traceback (most recent call last):
  File "/home/vinod/py-log-lab/orders.py", line 23, in <module>
    print(f"average = {average(ORDERS):.2f}")
                       ^^^^^^^^^^^^^^^
  File "/home/vinod/py-log-lab/orders.py", line 13, in average
    return total(orders) / len(orders)
           ^^^^^^^^^^^^^
  File "/home/vinod/py-log-lab/orders.py", line 9, in total
    running += parse_amount(o["amount"])
               ^^^^^^^^^^^^^^^^^^^^^^^^^
  File "/home/vinod/py-log-lab/orders.py", line 4, in parse_amount
    return float(raw.strip().replace(",", ""))
           ^^^^^^^^^^^^^^^^^^^^^^^^^^^^^^^^^^^
ValueError: could not convert string to float: '12a.00'
What just happened: Practise step 2 of the strategy — read it bottom-up. Last line: ValueError, and the offending value '12a.00'. Frame above: parse_amount, line 4. Then walk up: total → average → <module>. You know the what; you don’t yet know which order.
Step 3 — “Debug” it with prints, and feel the pain (orders_print.py).
# orders_print.py — the way you've been doing it
def parse_amount(raw: str) -> float:
    print("parse_amount", raw)            # no time, no module, no level
    return float(raw.strip().replace(",", ""))

def total(orders: list[dict]) -> float:
    running = 0.0
    for o in orders:
        print("loop", o)                  # can't switch this off
        running += parse_amount(o["amount"])
    return running

ORDERS = [
    {"id": 1001, "amount": "249.50"},
    {"id": 1002, "amount": "1,199.00"},
    {"id": 1003, "amount": " 75.25 "},
    {"id": 1004, "amount": "12a.00"},
]
if __name__ == "__main__":
    print(f"average = {total(ORDERS) / len(ORDERS):.2f}")
$ python3 orders_print.py
loop {'id': 1001, 'amount': '249.50'}
parse_amount 249.50
loop {'id': 1002, 'amount': '1,199.00'}
parse_amount 1,199.00
loop {'id': 1003, 'amount': ' 75.25 '}
parse_amount  75.25
loop {'id': 1004, 'amount': '12a.00'}
parse_amount 12a.00
Traceback (most recent call last):
  ...
ValueError: could not convert string to float: '12a.00'
What just happened: It worked — order 1004 is the bad one. Now notice the cost: 8 lines of noise for 4 orders (scale that to 40,000), no timestamps, no source, no severity, it’s on stdout mixed with real output, and you must now delete every one of these lines before committing. Do that and you’ll re-add them next month.
Step 4 + 5 — Real logging, and log.exception() (orders_log.py).
# orders_log.py — console INFO + rotating file DEBUG, named logger, and log.exception
import logging
import sys
from logging.handlers import RotatingFileHandler

log = logging.getLogger(__name__)          # "__main__" here; "shop.orders" once imported

def setup_logging() -> None:
    """Wire Logger -> Handlers -> Formatters. Call ONCE, from the entry point."""
    root = logging.getLogger()             # configure ROOT; children propagate to it
    root.setLevel(logging.DEBUG)           # gate 1: let everything through

    console = logging.StreamHandler(sys.stdout)
    console.setLevel(logging.INFO)         # gate 2: humans see INFO+
    console.setFormatter(logging.Formatter("%(levelname)-8s %(name)s: %(message)s"))

    logfile = RotatingFileHandler("app.log", maxBytes=50_000, backupCount=3, encoding="utf-8")
    logfile.setLevel(logging.DEBUG)        # gate 2: the file keeps EVERYTHING
    logfile.setFormatter(logging.Formatter(
        "%(asctime)s %(name)s %(levelname)s %(message)s", datefmt="%Y-%m-%d %H:%M:%S"))

    root.addHandler(console)
    root.addHandler(logfile)

def parse_amount(raw: str) -> float:
    log.debug("parse_amount raw=%r", raw)          # lazy %s, %r shows the quotes
    return float(raw.strip().replace(",", ""))

def total(orders: list[dict]) -> float:
    running = 0.0
    for o in orders:
        try:
            running += parse_amount(o["amount"])
        except ValueError:
            log.exception("bad amount on order id=%s - skipping", o["id"])   # traceback!
    return running

ORDERS = [
    {"id": 1001, "amount": "249.50"},
    {"id": 1002, "amount": "1,199.00"},
    {"id": 1003, "amount": " 75.25 "},
    {"id": 1004, "amount": "12a.00"},
]

if __name__ == "__main__":
    setup_logging()
    log.info("starting run orders=%s", len(ORDERS))
    log.info("average = %.2f", total(ORDERS) / len(ORDERS))
$ python3 orders_log.py
INFO     __main__: starting run orders=4
ERROR    __main__: bad amount on order id=1004 - skipping
Traceback (most recent call last):
  File "/home/vinod/py-log-lab/orders_log.py", line 33, in total
    running += parse_amount(o["amount"])
               ^^^^^^^^^^^^^^^^^^^^^^^^^
  File "/home/vinod/py-log-lab/orders_log.py", line 27, in parse_amount
    return float(raw.strip().replace(",", ""))
           ^^^^^^^^^^^^^^^^^^^^^^^^^^^^^^^^^^^
ValueError: could not convert string to float: '12a.00'
INFO     __main__: average = 380.94
What just happened: The console shows no DEBUG lines — gate 2 on the console handler stopped them, even though the logger is at DEBUG. The script didn’t crash: log.exception recorded the failure with the full traceback and named the culprit (id=1004), and the run finished. Every line has a level and a source.
Step 5b — Now look in the file.
cat app.log
2026-07-15 14:59:56 __main__ INFO starting run orders=4
2026-07-15 14:59:56 __main__ DEBUG parse_amount raw='249.50'
2026-07-15 14:59:56 __main__ DEBUG parse_amount raw='1,199.00'
2026-07-15 14:59:56 __main__ DEBUG parse_amount raw=' 75.25 '
2026-07-15 14:59:56 __main__ DEBUG parse_amount raw='12a.00'
2026-07-15 14:59:56 __main__ ERROR bad amount on order id=1004 - skipping
Traceback (most recent call last):
  File "/home/vinod/py-log-lab/orders_log.py", line 33, in total
    running += parse_amount(o["amount"])
               ^^^^^^^^^^^^^^^^^^^^^^^^^
  File "/home/vinod/py-log-lab/orders_log.py", line 27, in parse_amount
    return float(raw.strip().replace(",", ""))
           ^^^^^^^^^^^^^^^^^^^^^^^^^^^^^^^^^^^
ValueError: could not convert string to float: '12a.00'
2026-07-15 14:59:56 __main__ INFO average = 380.94
What just happened: One log.debug() call, two different fates. The file has full timestamps, every DEBUG line, and the traceback — the console had none of the DEBUG. That is the two-gate design paying off. Also note %r (not %s) in the debug line: it printed ' 75.25 ' with its quotes, revealing leading/trailing whitespace that %s would have hidden. Use %r for anything whose exact shape matters.
Step 6 — The bug logging can’t see. Is 380.94 right?
Do the arithmetic by hand: three orders parsed — 249.50, 1199.00, 75.25 — summing to 1523.75. And 1523.75 / 3 = 507.92, not 380.94. The except handler skipped the bad row but average still divided by len(orders) — 4. We “fixed” the crash and silently produced a wrong number, which is worse than crashing. No log line will tell you this. Time for pdb.
Step 6a — Post-mortem on the original crash: python3 -m pdb -c continue orders.py.
$ python3 -m pdb -c continue orders.py
...
ValueError: could not convert string to float: '12a.00'
Uncaught exception. Entering post mortem debugging
Running 'cont' or 'step' will restart the program
> /home/vinod/py-log-lab/orders.py(4)parse_amount()
-> return float(raw.strip().replace(",", ""))
(Pdb) p raw
'12a.00'
(Pdb) u
> /home/vinod/py-log-lab/orders.py(9)total()
-> running += parse_amount(o["amount"])
(Pdb) p o
{'id': 1004, 'amount': '12a.00'}
(Pdb) u
> /home/vinod/py-log-lab/orders.py(13)average()
-> return total(orders) / len(orders)
(Pdb) p len(orders)
4
(Pdb) q
What just happened: No breakpoint(), no re-run, no edit — -c continue ran to the crash and handed you the live wreckage. p raw gave the value, u walked up to the caller where p o finally worked (it doesn’t exist in parse_amount’s frame), and one more u revealed len(orders) is 4. That’s the second bug, spotted from the stack.
Step 6b — Prove it with breakpoint() (orders_pdb.py).
# orders_pdb.py — the console said average = 380.94. Is it?
def parse_amount(raw: str) -> float:
    return float(raw.strip().replace(",", ""))

def total(orders: list[dict]) -> float:
    running = 0.0
    for o in orders:
        try:
            running += parse_amount(o["amount"])
        except ValueError:
            continue                       # silently skipped!
    return running

def average(orders: list[dict]) -> float:
    breakpoint()                           # <-- drop in here
    return total(orders) / len(orders)

ORDERS = [
    {"id": 1001, "amount": "249.50"},
    {"id": 1002, "amount": "1,199.00"},
    {"id": 1003, "amount": " 75.25 "},
    {"id": 1004, "amount": "12a.00"},
]
if __name__ == "__main__":
    print(f"average = {average(ORDERS):.2f}")
Run it and type these four commands:
$ python3 orders_pdb.py
> /home/vinod/py-log-lab/orders_pdb.py(16)average()
-> return total(orders) / len(orders)
(Pdb) p len(orders)
4
(Pdb) p total(orders)
1523.75
(Pdb) p total(orders) / len(orders)
380.9375
(Pdb) p [o["id"] for o in orders]
[1001, 1002, 1003, 1004]
(Pdb) c
average = 380.94
What just happened: The hypothesis — “we’re dividing a 3-order sum by 4” — is now a measured fact: total returns 1523.75 (three orders’ worth) while len(orders) is 4. Note you can call functions from p, which is how you test a fix without editing anything. That’s step 5 of the strategy: one hypothesis, one test.
Step 7 — Fix it and verify (orders_fixed.py).
The fix: average over the rows that actually parsed, and log the ratio so this can never hide again.
# orders_fixed.py — average over the rows that actually PARSED
import logging, sys
from logging.handlers import RotatingFileHandler

log = logging.getLogger(__name__)

def setup_logging() -> None:
    root = logging.getLogger()
    root.setLevel(logging.DEBUG)
    console = logging.StreamHandler(sys.stdout)
    console.setLevel(logging.INFO)
    console.setFormatter(logging.Formatter("%(levelname)-8s %(name)s: %(message)s"))
    logfile = RotatingFileHandler("app.log", maxBytes=50_000, backupCount=3, encoding="utf-8")
    logfile.setLevel(logging.DEBUG)
    logfile.setFormatter(logging.Formatter(
        "%(asctime)s %(name)s %(levelname)s %(message)s", datefmt="%Y-%m-%d %H:%M:%S"))
    root.addHandler(console)
    root.addHandler(logfile)

def parse_amount(raw: str) -> float:
    log.debug("parse_amount raw=%r", raw)
    return float(raw.strip().replace(",", ""))

def parsed_amounts(orders: list[dict]) -> list[float]:
    """Return only the amounts that parsed - and log the ones that didn't."""
    good = []
    for o in orders:
        try:
            good.append(parse_amount(o["amount"]))
        except ValueError:
            log.exception("bad amount on order id=%s - skipping", o["id"])
    return good

def average(orders: list[dict]) -> float:
    amounts = parsed_amounts(orders)
    if not amounts:
        raise ValueError("no parseable orders")     # a real check, not an assert
    log.info("parsed %s/%s orders", len(amounts), len(orders))
    return sum(amounts) / len(amounts)              # divide by what PARSED

ORDERS = [
    {"id": 1001, "amount": "249.50"},
    {"id": 1002, "amount": "1,199.00"},
    {"id": 1003, "amount": " 75.25 "},
    {"id": 1004, "amount": "12a.00"},
]
if __name__ == "__main__":
    setup_logging()
    log.info("average = %.2f", average(ORDERS))
$ python3 orders_fixed.py
ERROR    __main__: bad amount on order id=1004 - skipping
Traceback (most recent call last):
  File "/home/vinod/py-log-lab/orders_fixed.py", line 29, in parsed_amounts
    good.append(parse_amount(o["amount"]))
                ^^^^^^^^^^^^^^^^^^^^^^^^^
  File "/home/vinod/py-log-lab/orders_fixed.py", line 22, in parse_amount
    return float(raw.strip().replace(",", ""))
           ^^^^^^^^^^^^^^^^^^^^^^^^^^^^^^^^^^^
ValueError: could not convert string to float: '12a.00'
INFO     __main__: parsed 3/4 orders
INFO     __main__: average = 507.92
What just happened: 507.92 — the right answer, and parsed 3/4 orders now makes the silent skip visible on every run. That’s step 7: the evidence stays in the code as a log line, at the right level, forever. The breakpoint() is gone; the knowledge isn’t.
Step 8 — Prove PYTHONBREAKPOINT=0 (the CI trick).
PYTHONBREAKPOINT=0 python3 orders_pdb.py    # Windows: set PYTHONBREAKPOINT=0
# average = 380.94                          # ran straight through — no debugger
What just happened: Every breakpoint() in the codebase became a no-op, without editing a line. This is what you set in CI so a forgotten breakpoint() can’t hang the build.
⚠️ Cleanup deletes the whole lab folder. Check the path before you press Enter —
rm -rfhas no undo.
cd ~ && rm -rf ~/py-log-lab # Windows: rmdir /s /q %USERPROFILE%\py-log-lab
Common mistakes and troubleshooting
| Symptom / traceback | Cause | Fix |
|---|---|---|
logging.info("hi") prints nothing |
The root logger’s level is WARNING — the record dies at gate 1 |
logging.basicConfig(level=logging.INFO) before any log call |
Logger is at DEBUG and you still see nothing |
The handler has its own level (gate 2). Both must pass | handler.setLevel(logging.DEBUG) too. See the two-gate matrix |
basicConfig(...) is silently ignored |
Root already had handlers — often from an earlier logging.info(...), which calls basicConfig() implicitly |
Configure first, before any log call; or basicConfig(..., force=True) (3.8+) |
| Every line printed twice (or 3×) | A handler was added twice (setup() called on re-import, or in a notebook cell run twice) |
Guard: if not log.handlers:, or basicConfig(force=True), or configure once in main() |
| Duplicate lines with different formats | Propagation: handlers at two levels of the dotted chain both ran | Expected behaviour. Set propagate = False, or don’t add the second handler |
| No traceback in the log, just a message | You used log.error("failed: %s", e) instead of log.exception(...) |
log.exception("failed") inside the except — or exc_info=True |
log.exception() logs NoneType: None |
Called outside an except block — there’s no live exception |
Only call it inside except |
Logs missing from python app.py > out.txt |
StreamHandler writes to stderr, not stdout |
2> out.txt, or &> out.txt, or StreamHandler(sys.stdout) |
Nothing on the console after basicConfig(filename=...) |
filename= and stream= are mutually exclusive — the file wins |
Use handlers=[...] with both a StreamHandler and a file handler |
| The log file never rotates, disk fills | RotatingFileHandler defaults: maxBytes=0, backupCount=0 = never rotate |
Pass both: maxBytes=50_000, backupCount=3 |
App goes silent right after dictConfig(...) |
disable_existing_loggers defaults to True, killing every import-time getLogger(__name__) |
"disable_existing_loggers": False |
| A third-party library floods you with DEBUG | You set root to DEBUG; urllib3/botocore/matplotlib inherit it |
logging.getLogger("urllib3").setLevel(logging.WARNING) — one line per subtree |
--- Logging error --- + TypeError: not enough arguments for format string |
Mismatched %s placeholders and args |
Count them. Note: logging swallows this — your app keeps running |
KeyError: "Attempt to overwrite 'message' in LogRecord" |
An extra= key collided with a built-in record attribute |
Rename it (msg → detail); avoid message, asctime, name, levelname, args |
f-string log call flagged by the linter (W1203/G004) |
log.info(f"...") formats eagerly, always |
log.info("x=%s", x) — lazy, and safe from format-string injection |
A hot-path log.debug(f"{df}") makes things crawl |
The f-string builds even when DEBUG is off | Lazy %s, or guard with if log.isEnabledFor(logging.DEBUG): |
CI job hangs, or dies with bdb.BdbQuit |
A forgotten breakpoint(). With no tty it waits forever; with stdin at EOF it raises BdbQuit |
PYTHONBREAKPOINT=0 in CI; lint for breakpoint( (ruff T100) |
pdb: typing n shows nothing about your variable n |
Bare names are commands first (n, s, c, l, p, r, b, a, q, u, d) |
p n — or !n to force Python |
pdb: *** NameError: name 'o' is not defined |
o lives in the caller’s frame, not the one you’re in |
w to see the stack, then u to go up |
| Validation vanishes in production | assert is stripped by python -O (__debug__ is False) |
if not ok: raise ValueError(...) — never assert for real checks |
| Logger has no handlers, but a bare sentence appears | logging.lastResort (_StderrHandler, level WARNING, no formatter) |
Configure logging; libraries should addHandler(NullHandler()) |
| Memory grows with a logger per object | Loggers are cached forever in the manager and never GC’d | One logger per module, at module level |
Three of these deserve more than a table row.
1. “My logging.info() does nothing” is two bugs wearing one coat. The obvious one is the root logger’s WARNING default. The evil one is that logging.info(...) — the module-level shortcut — calls basicConfig() for you if root has no handlers. So the very act of testing whether logging works can install a default handler and make your real basicConfig(level=DEBUG, format=...) a permanent no-op, silently. You’ll stare at the basicConfig line for an hour; the culprit is a line above it. Two habits immunise you: configure logging once, first, in your entry point, and never use the module-level logging.info/warning/error functions in an application — always log = logging.getLogger(__name__).
2. Duplicate log lines are propagation, not a bug. Records bubble up the dotted hierarchy and run every ancestor’s handlers. Two lines means two handlers saw the record — usually because your setup_logging() ran twice (a re-imported module, a notebook cell, a test fixture) and stacked handlers on the same logger, or because you added a handler to both shop and root. Diagnose it in one line: print(logging.getLogger("shop").handlers). If that list has grown, you’re adding handlers repeatedly — guard the setup or use force=True. If it hasn’t, you have handlers at two levels of the chain: set propagate = False on the lower one, or (better) only ever attach handlers at root.
3. log.error(f"failed: {e}") is how good tracebacks die. It looks responsible — you caught the exception, you logged something. But {e} renders only the exception’s message. You lose the type, the file, the line number, and the entire call chain. Six months later the log says failed: invalid literal for int() with base 10: '12a' and there are nine int() calls in that module and no way to tell which. log.exception("failed") costs the same keystrokes and keeps everything. Make it muscle memory: the word except should make your fingers type log.exception.
Cheat-sheet
| logging — setup | What it does |
|---|---|
log = logging.getLogger(__name__) |
✅ The idiom. Top of every module, once |
logging.basicConfig(level=logging.INFO) |
One-line setup for a script. ⚠️ No-op if root has handlers |
logging.basicConfig(..., force=True) |
Wipe existing root handlers first (3.8+) |
logging.basicConfig(..., handlers=[h1, h2]) |
Multiple destinations, still one call |
logging.config.dictConfig({...}) |
✅ Real apps. Config as data. Set disable_existing_loggers: False |
logging.StreamHandler(sys.stdout) |
Console. Default is sys.stderr |
RotatingFileHandler(p, maxBytes=50_000, backupCount=3) |
Size-based rotation. ⚠️ Defaults 0, 0 = never rotates |
TimedRotatingFileHandler(p, when="midnight", backupCount=7) |
Time-based rotation |
logging.NullHandler() |
Libraries only — the etiquette |
h.setFormatter(logging.Formatter(fmt, datefmt=...)) |
Formatters go on handlers, never loggers |
"%(asctime)s %(name)s %(levelname)s %(message)s" |
The sane default format |
logger.setLevel(...) / handler.setLevel(...) |
Gate 1 / Gate 2 — a record needs BOTH |
logging.getLogger("urllib3").setLevel(logging.WARNING) |
Silence a noisy library’s whole subtree |
logger.propagate = False |
Stop records bubbling to ancestors |
logging.disable(logging.CRITICAL) |
Kill all logging globally (tests) |
| logging — calling | What it does |
|---|---|
log.debug/info/warning/error/critical(msg) |
10 / 20 / 30 / 40 / 50. Root defaults to WARNING |
log.info("id=%s total=%s", 1001, 249.5) |
✅ Lazy — % applied only if emitted (72 ns vs 1.21 µs) |
log.info(f"id={x}") |
⚠️ Eager. Common, usually fine, wrong in a hot path |
log.debug("raw=%r", raw) |
%r = repr — reveals quotes and whitespace |
log.exception("msg") |
✅ Inside except. Message + full traceback, at ERROR |
log.warning("msg", exc_info=True) |
Traceback at a level of your choosing |
log.error("msg", stack_info=True) |
“How did we get here?” with no exception |
log.info("msg", extra={"order_id": 1001}) |
Attach fields to the record (structured logging) |
log.warning(msg, stacklevel=2) |
Blame the caller — for logging helpers |
log.isEnabledFor(logging.DEBUG) |
Guard a genuinely expensive debug block |
log.getEffectiveLevel() |
The inherited level actually in force |
| debugging | What it does |
|---|---|
breakpoint() |
✅ 3.7+. Drop into pdb. No import needed |
PYTHONBREAKPOINT=0 python3 app.py |
Disable every breakpoint() — use in CI |
PYTHONBREAKPOINT=ipdb.set_trace |
Route them all to another debugger |
python3 -m pdb -c continue app.py |
✅ Run to the crash → post-mortem |
import pdb; pdb.pm() |
Post-mortem on the last traceback (in a REPL) |
l / ll |
List source / the whole current function |
p expr / pp expr |
Print / pretty-print (sorts dict keys). Any expression |
a |
The current frame’s arguments |
n / s / r / c |
Next line / step into / run to return / continue |
unt |
Run until a later line — escapes a loop |
w |
✅ The stack. > marks your frame |
u / d |
Up to the caller / back down. The real superpower |
b file:line / b 42, cond |
Breakpoint / conditional breakpoint |
tbreak / cl |
One-shot breakpoint / clear breakpoints |
display expr |
Auto-print expr at every stop |
interact |
Full REPL in this frame. exit() to return |
q |
Quit (raises bdb.BdbQuit) |
p n or !n |
Force a variable named like a command |
assert x > 0 |
⚠️ Stripped by python -O. Never for validation |
if not ok: raise ValueError(...) |
✅ Real validation — survives -O |
python3 -X dev app.py |
Dev mode: extra warnings, ResourceWarning, faulthandler |
Interview and exam questions
Q: Why is logging better than print for anything non-trivial? Give four concrete reasons.
A: (1) Levels — one dial changes verbosity without editing code, so the same binary can run quiet in production and loud during an incident. (2) Context for free — %(asctime)s, %(name)s, %(funcName)s, %(lineno)d on every line, so you know when, where and who. (3) Destinations — the same call can go to a console at INFO and a rotating file at DEBUG, plus syslog/JSON/HTTP, and print goes to stdout where it pollutes your real output. (4) It’s meant to stay — you don’t delete it before committing, so the diagnostics are still there next year. Bonus: log.exception() captures tracebacks, and you can silence a noisy dependency without touching its code.
Q: I called logging.info("hello") and nothing printed. Why?
A: The root logger’s default level is WARNING (30), and INFO is 20, so the record fails the level check and is discarded before a LogRecord is even created. Fix with logging.basicConfig(level=logging.INFO) before any log call. The nastier version: that logging.info(...) call itself implicitly ran basicConfig() (module-level shortcuts do this when root has no handlers), so a later explicit basicConfig(level=DEBUG, ...) is a silent no-op — because basicConfig does nothing if root already has handlers. Use force=True, or better, configure once at the top of your entry point.
Q: Explain the Logger / Handler / Formatter split, and where levels apply.
A: A Logger is what you call; it decides whether the message is worth recording (gate 1, its effective level). If it passes, a LogRecord is created and offered to every Handler on that logger and — via propagation — on every ancestor. Each Handler applies its own level (gate 2) and sends the record somewhere. A Formatter belongs to a handler and turns the record into a string; it has no level. So a record must clear both gates. The idiomatic setup is logger at DEBUG (let everything through) and per-handler levels for verbosity — console INFO, file DEBUG.
Q: My logger is set to DEBUG but I see no debug output. What’s wrong?
A: Almost certainly the handler’s level. logger.setLevel(DEBUG) only opens gate 1; a StreamHandler you gave setLevel(INFO) still drops it. Or you set the level on the wrong logger (getLogger("shop") vs getLogger("shop.orders")), or basicConfig was a no-op, or the handler is attached to a logger the record never reaches. Debug it with log.getEffectiveLevel() and print(log.handlers).
Q: What does logging.getLogger(__name__) give you that logging.getLogger("myapp") doesn’t?
A: __name__ is the module’s dotted path, so you get three things for free: every line labelled with its origin via %(name)s; a hierarchy matching your package layout, so logging.getLogger("myapp.db").setLevel(DEBUG) tunes one subsystem; and no naming decisions. getLogger is a registry — the same name always returns the same object, so you never pass loggers around.
Q: What is propagation, and how does it cause duplicate log lines?
A: A record created at shop.orders.checkout walks up the dotted chain — shop.orders → shop → root — running every ancestor’s handlers. That’s how one basicConfig() at the top of an app captures every module. You get duplicates when two loggers in that chain both have handlers (e.g. you added one to shop and root), or when your setup ran twice and stacked handlers on the same logger. Fixes: attach handlers only at root, set propagate = False, or guard the setup. Note that ancestor levels are not re-checked during propagation — only their handlers’ levels.
Q: Why log.info("x=%s", x) instead of log.info(f"x={x}")?
A: The % is applied lazily — only if a handler actually emits the record — so a disabled log.debug() costs ~72 ns instead of ~1.2 µs (measured, 20-item dict). Honestly, that gap rarely matters; the better reasons are that it’s free in genuinely hot paths or when the argument is expensive to stringify (a DataFrame, an ORM object); that user data stays out of the format string, which is a real injection concern; and that structured-logging tools group by the unformatted template, so "order placed id=%s" aggregates 10,000 records into one group while 10,000 f-strings aggregate into nothing. It’s a lint rule for a reason (pylint W1203, ruff G004).
Q: What’s the difference between log.error("boom"), log.error(f"boom: {e}") and log.exception("boom")?
A: log.error("boom") logs a sentence at ERROR — no traceback. log.error(f"boom: {e}") adds the exception’s message but still throws away the type, the file, the line, and the whole call chain — it’s the most common way to destroy the information you most need. log.exception("boom"), called inside an except block, logs at ERROR plus the full traceback (it’s log.error(..., exc_info=True)). Use exc_info=True on another level (e.g. log.warning) when you recovered but still want the traceback.
Q: How should a library configure logging?
A: It shouldn’t. A library calls logging.getLogger(__name__) and logs — nothing else. It must never call basicConfig(), add real handlers, or setLevel(), because those are the application’s decisions and you’d be hijacking someone else’s root logger. The one thing you do is logging.getLogger(__name__).addHandler(logging.NullHandler()) in your top-level __init__.py, which stops the lastResort handler printing your warnings into the terminal of an app that never configured logging. And never print() from a library — there’s no way to switch it off.
Q: What does breakpoint() do, and why is it better than import pdb; pdb.set_trace()?
A: It’s a built-in (3.7+) that drops you into the debugger at that line. It’s better because there’s nothing to import, and — the real win — it honours the PYTHONBREAKPOINT environment variable: PYTHONBREAKPOINT=0 turns every breakpoint() in the codebase into a no-op (essential in CI, where a stray one either hangs the job or dies with bdb.BdbQuit), and PYTHONBREAKPOINT=ipdb.set_trace routes them all to a different debugger. pdb.set_trace() is hard-wired.
Q (practical): A script crashed in production with a traceback. You can’t easily reproduce it locally. What’s your first debugging move, and how do you read that traceback?
A: Read it bottom-up. The last line is ExceptionType: message — what went wrong and usually the offending value. The frame directly above is where it raised, and since 3.11 the ^^^^ carets point at the exact sub-expression. Then walk up to the lowest frame you actually wrote — the crash site and the fix site are often different functions (a parse helper is fine; the caller fed it a bad row). To debug it for real without a live repro: python3 -m pdb -c continue script.py runs to the crash and hands you a post-mortem session with every frame intact — p the values, u to the caller, no re-run and no source edits.
Q (coding): In pdb you’re stopped inside parse_amount(raw) and p raw shows '12a.00'. You need to know which order id that came from, but p o says NameError. What do you do?
A: o lives in the caller’s frame; p only sees the frame you’re standing in. So: w to print the stack and see the call chain, then u to move up into total(), then p o → {'id': 1004, 'amount': '12a.00'}. d goes back down. This is the frame-walking skill that makes a debugger worth more than a print: the crash is in the leaf, but the cause is usually in the caller. To go straight there next time, use a conditional breakpoint: b 4, "a" in raw.
Q: Why should you never use assert to validate user input?
A: Because python -O strips every assert at compile time — they’re not in the bytecode at all, and __debug__ becomes False. A def withdraw(balance, amount): assert amount > 0 happily returns 150 for withdraw(100, -50) under -O, inventing money. assert is for internal invariants you believe are already true (“this can’t happen”); anything from a user, a file, a request or an API needs a real if not ok: raise ValueError(...), which survives -O.
Key takeaways
printis for output;loggingis for diagnostics. Prints are written to be deleted — they carry no timestamp, no source, no level, can’t be switched off, and go to stdout where they pollute your real output.printis still right for a script’s actual result, a CLI message, or a 20-line throwaway.- A log call is a record offered to a pipeline: Logger → (LogRecord) → Handler → Formatter → destination. Formatters live on handlers, never loggers. Know that chain and the module stops being mysterious.
- There are TWO level gates and a record must clear both — the logger’s effective level, then each handler’s level. That’s not a bug, it’s the feature: logger at
DEBUG, console handler atINFO, file handler atDEBUG, one call, two fates. - The root logger defaults to
WARNING, which is why yourlogging.info()vanished. Worse, module-levellogging.info(...)implicitly callsbasicConfig(), which makes your later explicitbasicConfig(...)a silent no-op. Configure once, first, in your entry point;force=Trueis the escape hatch. log = logging.getLogger(__name__)at the top of every module. It’s a registry (same name = same object), it labels every line, and the dots give you a hierarchy — which is both howbasicConfigat root captures everything, and howgetLogger("urllib3").setLevel(WARNING)silences a whole library.- Duplicate lines mean propagation. Records bubble up the dotted chain running every ancestor’s handlers. Two handlers saw it — usually your setup ran twice.
print(log.handlers)diagnoses it in one line. log.exception()insideexceptis the single most valuable call in this lesson. It logs your message plus the full traceback.log.error(f"failed: {e}")throws away the type, the file, the line and the call chain — the information you’ll most want at 03:00.- Prefer lazy
log.info("x=%s", x)— free when the level is off, keeps user data out of the format string, and lets structured tooling group by template. Be honest, though: f-strings are common and ~1 µs rarely matters; the hot path and the injection surface are the real arguments. breakpoint()(3.7+), andPYTHONBREAKPOINT=0in CI. For a crash you can’t reproduce,python3 -m pdb -c continue script.pygives you a post-mortem with every frame alive — no re-run, no edits.- Walking frames is the actual debugging skill.
wshows the stack,u/dmove between frames, andponly sees the frame you’re in — which is whyp oraisesNameErroruntil you gou. The crash site and the fix site are usually different functions. - Have a loop: reproduce → read the traceback bottom-up → isolate/bisect → form a falsifiable hypothesis → test ONE thing → verify → keep the evidence (turn the good print into a
log.debug). Guessing is what makes debugging feel awful. assertis stripped bypython -O. Never use it for validation, security, or anything a user controls — useif not ok: raise ValueError(...). Learnpdbeven if you love your IDE debugger: it’s the one that’s there over SSH, in a container, and in CI.