In a nutshell
Spinnaker is a continuous-delivery platform: the tool that takes an already-built artifact — a container image, a machine image, a Kubernetes manifest — and promotes it into production across many clouds, safely and repeatably. The key word is promote, not deploy. Almost anything can deploy; a kubectl apply deploys. What teams reach for Spinnaker to get is a deploy that is governed (a human or a policy must approve it), observed (real telemetry decides whether it is healthy), and reversible (it rolls itself back on the evidence instead of waking someone at 3 a.m.).
Picture a release control tower for an airline that flies to many airports — one airport is Google’s cloud, one is Amazon’s, one is an old data centre. Any plane can take off; that part is trivial. The tower’s real job is the governed promotion: it holds the flight at the gate until a supervisor signs off (a manual judgment), it sends one scout plane ahead and watches its instruments against a known-good flight already in the air (a canary compared to a baseline), and if the scout’s readings drift it turns the flight around automatically (an automated rollback) before the rest of the fleet follows. Spinnaker’s value is not the takeoff — it is that every promotion is authorized, watched, and reversible.
Concretely, you model your service as an application, describe its release as a pipeline of stages (bake → deploy → judge → verify), pick a deployment strategy that decides what happens to the old version, and — the crown jewel — wire Kayenta, Spinnaker’s automated-canary engine, to score the new version against a same-age baseline using your own Prometheus / Stackdriver / Datadog metrics. Do it once and every service inherits the same governed, multi-cloud path to production.
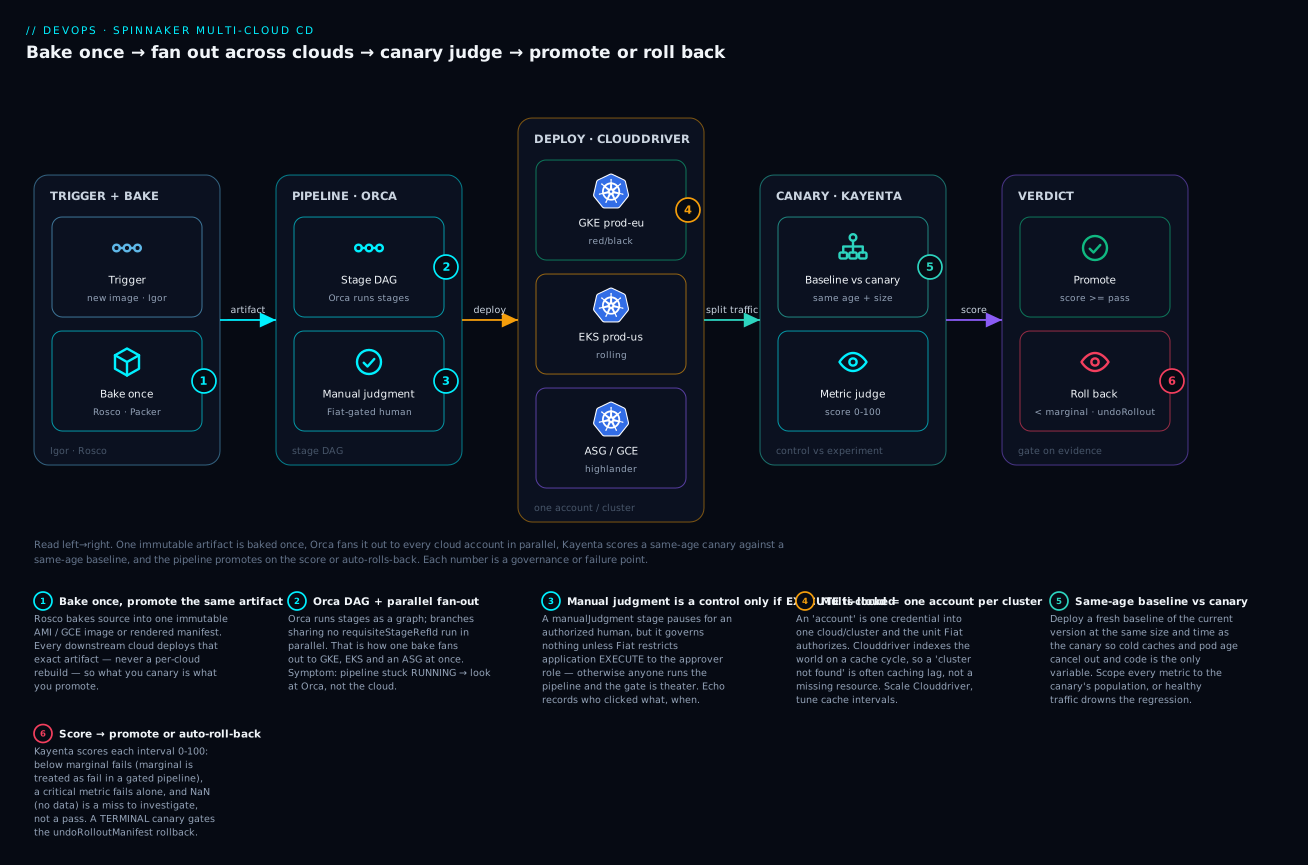
The diagram reads left to right: Igor triggers on a new image and Rosco bakes once into an immutable artifact, Orca fans that one artifact out across cloud accounts in parallel through Clouddriver, Kayenta scores a same-age canary against a same-age baseline, and the pipeline promotes on the score or auto-rolls-back — each numbered badge marks a governance or failure point.
Level: Expert · Time: ~31 min
Prerequisites & what you’ll be able to do
You will get the most from this lesson if you already know:
- What blue/green, rolling, and canary deployments are at a concept level — if that is fuzzy, read Deployment strategies: rolling, blue/green, canary, flags first; Spinnaker is the engine that automates them.
- How a CD pipeline is built from stages, gates, and artifacts — see CI/CD pipeline design.
- Basic Kubernetes objects (Deployment, ReplicaSet, Service) and what an AWS Auto Scaling Group is — Spinnaker deploys to all of them.
- A little PromQL and the idea of metrics and SLOs — the canary judge is only as good as the query behind it; the Prometheus + Grafana monitoring stack lesson covers the query language.
After working through it you will be able to:
- Name every Spinnaker microservice and predict which one is failing from the symptom.
- Model a service as an application with a multi-stage promotion pipeline expressed as JSON.
- Choose
redblack,rollingredblack, orhighlanderper workload and know exactly what each does to the previous version and your rollback options. - Author a Kayenta canary config — metrics, groups, weights, thresholds,
critical,direction— and wire it to Prometheus, Stackdriver, or Datadog. - Build a control/experiment (baseline vs canary) that compares like-with-like so the judge is honest.
- Gate promotion on a real human approval that is actually enforced (Fiat
EXECUTE) and audited (Echo). - Automate rollback on a
TERMINALcanary and a failing post-deploy verification webhook. - Explain when Spinnaker is the right tool and when Argo Rollouts + Argo CD is the lighter, better fit.
Most teams reach for Spinnaker when one CI tool’s “deploy” step stops being enough: you are shipping the same artifact to a Kubernetes account in GCP, an EKS cluster in AWS, and a legacy ASG, each with its own approvers, metrics backend, and blast-radius rules. Spinnaker’s value is not that it deploys – anything deploys – it is that it makes promotion a governed, observable state machine. A pipeline bakes once, fans out across clouds, pauses on a manual judgment where policy demands a human, runs automated canary analysis against real telemetry, and rolls back on the evidence rather than on a pager. This article builds that pipeline end to end: providers, the stage model, the three deployment strategies, Kayenta wired to Prometheus/Stackdriver/Datadog, templated triggers, Fiat authorization, and rollback automation.
1. The microservice architecture and why it matters operationally
Spinnaker is a set of JVM microservices behind one UI. You cannot operate it well without knowing which service owns which failure mode.
| Service | Responsibility | When it is the culprit |
|---|---|---|
| Deck | Angular UI | Nothing renders; check Gate connectivity |
| Gate | API gateway (all UI/CLI traffic) | 401/403s, auth proxy issues |
| Orca | Orchestration engine; runs pipelines stage by stage | Pipelines stuck “RUNNING”, stage transitions |
| Clouddriver | All mutating calls to cloud providers; caches deployed resources | Deploys fail, stale infra in the UI |
| Front50 | Persists applications, pipelines, projects, notifications | Pipelines vanish, save failures (S3/GCS bucket) |
| Rosco | Bakery; produces images via Packer, and Helm/Kustomize manifest bakes | Bake stage failures |
| Igor | Polls CI (Jenkins/Travis) and registries; emits triggers | Triggers do not fire on new images/builds |
| Echo | Eventing bus; notifications, webhooks, cron triggers | No Slack/email, scheduled pipelines silent |
| Fiat | Authorization (accounts, applications, roles) | Users see nothing, “not authorized” on accounts |
| Kayenta | Automated canary analysis (ACA) | Canary stage errors, metric queries fail |
The single most useful operational fact: Clouddriver indexes the world on a cache cycle. A resource created out-of-band can be invisible until the next caching agent run, and a pipeline that “cannot find” a cluster is frequently caching lag, not a real failure. Scale Clouddriver and tune its cache intervals before you blame the cloud.
2. Configuring cloud providers with Halyard or the Operator
There are two config models. Halyard (hal) is the original CLI that owns a halconfig and renders service settings; it is functional but now in maintenance, so new installs increasingly prefer the Spinnaker Operator (a Kubernetes operator that reconciles a SpinnakerService CR). Pick one and stay on it – mixing them corrupts state.
With Halyard, enabling providers and adding accounts is declarative through the hal command tree:
# Kubernetes provider: enable, then add one account per cluster/context
hal config provider kubernetes enable
hal config provider kubernetes account add gke-prod-us \
  --provider-version v2 \
  --context gke_my-project_us-central1_prod \
  --only-spinnaker-managed true

# AWS provider with a separate account (assume-role into a target account)
hal config provider aws enable
hal config provider aws account add aws-prod \
  --account-id 111122223333 \
  --assume-role role/spinnakerManaged \
  --regions us-east-1,eu-west-1

# Google (GCE) provider
hal config provider google enable
hal config provider google account add gcp-prod \
  --project my-gcp-project \
  --json-path /home/spinnaker/.gcp/spinnaker-sa.json

# Set the deployment topology to distributed on Kubernetes, then apply
hal config deploy edit --type distributed --account-name gke-prod-us
hal deploy apply
Inspect what Halyard will render before you apply, and keep the generated config under review:
hal config                      # show the full deployment config
hal config provider kubernetes account list
hal config generate             # render service .yml files without applying
hal deploy apply                # roll the config out to the running services
With the Operator, the same intent is a versioned CR you commit to Git. Accounts can live in the CR or in a kustomize-managed secret, and the operator reconciles drift:
apiVersion: spinnaker.io/v1alpha2
kind: SpinnakerService
metadata:
  name: spinnaker
spec:
  spinnakerConfig:
    config:
      version: 1.35.1
      providers:
        kubernetes:
          enabled: true
          accounts:
            - name: gke-prod-us
              context: gke_my-project_us-central1_prod
              onlySpinnakerManaged: true
        # aws / google providers follow the same accounts[] shape
      deploymentEnvironment:
        size: SMALL
        type: Distributed
Treat accounts as your multi-cloud boundary. An “account” is one credential into one cloud/cluster, and it is the unit Fiat authorizes against (section 7). Name them by environment and cloud (
gke-prod-us,aws-prod-eu) so permissions and pipeline targeting read cleanly.
3. The application, pipeline, and stage model
Spinnaker’s top-level object is an application – a logical service that owns its clusters, firewalls, load balancers, and pipelines across every account. Inside it, a pipeline is an ordered graph of stages:
- Bake – Rosco turns source (a Packer template, or a Helm/Kustomize chart) into an immutable artifact: an AMI, a GCE image, or a rendered Kubernetes manifest.
- Deploy – Clouddriver creates a new server group (an ASG, a managed instance group, or a Kubernetes ReplicaSet) using a chosen strategy.
- Manual Judgment – pauses until an authorized human selects continue/stop. Your governed gate.
- Canary Analysis – runs Kayenta ACA and yields a score (sections 4-5).
- Webhook – calls an external system (change-management API, synthetic test runner) and optionally polls for completion.
Pipelines are JSON. You edit most of it in the UI, but the JSON is the source of truth and what you template (section 6). A trimmed deploy-then-judge skeleton:
{
  "application": "checkout",
  "name": "promote-to-prod",
  "stages": [
    {
      "refId": "1",
      "type": "deployManifest",
      "name": "Deploy canary (GKE)",
      "account": "gke-prod-us",
      "cloudProvider": "kubernetes",
      "moniker": { "app": "checkout" },
      "source": "text",
      "manifests": [ "<rendered manifest injected by bake artifact>" ]
    },
    {
      "refId": "2",
      "requisiteStageRefIds": ["1"],
      "type": "manualJudgment",
      "name": "Release approval",
      "instructions": "Confirm canary score and change ticket before promotion.",
      "judgmentInputs": [ { "value": "promote" }, { "value": "halt" } ],
      "failPipeline": true
    }
  ]
}
requisiteStageRefIds is the DAG edge: stage 2 runs only after 1. Branches sharing no requisiteStageRefIds run in parallel – precisely how you fan a single bake out to multiple cloud accounts at once.
4. Deployment strategies: red/black, rolling, and highlander
Spinnaker bakes the deployment pattern into the Deploy stage as a strategy on the server group. The three you must know differ entirely in how they treat the previous server group:
| Strategy | What happens | Rollback | Cost during deploy |
|---|---|---|---|
redblack (blue/green) |
New server group created; once healthy, old one is disabled (removed from the LB) but kept | Re-enable the old group – instant | 2x capacity until cleanup |
rollingredblack |
New group is scaled up and old group scaled down in increments (one or two at a time) | Reverse the roll; partial exposure | ~1x + increment |
highlander |
New server group created; once healthy, old one is destroyed | None automatic – old group is gone | 1x; cheapest |
A red/black Kubernetes deploy stage with an explicit rollback policy:
{
  "type": "deployManifest",
  "name": "Deploy prod (red/black)",
  "account": "aws-prod",
  "cloudProvider": "kubernetes",
  "strategy": "redblack",
  "maxRemainingAsgs": 2,
  "trafficManagement": {
    "enabled": true,
    "options": {
      "enableTraffic": true,
      "services": ["service checkout"]
    }
  },
  "rollback": { "onFailure": true }
}
Choose by failure shape. Use redblack for instant rollback when you can afford double capacity briefly. Use rollingredblack when 2x capacity is too expensive or the workload cannot tolerate a sudden full cutover, accepting partial exposure mid-roll. Use highlander only where capacity is precious and fast rollback is not a requirement – it leaves you nothing to roll back to.
maxRemainingAsgs(the KubernetesmaxRemainingequivalent) controls how many old server groups Spinnaker keeps before cleanup. Set it to at least 2 for red/black so the deploy that creates N+1 still leaves N as a rollback target.
5. Automated Canary Analysis with Kayenta
Kayenta compares a control (baseline) against an experiment (canary) – ideally two freshly deployed server groups of the same size, so the only variable is the code, not warm caches or instance age. It runs your queries against both, scores the divergence with a judge, and returns a numeric canary score the pipeline thresholds.
A canary config declares metrics, the groups they belong to, per-group weights, and the scoreThresholds that decide pass/marginal/fail:
{
  "name": "checkout-aca",
  "judge": { "name": "NetflixACAJudge-v1.0", "judgeConfigurations": {} },
  "metrics": [
    {
      "name": "error-rate",
      "query": {
        "type": "prometheus",
        "serviceType": "prometheus",
        "metricName": "http_requests_total",
        "customInlineTemplate": "PromQL:sum(rate(http_requests_total{job=\"checkout\",code=~\"5..\"}[5m])) / sum(rate(http_requests_total{job=\"checkout\"}[5m]))"
      },
      "groups": ["quality"],
      "analysisConfigurations": {
        "canary": { "direction": "increase", "critical": true }
      },
      "scopeName": "default"
    },
    {
      "name": "p99-latency",
      "query": {
        "type": "prometheus",
        "serviceType": "prometheus",
        "customInlineTemplate": "PromQL:histogram_quantile(0.99, sum(rate(http_request_duration_seconds_bucket{job=\"checkout\"}[5m])) by (le))"
      },
      "groups": ["latency"],
      "analysisConfigurations": { "canary": { "direction": "increase" } },
      "scopeName": "default"
    }
  ],
  "classifier": {
    "groupWeights": { "quality": 60, "latency": 40 },
    "scoreThresholds": { "marginal": 75, "pass": 95 }
  }
}
The mechanics that matter:
directiontells the judge which way is bad.increasefails the metric when the canary rises above baseline (error rate, latency);decreasefor throughput;eitherfor metrics that should track baseline both ways.critical: truemakes one failing metric fail the whole analysis regardless of weighted score – use it for error rate, never a noisy gauge.groupWeightsmust sum to 100. The judge scores each group, weights them, and compares toscoreThresholds: belowmarginalfails, at/abovepasssucceeds, in between is marginal (treated as fail in a gated pipeline).
In the pipeline, the Canary Analysis stage runs this config repeatedly over a window, pointing each interval at the two scopes:
{
  "type": "kayentaCanary",
  "name": "ACA: checkout",
  "canaryConfig": {
    "metricsAccountName": "prometheus-prod",
    "storageAccountName": "gcs-canary",
    "canaryConfigId": "checkout-aca",
    "scopes": [
      {
        "scopeName": "default",
        "controlScope": "checkout-baseline",
        "experimentScope": "checkout-canary",
        "step": 60,
        "extendedScopeParams": { "type": "cluster" }
      }
    ],
    "scoreThresholds": { "marginal": "75", "pass": "95" },
    "lifetimeDuration": "PT1H",
    "analysisIntervalMins": 15
  }
}
That config samples for one hour (PT1H) in four 15-minute judgments, each scoring checkout-canary against checkout-baseline. If any judgment falls below marginal, the stage fails and – wired correctly – triggers rollback (section 8).
6. Wiring Prometheus, Stackdriver, and Datadog as metric sources
Kayenta needs two account types: a metrics account (reads telemetry) and a storage account (S3/GCS/MinIO, persists configs and results). Enable the canary feature and add the metrics backend you run. With Halyard:
hal config canary enable

# Prometheus
hal config canary prometheus enable
hal config canary prometheus account add prometheus-prod \
  --base-url http://prometheus.monitoring:9090

# Google Stackdriver (Cloud Monitoring)
hal config canary google enable
hal config canary google account add stackdriver-prod \
  --project my-gcp-project --json-path /home/spinnaker/.gcp/sa.json \
  --supported-types METRICS_STORE

# Datadog
hal config canary datadog enable
hal config canary datadog account add datadog-prod \
  --base-url https://api.datadoghq.com

hal deploy apply
On the Operator, the same accounts live under spinnakerConfig.profiles.kayenta (rendered into kayenta.yml), with one account marked supportedTypes: [METRICS_STORE] for telemetry and a GCS/S3 account marked [OBJECT_STORE] for results.
The
serviceType/typein a metric’squery(section 5) must match an enabled metrics account’s provider. A Datadog query against a Spinnaker that only has Prometheus enabled fails at runtime with an opaque error – enable the provider first, then author the canary config. Datadog API and app keys go in the Kayenta profile secrets, never in the canary config JSON.
7. Authorization with Fiat: pipeline permissions and audited gates
Fiat is Spinnaker’s authorization service. It resolves a user’s roles (LDAP, SAML, GitHub teams, Google Groups), then gates which accounts a user can deploy to and which applications they can read, write, or execute. Enable it alongside an auth provider:
hal config security authz enable
hal config security authz edit --type file   # or ldap / github / google
hal config security authz google edit \
  --admin-username admin@acme.com \
  --credential-path /home/spinnaker/.gcp/fiat-sa.json \
  --domain acme.com
hal deploy apply
Permissions are set per account (a WRITE role gating who can deploy to that account, enforced at execution time) and per application. The application EXECUTE permission is the key governance lever – it decides who can run a pipeline at all:
// Per-application permissions (Front50 application config)
{
  "name": "checkout",
  "permissions": {
    "READ":    ["dev-team", "sre"],
    "WRITE":   ["dev-team"],
    "EXECUTE": ["prod-deployers"]
  }
}
For an audited gate, combine a Manual Judgment stage with notifications so the approval is enforced and recorded. Echo emits the judgment event; route it to your audit sink:
{
  "type": "manualJudgment",
  "name": "Prod release sign-off",
  "instructions": "Approve only with a linked CHG ticket. This action is audited.",
  "judgmentInputs": [ { "value": "approve" }, { "value": "reject" } ],
  "notifications": [
    {
      "type": "slack",
      "address": "release-approvals",
      "when": ["manualJudgment", "manualJudgmentContinue", "manualJudgmentStop"]
    }
  ],
  "failPipeline": true
}
A manual judgment only governs anything if
EXECUTEon the application is restricted. If everyone can run the pipeline, the human gate is theater. LockEXECUTEto the approver role, and the judgment becomes a real, attributable control – Echo records who clicked which option and when.
8. Triggers, templated pipelines, and rollback automation
Triggers start pipelines automatically. The canonical “promote on new image” pattern is a docker trigger (polled by Igor) firing on a new tag matching a regex:
"triggers": [
  {
    "type": "docker",
    "account": "dockerhub",
    "organization": "acme",
    "repository": "acme/checkout",
    "tag": "^v\\d+\\.\\d+\\.\\d+$",
    "enabled": true
  }
]
A jenkins trigger (fields: master, job) fires on CI completion, and a git trigger (source: github, project, slug, branch) fires on commit – both follow the same shape.
To avoid copy-pasting pipelines across dozens of services, use Managed Pipeline Templates (spin CLI). A template declares variables and a pipeline body; each service publishes a small configuration binding the variables:
# pipeline-template.yml
schema: "v2"
id: standard-promote
variables:
  - name: app
    type: string
  - name: targetAccount
    type: string
pipeline:
  name: "promote-{{ app }}"
  stages:
    - name: Canary
      type: kayentaCanary
      canaryConfig:
        canaryConfigId: "{{ app }}-aca"
        metricsAccountName: prometheus-prod
        storageAccountName: gcs-canary
        scoreThresholds: { marginal: "75", pass: "95" }
# Publish the template and a binding via the spin CLI
spin pipeline-templates save --file pipeline-template.yml
spin pipeline save --file checkout-config.json   # binds app=checkout, targetAccount=gke-prod-us
Rollback automation ties it together in two layers: a rollback.onFailure on the deploy stage handles a failed deploy, and an explicit undoRolloutManifest (Kubernetes) or rollbackServerGroup stage handles a post-deploy failure caught by canary or a verification webhook. Gate that stage on the canary result:
{
  "type": "undoRolloutManifest",
  "name": "Rollback on canary fail",
  "account": "gke-prod-us",
  "cloudProvider": "kubernetes",
  "location": "checkout",
  "manifestName": "deployment checkout",
  "numRevisionsBack": 1,
  "requisiteStageRefIds": ["aca-stage"],
  "stageEnabled": {
    "type": "expression",
    "expression": "${ #stage('ACA: checkout').status.toString() == 'TERMINAL' }"
  }
}
Add a post-deploy verification stage – a webhook to a synthetic test runner that must return success before the pipeline reports green. With waitForCompletion, Spinnaker polls the returned status URL until statusJsonPath matches a success status:
{
  "type": "webhook",
  "name": "Synthetic smoke",
  "url": "https://synthetics.acme.com/run/checkout",
  "method": "POST",
  "waitForCompletion": true,
  "statusJsonPath": "$.status",
  "successStatuses": "SUCCEEDED",
  "terminalStatuses": "FAILED"
}
Enterprise scenario
A platform team ran one Spinnaker controlling deploys to GKE (gke-prod-eu) and EKS (eks-prod-us) for a checkout service. Their canary looked correct – error-rate and p99-latency, pass: 95 – yet a release with a real EU-region regression scored 96 and promoted. Two compounding mistakes. First, the canary’s controlScope pointed at the existing production server group, not a freshly deployed baseline, so the canary (cold caches, new pods) was compared against a warm, hours-old fleet; the latency delta got written off as “new pod warmup” and absorbed into the score. Second, their PromQL had no region label, so the query aggregated both clusters – healthy US traffic statistically drowned the EU regression.
The fix: deploy a dedicated baseline of the current version at the same time and size as the canary (the standard control/experiment pattern), and scope every metric to one cluster via extendedScopeParams plus an explicit label binding. They also marked error-rate as critical so an error spike could fail the analysis alone, independent of the weighted score:
{
  "name": "error-rate",
  "query": {
    "type": "prometheus",
    "serviceType": "prometheus",
    "customInlineTemplate": "PromQL:sum(rate(http_requests_total{job=\"checkout\",region=\"${scope}\",code=~\"5..\"}[5m])) / sum(rate(http_requests_total{job=\"checkout\",region=\"${scope}\"}[5m]))"
  },
  "groups": ["quality"],
  "analysisConfigurations": { "canary": { "direction": "increase", "critical": true } },
  "scopeName": "default"
}
With per-cluster scoping and a same-age baseline, the next bad EU release scored 41 and auto-rolled-back via the undoRolloutManifest stage before meaningful customer impact. The lesson every Kayenta adopter learns: the judge is only as honest as your scopes. Compare like with like, and scope each metric to exactly the population the canary serves.
Going deeper
How the Kayenta judge actually scores (Mann-Whitney, classifications, and NaN)
The default judge, NetflixACAJudge-v1.0, does not “average two numbers.” For each metric it collects a time series from the control and one from the experiment over the interval, then runs a Mann-Whitney U test – a non-parametric test that asks whether the two samples are drawn from the same distribution, without assuming they are normally distributed (real latency and error data almost never are). The test yields a classification per metric:
- Pass – no significant divergence, or divergence in the good direction.
- High / Low – the canary is significantly higher / lower than the control. Whether that is a failure depends on the metric’s
direction: for an error-rate metric withdirection: increase, High fails and Low passes. - Nodata – one or both series returned no points.
- Error – the query itself failed.
Those per-metric verdicts roll up by groupWeights into a single 0-100 score, which the pipeline compares to scoreThresholds. A metric marked critical: true short-circuits the whole thing: one critical High on error-rate fails the analysis regardless of how healthy everything else looks – that is the entire point of critical.
NaN is the subtle one. A gap in the data – a scrape that missed, a label that stopped matching, a pod that crashed and stopped emitting – surfaces as NaN / Nodata, and beginners assume “no error data means no errors, so pass.” Kayenta does not: by default Nodata is treated as a problem to investigate, not a silent success. You control this per metric with nanStrategy: remove drops NaN samples before the test (correct when a metric is legitimately sparse – a gauge that only emits under load), while the default keeps them so a metric that should always report but suddenly went dark fails loudly. Setting remove on a metric that went dark because the canary crashed is exactly how a broken release scores green.
Orca, Clouddriver, and why Spinnaker is operationally heavy
Two services explain most of Spinnaker’s operational character. Orca is the orchestration engine: it turns a pipeline into a queue of tasks and persists every execution’s state (historically in Redis, and increasingly in a SQL database – MySQL/PostgreSQL – for durability and horizontal scale). Because state is persisted, Orca can be restarted mid-pipeline and resume in-flight executions where they paused – which is why a stuck pipeline is almost always an Orca or downstream-service problem, not lost work. Clouddriver is the read/write bridge to every cloud: separate caching agents poll each account on an interval and index the results in Redis, while read and write paths serve the UI and mutations. At scale you split Clouddriver into distinct caching, rw, and ro deployments so a slow cloud API cannot starve the UI. Front50 persists applications, pipelines, and canary configs to an object store (S3/GCS/MinIO) – lose that bucket’s data and your pipelines vanish, so back it up like a database. The cost of this design is real: a minimal production Spinnaker is ~10 JVM services plus Redis, a SQL store, and object storage, which is the single biggest reason teams evaluate Argo instead (below).
Deployment strategies under the hood
On the Kubernetes provider a “server group” is a versioned ReplicaSet (checkout-v001, checkout-v002). redblack creates the new version’s ReplicaSet, waits for it to report healthy, then flips the Service selector (or the traffic-management config) from old to new – rollback is re-pointing that selector at the still-present old ReplicaSet, which is why it is instant. maxRemainingAsgs (maxRemaining for k8s) bounds how many old ReplicaSets survive cleanup: set it to at least 2 so creating -v003 still leaves -v002 as a rollback target. rollingredblack scales the new ReplicaSet up and the old one down in increments, so at any moment both take live traffic – cheaper on capacity, but you accept partial exposure to a bad version mid-roll. highlander deletes the old ReplicaSet the instant the new one is healthy – cheapest, zero rollback target. On the AWS provider the same words map to Auto Scaling Groups behind an ELB/ALB rather than ReplicaSets behind a Service: one strategy name, the same semantics, whether the substrate is Kubernetes or EC2. That server-group abstraction – “a versioned, immutable set of running copies, whatever the cloud” – is the thing that lets a single strategy choice mean the same across clouds.
Spinnaker vs Argo Rollouts and Argo CD
The most common question in 2025-2026 is not “Spinnaker or a CI tool” but “Spinnaker or Argo.” They solve overlapping problems with very different weight:
| Dimension | Spinnaker | Argo Rollouts + Argo CD |
|---|---|---|
| Scope | Multi-cloud: Kubernetes, AWS (ASG/AMI), GCE, Cloud Foundry | Kubernetes-native (Rollouts is a controller; CD syncs manifests) |
| Model | Imperative pipeline / stage DAG, edited in a UI, stored as JSON | Declarative CRDs in Git; GitOps reconciliation |
| Progressive delivery | Deploy strategies + Kayenta ACA (Mann-Whitney judge) | Rollout canary/blue-green steps + AnalysisTemplate (same metric providers) |
| Manual gates | Manual Judgment stage, Fiat-authorized, Echo-audited | pause steps in the Rollout; approvals via Git PR / CD sync |
| Baking / VMs | Rosco bakes AMIs, GCE images, manifests (Packer) | None – images built by your CI; Kubernetes only |
| Operational weight | ~10 JVM microservices + Redis/SQL + object store | Two lightweight controllers |
| Best when | You promote one artifact across clouds and VMs with rich governance | You are all-in on Kubernetes and GitOps and want the lightest path |
For a single-cluster, all-Kubernetes, GitOps shop, Argo Rollouts + Argo CD is dramatically lighter and usually the right call – the canary analysis is conceptually the same (both drive Prometheus/Datadog queries; Argo’s AnalysisTemplate reads like a slimmed Kayenta). Spinnaker earns its operational weight precisely when Argo’s assumptions break: you are promoting the same artifact to Kubernetes and EC2 ASGs and GCE, across accounts owned by different teams with different approvers and metric backends, and you want one governed promote path over all of it. If everything you ship is a Kubernetes manifest, the ten JVM services are overhead; if half of it is an AMI, they are the point. The lighter GitOps pattern is covered in GitHub Actions + Argo CD progressive delivery – read it as the alternative you should rule out before you commit to running Spinnaker.
The current Spinnaker surface
A few facts about the platform as it stands, so you weigh it with open eyes:
- Config: Halyard (
hal) is in maintenance – it still works and plenty of production installs run on it, but new work and the recommended path are the Spinnaker Operator, which reconciles aSpinnakerServiceCR you keep in Git. Do not run both against the same install; they fight over the same rendered config. - Releases: Spinnaker ships as a versioned bundle in the 1.3x line (the
1.35.1above is representative). A single platform version pins compatible versions of every microservice, so you upgrade the platform number, not ten services by hand. The exact latest patch moves – check the current release notes before pinning. - Governance: Spinnaker and Kayenta are hosted by the Continuous Delivery Foundation (CDF) under the Linux Foundation. The largest commercial distributor, Armory, wound down its Spinnaker products, which pushed maintenance back onto the open-source community – worth knowing when you weigh long-term support against Argo’s very active CNCF ecosystem.
- Tooling: the
spinCLI talks to Gate’s API for scripting pipelines and templates; Managed Pipeline Templates v2 keep pipeline JSON DRY across services; and Kayenta exposes a standalone canary API, so you can run its judge from a non-Spinnaker pipeline (a Jenkins or GitHub Actions job that posts control/experiment scopes and reads back a score) if you want the honest statistical analysis without adopting the whole orchestration platform.
Practice challenges
Work these in order – they escalate from beginner to advanced. Each has a worked solution; try it before you expand it.
Challenge 1 – Read the architecture from a symptom (beginner)
Deploys succeed, but a Service you created out-of-band with kubectl never appears in the Spinnaker UI. Name the responsible service and show one command that proves this is caching lag, not a real failure.
<details> <summary>Solution</summary>
The culprit is Clouddriver. Confirm the account is wired and let the cache catch up:
curl -s http://localhost:7002/credentials | jq '.[].name' # account is registered?
If the account is listed, the resource simply has not been indexed yet – wait one caching-agent cycle (or trigger a refresh) and it appears.
Why: Clouddriver indexes each account on a poll interval, so anything created outside Spinnaker is invisible until the next caching-agent run. Seeing the account in /credentials proves the wiring is fine and the gap is timing, not a missing resource.
</details>
Challenge 2 – Pick the strategy (beginner)
You must ship to a cost-sensitive batch fleet where a brief 2x capacity is impossible and fast rollback is not a requirement. Which strategy, and what do you give up?
<details> <summary>Solution</summary>
Use highlander. Set "strategy": "highlander" on the deploy stage.
Why: highlander destroys the old server group the instant the new one is healthy – 1x capacity, the cheapest option – but it leaves nothing to roll back to. That trade is only acceptable because fast rollback is not required here; on a customer-facing service you would choose redblack instead.
</details>
Challenge 3 – Make groupWeights and thresholds correct (intermediate)
Write the classifier block for a canary that weights error-rate 70 / latency 30, fails below a score of 80, and promotes at or above 90.
<details> <summary>Solution</summary>
"classifier": {
  "groupWeights": { "quality": 70, "latency": 30 },
  "scoreThresholds": { "marginal": 80, "pass": 90 }
}
Why: groupWeights must sum to 100 or the config is rejected. A score in [80, 90) is marginal, which a gated pipeline treats as a fail – only >= 90 promotes – so “fails below 80” and “passes at 90” both fall out of setting marginal: 80, pass: 90.
</details>
Challenge 4 – Scope a metric to one cluster (intermediate)
This PromQL aggregates every region and hides a per-region regression: sum(rate(http_requests_total{job="checkout",code=~"5.."}[5m])) / sum(rate(http_requests_total{job="checkout"}[5m])). Rewrite it so the canary judges only its own population.
<details> <summary>Solution</summary>
Bind the scope to a region label on both the numerator and denominator:
PromQL:sum(rate(http_requests_total{job="checkout",region="${scope}",code=~"5.."}[5m]))
     / sum(rate(http_requests_total{job="checkout",region="${scope}"}[5m]))
Why: region="${scope}" restricts the query to the exact population the canary serves, so healthy traffic in another region cannot statistically drown the regression under test. Unscoped aggregation is how the enterprise-scenario release scored 96 while regressing.
</details>
Challenge 5 – Gate a rollback on the canary verdict (advanced)
Add the stage condition that runs an undoRolloutManifest stage only when the canary stage named ACA: checkout ends TERMINAL, and make it depend on that stage.
<details> <summary>Solution</summary>
{
  "type": "undoRolloutManifest",
  "name": "Rollback on canary fail",
  "requisiteStageRefIds": ["aca-stage"],
  "stageEnabled": {
    "type": "expression",
    "expression": "${ #stage('ACA: checkout').status.toString() == 'TERMINAL' }"
  }
}
Why: the rollback must fire on evidence – a failed canary – not unconditionally. requisiteStageRefIds makes it run after the canary; the SpEL stageEnabled expression reads the prior stage’s status so a passing canary skips the rollback entirely.
</details>
Challenge 6 – Make the human gate real (advanced)
A pipeline has a Manual Judgment “prod sign-off” stage, but any developer can still run the pipeline and click through. In two moves, turn the gate into an enforced, audited control.
<details> <summary>Solution</summary>
- Restrict application
EXECUTEto the approver role (Front50 application permissions):
"permissions": {
  "READ":    ["dev-team", "sre"],
  "WRITE":   ["dev-team"],
  "EXECUTE": ["prod-deployers"]
}
- Route the judgment event to an audit sink via Echo notifications on the stage:
"notifications": [
  { "type": "slack", "address": "release-approvals",
    "when": ["manualJudgment", "manualJudgmentContinue", "manualJudgmentStop"] }
]
Why: a manual judgment governs nothing while everyone holds EXECUTE – the gate is decorative. Locking EXECUTE makes the approval attributable to the approver role, and Echo’s events record who chose continue/stop and when, turning the click into an auditable control.
</details>
Common beginner mistakes
- “Spinnaker is a CI tool – it builds my code.” It does not build source. Your CI (Jenkins, GitHub Actions, GitLab) compiles and publishes the artifact; Spinnaker triggers on that artifact and governs its promotion. A bake is not a compile – Rosco packages an already-built artifact into a machine image or a rendered manifest.
- “Red/black and canary are the same thing.” Red/black (blue/green) is a deployment strategy – how you cut traffic from old to new. A canary is an analysis – Kayenta scoring a small new population against a baseline to decide whether to proceed. You often run a canary and then a red/black promotion; they answer different questions.
- “The canary compares the new version against production.” It should compare against a freshly deployed baseline of the current version, same size and age. Comparing a cold canary against a warm, hours-old prod fleet makes normal warmup look like a regression – or hides a real one. The judge is only as honest as its control.
- “A green canary means the release is safe.” It means your queries did not diverge – and a query with no
region/jobscoping, or a metric that wentNaNand got treated as a pass, can score 96 on a broken release. Scope every metric to the canary’s population, mark error-ratecritical, and treat Nodata as a miss to investigate. - “The manual judgment protects prod.” Only if
EXECUTEon the application is locked to the approver role in Fiat. With open permissions anyone runs the pipeline and clicks through – the gate is theater. RestrictEXECUTE, then it becomes a real, Echo-audited control. - “Halyard and the Operator both work, so I’ll use whichever.” Pick one. Both render the same underlying config, and running them together makes them fight over and corrupt that state. New installs should prefer the Operator; existing Halyard installs should stay on Halyard until they migrate deliberately.
- “A ‘cluster not found’ error means the cluster is gone.” Usually it is Clouddriver caching lag – the resource exists but has not been indexed yet. Check
/credentialsand give it a cache cycle before you go hunting in the cloud console.
Verify
Confirm providers, the canary pipeline, and the rollback path actually behave as configured.
# Providers and accounts are registered (Halyard)
hal config provider kubernetes account list
hal config provider aws account list

# Clouddriver actually sees the accounts (bypasses caching-lag confusion)
curl -s http://localhost:7002/credentials | jq '.[].name'

# Kayenta metrics + storage accounts are live
curl -s http://localhost:8090/credentials | jq '.[] | {name, types: .supportedTypes}'

# Fiat resolved a user's roles and account access
curl -s http://localhost:7003/authorize/<username> | jq '.accounts[].name'

# Validate the canary's PromQL in Prometheus BEFORE trusting the gate
curl -s 'http://prometheus.monitoring:9090/api/v1/query' \
  --data-urlencode 'query=sum(rate(http_requests_total{job="checkout",code=~"5.."}[5m]))/sum(rate(http_requests_total{job="checkout"}[5m]))' \
  | jq '.data.result'
A healthy setup shows every account in both Clouddriver’s and Kayenta’s /credentials, Fiat returning only the accounts a user’s roles permit, and the canary PromQL returning a value when run directly. Then exercise the failure path on a non-prod app: deploy a deliberately broken canary, watch the kayentaCanary stage drop below marginal, and confirm undoRolloutManifest fires and traffic returns to the prior revision.
Checklist
Glossary
- Spinnaker – an open-source, multi-cloud continuous-delivery platform: a set of JVM microservices that governs how a built artifact is promoted into production.
- Application – Spinnaker’s top-level object; a logical service that owns its clusters, load balancers, firewalls, and pipelines across every account.
- Pipeline – an ordered graph (DAG) of stages that describes one release process; stored as JSON, editable in the UI.
- Stage – one step in a pipeline (bake, deploy, manual judgment, canary, webhook).
requisiteStageRefIdsare the DAG edges between stages. - Trigger – what starts a pipeline automatically: a new Docker tag, a Jenkins build, a git commit, a cron schedule, or another pipeline.
- Bake – turning source into an immutable artifact (an AMI, a GCE image, or a rendered Kubernetes manifest) via Rosco/Packer. Not a code compile.
- Server group – a versioned, immutable set of running copies of one version: a Kubernetes ReplicaSet, an AWS Auto Scaling Group, or a GCE managed instance group.
- Account – one credential into one cloud/cluster; the unit Fiat authorizes and the boundary you deploy against.
- Provider – a supported cloud/platform integration (Kubernetes, AWS, Google/GCE, Cloud Foundry) enabled in config.
- Deployment strategy – how the deploy stage treats the previous server group:
redblack,rollingredblack, orhighlander. - Red/black (blue/green) – create the new server group, then disable (but keep) the old one; rollback is instant by re-enabling it.
- Rolling red/black – scale the new group up and the old group down in increments; cheaper capacity, partial exposure mid-roll.
- Highlander – create the new group and destroy the old one once healthy; cheapest, no rollback target.
- Canary – a small deployment of the new version, evaluated against a baseline before wider promotion (the analysis, not the traffic-cut strategy).
- Baseline / control – a freshly deployed instance of the current version, same size and age as the canary, so code is the only variable.
- Experiment – Kayenta’s name for the canary side of the control/experiment comparison.
- Kayenta – Spinnaker’s automated canary analysis (ACA) service: runs metric queries against control and experiment and returns a score.
- Judge (NetflixACAJudge-v1.0) – the component that statistically compares control vs experiment (Mann-Whitney U test) and classifies each metric Pass/High/Low/Nodata/Error.
- Canary score – a 0-100 number aggregating per-metric verdicts by group weights; compared to
scoreThresholds. - scoreThresholds (pass / marginal) – below
marginalfails, at/abovepasssucceeds, in between is marginal (treated as fail in a gated pipeline). - critical metric – a metric that, if it fails, fails the entire analysis regardless of the weighted score (use it for error rate).
- direction – which way is bad for a metric:
increase,decrease, oreither. - NaN / Nodata / nanStrategy – a metric that returned no data; by default treated as a problem.
nanStrategy: removedrops NaN samples before the test (only safe for legitimately sparse metrics). - Manual Judgment – a stage that pauses until an authorized human selects continue/stop; the governed human gate.
- Fiat – Spinnaker’s authorization service; resolves roles and gates account/application
READ/WRITE/EXECUTE. - EXECUTE permission – the application permission that decides who can run a pipeline at all; the lever that makes a manual judgment real.
- Echo – the eventing service: notifications, webhooks, cron triggers, and the audit record of who approved what.
- Igor – polls CI systems and container registries and emits triggers on new builds/images.
- Orca – the orchestration engine that runs pipelines stage by stage and persists execution state (Redis/SQL).
- Clouddriver – the read/write bridge to every cloud; its caching agents index resources on a poll interval (source of caching lag).
- Front50 – persists applications, pipelines, and canary configs to an object store (S3/GCS/MinIO).
- Halyard (
hal) – the original CLI config tool, now in maintenance; owns ahalconfigand renders service settings. - Spinnaker Operator – the Kubernetes operator that reconciles a
SpinnakerServicecustom resource; the recommended config path for new installs. - spin CLI – the command-line client for Gate’s API; used to script pipelines and Managed Pipeline Templates.
- Managed Pipeline Templates (v2) – reusable pipeline definitions with variables, bound per service, so pipelines are not copy-pasted.
- undoRolloutManifest / rollbackServerGroup – stages that roll a Kubernetes/VM workload back to a prior revision, typically gated on a
TERMINALcanary. - Argo Rollouts / Argo CD – the lighter, Kubernetes-native, GitOps alternative: a progressive-delivery controller plus a git-sync CD tool, without multi-cloud baking.
Pitfalls and next steps
The failures I see are rarely Spinnaker bugs. They are governance gaps and dishonest canaries. A manual judgment with open EXECUTE permissions is decorative; a canary comparing a cold new stack against a warm old one, or aggregating metrics across regions, will green-light regressions with a straight face. Lock execution to roles, deploy a real baseline, scope every query to the exact population under test – and validate that query in the metrics backend before a release depends on it.
Two extensions pay off quickly. Push all pipeline JSON and canary configs into Git and drive them through spin and Managed Pipeline Templates, so a new service inherits the governed promote path instead of reinventing it. And wire Echo’s events into your observability and change-management systems, so every deploy, judgment, and canary verdict is an auditable record – which is what turns Spinnaker from a deploy tool into a release-engineering control plane your auditors and on-call both trust.