In a nutshell
Picture a city-wide traffic jam. Cars are frozen solid on Fifth Avenue — but Fifth Avenue isn’t the problem. Two miles back a truck stalled on an on-ramp, and the jam backed up junction by junction until it reached you. Complex cloud incidents behave exactly like this: the thing visibly on fire (checkout is timing out) is almost never where the fire started (a database ran out of connection slots, a quota was hit, someone edited a policy). The failure cascades from cause to symptom along the chain of services that depend on one another, so by the time you’re paged you’re standing at the far end of the chain, looking the wrong way.
This lesson teaches you to walk that chain backwards, calmly. Two ideas carry most of the weight. First, stop the bleeding before you diagnose the wound — during an incident you mitigate (roll back, fail over, raise a quota, flip a feature flag) to get users working again, and only then do the slow detective work of root-cause analysis. A surgeon stabilises the patient before ordering the full workup; on-call is no different. Second, the cause always leaves fingerprints — nearly every incident lines up against something that changed: a deploy, a config push, a policy edit, a traffic spike, or a Google maintenance event. Google Cloud’s telemetry (metrics, logs, traces, and the audit log of who-changed-what) lets you find that change fast — if you know which tool answers which question.
The rest is the human machinery that stops a 2 a.m. war room from dissolving into chaos: one person in charge (the Incident Commander) who directs but doesn’t type, one shared source of truth, hypotheses tried on a timer, and — once users are safe — a blameless postmortem that asks why the system let a mistake become an outage rather than who to blame. Get comfortable with this loop and you can take the wheel on any incident and drive it to “users are fine again” without your pulse spiking.
Level: Advanced · Time: ~45 min · You’ll need first: the single-service Troubleshooting Playbooks lesson.
Single-service troubleshooting — the kind in the previous lesson, where a VM won’t boot or a firewall rule blocks a port — is the easy half of the job. The hard half is the 02:00 page that says checkout latency is up 400% and the error rate is climbing, where nothing is obviously broken and the cause turns out to be a quota you didn’t know you were near, a zone Google is draining for maintenance, or an Org Policy a platform team applied at the folder level six hours ago. Complex incidents are systemic: a small change or a partial failure in one service propagates through dependencies and shows up as a symptom three layers away from the cause. You cannot grep your way out of these. You need a repeatable incident-response lifecycle, the discipline to correlate signals across Cloud Monitoring, Cloud Logging, Cloud Trace and Error Reporting, and — afterwards — a blameless postmortem that turns the pain into permanent prevention.
This lesson is the senior on-call’s playbook. It builds the incident lifecycle, shows you how to correlate across the four pillars of Google Cloud observability plus Personalised Service Health, then works five genuinely complex multi-service scenarios as symptom → hypotheses → cross-service diagnosis → fix. It closes with how to write a blameless postmortem and drive corrective and preventive actions (CAPA) so the same incident never recurs. The goal is that you can walk into a war room, take the role of Incident Commander, and run it calmly.
Learning objectives
By the end of this lesson you will be able to:
- Run a Google Cloud incident through a structured lifecycle — detect → triage → communicate → mitigate → RCA → prevent — with clear roles and a bias toward fast mitigation over root-cause-first.
- Correlate signals across Cloud Monitoring metrics, Logs Explorer / Log Analytics, Cloud Trace, Error Reporting, Personalised Service Health and Active Assist to localise a fault that spans services.
- Diagnose and mitigate five classes of complex incident: cascading failure from quota exhaustion, a zonal/regional outage, an Org Policy or VPC Service Controls blast radius, an IAM change that locks out a workload, and a Cloud DNS / load-balancer / certificate failure.
- Reason about quotas, limits and rate limits as first-class reliability risks and instrument them before they bite.
- Write a blameless postmortem with a clear timeline, contributing factors (not a single “root cause”), and a tracked CAPA list with owners and dates.
Prerequisites
You should be comfortable with everything in the previous lesson, Google Cloud Troubleshooting Playbooks: IAM, VPC, Compute, Cloud SQL & GKE — the reproduce → isolate-the-layer → inspect-logs method, and the per-service diagnostic steps. You should know the resource hierarchy (Organization → Folders → Projects), IAM allow/deny policies, VPC and load-balancing basics, and how to read Cloud Logging. This is the Advanced rung of the Troubleshooting module in the Google Cloud Zero-to-Hero course: where the previous lesson localises a fault within a service, this one localises a fault across services and wraps it in incident management. A $300 free-trial or any project with Owner/Editor and the Monitoring and Logging APIs enabled is enough for the lab.
Core concepts: the incident-response lifecycle
An incident is an unplanned disruption or degradation that needs an urgent, coordinated response — distinct from a routine bug. The single most important mindset shift from single-service debugging is this: in an incident, mitigation comes before root cause. Stop the bleeding for users first; understand exactly why later. A junior engineer wants to find the bug; the Incident Commander wants the error rate back to baseline, by rollback or failover or feature-flag, even if the why is still unknown.
The lifecycle has six phases. They overlap in practice — you communicate continuously, and you start gathering RCA evidence the moment you detect — but naming them keeps a chaotic war room organised.
| Phase | Goal | Key activities | Google Cloud tooling |
|---|---|---|---|
| Detect | Know something is wrong, fast | Alerting policies on SLO burn rate, uptime checks, anomaly detection, user reports | Cloud Monitoring alerting, uptime checks, SLO burn-rate alerts |
| Triage | Assess severity & scope; assign roles | Declare incident, set severity (SEV), name an Incident Commander (IC), scribe, comms lead | Incident doc/template; severity matrix |
| Communicate | Keep stakeholders informed | Status updates on a cadence; single source of truth; internal + customer comms | Status page, chat channel, incident doc |
| Mitigate | Restore service (not necessarily fix the cause) | Rollback, failover, scale up, raise quota, disable a feature flag, drain a zone | Cloud Deploy rollback, traffic splitting, MIG/Cloud Run revisions |
| RCA | Understand why it happened | Correlate signals, build a timeline, identify contributing factors | Logs Explorer, Cloud Trace, Error Reporting, Cloud Monitoring, Audit Logs |
| Prevent | Stop recurrence | Blameless postmortem, CAPA with owners/dates, alerting & guardrail improvements | Postmortem doc, issue tracker, SLOs, Org Policy |
Severity (SEV) levels drive how loudly you respond. A workable default:
| Severity | Meaning | Example | Response |
|---|---|---|---|
| SEV1 | Critical, business-wide, customer-facing outage | Checkout down globally; data-loss risk | All-hands war room, IC + comms, exec notified, customer status page |
| SEV2 | Major degradation, significant subset of users | One region down; checkout slow but working | War room, IC, status updates every 30 min |
| SEV3 | Minor / partial, workaround exists | One non-critical feature failing | On-call handles; no war room; tracked |
| SEV4 | Negligible user impact | Elevated error rate within SLO budget | Ticket; fix in business hours |
Roles matter more than people. The Incident Commander owns the response (not the fix — they coordinate, decide, and delegate); the Operations/Subject lead drives the technical investigation; the Communications lead owns stakeholder and customer updates; the Scribe keeps a timestamped log. In a small team one person may wear several hats, but the IC role should always be explicitly held by someone, and that someone should not also be heads-down in a terminal.
The IC’s job is to be slightly bored. If the Incident Commander is frantically typing
gcloudcommands, nobody is steering. The IC asks “what’s our current hypothesis, what’s our mitigation, and who owns it?” — and keeps the room from chasing five theories at once.
A few load-bearing principles:
- One source of truth. A single incident doc (or chat thread) with the timeline. Side-channel DMs fragment the picture.
- Time-box hypotheses. “We’ll try the rollback for 10 minutes; if error rate doesn’t drop, we move to failover.” Avoid sunk-cost debugging.
- Mitigate with the biggest, safest hammer. Rolling back a recent deploy is usually safer and faster than hot-fixing forward under pressure.
- Capture evidence as you go. Screenshot the dashboard, copy the log query, note the exact timestamps — you will need them for the postmortem and the graphs will have rolled off by morning.
Correlating signals across services
The skill that separates senior on-call from junior is correlation: taking a symptom in one service and walking the dependency graph through telemetry to the cause in another. Google Cloud gives you four primary observability pillars plus two incident-specific tools. Know what each is for — using the wrong one wastes precious minutes.
| Tool | Answers the question | Use it when | Notes |
|---|---|---|---|
| Cloud Monitoring (metrics, dashboards, alerting, SLOs) | What is wrong and how bad — the shape of the problem over time | Always start here: latency, error rate, saturation, traffic (the four golden signals) | MQL/PromQL; build a war-room dashboard ahead of time |
| Logs Explorer / Log Analytics | Why a specific request or component failed; who did what | After metrics localise the layer; for exact error strings and Audit Logs | Log Analytics runs SQL (BigQuery) over logs for ad-hoc joins |
| Cloud Trace | Where latency is spent across a distributed request | Latency incidents; “the API is slow but which hop?” | Distributed tracing; shows the span that blew the budget |
| Error Reporting | Which error is new or spiking, grouped & deduplicated | A flood of exceptions; “is this error new since the deploy?” | Auto-groups stack traces; links to first/last seen |
| Personalised Service Health (PSH) | Is Google having an incident affecting my projects? | Before you blame your own code — rule out the platform | Project-scoped; relevance-filtered; has an API & alerts |
| Active Assist / Recommender | Are there pre-incident risks (quota, reliability, security)? | Proactively, and in RCA to spot the warning you missed | Quota recommendations, unattended-project, IAM insights |
The correlation workflow in practice:
- Anchor on the timeline. Note the exact start time from the alert or the first metric inflection. Almost every incident correlates to something that changed — a deploy, a config push, a traffic spike, or a Google maintenance event. Hold that timestamp in your head; everything you look at, you line up against it.
- Start with the golden signals in Cloud Monitoring: latency, traffic, errors, saturation. The pattern tells you the class of problem. Errors up + latency up + traffic flat ⇒ a dependency is failing. Latency up + saturation up + traffic up ⇒ you’re overloaded. Errors up + traffic down ⇒ something upstream (DNS, LB, cert) is stopping requests reaching you.
- Rule out Google first with Personalised Service Health. If GCP is having a regional incident, your mitigation is failover, not debug.
- Localise the layer, then switch tools: Trace for where the latency is, Error Reporting for which exception, Logs Explorer for the exact failing request and the Audit Logs of who changed what.
- Find the change. Query Admin Activity audit logs around the start time — a config change, IAM binding, Org Policy edit, or quota change is the cause more often than a code bug.
A correlation query you will use constantly — what changed in the minutes before the incident — joins the timeline to the Admin Activity audit log:
# Who changed what in this project in the incident window?
gcloud logging read '
  logName="projects/PROJECT_ID/logs/cloudaudit.googleapis.com%2Factivity"
  AND timestamp>="2026-06-15T01:50:00Z"
  AND timestamp<="2026-06-15T02:10:00Z"
' --project=PROJECT_ID --order=asc \
  --format='table(timestamp, protoPayload.authenticationInfo.principalEmail, protoPayload.methodName, resource.type)'
In Log Analytics the same idea becomes a SQL query you can join, aggregate and pivot — invaluable when you need to count errors by service or correlate two log sources:
SELECT
  timestamp,
  proto_payload.audit_log.authentication_info.principal_email AS who,
  proto_payload.audit_log.method_name AS action,
  resource.type AS resource
FROM `PROJECT_ID.global._Default._AllLogs`
WHERE log_id = "cloudaudit.googleapis.com/activity"
  AND timestamp BETWEEN "2026-06-15 01:50:00 UTC" AND "2026-06-15 02:10:00 UTC"
ORDER BY timestamp;
Trace-to-log correlation — turning “the API is slow” into “this exact hop”
The audit log tells you who changed what; a distributed trace tells you where a slow or failing request actually spent its time. Together they are the backbone of cross-service RCA, and the piece beginners miss is that traces and logs are joined for you. Every log line emitted while handling a request carries a trace field (projects/PROJECT_ID/traces/TRACE_ID) and a spanId, so you can pivot from a pathological trace straight to the exact log lines for that one request, and back again. That is how you turn “the API is slow” into “span POST /charge waited 4.2 s on the Cloud SQL call, and here is the too many connections log for that request.”
Reading a trace is a three-step move. (1) In Cloud Trace, sort by latency and open a slow exemplar from the incident window. (2) Walk the span waterfall top-down — the parent span is the whole request; child spans are the downstream calls (DB, Pub/Sub, an external API, another microservice). The child span that jumped from 20 ms to 4 s is your hop. (3) Copy its trace ID and pull the correlated logs to read the actual error string:
# From a slow trace to the exact logs for that one request
gcloud logging read '
  trace="projects/PROJECT_ID/traces/TRACE_ID"
  AND severity>=WARNING
' --project=PROJECT_ID --order=asc \
  --format='table(timestamp, severity, resource.type, jsonPayload.message, textPayload)'
A subtlety that saves you at 2 a.m.: if a trace isn’t there, sampling probably dropped it. Cloud Trace samples — it does not record every request — so for a low-rate but high-impact error the specific request may never have been captured. When that happens, reproduce it, raise the sample rate temporarily, or fall back to Error Reporting plus logs. Trace tells you where time is spent; it won’t always hold your one failing request.
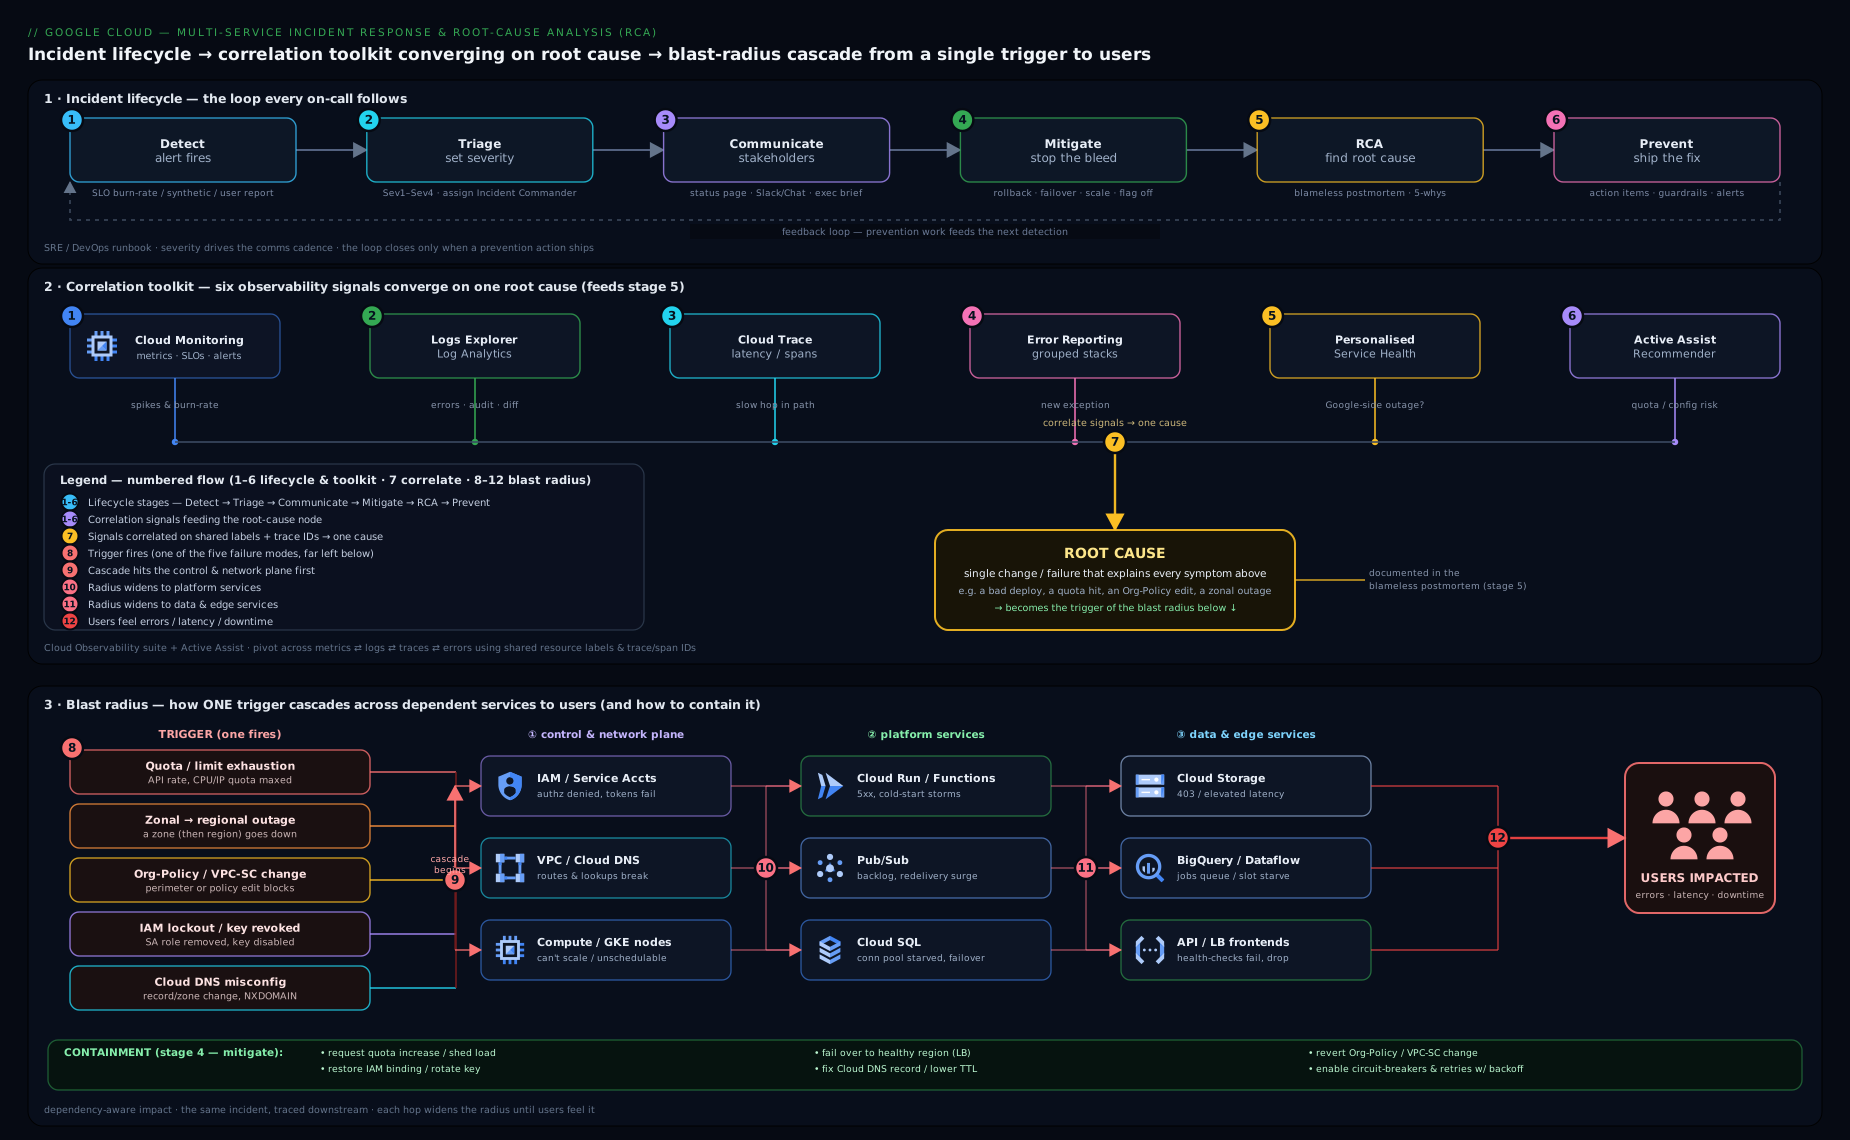
The diagram above maps the six-phase incident lifecycle across the top; beneath it, it traces one request backwards — from a user-visible symptom at the load balancer, through Cloud Monitoring (how bad), Cloud Trace (which hop), Error Reporting (which exception) and the Audit Logs (what changed), down to the contributing change that started the cascade. That right-to-left walk — symptom back to cause — is the mental model behind every scenario below.
Scenario A — Cascading failure from quota exhaustion
Symptom. At 02:00 the checkout SLO burn-rate alert fires. Cloud Monitoring shows backend 5xx climbing from 0.1% to 18% over ten minutes; p99 latency has tripled. Traffic is slightly elevated (a marketing email went out) but not extreme. The frontend Cloud Run service is throwing 503s and the GKE payment service shows pods crash-looping. Nothing was deployed.
Hypotheses.
- A downstream dependency (Cloud SQL, an external payment API) is failing and back-pressure is cascading upward.
- A quota or limit has been hit — Cloud Run max instances, Cloud SQL connections, a Compute Engine CPU quota blocking autoscale, or an API rate limit (429s).
- A noisy-neighbour or memory leak is OOM-killing pods, and retries are amplifying load (a retry storm).
- Google is having an incident (rule out with PSH).
Cross-service diagnosis. PSH is green, so it’s us. The shape — errors and latency up, traffic only mildly up — says we hit a ceiling, not we got flooded. The cascade pattern (frontend 503 + payment pods crashing simultaneously) points to a shared resource. Walk the dependency graph downward:
- Cloud SQL connections. Check the metric
cloudsql.googleapis.com/database/network/connectionsagainstmax_connections. It’s pinned at the limit. The payment pods logFATAL: remaining connection slots are reserved/too many connections. That is the floor of the cascade. - Why now? The traffic bump nudged concurrency up; each Cloud Run instance and each GKE pod opens its own pool; instance count rose and the pools multiplied past
max_connections. Classic connection exhaustion. Confirm by counting connections per source:
# Connection saturation over the incident window
gcloud monitoring time-series list \
  --project=PROJECT_ID \
  --filter='metric.type="cloudsql.googleapis.com/database/network/connections"
            AND resource.labels.database_id="PROJECT_ID:checkout-db"' \
  --interval-start-time=2026-06-15T01:50:00Z \
  --interval-end-time=2026-06-15T02:15:00Z
- The amplifier. Cloud Trace shows checkout spans timing out on the DB call, then the client retrying three times — so each user request becomes 3–4 DB attempts, accelerating exhaustion. Error Reporting shows one dominant new group: the Postgres connection error, first seen at 02:01.
Fix (mitigate first, then prevent).
- Mitigate now: raise the Cloud Run max-instances down is wrong — counter-intuitively you cap the fan-out. The fastest safe mitigation is to reduce the pressure on the shared resource: lower Cloud Run max instances / GKE replicas to throttle concurrency and introduce or enable a connection pooler. Deploy a PgBouncer sidecar / use Cloud SQL Auth Proxy with pooling, or set conservative pool sizes. In parallel, raise
max_connectionson Cloud SQL if headroom allows (it costs memory — a tier bump may be needed). - Break the retry storm: add jittered exponential backoff and a circuit breaker so a failing DB doesn’t get hammered.
# Throttle the fan-out so pools stop multiplying past the DB limit
gcloud run services update checkout-frontend \
  --region=europe-west1 --max-instances=20 --concurrency=80

# Give the DB more slots if the tier has the RAM for it
gcloud sql instances patch checkout-db \
  --database-flags=max_connections=400
- Prevent: put an alert on connection-pool saturation (e.g. >80% of
max_connections) so you’re paged before exhaustion; right-size pools asinstances × pool_size ≤ max_connections − headroom; adopt a pooler permanently; load-test to the marketing-spike traffic level. This is the canonical cascade: a soft limit, an amplifier (retries), and a trigger (traffic). Fix all three.
Scenario B — Zonal/regional outage and failover
Symptom. The uptime check for app.example.com flaps, then goes hard red for one region. p99 latency in europe-west1 spikes; a third of GKE nodes show NotReady; some Compute Engine VMs are unreachable. Your other region, europe-west4, looks healthy. No deploys, no config changes.
Hypotheses.
- A zonal failure within the region (one zone’s hardware/power/network) — a subset of nodes and VMs in
europe-west1-b. - A regional Google Cloud incident.
- A self-inflicted regional problem (a bad config that happens to be regional, a regional quota).
Cross-service diagnosis. This is the one scenario where you check Personalised Service Health first and fast — because if it’s Google, no amount of debugging your code helps, and the correct action is failover.
# Is Google having an incident affecting MY project right now?
gcloud beta service-health events list \
  --project=PROJECT_ID \
  --filter='state="ACTIVE"' \
  --format='table(title, category, state, relevance, updateTime)'
- PSH shows an ACTIVE zonal event in
europe-west1-b(or, if regional, a regional event). That confirms the layer instantly. - Localise zonal vs regional. Break the failing metrics down by zone. If only
-bis affected and-a/-care healthy, it’s zonal — a regional MIG or regional GKE cluster should be self-healing by rescheduling onto healthy zones. If all zones degrade together, it’s regional. - Check whether your architecture is actually multi-zone. If the VMs were in a single zone (a zonal MIG, or pets pinned to
-b), a “zonal” failure is a total failure for that workload — the architecture, not Google, is the contributing factor.
Fix.
- Zonal outage, regional architecture: mostly let it self-heal. A regional MIG recreates instances in healthy zones; a regional GKE cluster reschedules pods; the global/regional load balancer drops the failed backends from rotation automatically via health checks. Verify the LB is shedding the bad zone:
gcloud compute backend-services get-health checkout-backend --global \
  --format='table(status.healthStatus[].instance, status.healthStatus[].healthState)'
- Zonal outage, zonal architecture (the real incident): mitigate by failing over — scale the surviving region, shift traffic, and recreate the lost capacity in another zone. With a global external Application Load Balancer this is often automatic once unhealthy backends drain; otherwise shift DNS/traffic weights to
europe-west4. - Regional outage: invoke DR. Promote the cross-region Cloud SQL replica, route traffic to the standby region, and confirm RTO/RPO. If you only had one region, that is the postmortem’s headline finding.
# Failover: send all traffic to the healthy region's backend
gcloud compute backend-services update-backend checkout-backend --global \
  --instance-group=ig-europe-west4 --instance-group-zone=europe-west4-a \
  --capacity-scaler=1.0
gcloud compute backend-services update-backend checkout-backend --global \
  --instance-group=ig-europe-west1 --instance-group-zone=europe-west1-b \
  --capacity-scaler=0.0
- Prevent: ensure every tier is regional or multi-region by default (regional MIGs, regional GKE, Cloud SQL HA with a cross-region replica, multi-region buckets); subscribe to PSH alerts so the platform tells you before your users do; rehearse failover as a game-day so the runbook is muscle memory.
Scenario C — Org Policy / VPC Service Controls blast radius
Symptom. Across several projects at once, new deployments fail and some running workloads start throwing permission or connectivity errors. A data pipeline can no longer write to Cloud Storage; a Cloud Function deploy fails with a policy error; a VM creation is rejected. The errors are diverse but they all started at roughly the same minute, and they span project boundaries — which no single app bug ever does.
Hypotheses.
- An Org Policy constraint was changed at the organization or folder level (e.g.
constraints/gcp.resourceLocations,iam.disableServiceAccountKeyCreation,compute.vmExternalIpAccess) and the constraint inherits down to all child projects. - A VPC Service Controls perimeter change — a project added to a perimeter, a restricted service added, or an ingress/egress rule tightened — is now blocking managed-API calls that used to work.
- A broad IAM change at a high level removed a role (covered more in Scenario D, but it can co-occur).
Cross-service diagnosis. The tell is breadth across projects + simultaneity. That can only come from something above the project: the resource hierarchy. Go straight to the Organization/folder Audit Logs, not the project’s app logs.
- Find the policy change. Query Admin Activity at the org and folder level for
SetOrgPolicyand VPC-SC perimeter methods in the incident window:
# Org-level: who changed an Org Policy or a VPC-SC perimeter?
gcloud logging read '
  (protoPayload.methodName="google.cloud.orgpolicy.v2.OrgPolicy.UpdatePolicy"
   OR protoPayload.methodName:"accesscontextmanager")
  AND timestamp>="2026-06-15T08:00:00Z"
' --organization=ORG_ID --order=asc \
  --format='table(timestamp, protoPayload.authenticationInfo.principalEmail,
                  protoPayload.methodName, resource.type)'
- Distinguish the two. Read the error strings precisely:
- Org Policy violations read like
Constraint constraints/… violated/FAILED_PRECONDITIONon a create/modify call. - VPC-SC violations read like
Request is prohibited by organization's policywith avpcServiceControlsUniqueIdentifierand asecurityPolicyInfoblock. VPC-SC denials are also logged specifically — query them:
- Org Policy violations read like
gcloud logging read '
  protoPayload.status.details.violations.type="VPC_SERVICE_CONTROLS"
  AND timestamp>="2026-06-15T08:00:00Z"
' --project=PROJECT_ID --order=asc \
  --format='table(timestamp, protoPayload.methodName,
                  protoPayload.metadata.vpcServiceControlsUniqueIdentifier)'
- Confirm the blast radius. A policy set at a folder hits every project under it; a perimeter change hits every project in the perimeter. The audit log entry shows the exact resource the policy was set on — that is your blast-radius boundary.
Fix.
- Mitigate: the fastest, safest move is almost always to revert the change — restore the previous Org Policy (set it back to inherit or to the prior value) or roll back the perimeter edit. For VPC-SC, if the change must stay, add a scoped ingress/egress rule or access level to re-permit the broken flow rather than removing the protection wholesale.
# Revert an Org Policy back to inheriting the parent (un-break children)
gcloud org-policies reset constraints/gcp.resourceLocations \
  --folder=FOLDER_ID

# Or restore from a saved policy file you exported before changes
gcloud org-policies set-policy /path/to/previous-policy.yaml
- Prevent: this is the argument for dry-run mode. Roll out VPC-SC perimeters and many Org Policies in dry-run /
enforcementMode: DRY_RUNfirst, watch the violation logs to see exactly what would break, and only enforce once the logs are clean. Require policy changes to go through Terraform with code review and aplandiff so nobody hand-edits org-level policy at 09:00 on a Monday. Alert onSetOrgPolicyand perimeter changes so a human-initiated org change is visible immediately. This scenario is nearly always self-inflicted by a well-meaning platform change — process, not heroics, prevents it.
Scenario D — An IAM change that locks out a workload
Symptom. A batch service that has run for months suddenly fails. Cloud Run / GKE logs show PERMISSION_DENIED: caller does not have permission calling Cloud Storage or Pub/Sub. The code didn’t change; the service account didn’t change. It worked yesterday; it fails today.
Hypotheses.
- A role binding was removed from the service account (someone “cleaned up” IAM, or an over-broad binding was tightened at the project/folder level and the SA lost an inherited role).
- A deny policy or IAM Condition now matches and blocks the call (a deny overrides any allow; a time- or resource-bound condition stopped matching).
- A service account key was disabled/deleted or expired, or the SA itself was disabled.
- A higher-level (org/folder) policy change removed the role via inheritance (overlaps with Scenario C).
- Workload Identity Federation / Workload Identity mapping broke (wrong
iam.serviceAccounts.actAs/roles/iam.workloadIdentityUserbinding).
Cross-service diagnosis. The symptom is PERMISSION_DENIED from a previously-working identity, so the cause is an identity or policy change, not code. Two tools do the work: the Policy Troubleshooter (does this principal have this permission on this resource right now, and why/why not) and the Audit Logs (what changed).
- Ask the Troubleshooter the exact question:
gcloud policy-troubleshoot iam \
  //storage.googleapis.com/projects/_/buckets/batch-output \
  --principal-email=batch-runner@PROJECT_ID.iam.gserviceaccount.com \
  --permission=storage.objects.create
It returns GRANTED/NOT_GRANTED and the bindings it evaluated, including which deny rule or missing role is responsible — it walks inheritance for you.
- Find the change in Admin Activity audit logs —
SetIamPolicy,CreatePolicy/UpdatePolicy(deny),DisableServiceAccount,DisableServiceAccountKey:
gcloud logging read '
  (protoPayload.methodName="SetIamPolicy"
   OR protoPayload.methodName:"DenyPolicy"
   OR protoPayload.methodName:"DisableServiceAccount")
  AND (protoPayload.request.policy.bindings.members:"batch-runner@PROJECT_ID.iam.gserviceaccount.com"
       OR protoPayload.resourceName:"batch-runner")
  AND timestamp>="2026-06-14T00:00:00Z"
' --project=PROJECT_ID --order=asc \
  --format='table(timestamp, protoPayload.authenticationInfo.principalEmail,
                  protoPayload.methodName, protoPayload.resourceName)'
- Check for a deny policy and conditions explicitly — a deny is invisible in the standard allow-policy view:
gcloud iam policies list --attachment-point=cloudresourcemanager.googleapis.com/projects/PROJECT_ID \
  --kind=denypolicies
- Check the SA itself isn’t disabled, and that any key is enabled:
gcloud iam service-accounts describe batch-runner@PROJECT_ID.iam.gserviceaccount.com \
  --format='value(disabled)'
Fix.
- Mitigate: restore the missing binding (least privilege — grant the specific predefined role the Troubleshooter says is missing, not Editor), or remove/adjust the offending deny policy or condition, or re-enable the SA/key.
# Re-grant the exact role the Troubleshooter flagged as missing
gcloud projects add-iam-policy-binding PROJECT_ID \
  --member="serviceAccount:batch-runner@PROJECT_ID.iam.gserviceaccount.com" \
  --role="roles/storage.objectAdmin" --condition=None
- Prevent: manage IAM as code (Terraform) so removals are reviewed and reversible; avoid hand-editing bindings in the console; prefer groups over per-SA bindings so cleanups are predictable; use deny policies and conditions sparingly and test them; replace long-lived keys with Workload Identity Federation so there are no keys to disable or expire. Add an alert on
SetIamPolicyfor sensitive resources. The lesson learned is usually “an IAM cleanup had unintended blast radius” — version control and review are the fix.
Scenario E — A Cloud DNS / load-balancer / certificate failure
Symptom. Users report app.example.com is down or showing a browser TLS warning (NET::ERR_CERT_… / SSL_ERROR). Crucially, your backend metrics look healthy — low error rate, normal latency, normal but reduced traffic. The uptime check from outside is red; internal health checks are green. Requests aren’t reaching the backends.
Hypotheses.
- DNS: the record for
app.example.comis wrong, missing, points at the old/changed LB IP, or a DNSSEC/delegation problem; or a Cloud DNS response policy is intercepting it. - Load balancer: the forwarding rule / target proxy / URL map is misconfigured, the LB IP changed, or all backends are marked unhealthy by the health check (so the LB has nothing to send to — returns 502/503).
- Certificate: the Google-managed SSL cert is
FAILED_NOT_VISIBLE/ not yetACTIVE(domain-validation DNS not in place), or a self-managed cert expired, or the cert doesn’t cover the SNI hostname.
Cross-service diagnosis. The signature — users can’t connect but backends are healthy and traffic is down — means the failure is in the front door, above your code. Work the request path from the outside in: DNS → LB front end → certificate → backends.
- DNS first. Resolve the name and compare to the LB’s actual IP:
dig +short app.example.com            # what users get
gcloud compute forwarding-rules list --global \
  --format='table(name, IPAddress, target)'   # what the LB actually is
gcloud dns record-sets list --zone=example-zone --name=app.example.com.
If they differ, DNS is the cause (a record was edited, or the LB IP wasn’t reserved as static and changed on recreate).
- Certificate next. Check the managed cert status —
ACTIVEvsPROVISIONING/FAILED_NOT_VISIBLE, and the domains it covers and its expiry:
gcloud compute ssl-certificates describe app-cert --global \
  --format='value(managed.status, managed.domainStatus, expireTime)'
FAILED_NOT_VISIBLE almost always means the DNS A/AAAA record for the domain isn’t pointing at this LB yet, so Google can’t complete domain validation — which ties DNS and cert together. A self-managed cert past expireTime is the other classic.
- Load balancer last. If DNS and cert are fine, check backend health (a health-check misconfig can mark every backend unhealthy, so the LB returns 502/503 even though the app is fine):
gcloud compute backend-services get-health app-backend --global
gcloud compute url-maps describe app-urlmap   # path/host rules correct?
A misconfigured health-check path (checking / when the app only answers /healthz) marks all backends down — the single most common “LB returns 502 but the app is healthy” cause.
Fix.
- DNS: correct the record to the LB’s static IP; ensure the LB IP is a reserved static address so it never changes; lower TTL during the fix so the correction propagates fast; check DNSSEC and delegation if resolution fails entirely.
- Certificate: for managed certs, fix the validating DNS record and wait for
ACTIVE(provisioning can take up to ~60 minutes); for expired self-managed certs, rotate immediately and put expiry on an alert. Ensure the cert’s domains include the exact SNI hostname. - Load balancer: fix the health-check path/port so backends report healthy; correct the URL map host/path rules; verify the forwarding rule → target proxy → cert chain.
# Reserve the LB IP so it never changes again, then point DNS at it
gcloud compute addresses create app-lb-ip --global
gcloud dns record-sets update app.example.com. --zone=example-zone \
  --type=A --ttl=300 --rrdatas="$(gcloud compute addresses describe app-lb-ip --global --format='value(address)')"

# Fix the health check that was marking everything unhealthy
gcloud compute health-checks update http app-hc --request-path=/healthz --port=8080
- Prevent: alert on certificate expiry (and on managed-cert non-
ACTIVEstatus); use static reserved IPs for all LB front ends; uptime-check the real user hostname over HTTPS from multiple regions (which catches DNS and cert and LB in one signal); manage DNS and LB config as code so changes are reviewed.
Hands-on lab: build the war-room signals and find a planted change
You’ll stand up the observability you need before an incident, then practise the correlation move — using Audit Logs to find a change you plant yourself. Free-tier friendly; Cloud Monitoring and Logging have generous free allotments.
1. Set up.
export PROJECT_ID="$(gcloud config get-value project)"
gcloud services enable monitoring.googleapis.com logging.googleapis.com \
  cloudtrace.googleapis.com clouderrorreporting.googleapis.com \
  --project="$PROJECT_ID"
2. Create a uptime check + alerting policy (the detect phase). Create an uptime check on any public endpoint you own, then an alert policy that pages on failure. Via CLI you can create the alert from a JSON/YAML policy; the console wizard is fine too. Expected: the policy shows in gcloud alpha monitoring policies list.
gcloud alpha monitoring policies list --format='table(displayName, enabled, conditions[].displayName)'
3. Build a log-based metric for errors (a war-room signal). Count severity≥ERROR log entries so you can alert on an error spike:
gcloud logging metrics create app_error_count \
  --description="App errors (severity>=ERROR)" \
  --log-filter='severity>=ERROR'
gcloud logging metrics describe app_error_count   # validation
4. Plant a change and find it (the correlation drill). Make a deliberate, harmless IAM change, note the time, then hunt it in the Audit Logs exactly as you would in an incident:
# The "change" — grant then immediately remove a trivial role to a test SA
TS_BEFORE="$(date -u +%Y-%m-%dT%H:%M:%SZ)"
gcloud projects add-iam-policy-binding "$PROJECT_ID" \
  --member="serviceAccount:$(gcloud iam service-accounts list --format='value(email)' --limit=1)" \
  --role="roles/browser" --condition=None >/dev/null

# Now find it — who did what, since TS_BEFORE
gcloud logging read "
  protoPayload.methodName=\"SetIamPolicy\"
  AND timestamp>=\"$TS_BEFORE\"
" --project="$PROJECT_ID" --order=asc \
  --format='table(timestamp, protoPayload.authenticationInfo.principalEmail, protoPayload.methodName)'
Expected output: a row showing your principal email and SetIamPolicy at the time you ran it. That is the exact muscle you use in Scenarios C and D to find the contributing change.
5. Explore the four pillars. Open Logs Explorer (run severity>=ERROR over the last hour), Cloud Trace (if you have a traced service), Error Reporting (it auto-populates from logged exceptions), and Personalised Service Health (Console → Service Health) to see whether any Google incident is active for the project.
Cleanup
# Remove the planted binding and the lab artefacts
gcloud projects remove-iam-policy-binding "$PROJECT_ID" \
  --member="serviceAccount:$(gcloud iam service-accounts list --format='value(email)' --limit=1)" \
  --role="roles/browser" --condition=None
gcloud logging metrics delete app_error_count --quiet
# Delete the uptime check + alert policy from the Console (Monitoring → Uptime / Alerting)
Cost note
Cloud Logging includes the first 50 GiB of ingestion per project per month free; Cloud Monitoring metrics and the first uptime checks are free within generous limits; Cloud Trace and Error Reporting have free monthly allotments. This lab stays comfortably inside the free tier — the only thing that ever surprises people is log ingestion volume at scale, so set a logs exclusion filter for chatty, low-value logs and a budget alert in real projects.
Common beginner mistakes
These are mindset traps, not symptom→fix items (those are in the troubleshooting table further down). Each is a misconception, why it’s wrong, and the mental model that replaces it.
- “The service that’s throwing errors is where the bug is.” In a cascade the symptom is usually layers away from the cause — in Scenario A the frontend 503s, but the fault is DB connection exhaustion two hops down. Right model: treat the erroring service as the end of a chain and walk the dependency graph backward toward the shared resource.
- “I can’t fix it until I understand it.” Mitigation almost never requires the root cause. Roll back, fail over, raise the quota, flip the flag — restore users first, investigate second. Right model: mitigate-first is a distinct phase from RCA; the IC enforces the separation.
- “Nothing changed.” Something almost always changed — a deploy, a feature flag, a policy edit, a traffic pattern, or a Google maintenance event. “Nothing changed” usually means “I haven’t queried the audit log yet.” Right model: anchor the timeline and hunt the change before you theorise.
- “More retries make it more reliable.” Naive retries against a struggling dependency create a retry storm that accelerates collapse. Right model: bounded retries with jittered backoff, retry budgets, and circuit breakers — and cap concurrency during the incident to shrink the fan-out.
- “The root cause was human error.” “Someone fat-fingered the policy” is where a blameful analysis stops, and it teaches you nothing. Right model: ask why the system let a normal human action cause an outage — no dry-run, no review, no alert — and fix those gaps.
- “Every incident has a single root cause.” Complex incidents are chains of contributing factors (a latent gap + a trigger + an amplifier). Right model: list several factors and fix each independently; resilience comes from closing multiple holes, not one.
- “I’ll start by grepping the logs.” On a multi-service incident, diving into raw logs first drowns you. Right model: golden signals first (what / how bad), then localise the layer, then Trace / Error Reporting / Logs for the exact failing request.
- “We’re in the cloud, so one zone failing can’t take us down.” Only if the architecture is genuinely multi-zone/regional. A zonal MIG or a pet pinned to
-bturns a zonal blip into a total outage. Right model: regional-by-default — and verify it, don’t assume it. - “PSH is green, so it’s not infrastructure.” PSH covers Google’s incidents; green just means the platform is healthy. Your own quota, policy, DNS, or certificate can still be the infra fault. Right model: PSH rules out Google, not your own infrastructure.
Going deeper
Everything above gets users working again. This section is for the reader who wants to run the craft of RCA well — the method, the postmortem, and the systemic domains (quotas, alerting math, cost/scale, and the shifting gcloud surface) that separate a tidy incident from a repeat offender.
The RCA method: timeline, 5-whys, and contributing factors
The single most valuable RCA artefact is a timeline — a plain, timestamped list, in UTC, of every relevant event: the first change, the first symptom, detection, each hypothesis and mitigation you tried, and resolution. You build it from hard sources, not memory: Admin Activity audit logs, deploy/release history, alert firing times, the metric inflection point, and the incident chat. From the timeline you get the incident’s vital signs — MTTD (change → detection), MTTA (detection → acknowledgement), and MTTR (detection → resolution) — which tell you where to invest. A large MTTD means detection is weak; a large MTTR means mitigation was slow or the runbook was missing.
On top of the timeline you run 5-whys — but do it well, because it has a famous failure mode. Take Scenario A:
- Why did checkout 5xx? The payment service couldn’t get a database connection.
- Why? Cloud SQL was pinned at
max_connections. - Why?
instances × pool-sizeexceeded the limit when autoscaling kicked in. - Why did that overshoot? There was no connection pooler, and pool sizing wasn’t bounded against the DB limit.
- Why wasn’t it caught? No alert on connection-pool saturation, and no load test at marketing-spike traffic.
The trap is stopping at “an engineer set the pool size too high” — human error is never a root cause; it’s a prompt to ask why the system let a normal human action cause an outage. A good 5-whys ends at system gaps (no pooler, no bound, no alert, no load test), each of which becomes a fix.
That is also why senior write-ups avoid the phrase “the root cause”. Complex incidents follow the Swiss-cheese model: several latent holes (no pooler, no quota headroom) line up with a trigger (a traffic bump, a zonal drain) and an amplifier (retries) to let failure pass all the way through. There isn’t one cause; there are contributing factors, and listing them yields independent fixes — you can add pooling and an alert and backoff, and each one alone would have made the incident smaller. Fixing a single “root cause” and declaring victory is how you meet the same outage again next quarter.
Anatomy of a blameless postmortem
A postmortem is a document, and a good one has a fixed skeleton so nothing important is skipped:
- Summary — two or three sentences: what broke, for whom, how long.
- Impact — quantified: users/requests affected, duration, error-budget spent, and revenue or SLA implications where known. Numbers make the follow-ups fundable.
- Timeline — the UTC timeline from above, including detection and each mitigation.
- Contributing factors — the Swiss-cheese holes, not one “root cause”.
- What went well / what went poorly / where we got lucky — the “got lucky” line is the most valuable and the most skipped: it surfaces near-misses (the DR replica happened to be current; the second zone happened to have headroom) before luck runs out.
- Action items (CAPA) — each with a single owner, a due date, and a tracking link. “The team will improve monitoring” is not an action item; “Add a burn-rate alert on pool saturation — Asha — 2026-07-01 — JIRA-1234” is.
- Lessons learned — the transferable insight for teams who weren’t in the room.
The word that matters is blameless. Assume everyone acted reasonably with the information they had; describe systems and actions, not people (“the 09:00 policy change”, not “Ravi’s mistake”); run the review as a calm learning meeting, then publish it widely. This isn’t kindness for its own sake — blame makes engineers hide detail, and hidden detail is exactly what the next responder needs. Psychological safety is a reliability control.
Quotas, limits, and rate limits as reliability primitives
Scenario A hinged on a limit, and limits deserve first-class treatment because they fail silently until they don’t. Three different things get conflated:
- Allocation quotas — a ceiling on how much of a resource you can hold at once (CPUs per region, in-use external IPs, GPUs). Hitting one blocks creation/scale-up — your autoscaler simply can’t get more capacity.
- Rate quotas — how many API calls you may make per unit time (e.g. reads per 100 seconds per API). Exceeding one returns
429 RESOURCE_EXHAUSTED. - System limits — hard properties of a resource, like Cloud SQL
max_connectionsor a message-size cap. Not raiseable by a quota request; you change the tier or the design.
Know the error signatures: a 429/RESOURCE_EXHAUSTED is a rate problem (back off and retry), a 503 is overload/unavailable (shed load, scale), and a quota error on a create call is an allocation ceiling (request an increase or free capacity). Rate limits are usually token buckets, which is why a workload whose average rate fits the quota can still 429 on a burst — the bucket drains faster than it refills. The fix is client-side smoothing (backoff + jitter), not just “request more quota”.
Instrument limits before they bite. Cloud Monitoring exposes consumer-quota metrics you should build ~80%-of-limit alerts on:
# Consumer-quota metrics to alert on (view/graph in Metrics Explorer):
#   serviceruntime.googleapis.com/quota/allocation/usage   -- how much you hold
#   serviceruntime.googleapis.com/quota/rate/net_usage     -- your call rate
#   serviceruntime.googleapis.com/quota/limit              -- the current ceiling
#   serviceruntime.googleapis.com/quota/exceeded           -- fires when you hit it
Two operational habits matter: quota-increase requests take time to approve, so pre-request headroom before a launch or sale rather than during the incident; and Active Assist / Recommender surfaces quota (and reliability) recommendations proactively — check them in RCA to find the warning you slept through.
Burn-rate alerting: why it beats “CPU > 80%”
Static-threshold alerts page you for things users don’t feel and stay quiet for things they do. SLO burn-rate alerting fixes both. If your SLO is 99.9% (error budget 0.1%), the burn rate is how many times faster than budget-neutral you’re spending: a sustained 1% error rate burns the budget at ~10× and would exhaust a 30-day budget in ~3 days. The high-signal pattern is a multi-window, multi-burn-rate alert: page on a fast window (e.g. a 1-hour window burning at ~14.4×, which spends ~2% of a 30-day budget in an hour → acute) and require a short confirming sub-window so a one-off blip doesn’t page; add a second, gentler pair (e.g. a 6-hour window at ~6×) to catch slow leaks the fast alert misses. Requiring the short and long window to fire together is what kills false alarms — a shape no CPU threshold can express. Cloud Monitoring’s SLO/burn-rate alerting builds exactly these.
Cost and scale nuances of the observability stack
At small scale the four pillars are near-free; at scale the bill and the query latency come from a few predictable places:
- Log ingestion is the surprise. After the free allotment (representative: the first 50 GiB/project/month), ingestion is billed per GiB (representative: ~$0.50/GiB — check current pricing). Tame it with exclusion filters for chatty low-value logs, route long-retention copies to a cheaper sink (Cloud Storage or BigQuery), and only enable Data Access audit logs where you truly need them (they can dwarf everything else).
- Log Analytics needs a bucket upgraded to Log Analytics to run SQL over logs — do this on your
_Default(or a dedicated bucket) before the incident, not during. - Trace sampling controls Trace cost and overhead — but remember the flip side from earlier: aggressive sampling means your one failing request may not be recorded.
- Metric cardinality is the Monitoring foot-gun: a custom metric labelled with something high-cardinality (user ID, request ID) explodes time-series count, cost, and query time. Keep labels low-cardinality.
API-surface and version caveats
The commands in this lesson are correct as written, but the observability surface moves, so sanity-check a few things in your own environment:
- Personalised Service Health is under
gcloud beta service-healthand has its own alerting integration — wire PSH alerts so the platform tells you before your users do. - Log Analytics requires the bucket upgrade noted above; its SQL dialect is BigQuery’s.
- Cloud Monitoring supports both MQL and PromQL for queries and alert conditions; newer work increasingly uses PromQL. Some policy commands still live under
gcloud alpha monitoring— expect them to graduate to GA over time. - IAM deny policies are managed via
gcloud iam policies(--kind=denypolicies) and are invisible in the standard allow-policy view — always check them explicitly, as Scenario D does. The Policy Troubleshooter (gcloud policy-troubleshoot iam) evaluates allow and deny and conditions across inheritance in one call. - Org Policy dry-run uses
enforcementMode: DRY_RUN(adryRunSpecalongside the livespec): roll perimeters and constraints out in dry-run, read the would-block violations, then enforce.
Because these graduate between alpha/beta/GA over time, a quick gcloud components update and gcloud <group> --help before you lean on an unfamiliar command in a SEV1 is cheap insurance.
Common mistakes & troubleshooting
| Symptom | Cause | Fix |
|---|---|---|
| Chasing the root cause while users stay down | Treating an incident like a debugging session | Mitigate first (rollback/failover/scale), RCA after; the IC enforces this |
| Five people, five theories, no progress | No Incident Commander; no single source of truth | Name an IC who coordinates (doesn’t type); one incident doc with the timeline |
| Spending an hour on your code, then finding it was Google | Didn’t check Personalised Service Health early | Rule out the platform first for any broad/regional symptom |
| “Nothing changed” but everything broke at once | A config/Org Policy/IAM change you didn’t make | Query Admin Activity Audit Logs in the incident window — find the change |
| Errors that span multiple projects blamed on one app | App bugs don’t cross project boundaries | Breadth + simultaneity ⇒ look above the project (org/folder policy, VPC-SC) |
| LB returns 502/503 but the app is healthy | Health-check path/port wrong ⇒ all backends marked unhealthy | Fix the health-check probe to hit a real healthy endpoint |
| A retry made the outage worse | Retry storm amplifying load on a failing dependency | Add jittered backoff + circuit breakers; cap concurrency |
| Postmortem names one person as “the cause” | Blameful culture; stops at human error | Blameless framing: ask why the system let the mistake cause an outage |
Best practices
- Pre-build the war-room dashboard and runbooks. During a SEV1 is the wrong time to write a query. Have the golden-signals dashboard, the “what changed” Audit Log query, and per-scenario runbooks ready.
- Alert on SLO burn rate, not raw thresholds. Multi-window burn-rate alerts page you for user-impacting problems and stay quiet for noise — far better than “CPU > 80%”.
- Make mitigation reversible and fast. Keep deploys rollback-able (Cloud Deploy/Cloud Run revisions), keep traffic splitting ready, keep failover rehearsed.
- Design for the failure modes above by default: regional resources, connection pooling, static LB IPs, dry-run policy rollouts, IAM-as-code. Most incidents in this lesson are preventable architecture/process gaps.
- Run game days. Rehearse a regional failover and a quota-exhaustion drill so the runbook is muscle memory and the gaps surface in daylight.
- Track CAPA to closure. A postmortem with un-actioned items is theatre. Owners, dates, and a review.
Security notes
- Audit Logs are your incident black box — protect them. Ensure Admin Activity (always on) and Data Access audit logs are enabled where you need “who read/changed what”, and export logs to a sink (a separate logging project / BigQuery / Cloud Storage) so an attacker who gains project access can’t erase the evidence. Lock the sink destination down.
- Incidents and breaches overlap. A “permission denied” storm can be a misconfiguration or an attacker tripping VPC-SC/deny policies. Treat unexplained IAM/policy changes as potential security events and loop in security early.
- Least privilege in the fix, too. Under pressure it’s tempting to grant Owner to “just make it work”. Grant the specific role the Policy Troubleshooter identifies; over-grants made in incidents become tomorrow’s audit findings.
- Don’t paste secrets into the incident doc. Connection strings, tokens and keys gathered while debugging do not belong in a shared timeline; reference Secret Manager, don’t copy values.
- VPC-SC and Org Policy are security controls. When you revert one to mitigate, you may be reducing protection — note it explicitly and restore the control (scoped, in dry-run first) as a CAPA item.
Interview & exam questions
Q1. In an incident, what do you do first — find the root cause or mitigate? Mitigate. Restore service for users (rollback, failover, scale, raise quota, feature-flag) before fully understanding the cause. Root-cause analysis happens after the bleeding stops. Leading with RCA prolongs the outage.
Q2. What does the Incident Commander actually do? Coordinates the response — decides, delegates, time-boxes hypotheses, maintains the single source of truth, and runs comms cadence. The IC does not do the hands-on fixing; they keep the room organised and the team focused on one mitigation at a time.
Q3. Errors and latency are up but traffic is roughly flat. What class of problem is that, versus errors up with traffic up? Flat traffic + rising errors/latency ⇒ you hit a ceiling (quota/connection/limit) or a dependency is failing. Rising traffic + rising errors/latency/saturation ⇒ overload. The traffic shape distinguishes “we broke” from “we got flooded”.
Q4. Which Google Cloud tool tells you whether Google itself is having an incident affecting your project, and why check it early? Personalised Service Health (PSH) — project-scoped, relevance-filtered, with an API and alerts. Check it early for any broad/regional symptom because if it’s a Google outage, the correct response is failover, not debugging your code.
Q5. Several projects start failing at the same minute with different errors. Where do you look and why?
Above the project — the Organization/folder Audit Logs for Org Policy (SetOrgPolicy) and VPC Service Controls perimeter changes. Breadth across projects plus simultaneity can’t come from one app bug; it comes from an inherited policy/perimeter change.
Q6. How do you tell an Org Policy denial from a VPC Service Controls denial in the logs?
Org Policy reads as Constraint constraints/… violated / FAILED_PRECONDITION on create/modify calls. VPC-SC reads as Request is prohibited by organization's policy with a vpcServiceControlsUniqueIdentifier and a violation of type VPC_SERVICE_CONTROLS. VPC-SC denials are separately queryable by that violation type.
Q7. A service account that worked yesterday now gets PERMISSION_DENIED. Walk through the diagnosis.
The cause is an identity/policy change, not code. Use the Policy Troubleshooter to see whether the permission is granted now and which binding/deny is responsible, then query Audit Logs for SetIamPolicy, deny-policy changes, or DisableServiceAccount(Key) in the window. Check for a deny policy and IAM Conditions explicitly, and confirm the SA/key isn’t disabled. Fix with the specific missing role.
Q8. Why roll out VPC Service Controls and Org Policies in dry-run mode first? Dry-run logs what would be blocked without actually blocking it, so you see the full blast radius in the violation logs and fix legitimate flows (ingress/egress rules, access levels) before enforcing. It’s the single best defence against the Scenario-C blast radius.
Q9. Users get a TLS error but your backends are healthy and traffic is down. Where is the fault and how do you confirm?
In the front door, above the app: DNS, the load-balancer front end, or the certificate. Confirm by working outside-in — dig the hostname vs the LB’s actual (static) IP, check the managed SSL cert status (ACTIVE vs FAILED_NOT_VISIBLE/expired), then backend health and the URL map. FAILED_NOT_VISIBLE usually means DNS isn’t pointing at the LB so validation can’t complete.
Q10. What is a retry storm and how do you stop one amplifying an incident? When a dependency slows or fails, naive clients retry, multiplying load on the already-struggling dependency and accelerating collapse. Stop it with jittered exponential backoff, retry budgets, and circuit breakers; during the incident, cap concurrency/instances to reduce the fan-out.
Q11. What makes a postmortem “blameless”, and why does it matter? It focuses on why the system allowed a mistake to cause an outage, not who made it — assuming people acted reasonably with the information they had. It matters because blame drives engineers to hide information, which destroys the learning; psychological safety produces honest timelines and real fixes.
Q12. What’s the difference between a contributing factor and a single root cause, and why prefer the former? Complex incidents rarely have one cause; they’re a chain (a latent limit + an amplifier + a trigger, e.g. Scenario A). Listing contributing factors yields multiple independent fixes (alert on saturation and add pooling and add backoff), which is more resilient than fixing one “root cause” and calling it done.
Practice challenges
Six graded exercises, escalating from reading the signals to reconstructing a full multi-service cascade. Work each yourself before opening the walkthrough. These are the real muscle of the lesson — the RCA reasoning, not just the commands.
1. Classify three incidents from their golden-signal shapes (beginner). For each, name the likely class and your first move: (a) errors ↑, latency ↑, traffic flat; (b) errors ↑, latency ↑, saturation ↑, traffic ↑; © errors ↑ but traffic ↓, backends healthy.
<details><summary>Show RCA walkthrough</summary>
- (a) A ceiling — a quota/connection/rate limit, or a failing dependency. Traffic didn’t rise, so you weren’t flooded; you hit a wall. First move: check quotas/connection-pool saturation, and rule out Google with PSH.
- (b) Overload — demand outran capacity. Scale out / shed load / let the autoscaler catch up, and check for an allocation quota (regional CPUs) silently blocking the scale-up.
- © A front-door fault above your code — DNS, load balancer, or certificate — because requests aren’t even reaching healthy backends. First move:
digthe hostname vs the LB’s static IP, then check the managed-cert status.
Why: the shape of the four golden signals classifies the incident before you read a single log line. </details>
2. A Pub/Sub pipeline falls behind (intermediate). An order-processing pipeline (Cloud Run push subscriber → Cloud SQL) starts lagging: subscription/oldest_unacked_message_age climbs past 20 minutes, subscription/num_undelivered_messages grows, publishers begin getting 429s, and downstream reports go stale. No deploy. Diagnose the cascade and give the mitigate-first move.
<details><summary>Show RCA walkthrough</summary>
Publishers 429 ⇒ a publish rate/flow-control ceiling, but that’s a symptom: the real driver is the subscriber not acking fast enough, so the backlog (num_undelivered_messages, oldest_unacked_message_age) grows and Pub/Sub’s at-least-once delivery starts redelivering, piling more load on. Trace a slow subscriber request → the Cloud SQL write is slow (connections saturated or a lock). The cascade: slow DB → slow acks → growing backlog → redelivery amplification → publisher throttling.
Mitigate first: scale the subscriber (Cloud Run --max-instances up, bounded by DB capacity so you don’t re-run Scenario A), raise the ack deadline so in-flight work isn’t redelivered mid-processing, and relieve the DB (pooler / raise max_connections). Prevent: alert on oldest_unacked_message_age, attach a dead-letter topic, set flow control, and right-size pools.
Why: a subscriber that can’t keep up turns at-least-once delivery into a self-amplifying backlog — the same shape as a retry storm, one layer up. </details>
3. Find the slow hop with a trace (intermediate). Checkout p99 jumps from 300 ms to 3 s at 14:05; error rate is normal; traffic is normal; product and cart pages are fine. Using the correlation workflow, where do you look and what’s the likely cause class?
<details><summary>Show RCA walkthrough</summary>
Latency ↑, errors flat, traffic flat, and only checkout affected ⇒ a slow downstream on the checkout path, not an outage. Anchor 14:05; run the “what changed” audit-log query (a config/flag edit?) and glance at PSH. Then open Cloud Trace, filter to checkout in the window, sort by latency, open a 3 s exemplar, and walk the span waterfall: the child span that ballooned (e.g. an external payment-gateway call, a Cloud SQL query that lost its index after a migration, or a Spanner hot key) is the hop. Pull the correlated logs by trace ID for the slow-query / error string.
Likely classes: a degraded downstream dependency, a missing/unused index, a hot key, or an N+1 introduced by a deploy.
Why: single-endpoint latency with flat errors is a where-is-the-time-spent problem — the trace waterfall answers it directly, and trace→log correlation gives you the exact cause line. </details>
4. Many projects, one minute, different errors (advanced). At 09:12, across four projects: a Dataflow job can’t read from BigQuery, a Cloud Function deploy fails with a policy error, a bucket write is denied, and a VM create is rejected. Different services, same minute, multiple projects. Localise it and decide the mitigation.
<details><summary>Show RCA walkthrough</summary>
Breadth across projects + simultaneity ⇒ look above the project. Query org/folder Admin Activity for SetOrgPolicy and Access Context Manager (VPC-SC) methods in the window. Distinguish by error string: Org Policy ⇒ Constraint constraints/… violated / FAILED_PRECONDITION on create/modify; VPC-SC ⇒ Request is prohibited by organization's policy with a vpcServiceControlsUniqueIdentifier (also queryable by violation type VPC_SERVICE_CONTROLS). The mix here — a deploy blocked and cross-service API reads (BigQuery/Storage) blocked — smells like a VPC-SC perimeter change that added restricted services, possibly alongside an Org Policy edit.
Mitigate: revert the change — reset the org policy to inherit, or roll back the perimeter edit; if it must stay, add a scoped ingress/egress rule or access level to re-permit the broken flow rather than removing the whole control. Prevent: dry-run perimeters/policies, IAM/policy-as-code with review, and alert on SetOrgPolicy/perimeter methods.
Why: only something in the resource hierarchy (org/folder policy, or a perimeter) can break many projects at the same instant. </details>
5. The service account that worked yesterday (advanced). A nightly export SA gets PERMISSION_DENIED writing to a bucket. Its allow-policy binding (roles/storage.objectAdmin) is still present and correct. What are you missing, and how do you prove it?
<details><summary>Show RCA walkthrough</summary>
An allow binding being present doesn’t mean access is granted — a deny policy overrides allow, and an IAM Condition can silently stop matching. Run the Policy Troubleshooter for the exact principal + permission + resource; it returns GRANTED/NOT_GRANTED and the responsible binding/deny, walking inheritance for you. Two usual suspects: (1) a deny policy was attached (invisible in the standard allow view — list --kind=denypolicies); (2) the allow binding carries a condition (e.g. a request.time window, or a resource.name prefix that no longer matches after a bucket rename). Also confirm the SA/key isn’t disabled and that no folder/org change removed an inherited role.
Mitigate: remove/adjust the deny or fix the condition (or re-grant the precise role) — least privilege; only drop --condition=None if the condition itself was the bug.
Why: PERMISSION_DENIED from a previously-working identity is an identity/policy change; deny-over-allow and conditions are the two things a plain allow-policy read hides.
</details>
6. Capstone — reconstruct a full cascade and write the RCA (advanced). Facts, in order: 01:58 PSH shows a planned zonal maintenance drain begins in europe-west1-b. 02:03 the regional MIG tries to recreate lost instances in -a/-c but stalls — the Compute CPUS quota for the region is nearly exhausted. 02:06 the healthy zones carry all traffic; Cloud Run scales up, connection pools multiply, Cloud SQL hits max_connections. 02:08 checkout 5xx hits 20%; clients retry 3×. 02:11 the SLO burn-rate alert pages. Produce: (i) the contributing factors (not one root cause), (ii) a mitigate-first plan in order, (iii) a 5-whys that ends in system fixes, (iv) three CAPA items with owners.
<details><summary>Show RCA walkthrough</summary>
Contributing factors (Swiss cheese): a trigger (the zonal drain — expected and benign on its own), a latent capacity gap (regional CPU quota with no headroom to absorb a lost zone), a latent DB ceiling (no connection pooler, so pools scale linearly with instances), and an amplifier (un-jittered 3× retries). Any one alone is survivable; aligned, they cascade.
Mitigate-first, in order: (1) rule the platform in/out — PSH already shows the drain, so this is capacity, not a Google outage; (2) stop the amplifier and the pool multiplication — cap Cloud Run max-instances / GKE replicas and enable/deploy a connection pooler; (3) relieve the DB — raise max_connections if the tier has the RAM; (4) restore capacity — request an emergency regional CPU-quota bump (or temporarily shift traffic to the DR region); (5) verify 5xx and burn-rate return to baseline before touching root cause.
5-whys (blameless): Why 5xx? The DB refused connections. Why? pools × instances exceeded max_connections. Why did pools multiply? Autoscaling concentrated all load into two zones. Why did that overload us? No regional CPU headroom for a lost zone and no pooler. Why weren’t we warned? No alert on quota-usage ratio or pool saturation. → every answer is a system gap, not “someone drained a zone”.
CAPA (owners illustrative): (a) add pool-saturation + quota-usage-ratio alerts at 80% — Observability lead, 1 wk; (b) adopt a connection pooler and enforce instances × pool ≤ max_connections − headroom in the deploy check — Payments team, 3 wk; © raise the regional CPU quota to survive an N−1 zone loss and rehearse it in a game day — Platform SRE, 2 wk.
Why: complex incidents are chains — the postmortem’s job is to name each independent hole and close it, so the same alignment can’t recur. </details>
Quick check
- True/False: during a SEV1 the Incident Commander should be the one running the most
gcloudcommands. - You see rising errors and latency with flat traffic. Ceiling/limit problem, or overload?
- Which single tool tells you if a Google regional incident is affecting your project?
- Errors across five projects starting at the same minute — project app logs, or org/folder Audit Logs?
- A managed SSL certificate is stuck at
FAILED_NOT_VISIBLE. What’s the most likely cause?
Answers
- False. The IC coordinates and decides; they delegate the hands-on work so they can steer.
- A ceiling/limit problem (quota, connections, rate limit) or a failing dependency — not overload (which would show rising traffic/saturation).
- Personalised Service Health (PSH).
- Org/folder Audit Logs — breadth + simultaneity points above the project (Org Policy / VPC-SC).
- The domain’s DNS A/AAAA record isn’t pointing at this load balancer, so Google can’t complete domain validation.
Exercise
Take one of your own (or a lab) workloads and write a one-page incident runbook for a single scenario from this lesson — say, regional outage or quota exhaustion. It must contain: (1) the detection signal and the exact alert that should fire; (2) the first three diagnostic commands/queries (including the PSH check and the “what changed” Audit Log query); (3) the mitigation step and how to verify it worked; (4) the rollback/abort criterion (“if X doesn’t improve in N minutes, do Y”). Then run a 30-minute game day: have a colleague inject the failure (drain a zone, lower a quota, point DNS wrong) without telling you the details, and execute your runbook. Afterwards, write a short blameless postmortem — timeline, contributing factors, and three CAPA items with owners and dates. You now have both a tested runbook and a postmortem template.
Certification mapping
This lesson maps primarily to the Professional Cloud DevOps Engineer (PCDE) exam — incident response, SLO/SLI and error budgets, blameless postmortems, monitoring/logging/tracing, and reducing toil are core domains — and to the Professional Cloud Architect (PCA) exam’s reliability, observability and operational-excellence themes (the case studies frequently probe failover, DR and capacity/quota planning). The audit-log forensics and VPC-SC/Org Policy/IAM diagnosis also reinforce material on the Professional Cloud Security Engineer (PCSE) exam.
Glossary
- Incident: an unplanned disruption or degradation that needs an urgent, coordinated response — distinct from a routine bug.
- Incident Commander (IC): the person who owns and coordinates the incident response (decisions, delegation, comms) without doing the hands-on fixing.
- Mitigation: any action that restores service to users — rollback, failover, scale, raise a quota, feature-flag — without necessarily fixing the underlying cause.
- RCA (root-cause analysis): the after-the-bleeding-stops investigation into why an incident happened, built on a timeline and contributing factors.
- SEV (severity): the classification of an incident’s business impact (SEV1–SEV4) that drives the response intensity.
- Golden signals: latency, traffic, errors, saturation — the four metrics whose pattern characterises most problems.
- SLO / SLI: the reliability target (Service Level Objective) and the metric it’s measured on (Service Level Indicator); the gap to 100% is your error budget.
- SLO burn rate: how fast you’re consuming your error budget; the basis for high-signal, user-impact alerting.
- Multi-window burn-rate alert: an alert requiring both a fast and a slow window to fire, giving acute sensitivity with few false alarms.
- MTTD / MTTA / MTTR: mean time to detect / acknowledge / resolve — the vital signs you read off the incident timeline.
- Personalised Service Health (PSH): Google Cloud’s project-scoped view of Google-side incidents affecting your resources, with an API and alerting.
- Cloud Trace: distributed tracing that shows where time is spent across the spans of a request.
- Span / span waterfall: one timed segment of a distributed request (parent = whole request, children = downstream calls), read top-down to find the slow hop.
- Trace context: the propagated identifier (
X-Cloud-Trace-Context/ W3Ctraceparent) that ties spans and logs to one request; logs carry a matchingtracefield. - Sampling (traces): recording only a fraction of requests — which is why a specific failing request may be absent from Trace.
- Error Reporting: automatic grouping and deduplication of application errors, with first/last-seen tracking.
- Log Analytics: SQL (BigQuery-backed) querying over Cloud Logging data for ad-hoc joins and aggregation.
- Audit Logs: Admin Activity / Data Access / System Event logs that record who did what on your resources — your incident black box.
- Active Assist / Recommender: Google Cloud’s proactive recommendations (quota, reliability, security, cost) — check them in RCA to find the warning you missed.
- VPC Service Controls (VPC-SC): a service perimeter around managed APIs that can deny otherwise-authorised requests based on origin/destination.
- Org Policy: organization/folder-level constraints that inherit down the resource hierarchy to govern what child projects may do.
- Policy Troubleshooter: the IAM tool that answers “does this principal have this permission on this resource now, and why/why not”, evaluating allow, deny and conditions across inheritance.
- Allocation quota vs rate quota vs limit: a ceiling on resources held at once, vs calls per unit time (
429 RESOURCE_EXHAUSTED), vs a hard system property (e.g.max_connections). - Blast radius: the scope of resources affected by a change or failure.
- Retry storm: self-amplifying load created when clients retry against a failing/slow dependency.
- Circuit breaker / exponential backoff / jitter: client-side patterns that stop retries from amplifying an incident — trip open on repeated failure, and space retries out with randomised, growing delays.
- Contributing factor: one of several aligned causes in a complex incident, preferred over the notion of a single “root cause”.
- 5-whys: an iterative “why?” drill that must end at system gaps, not at “human error”.
- Swiss-cheese model: the mental model where an incident happens only when latent holes line up with a trigger and an amplifier.
- Failover / DR / RTO / RPO: shifting to healthy capacity; disaster recovery; the target recovery time and acceptable data-loss windows.
- Managed instance group (MIG): a group of identical Compute Engine VMs; a regional MIG spreads and self-heals across zones.
- Game day: a rehearsed failure injection to test runbooks and surface gaps in daylight.
- War room: the coordinated space (physical or chat) where the incident response is run against a single source of truth.
- Blameless postmortem: a retrospective that examines why the system allowed an outage, assuming people acted reasonably — to maximise learning.
- CAPA: Corrective And Preventive Actions — the tracked follow-ups from a postmortem, with owners and due dates.
- Dry-run mode: evaluating a policy/perimeter and logging what would be blocked without enforcing it.
Next steps
You can now run a complex Google Cloud incident end to end and turn it into prevention. Next, step up from operating systems to designing them: The Google Cloud Architecting Ladder: From a Static Site to Multi-Region Global (gcp-architecting-ladder-static-site-to-multi-region) — which teaches the resilient, regional-by-default architectures that make most of the incidents in this lesson impossible in the first place. To go deeper on the security controls that featured here, revisit VPC Service Controls (gcp-vpc-service-controls-perimeters-exfiltration-prevention) and IAM deny policies, conditions & impersonation chains (gcp-iam-deny-policies-conditions-impersonation-chains).