In a nutshell
When something breaks on Google Cloud, the temptation is to start changing settings until the error goes away. That is guessing, and guessing is slow, risky, and unrepeatable. This lesson replaces guessing with a method: a fixed sequence you run every single time — observe the symptom, localise which layer owns it, inspect what the platform is already telling you, form one hypothesis, change one thing, verify — plus five ready-made playbooks (IAM, VPC, Compute Engine, Cloud SQL, GKE) that map the symptoms you will actually see straight to their cause, the tool that confirms it, and the fix.
Think of it like a doctor in an emergency room. A good doctor does not prescribe random pills; they take vitals (observe), decide which system is failing — heart, lungs, kidneys (localise) — order the one test that confirms it (inspect), then treat and re-check (verify). Google Cloud hands you the equivalent “tests”: the Policy Troubleshooter for identity, Connectivity Tests for the network, the serial console for a sick VM, kubectl describe for a pod, and Cloud Audit Logs to answer “what changed?” Learn to reach for the right instrument instead of prodding the patient, and problems that used to eat an afternoon collapse into a few minutes.
You do not need to memorise every error message — there are thousands, and new ones ship every week. You need the process and a small set of tools, both of which are stable. Master those here and you can debug a Google Cloud service you have never seen before.
Level: Intermediate · Time: ~38 min · You’ll need: a sandbox project, gcloud, and kubectl with the gke-gcloud-auth-plugin.
The difference between an engineer who has been on call for two weeks and one who has done it for a decade is not that the senior person memorises more error messages. It is that they have a method. When a deployment fails, a VM refuses SSH, or a pod sits Pending at 2am, the experienced operator does not start clicking randomly through the Cloud Console; they reproduce the fault, isolate which layer owns it, compare the live configuration against what it should be, read the logs that the platform is practically shouting at them, form one hypothesis, change one thing, verify, and then write down what they found so the next person — often their future self — does not have to rediscover it. This lesson gives you that method on Google Cloud, and then turns it into concrete, copy-able playbooks for the five areas that generate the overwhelming majority of real support tickets: IAM, VPC and networking, Compute Engine, Cloud SQL, and GKE. Every playbook is a symptom → likely cause → diagnostic step → fix table, because that is exactly the shape your brain needs under pressure.
Learning objectives
By the end of this lesson you will be able to:
- Apply a repeatable, layer-by-layer troubleshooting method to any Google Cloud problem rather than guessing.
- Resolve “permission denied” errors quickly using the Policy Troubleshooter, allow/deny evaluation order, and Cloud Audit Logs to answer “who did what”.
- Diagnose VPC connectivity failures with Connectivity Tests, firewall-rule logging, route inspection, Cloud NAT and Private Google Access.
- Bring back a Compute Engine VM that will not boot or accept SSH using the serial console, metadata and the startup-script logs.
- Fix the common Cloud SQL connectivity traps (private IP, authorised networks, the proxy, IAM database authentication).
- Triage GKE workloads stuck in
Pending,ImagePullBackOff,CrashLoopBackOffor failing Workload Identity and Ingress. - Reach past the basics to Log Analytics SQL, IAM Recommender, Policy Analyzer and log-based metrics when the simple tools run out.
Prerequisites
You should be comfortable navigating the Cloud Console and running gcloud, and you should understand the GCP resource hierarchy (Organisation → Folders → Projects → Resources) and the IAM allow-policy model covered in Google Cloud IAM Fundamentals: Roles, Service Accounts, Policy & Inheritance. Have the Cloud Logging, Cloud Monitoring, Compute Engine, Cloud SQL and Kubernetes Engine APIs enabled on a sandbox project, and the gke-gcloud-auth-plugin installed so kubectl can authenticate. This is the Troubleshooting module of the Zero-to-Hero course; it sits one rung below Advanced Google Cloud Troubleshooting: Complex Multi-Service Incidents & RCA, which handles incidents that span several services at once.
The troubleshooting method
A method matters because the failure modes change constantly but the process does not. Internalise these eight steps and you can debug a service you have never seen before.
| Step | What you do | Why it matters |
|---|---|---|
| 1. Reproduce | Get a reliable, minimal way to trigger the fault — exact command, request, or action. | A bug you cannot reproduce is a bug you cannot confirm you have fixed. |
| 2. Isolate the layer | Decide which layer owns it: identity/IAM, network, compute/host, application, data, or control plane. | Each layer has different tools; guessing the layer wastes the most time. |
| 3. Config vs desired | Compare the actual configuration (gcloud ... describe, kubectl get -o yaml) against what it should be. |
Most outages are a config drift or a recent change, not a platform fault. |
| 4. Inspect logs & metrics | Read Cloud Logging (Logs Explorer / Log Analytics) and Cloud Monitoring; the answer is usually already written there. | The platform tells you what it refused and why if you ask it. |
| 5. Form one hypothesis | State a single, testable theory: “the VM has no route to the internet because Cloud NAT is missing.” | One hypothesis at a time keeps cause and effect clean. |
| 6. Change one thing | Make the smallest possible change to test the hypothesis. | Changing several things at once means you never learn the real cause. |
| 7. Verify | Re-run the reproduction from step 1 and confirm it now succeeds. | “Should be fixed” is not “is fixed.” |
| 8. Prevent | Write it down; add an alert, a guardrail (Org Policy), an IaC change, or a runbook entry. | Turning an incident into a control is what stops the 3am repeat. |
If eight steps feel like a lot to hold in your head at 2am, compress them to six words: observe → localise → inspect → hypothesise → fix → verify (with prevent as the follow-up you owe your team once the fire is out). Reproduce and isolate are the observe-and-localise; config-vs-desired and logs are the inspect; the rest are self-explanatory. The six-word version is what you recall under pressure; the eight-row table is what you actually follow once you have a keyboard.
Two cross-cutting tools underpin every step. Cloud Audit Logs answer who did what, where, and when — Admin Activity logs (always on, no charge) capture every configuration change, and Data Access logs (opt-in) capture reads. When something “suddenly broke,” step 0 is often “what changed?”, and the Activity log is where the culprit confesses. Cloud Logging’s Logs Explorer is your universal lens; learn its query language because a precise filter turns a needle-in-a-haystack search into a one-line answer:
# "Who changed the firewall in the last day?" — Admin Activity audit log
gcloud logging read \
  'logProtoPayload.methodName:"compute.firewalls" AND resource.type="gce_firewall_rule"' \
  --freshness=1d --project=my-project --format="table(timestamp, protoPayload.authenticationInfo.principalEmail, protoPayload.methodName)"
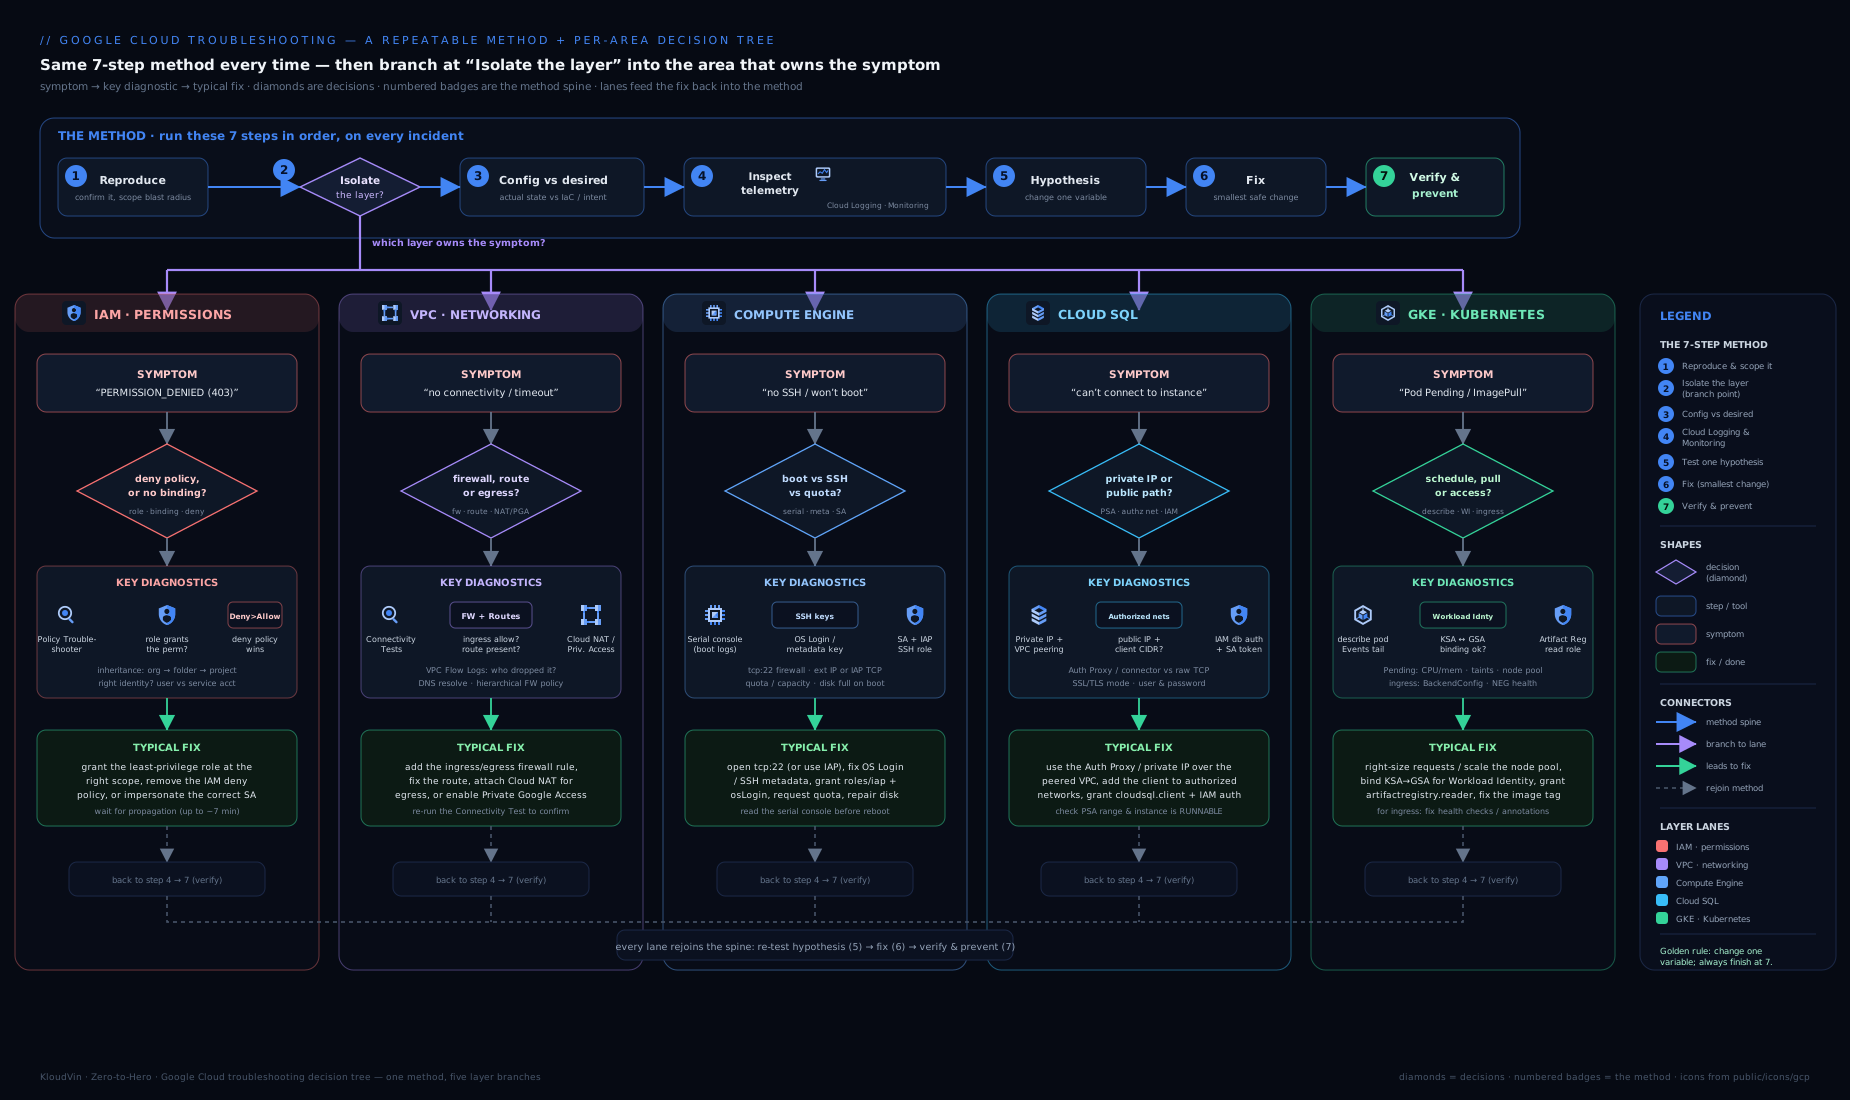
The decision tree above is the method in visual form: start at the symptom, ask which layer owns this?, and follow the branch to the one diagnostic tool that layer answers to — Policy Troubleshooter for identity, Connectivity Tests for the network, the serial console for a host, kubectl describe for a pod. The table below is that same mapping written out, and it is worth committing to memory, because knowing which instrument owns which layer is most of the battle:
| Layer | The first question | Go-to tool | Entry point |
|---|---|---|---|
| Identity / IAM | Does this principal have this permission here? | Policy Troubleshooter; Cloud Audit Logs | gcloud policy-troubleshoot iam |
| Network / VPC | Where does the packet die? | Connectivity Tests (Network Intelligence Center); firewall logging | gcloud network-management connectivity-tests create |
| Compute / host | What did the OS say at boot? | Serial console; startup-script logs | gcloud compute instances get-serial-port-output |
| Data / Cloud SQL | Which connection path, and does its identity have the role? | Auth Proxy logs; Cloud SQL → Connections | proxy stderr; gcloud sql instances describe |
| Container / GKE | What do the pod Events say? | kubectl describe; GKE events; Cloud Logging |
kubectl describe pod; kubectl get events |
| Any (what changed?) | Who changed what, and when? | Cloud Audit Logs (Admin Activity); Log Analytics | gcloud logging read; Log Analytics SQL |
The playbooks that follow are simply this table expanded: for each layer, the specific symptoms you will actually see, and the exact move that resolves each one.
Playbook 1 — IAM: “permission denied”
Almost every IAM failure surfaces as PERMISSION_DENIED or HTTP 403 with a message naming the permission the caller lacked (for example compute.instances.start). The single most useful habit is to read the permission in the error and then ask three questions: does the right principal have a role containing it, is that grant reachable here through inheritance, and is something (a condition or a deny policy) blocking it? The Policy Troubleshooter answers all three at once — give it the principal, the resource, and the permission and it tells you whether access is granted and exactly which binding is (or is not) responsible.
| Symptom | Likely cause | Diagnostic step | Fix |
|---|---|---|---|
PERMISSION_DENIED naming a permission a user expected to have |
No role on this principal grants that permission at this resource | Policy Troubleshooter: gcloud policy-troubleshoot iam <resource> --principal-email=<user> --permission=<perm> |
Grant a predefined role containing the permission at the lowest sufficient node: gcloud projects add-iam-policy-binding |
| User has the role at the project but still denied on one resource | A deny policy at the resource/folder/org overrides the allow (deny wins) | gcloud iam policies list --attachment-point=... / Troubleshooter shows a denying rule |
Amend the deny policy to add an exception principal, or remove the rule |
| Grant exists but only works sometimes / from some IPs | An IAM Condition (CEL) limits the binding by time, IP, or resource tag | Inspect the binding’s condition in get-iam-policy --format=json |
Adjust or remove the condition; verify the request meets it |
| A service / app gets 403 although “the user” is an admin | The code runs as a service account, not the human; the SA lacks the role | Find the SA in the request log principalEmail; check its roles |
Grant the role to the service account, not the human |
cannot act as service account ... when deploying |
Caller lacks iam.serviceAccounts.actAs on the target SA |
Audit log shows the actAs denial |
Grant roles/iam.serviceAccountUser on that SA to the deployer |
| Recently working access broke today | Someone changed a binding or removed a role | Admin Activity audit log: filter methodName:"SetIamPolicy" |
Re-add the binding; consider IaC + Org Policy to prevent drift |
| New grant “not taking effect” | IAM propagation lag, or you edited the wrong node | Re-run Troubleshooter; confirm the resource path | Wait up to ~2 min; verify you edited the correct project/folder |
Remember the evaluation order that makes these traps predictable: deny policies are checked first and always win; allow policies are then unioned across the resource and every ancestor; a binding only grants access if its condition (if any) is true. So “I granted it at the project but it is denied” almost always means either a deny policy or a condition, and the Troubleshooter will name it. If Playbook 1 ever feels shaky on fundamentals, revisit Google Cloud IAM Fundamentals before you continue.
Playbook 2 — VPC & networking: “no connectivity”
Networking failures feel mysterious because the packet dies silently somewhere between source and destination. The cure is to stop guessing and run a Connectivity Test (in Network Intelligence Center): you give it a source, a destination, a port and a protocol, and it simulates the path through your VPC config — firewall rules, routes, peering, Cloud NAT — and tells you the exact hop where the packet would be dropped and why. Pair it with firewall-rule logging (turn it on for the relevant rule and the logs show ALLOW/DENY per connection) and you rarely have to speculate.
| Symptom | Likely cause | Diagnostic step | Fix |
|---|---|---|---|
| Cannot reach a VM on a port (e.g. 443) within the VPC | No firewall rule allows that ingress; default-deny applies | Connectivity Test src→dst on the port; it flags “dropped by firewall” | Add an ingress allow rule with the right target tags/SA, source range and port |
| VM has no internet egress (apt/pip time out), no external IP | No Cloud NAT for the subnet, or a default route is missing | Check routes gcloud compute routes list; Connectivity Test to 8.8.8.8 |
Create a Cloud NAT on the region’s Cloud Router; confirm 0.0.0.0/0 route exists |
| VM cannot reach a Google API (Storage, etc.) with no public IP | Private Google Access is off on the subnet | gcloud compute networks subnets describe --format='value(privateIpGoogleAccess)' |
Enable Private Google Access on the subnet; ensure DNS resolves to private.googleapis.com |
| Two peered VPCs still cannot talk | Peering does not transit, or firewalls block the peer range | Connectivity Test across the peering; check both sides’ rules | Add firewall rules for the peer CIDR; remember peering is non-transitive |
| Traffic ignores your appliance/next hop | A more specific route or default route wins; UDR misconfigured | gcloud compute routes list sorted by priority/prefix |
Add a custom static route with correct priority and next-hop |
| Service in a Shared VPC service project has no network | Subnet not shared, or SA lacks compute.networkUser |
Check Shared VPC subnet IAM in the host project | Grant roles/compute.networkUser on the subnet to the service project SA |
| Intermittent drops / asymmetric routing | NAT port exhaustion, or return path differs from forward path | Cloud NAT logs + Monitoring nat allocation metrics |
Increase NAT ports/IPs (or enable dynamic port allocation); fix routing symmetry |
A useful mental shortcut: GCP firewall rules are stateful, so if the forward connection is allowed the return traffic is automatically permitted — which means a one-way failure is almost never “I forgot the return rule” and almost always a missing forward rule, a route, or NAT.
Playbook 3 — Compute Engine: VM won’t start or won’t SSH
When a VM misbehaves, separate two very different problems: the instance will not enter RUNNING (a control-plane / quota / config issue), versus the instance is running but you cannot reach it (network, OS, or key issue). For the second class, the serial console is your best friend — it shows the boot log and OS messages even when SSH is dead, and it never depends on the network path that SSH does.
| Symptom | Likely cause | Diagnostic step | Fix |
|---|---|---|---|
gcloud compute instances start fails immediately |
Resource/quota shortage in the zone, or stockout for that machine type | Read the operation error; check Quotas page / gcloud compute project-info describe |
Pick another zone/machine type, or request a quota increase |
| VM is RUNNING but SSH times out | No firewall rule allows TCP 22 from your source / IAP range | Connectivity Test to port 22; check ingress rules | Add an allow-22 rule (use IAP range 35.235.240.0/20 for IAP TCP forwarding) |
| SSH refused / “permission denied (publickey)” | Key not provisioned; OS Login vs metadata-key mismatch | Check instance/project metadata enable-oslogin; serial console |
Use OS Login + roles/compute.osLogin, or push a valid key to metadata |
| VM boots then becomes unreachable | A bad startup script or OS misconfig broke networking/sshd | Serial console (--serial-port-output) to read boot + script logs |
Fix the script via metadata; reset; for disk fixes, attach the disk to a rescue VM |
| App on the VM cannot call Google APIs | The attached service account lacks scopes/roles | Check the VM’s SA and access scopes; audit log of the API call | Stop VM, set correct SA/scopes, restart; grant the role to that SA |
| VM “running” but app down after maintenance | Live-migration or host event; app did not recover | Cloud Logging compute.instances system events; guest metrics |
Add auto-healing (MIG health checks); make the app restart-safe |
| Cannot create the VM at all | Org Policy constraint (e.g. shielded VM, allowed images) blocks it | Error names the constraint; check Org Policies on the project | Adjust the policy or choose a compliant image/config |
The single most common SSH mistake is forgetting that IAP-based SSH needs an ingress rule allowing the IAP forwarding range on port 22; gcloud compute ssh --tunnel-through-iap then works without any public IP, which is also the more secure pattern.
Playbook 4 — Cloud SQL: connectivity and authentication
Cloud SQL connectivity confuses people because there are three distinct paths — public IP with authorised networks, private IP via private services access, and the Cloud SQL Auth Proxy — and the failure looks identical (“can’t connect”) regardless of which one you misconfigured. Decide which path you intend to use first, then debug only that path.
| Symptom | Likely cause | Diagnostic step | Fix |
|---|---|---|---|
| App on a VM/GKE cannot reach the instance’s private IP | VPC lacks the private services access peering to Cloud SQL | Check gcloud services vpc-peerings list; Connectivity Test to the instance IP |
Allocate a range and create the servicenetworking peering; enable private IP |
| Connection from your laptop refused (public IP) | Your IP is not in Authorised networks | Cloud SQL → Connections shows allowed CIDRs | Add your IP/CIDR (prefer the Auth Proxy over opening public IP) |
| TLS / cert errors on public connections | “Require SSL/TLS” is on but client sent no cert | Instance flag requireSsl/SSL mode; client connection string |
Use the Auth Proxy (handles TLS) or provide client certs |
access denied for user despite a real account |
Wrong user/host grant, or you meant IAM database authentication | Check DB users; whether IAM auth is enabled on the instance | Use the correct DB user, or enable IAM auth and grant roles/cloudsql.instanceUser |
| Auth Proxy starts but cannot connect | Proxy’s identity lacks roles/cloudsql.client, or wrong instance string |
Proxy stderr logs; verify PROJECT:REGION:INSTANCE |
Grant roles/cloudsql.client to the SA; fix the connection name |
| GKE pod cannot reach Cloud SQL | Workload Identity SA lacks cloudsql.client, or no private path |
Pod logs; check the bound Google SA’s roles | Bind a Google SA with cloudsql.client via Workload Identity, use private IP or proxy sidecar |
| Connections randomly dropped / “too many connections” | Connection-limit flag reached or no pooling | Monitoring database/network/connections; instance flags |
Add connection pooling (or PgBouncer/Auth Proxy), raise max_connections |
A reliable rule of thumb: if you are unsure which path to use, use the Cloud SQL Auth Proxy — it gives you IAM-based authorisation and automatic TLS without opening any public IP, which sidesteps the authorised-networks and certificate categories of failure entirely.
Playbook 5 — GKE: pods that won’t run
Kubernetes adds its own layer on top of the cloud, so GKE troubleshooting is kubectl describe first, GCP second. The flow is almost always the same: kubectl get pods to see the phase, then kubectl describe pod <name> to read the Events at the bottom (they state the real reason in plain English), then kubectl logs for application crashes, and only then drop to Cloud Logging or the node.
| Symptom | Likely cause | Diagnostic step | Fix |
|---|---|---|---|
Pod stuck Pending |
No node has enough CPU/memory; autoscaler cannot add nodes | kubectl describe pod → “FailedScheduling”; check node pool/quota |
Lower requests, enable/expand cluster autoscaler, or add capacity |
ImagePullBackOff / ErrImagePull |
Wrong image name/tag, or no permission to the registry | kubectl describe pod events; check Artifact Registry path |
Fix the image ref; grant the node/Workload Identity SA roles/artifactregistry.reader |
CrashLoopBackOff |
App exits on start (bad config, missing env/secret, failing probe) | kubectl logs <pod> --previous; check liveness probe |
Fix the app/config; correct probe path, port and timing |
| Pod cannot call a Google API (e.g. Storage) | Workload Identity not configured or SA mapping wrong | Check KSA annotation + GSA IAM binding (roles/iam.workloadIdentityUser) |
Bind KSA↔GSA correctly and grant the GSA the API role |
| Service has no endpoints | Selector does not match pod labels | kubectl get endpoints <svc>; compare labels |
Align Service selector with pod labels |
| Ingress returns 404/502 or no IP | BackendConfig/health check failing, or cert not ready | kubectl describe ingress; check backend health in console |
Fix readiness probe/health check; wait for the managed cert to provision |
Node NotReady / pods evicted |
Node resource pressure, disk full, or networking issue | kubectl describe node; Cloud Logging node logs |
Free resources, resize node pool, or let autoscaler replace the node |
The recurring GKE gotcha is Workload Identity: the Kubernetes service account must be annotated with the Google service account, and that Google SA must have roles/iam.workloadIdentityUser granted to the KSA member, and the Google SA must hold the actual API role. Miss any one of the three and the pod gets a 403 that looks like an application bug but is pure IAM.
Going deeper: advanced diagnostics
The five playbooks cover the tickets you will see daily. When the simple tools run out — because the question is “who else can do this?”, or “show me the rate of 403s by principal”, or “the config looks fine but packets still drop” — you reach for a second tier. None of these is exotic; they are the tools that separate a competent responder from someone who can close an ambiguous incident cleanly.
Query your logs like a database — Log Analytics
Logs Explorer’s filter language is perfect for “find this needle,” but when you need to aggregate — count 403s by principal, correlate a deploy with a spike, join across services — you want Log Analytics, which runs BigQuery-standard SQL over any log bucket that has Analytics enabled (turn it on per bucket; it is free for the _Default bucket). The schema is the same LogEntry you already know, in snake_case:
-- Top identities hitting PERMISSION_DENIED in the last day, by count
SELECT
  proto_payload.audit_log.authentication_info.principal_email AS principal,
  proto_payload.audit_log.method_name AS method,
  COUNT(*) AS denials
FROM
  `PROJECT_ID.global._Default._AllLogs`
WHERE
  timestamp > TIMESTAMP_SUB(CURRENT_TIMESTAMP(), INTERVAL 1 DAY)
  AND proto_payload.audit_log.status.code = 7   -- 7 = PERMISSION_DENIED (google.rpc.Code)
GROUP BY principal, method
ORDER BY denials DESC
LIMIT 20;
Because it is real SQL you can JOIN audit logs against application logs on a trace ID, bucket latency with APPROX_QUANTILES, or window over time — analysis the plain filter language simply cannot do. For a full tour of Log Analytics, saved queries and linked BigQuery datasets, see Cloud Monitoring & Logging: the Operations Suite.
Identity at scale — Policy Analyzer and IAM Recommender
The Policy Troubleshooter answers “can this principal do this here?” Two sibling tools answer the harder questions. Policy Analyzer (part of Cloud Asset Inventory) answers “who can do this, anywhere?” — invaluable when a permission should not be reachable but somehow is:
# Which identities can start VMs in this project? (org-scoped search)
gcloud asset analyze-iam-policy \
  --organization=ORG_ID \
  --full-resource-name="//cloudresourcemanager.googleapis.com/projects/PROJECT_ID" \
  --permissions="compute.instances.start"
IAM Recommender (Active Assist) runs the opposite direction: it watches 90 days of actual usage and recommends removing permissions nobody uses, so you can shrink an over-broad grant you discovered during an incident instead of leaving it as tomorrow’s blast radius:
gcloud recommender recommendations list \
  --project=PROJECT_ID --location=global \
  --recommender=google.iam.policy.Recommender \
  --format="table(description, primaryImpact.category, stateInfo.state)"
Make the network prove itself — live tests, Network Analyzer, Firewall Insights
A Connectivity Test does two things: a configuration analysis (simulating the path through firewall rules, routes and peering) and, for many source/destination types, a live data-plane verification that sends real probe packets and reports actual reachability and latency — so you can tell a config problem (rule missing) from a runtime problem (app not listening). Beyond one-off tests, Network Analyzer (in Network Intelligence Center) continuously and automatically flags misconfigurations — a subnet with no route to a NAT, a firewall rule shadowed by a higher-priority one, an IP nearing exhaustion — before anyone files a ticket. And Firewall Insights surfaces rules that are never hit (candidates for deletion) or that are shadowed by another rule:
# Firewall Insights for a project (VPC firewall rules are global)
gcloud recommender insights list \
  --project=PROJECT_ID --location=global \
  --insight-type=google.compute.firewall.Insight \
  --format="table(description, category, stateInfo.state)"
The VM’s black box — serial console, interactive access, the metadata server
When a VM is RUNNING but unreachable, the serial console is the boot recorder that does not need the network:
# Dump the boot + OS log without SSH
gcloud compute instances get-serial-port-output lab-vm \
  --zone=us-central1-a --port=1
Enable interactive serial access (set the metadata key serial-port-enable=TRUE) and gcloud compute connect-to-serial-port lab-vm --zone=us-central1-a lets you log in over the serial port to repair a broken sshd or a bad /etc/fstab. From inside a guest — or a pod — the metadata server at 169.254.169.254 is where identity and config live; a quick curl confirms which service account the instance is actually running as, which is frequently the real answer to a “403 from an app” mystery:
# On the VM: which identity am I, really?
curl -s -H "Metadata-Flavor: Google" \
  "http://metadata.google.internal/computeMetadata/v1/instance/service-accounts/default/email"
GKE below kubectl — events, control-plane logs, node problem detector
kubectl describe reads Events from roughly the last hour and only for one object; to see the cluster’s whole recent event stream (and catch events that already scrolled off a pod) use:
kubectl get events --all-namespaces --sort-by='.lastTimestamp'
When the control plane is suspect — an admission webhook rejecting pods, an autoscaler that will not scale — GKE streams control-plane, scheduler and audit logs to Cloud Logging; filter by resource type and cluster:
gcloud logging read \
  'resource.type="k8s_cluster" AND resource.labels.cluster_name="my-cluster"' \
  --freshness=1h --project=PROJECT_ID --limit=50
gcloud container operations list shows every cluster and node-pool operation (upgrades, resizes) with timestamps — the GKE equivalent of “what changed?” And GKE’s node problem detector posts kernel deadlocks, disk pressure and runtime failures as node conditions and events, so a mysteriously NotReady node often explains itself right there in kubectl describe node.
From finding to guardrail — log-based metrics and alerts
The last step of the method is prevent, and Cloud Logging makes it concrete. Turn any log filter into a log-based metric, then alert on it, so the next occurrence pages you instead of surprising a user:
# Count every IAM policy change as a metric you can alert on
gcloud logging metrics create iam-policy-changes \
  --description="SetIamPolicy calls" \
  --log-filter='protoPayload.methodName="SetIamPolicy"'
Point a Cloud Monitoring alerting policy at that metric (console, or gcloud alpha monitoring policies create) and “someone changed IAM” becomes a notification, not an archaeology project. This is the difference between firefighting and engineering: every incident should leave behind a metric, an alert, or an Org Policy that makes its recurrence visible — or impossible.
Hands-on lab
In this lab you will deliberately break two things, diagnose them with the right tools, and fix them — the muscle memory matters more than the specific bug. Use a sandbox project on the GCP Free Tier / $300 credit; everything here is small and short-lived.
1. Set up.
gcloud config set project YOUR_SANDBOX_PROJECT
gcloud services enable compute.googleapis.com logging.googleapis.com
gcloud compute networks create lab-vpc --subnet-mode=custom
gcloud compute networks subnets create lab-subnet \
  --network=lab-vpc --range=10.10.0.0/24 --region=us-central1
gcloud compute instances create lab-vm \
  --zone=us-central1-a --machine-type=e2-micro \
  --network=lab-vpc --subnet=lab-subnet --no-address
2. Break SSH (no firewall rule) and diagnose with a Connectivity Test. The VM has no firewall allowing port 22, so SSH will hang. Reproduce, then ask the network to explain itself:
gcloud compute ssh lab-vm --zone=us-central1-a --tunnel-through-iap   # will fail/time out
# Diagnose: simulate the path to port 22 from the IAP range
gcloud network-management connectivity-tests create ssh-test \
  --source-instance=lab-vm --destination-instance=lab-vm \
  --destination-port=22 --protocol=TCP
gcloud network-management connectivity-tests describe ssh-test \
  --format="value(reachabilityDetails.result)"
Expected: the test reports the packet is dropped by firewall. That is your diagnosis.
3. Fix and verify. Allow IAP to reach port 22, then re-run the exact reproduction:
gcloud compute firewall-rules create allow-iap-ssh \
  --network=lab-vpc --direction=INGRESS --action=ALLOW \
  --rules=tcp:22 --source-ranges=35.235.240.0/20
gcloud compute ssh lab-vm --zone=us-central1-a --tunnel-through-iap   # now succeeds
4. Practise the audit log. Confirm who created that firewall rule (it was you, but this is the query you will use in anger):
gcloud logging read \
  'resource.type="gce_firewall_rule" AND protoPayload.methodName:"firewalls.insert"' \
  --freshness=1h --format="table(timestamp, protoPayload.authenticationInfo.principalEmail)"
Validation. You ran a Connectivity Test that pinpointed a firewall drop, fixed exactly that, verified SSH works, and located the change in Cloud Audit Logs — the full method, end to end.
Cleanup.
gcloud network-management connectivity-tests delete ssh-test --quiet
gcloud compute instances delete lab-vm --zone=us-central1-a --quiet
gcloud compute firewall-rules delete allow-iap-ssh --quiet
gcloud compute networks subnets delete lab-subnet --region=us-central1 --quiet
gcloud compute networks delete lab-vpc --quiet
Cost note. An e2-micro is within the always-free allowance in eligible US regions; Connectivity Tests and reading audit logs are free. Even outside the free tier, an hour of this lab is a few rupees — but delete the VM so a forgotten instance does not quietly accrue.
Practice challenges
Work these in a sandbox project. Each gives you a symptom; your job is to diagnose with the right tool first, then fix — resist jumping straight to the fix, because the diagnosis is the skill this lesson is teaching. Commit to an approach before you reveal each solution. They escalate from a single-layer beginner fault to a multi-layer, forensic-plus-prevention scenario.
Challenge 1 (beginner) — IAM permission denied. A teammate runs gcloud storage ls gs://reports-bucket and gets PERMISSION_DENIED for storage.objects.list, though they insist they have access. Find which binding is (or is not) responsible, then grant the least-privilege fix.
<details> <summary>Show solution</summary>
gcloud policy-troubleshoot iam \
  //storage.googleapis.com/projects/_/buckets/reports-bucket \
  --principal-email=teammate@example.com \
  --permission=storage.objects.list
If it reports that no binding grants the permission, grant a narrow role at the bucket, not the project:
gcloud storage buckets add-iam-policy-binding gs://reports-bucket \
  --member=user:teammate@example.com --role=roles/storage.objectViewer
Why: the Troubleshooter names the exact missing (or denying) binding, so you grant objectViewer on one bucket instead of guessing with a broad project-wide role.
</details>
Challenge 2 (beginner→intermediate) — SSH times out. A VM with no external IP is RUNNING; gcloud compute ssh vm --tunnel-through-iap hangs. Prove where the packet dies, then fix it.
<details> <summary>Show solution</summary>
gcloud network-management connectivity-tests create ssh-check \
  --source-instance=projects/PROJECT_ID/zones/us-central1-a/instances/vm \
  --destination-instance=projects/PROJECT_ID/zones/us-central1-a/instances/vm \
  --destination-port=22 --protocol=TCP
gcloud network-management connectivity-tests describe ssh-check \
  --format="value(reachabilityDetails.result)"
If the result is DROPPED by firewall, allow the IAP range on 22:
gcloud compute firewall-rules create allow-iap-ssh \
  --network=my-vpc --direction=INGRESS --action=ALLOW \
  --rules=tcp:22 --source-ranges=35.235.240.0/20
Why: IAP TCP forwarding originates from 35.235.240.0/20; without an ingress allow for that range on 22, the tunnel never reaches sshd — and the Connectivity Test tells you that before you touch a single rule.
</details>
Challenge 3 (intermediate) — no internet egress. On that same private VM, sudo apt update times out. It has no external IP. Name the two things that could be missing, confirm which, and fix.
<details> <summary>Show solution</summary>
# Is there a Cloud NAT for this region?
gcloud compute routers nats list --router=my-router --region=us-central1
# Does a default route exist?
gcloud compute routes list --filter="destRange=0.0.0.0/0"
# Simulate egress to the public internet
gcloud network-management connectivity-tests create egress-check \
  --source-instance=projects/PROJECT_ID/zones/us-central1-a/instances/vm \
  --destination-ip-address=8.8.8.8 --destination-port=443 --protocol=TCP
Fix — create a Cloud NAT so private VMs get outbound internet:
gcloud compute routers create my-router --network=my-vpc --region=us-central1
gcloud compute routers nats create my-nat \
  --router=my-router --region=us-central1 \
  --auto-allocate-nat-external-ips --nat-all-subnet-ip-ranges
Why: a VM with no external IP has no internet egress until a Cloud NAT (on a Cloud Router) provides it. If you only needed Google APIs rather than the whole internet, Private Google Access on the subnet would be the lighter fix. </details>
Challenge 4 (intermediate) — GKE ImagePullBackOff. A new Deployment’s pods cycle through ImagePullBackOff and never become Ready. Diagnose from the Events, then handle both likely causes (wrong image reference; or private-registry permission).
<details> <summary>Show solution</summary>
kubectl get pods
kubectl describe pod POD_NAME | sed -n '/Events/,$p'   # jump to the Events block
If the Events show Failed to pull image ... 403 Forbidden, the node / Workload Identity SA lacks registry read:
gcloud projects add-iam-policy-binding PROJECT_ID \
  --member="serviceAccount:GSA@PROJECT_ID.iam.gserviceaccount.com" \
  --role=roles/artifactregistry.reader
If instead they show manifest unknown / not found, the tag is wrong — fix the image: field in the manifest.
Why: the pod Events state the exact reason in plain English. A 403 is an IAM problem (grant artifactregistry.reader); a “not found” is a bad reference (fix the tag). The Events tell you which, so you do not fix the wrong one.
</details>
Challenge 5 (advanced) — Cloud SQL private IP from GKE. A pod gets connection timeouts to a Cloud SQL instance’s private IP; cluster and instance share the VPC. Walk the two-layer diagnosis — network path and identity — then fix.
<details> <summary>Show solution</summary>
# 1. Is the private services access peering present?
gcloud services vpc-peerings list --network=my-vpc
# 2. Does the path reach the instance IP at all?
gcloud network-management connectivity-tests create sql-check \
  --source-instance=projects/PROJECT_ID/zones/us-central1-a/instances/GKE_NODE \
  --destination-ip-address=CLOUD_SQL_PRIVATE_IP --destination-port=5432 --protocol=TCP
If the peering is missing, allocate a range and establish it:
gcloud compute addresses create google-managed-services-my-vpc \
  --global --purpose=VPC_PEERING --prefix-length=16 --network=my-vpc
gcloud services vpc-peerings connect \
  --service=servicenetworking.googleapis.com \
  --ranges=google-managed-services-my-vpc --network=my-vpc
Then bind Workload Identity so the pod’s identity actually holds roles/cloudsql.client:
apiVersion: v1
kind: ServiceAccount
metadata:
  name: app-ksa
  namespace: default
  annotations:
    iam.gke.io/gcp-service-account: app-gsa@PROJECT_ID.iam.gserviceaccount.com
gcloud projects add-iam-policy-binding PROJECT_ID \
  --member="serviceAccount:app-gsa@PROJECT_ID.iam.gserviceaccount.com" \
  --role=roles/cloudsql.client
Why: private-IP Cloud SQL needs both a network path (the servicenetworking peering) and an authorised identity (cloudsql.client via Workload Identity). Either one missing looks identical from the pod — a timeout or an auth error — so you must check both layers, not stop at the first fix.
</details>
Challenge 6 (advanced) — “what changed?”, then prevent. Prod traffic dropped at 02:14 and you suspect a firewall change. Find who changed which rule and when, then leave a guardrail so it cannot happen silently again.
<details> <summary>Show solution</summary>
# Who touched firewall rules in the window?
gcloud logging read \
  'resource.type="gce_firewall_rule" AND protoPayload.methodName:"compute.firewalls"' \
  --freshness=1d \
  --format="table(timestamp, protoPayload.authenticationInfo.principalEmail, protoPayload.methodName, resource.labels.firewall_rule_name)"
Or aggregate the same events in Log Analytics:
SELECT timestamp,
       proto_payload.audit_log.authentication_info.principal_email AS who,
       proto_payload.audit_log.method_name AS what
FROM `PROJECT_ID.global._Default._AllLogs`
WHERE proto_payload.audit_log.method_name LIKE '%compute.firewalls%'
  AND timestamp > TIMESTAMP_SUB(CURRENT_TIMESTAMP(), INTERVAL 1 DAY)
ORDER BY timestamp DESC;
Prevent — turn the filter into a metric that can page you next time:
gcloud logging metrics create firewall-changes \
  --description="Firewall rule mutations" \
  --log-filter='resource.type="gce_firewall_rule" AND protoPayload.methodName:"compute.firewalls"'
…then alert on firewall-changes in Cloud Monitoring, and consider an Org Policy or IaC pipeline so ad-hoc console edits are blocked outright.
Why: Admin Activity audit logs are always on and free, so the actor and timestamp are already recorded — you are reading, not reconstructing. Converting the filter to a log-based metric plus an alert turns a next-time post-mortem into a real-time signal. </details>
Common beginner mistakes
These are not typos or wrong flags — they are mental-model errors, the wrong assumption that sends you debugging the wrong thing entirely. Fix the model and the correct tactics follow on their own.
-
“Permission denied? I’ll just give them Editor.” Over-granting is the reflex that quietly destroys least privilege. The error already names the exact permission that was missing (e.g.
compute.instances.start); the right move is to find the narrowest predefined role that contains it and grant that at the lowest node in the hierarchy that solves the problem — not Editor, and not at the org. The Policy Troubleshooter tells you precisely what to grant, so you never have to guess big. -
“The app has a bug — it’s returning a 403.” A 403 is almost never an application bug; it is an identity telling you it lacks a role. The decisive question is which identity is the code actually running as? On a VM or a pod it is a service account, not the human who deployed it. Find the
principalEmailin the request or audit log and grant the role to that identity. -
“Better add a firewall rule for the return traffic.” GCP VPC firewall rules are stateful: if the forward connection is allowed, the reply is automatically permitted. A one-way failure is therefore almost never a missing return rule — it is a missing forward rule, a bad route, or absent NAT. Time spent on the return path is time spent on a rule you never needed.
-
“The logs don’t say anything.” Usually this means only the application’s stdout was checked. The platform’s reason lives elsewhere: Cloud Audit Logs for “who/what/when”, system event logs for host actions, and
kubectl describeEvents for pods. The platform almost always wrote down why it refused — just in a different log than the one you looked at first. -
“A and B are peered, B and C are peered, so A can reach C.” VPC Network Peering is non-transitive by design. Each pair needs its own peering (or a hub-and-spoke built with Network Connectivity Center). Assuming transitivity sends you hunting for a firewall bug that does not exist.
-
“I’ll open
0.0.0.0/0on 22 (or make the DB public) just to unblock it.” This trades a connectivity bug for a security incident, and it frequently does not even address the real cause. Run a Connectivity Test to find the actual dropped hop, then open the narrowest path — the IAP range for SSH, the Auth Proxy or private IP for databases. -
“Just restart it.” A restart can clear a symptom, but if you never reproduced and isolated the fault you have learned nothing and it will return — usually at a worse hour. Restart after you understand the cause, not instead of understanding it.
Common mistakes & troubleshooting
| Mistake | Why it bites | Do this instead |
|---|---|---|
| Changing several settings at once | You fix it but never learn which change worked | One hypothesis, one change, verify |
| Reading only the app log | The platform reason is in Cloud Logging / kubectl describe, not stdout |
Always check audit + system logs and Events |
| Granting access to the human, not the service account | Code runs as the SA; the human’s roles are irrelevant | Find principalEmail in the log; grant the SA |
| Opening Cloud SQL public IP to fix a connection | Trades a connectivity bug for a security hole | Use the Auth Proxy / private IP instead |
| Assuming firewall return rules are needed | GCP firewalls are stateful; you waste time on the return path | Check the forward rule, route and NAT |
| Ignoring “what changed?” | Most “sudden” breakages are a recent config change | Start with the Admin Activity audit log |
Best practices
- Make logs and metrics the default first stop. Pin saved queries in Logs Explorer for your top failure modes and build a Cloud Monitoring dashboard for each critical service so you are reading, not guessing.
- Codify the fix. When you resolve something, turn it into prevention: an alerting policy, an Org Policy guardrail, a Terraform change, or a runbook entry. An incident you do not encode will recur.
- Reach for the simulators. Connectivity Tests and the Policy Troubleshooter answer in seconds what trial-and-error answers in hours — use them before you start changing config.
- Keep audit logging on. Admin Activity logs are free and always on; enable Data Access logs on sensitive services so “who read this?” is answerable.
- Prefer the secure path even under pressure. IAP for SSH, the Auth Proxy for databases, Workload Identity for pods — these eliminate whole categories of failure and are the hardened choice.
Security notes
Troubleshooting and security pull in the same direction more often than people expect. The insecure shortcut — a public Cloud SQL IP, an 0.0.0.0/0 SSH rule, a downloaded service-account key — is usually also the fragile one that causes the next incident. Two specifics: first, Cloud Audit Logs are evidence, so protect them with a log sink to a restricted bucket and tight IAM, and never grant broad logging.admin; an attacker who can delete logs can hide the very change you are trying to find. Second, when you grant a role to unblock someone, grant the narrowest predefined role at the lowest node and remove it when the task is done — temporary “just give them Editor” grants are how least privilege quietly dies. Use the Policy Troubleshooter to confirm you granted exactly what was needed and nothing more, and IAM Recommender to catch the over-grants that slipped through.
Interview & exam questions
- What is your general method for troubleshooting an unfamiliar Google Cloud problem? Reproduce, isolate the layer, compare config to desired, inspect Cloud Logging/Monitoring, form one hypothesis, change one thing, verify, then prevent. The method is constant even when the failure is new.
- A user has
roles/editoron the project but getsPERMISSION_DENIEDon one bucket. Why? A deny policy (deny wins over allow) or an IAM Condition on the binding is blocking it. The Policy Troubleshooter will name the responsible rule. - How do you find out who deleted a firewall rule yesterday? Query Cloud Audit Logs (Admin Activity) for the
firewalls.deletemethod;protoPayload.authenticationInfo.principalEmailis the actor. Admin Activity logging is always on and free. - A VM is RUNNING but you cannot SSH. Walk through the diagnosis. Run a Connectivity Test to port 22 to find a firewall drop; check ingress rules (port 22 from your source or the IAP range
35.235.240.0/20); if the network is fine, use the serial console to read boot/OS logs and check OS Login vs metadata keys. - A VM with no external IP cannot run
apt update. What is missing? Cloud NAT for that subnet’s region (for general internet egress) and/or a default route. For Google APIs specifically, you would enable Private Google Access. - Two VPCs are peered but still cannot communicate. Two reasons? Firewall rules do not allow the peer CIDR, or you expected peering to be transitive (it is not — A↔B and B↔C does not give A↔C).
- Name three ways an app can connect to Cloud SQL and the typical failure of each. Public IP (fails when your IP is not in authorised networks), private IP (fails without the private services access peering), and the Cloud SQL Auth Proxy (fails when its identity lacks
roles/cloudsql.client). - A GKE pod is in
ImagePullBackOff. How do you diagnose and fix it?kubectl describe podand read the Events: it is a wrong image reference or missing registry permission. Fix the image path or grantroles/artifactregistry.readerto the node/Workload Identity service account. - A pod gets a 403 calling Cloud Storage. Where do you look? Workload Identity: the KSA must be annotated with a GSA, the GSA must grant
roles/iam.workloadIdentityUserto that KSA member, and the GSA must hold the Storage role. Missing any one yields a 403 that looks like an app bug. - What is the difference between Cloud Logging and Cloud Audit Logs? Cloud Logging is the whole platform for ingesting and querying logs; Cloud Audit Logs are a category within it (Admin Activity, Data Access, System Event, Policy Denied) that record administrative and data operations — the “who did what” record.
- Why prefer the serial console over SSH when a VM is broken? It shows the boot and OS log directly and does not depend on the network/sshd path that SSH needs, so it works even when SSH is dead.
- GCP firewall rules are stateful — why does that change how you debug a one-way failure? Because return traffic for an allowed connection is automatically permitted, a one-way failure is almost never a missing return rule; look at the forward allow rule, the route, and NAT instead.
- When would you use Log Analytics instead of Logs Explorer? When you need to aggregate or correlate — count events by principal, join audit and app logs on a trace ID, compute latency percentiles — because Log Analytics runs BigQuery-standard SQL over your logs, which the plain filter language cannot do.
- How do you answer “who can start VMs anywhere in this org?” Policy Analyzer (
gcloud asset analyze-iam-policyin Cloud Asset Inventory) searches effective access across the whole hierarchy, unlike the Policy Troubleshooter, which checks one principal on one resource.
Quick check
- In IAM evaluation, which wins when both apply: an allow policy or a deny policy?
- Which tool simulates a packet’s path through your VPC to find where it is dropped?
- A VM with no external IP needs to reach
*.googleapis.comprivately — which subnet setting enables that? - What is the first
kubectlcommand to understand why a pod will not run? - Which always-on, free audit log category records configuration changes?
Answers: 1. The deny policy — deny always wins. 2. Connectivity Tests (Network Intelligence Center). 3. Private Google Access on the subnet. 4. kubectl describe pod <name> (read the Events). 5. Admin Activity audit logs.
Exercise
Deliberately reproduce and resolve a Cloud SQL connectivity failure to cement the method. Create a small Cloud SQL instance with only a private IP, then try to connect from a VM in a VPC that has no private services access peering. Confirm the failure, then: (1) state which connection path you are using; (2) run a Connectivity Test from the VM to the instance’s private IP and identify the dropped hop; (3) create the servicenetworking VPC peering and allocate a range; (4) re-test and connect; (5) write a three-line runbook entry describing the symptom, the diagnostic, and the fix. Finally, switch the same workload to use the Cloud SQL Auth Proxy and note which categories of failure that change eliminates. Tear everything down when finished.
Certification mapping
This lesson supports the Associate Cloud Engineer (ACE) exam, which expects you to operate and troubleshoot deployed resources — managing IAM, inspecting Cloud Logging/Monitoring, and diagnosing networking and compute issues with gcloud. It also feeds the Professional Cloud DevOps Engineer (PCDE) exam, whose service-operation and incident-response domains assume exactly this kind of structured diagnosis using Cloud Operations (Logging, Monitoring, audit logs). The method and the audit-log fluency here are the foundation for the advanced multi-service RCA covered next.
Glossary
- Cloud Audit Logs — the audit categories within Cloud Logging (Admin Activity, Data Access, System Event, Policy Denied) recording who did what, where and when.
- Policy Troubleshooter — an IAM tool that, given a principal, resource and permission, reports whether access is granted and which binding decides it.
- Policy Analyzer — a Cloud Asset Inventory tool (
gcloud asset analyze-iam-policy) that answers “which principals can access this resource with this permission?” across a whole org, folder or project. - IAM Recommender — an Active Assist tool that analyses ~90 days of usage and recommends removing unused permissions to right-size an over-broad grant.
- Connectivity Tests — a Network Intelligence Center tool that simulates a packet’s path through your VPC config (and, for many endpoints, sends live probes) to find where and why it would be dropped.
- Network Intelligence Center — the console area housing Connectivity Tests, Network Topology, the Performance Dashboard, Firewall Insights and Network Analyzer.
- Network Analyzer — a Network Intelligence Center feature that continuously and automatically detects VPC misconfigurations (missing routes, shadowed firewall rules, IP exhaustion).
- Log Analytics — a Cloud Logging feature that runs BigQuery-standard SQL over log buckets with Analytics enabled, for the aggregation and cross-service correlation the plain filter language cannot do.
- Log-based metric — a Cloud Monitoring metric derived from a log filter, so you can chart and alert on the rate of any log event.
- Private Google Access — a subnet setting letting VMs without external IPs reach Google APIs over internal routing.
- Private services access — the VPC peering to Google-managed service networks (e.g. Cloud SQL) that enables private-IP connectivity to those services.
- Cloud NAT — a managed service that gives VMs without external IPs outbound internet access via a Cloud Router.
- Cloud SQL Auth Proxy — a connector that provides IAM-based authorisation and automatic TLS to Cloud SQL without exposing a public IP.
- Workload Identity — the GKE mechanism that lets a Kubernetes service account act as a Google service account to call Google APIs without keys.
- Identity-Aware Proxy (IAP) — a service that brokers authenticated access (including TCP forwarding for SSH) from the range
35.235.240.0/20, removing the need for public IPs. - Serial console — direct access to a VM’s serial port output (boot and OS logs), usable even when SSH is unavailable.
- Metadata server — the
169.254.169.254endpoint inside every VM and pod that serves instance identity, service-account tokens and configuration. - Deny policy — an IAM policy that denies permissions and is evaluated before (and overrides) allow policies.
Next steps
You now have a method and five playbooks for single-service faults. The next lesson, Advanced Google Cloud Troubleshooting: Complex Multi-Service Incidents & RCA (gcp-troubleshooting-complex-incidents-multi-service-rca), scales this up to incidents that span several services at once — correlating Cloud Monitoring, Logs, Trace and Error Reporting, working through cascading failures and outages, and running blameless postmortems. If any single playbook above felt thin on fundamentals, revisit Google Cloud IAM Fundamentals: Roles, Service Accounts, Policy & Inheritance (gcp-iam-fundamentals-roles-service-accounts-policy) for the identity model that underpins Playbook 1.
</content>
</invoke>