In a nutshell
Think of CloudWatch as the alarm system wired through a building. The metrics are the sensors on every door, window and smoke detector — numbers that stream in continuously (CPU, error count, latency, free disk). An alarm is a trip wire set on one sensor: “if this reading crosses this line for this long, trip.” And SNS is the phone tree the trip wire dials — one tripped wire rings the front desk, the on-call engineer’s phone, and a robot that can lock the door by itself. Wiring all of that by clicking around the AWS console is like taping sensors to walls by hand across fifty floors: slow, inconsistent, and impossible to review. This lesson wires the whole system in Terraform instead — every sensor, trip wire and phone-tree entry is code you can version, diff, and stamp identically into every environment.
Three verbs carry the whole lesson. A metric alarm watches a number and changes state (OK → ALARM) when a breach survives an “M of N” test. That state change fires alarm_actions, which publish to an SNS topic. The topic fans out — to an email inbox, a Slack channel, a pager, or a Lambda that fixes the problem before a human wakes up. Everything else here (log retention, metric filters, dashboards, composite alarms, anomaly detection) hangs off those three verbs.
If you are brand new to observability, hold onto one idea: an alarm turning red is not the same as someone finding out. Red is just a state in a console. The notification only happens if the alarm has an action, the action points at a topic, the topic has a confirmed subscriber, and the topic’s policy lets CloudWatch publish. Most “my alarm didn’t page me” incidents are a broken link in exactly that chain — and the whole point of putting it in Terraform is that the chain is written down and reviewable.
Level: Senior · Time: ~50 min read, plus ~45 min for the build → verify → destroy hands-on loop.
Before you start, be comfortable with core Terraform — HCL syntax, providers, resources, variables, for_each, state and modules (the Foundation and Intermediate tiers) — and have an AWS account with credentials configured. You do not need prior CloudWatch experience; this lesson builds it from zero.
After this lesson you will be able to:
- Write a trustworthy
aws_cloudwatch_metric_alarmand explain howevaluation_periods,datapoints_to_alarmandtreat_missing_datadecide whether it is honest or noisy. - Wire an SNS topic, subscription and topic policy so a firing alarm actually reaches email, Slack or a remediation Lambda — and know why the email step can’t be automated.
- Cap log cost with
retention_in_daysand promote a log pattern to an alarm with a metric filter. - Combine signals with composite alarms, metric math (error rate) and anomaly detection so you page on user impact, not noise.
- Render dashboards as code and stamp a standard alarm set across a whole fleet from one reusable module.
An alarm you clicked together in the console is an alarm nobody else can see, review, or reproduce. It has no history in git, no owner, no diff when someone widens the threshold at 2 a.m. to stop the pages, and no way to be identical on the other forty instances in the fleet. That is the whole reason observability-as-code exists: the alarm thresholds, the SNS topics, the log-retention policy, the dashboard JSON and the auto-remediation wiring are infrastructure, and infrastructure belongs in Terraform next to the thing it watches — versioned, peer-reviewed, and stamped identically into every environment from one module. This lesson builds that plane end to end on AWS.
By the end you will have stood up, from an empty directory, a real aws_cloudwatch_metric_alarm on an EC2 instance’s CPU, an SNS topic with a confirmed email subscription wired to the alarm’s alarm_actions, a log group with a sane retention_in_days and a metric filter that turns an ERROR log line into its own alarm, a composite alarm that only pages when two conditions are both true, and a CloudWatch dashboard rendered from a jsonencode widget body — then you will deliberately trigger the alarm and watch the notification arrive, before tearing it all down with terraform destroy. You will leave knowing the arguments that decide whether an alarm is trustworthy or noisy (evaluation_periods, datapoints_to_alarm, treat_missing_data), the exact metric to alarm on for each service, and the fistful of gotchas — an unconfirmed email subscription, a KMS-encrypted topic CloudWatch can’t publish to, a log group billing you forever — that eat an afternoon the first time.
This is the provider-specific, SRE-flavoured layer of the KloudVin Terraform course. It assumes you already know core Terraform — HCL, providers, resources, variables, state and modules from the Foundation and Intermediate tiers — and applies it to AWS relentlessly, with copy-pasteable .tf files and a terraform init → plan → apply → verify → destroy you actually run.
What you’ll build
The scenario is the one every on-call rotation lives inside: a small web service on AWS — an EC2 instance (or an Auto Scaling group) behind an Application Load Balancer, with an RDS database behind it — and a requirement that the team find out when any of it degrades, through the same channel, with the same thresholds, in dev and in prod, without anyone clicking around a console. That means metrics turned into alarms, application logs shipped to a retained log group, a couple of patterns in those logs promoted to alarms of their own, one dashboard the team actually looks at, and a single notification path — an SNS topic — that fans a firing alarm out to email and Slack, and can hand the nastier ones to a Lambda that fixes the problem before a human wakes up.
Everything in that paragraph is a Terraform resource. The metric alarm is aws_cloudwatch_metric_alarm; the composite is aws_cloudwatch_composite_alarm; the notification topic is aws_sns_topic with aws_sns_topic_subscription; the retained logs are aws_cloudwatch_log_group; the log-pattern-to-alarm bridge is aws_cloudwatch_log_metric_filter; the dashboard is aws_cloudwatch_dashboard; the event-driven ops rule is aws_cloudwatch_event_rule. Wiring them by hand in the console is slow and invisible; wiring them in Terraform gives you the dependency graph (the alarm references the topic ARN, the metric filter references the log-group name, and Terraform orders all of it), a plan that shows the exact diff before anything changes, and a module you apply to fifty instances by changing one for_each.
Why Terraform rather than the console, the AWS CLI, or CloudFormation? Because monitoring is precisely the kind of sprawling, repetitive, cross-referencing configuration that rewards code and punishes clicking. A fleet needs the same CPU alarm on every host; a console gives you fifty subtly different ones. An audit needs to know who changed a threshold and when; git has the answer, the console does not. CloudFormation can express all of this too, but you lose Terraform’s plan preview, its for_each ergonomics over a list of services, and the single state model that already holds the EC2, ALB and RDS resources these alarms point at.
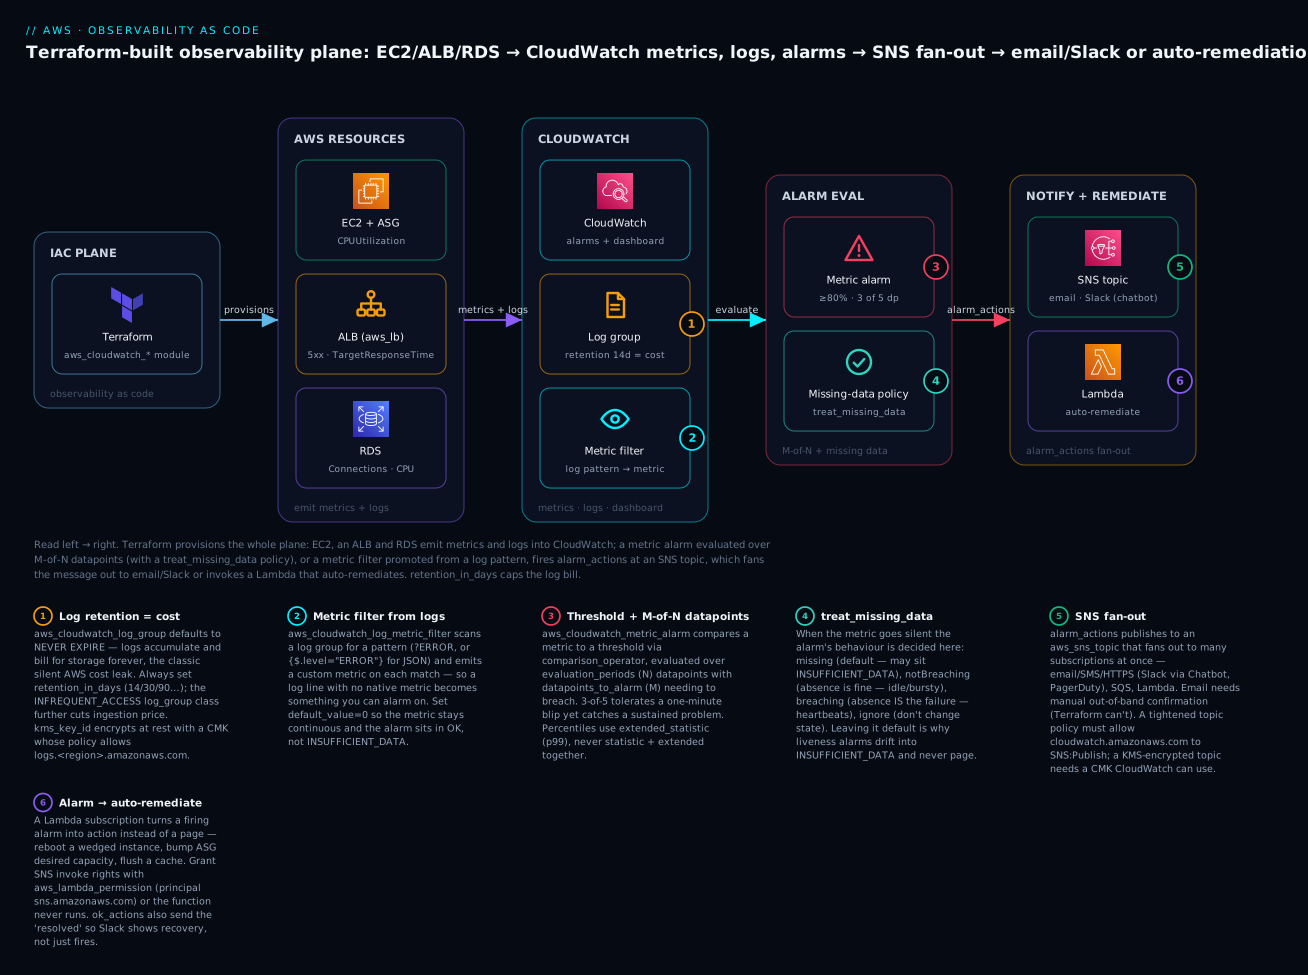
Reading that diagram left to right is reading the signal path you are about to build: your resources emit metrics and logs into CloudWatch; a metric alarm (or a metric filter promoted from a log line) evaluates the numbers and, when the breach survives the M-of-N test, fires its alarm_actions at an SNS topic; the topic fans the message out to humans (email, Slack) or to a Lambda that auto-remediates. Two things sit off to the side but matter as much as the happy path: treat_missing_data, which decides what an alarm does when the metric goes silent, and retention_in_days, which is the difference between a predictable log bill and a runaway one.
Here is the full inventory a single terraform apply creates in the hands-on, and roughly what each part costs if you leave it running (ap-south-1 / Mumbai, on-demand, indicative July 2026):
| Resource (Terraform) | AWS object | Role in the build | Rough cost if left up |
|---|---|---|---|
aws_instance (t3.micro) |
EC2 instance | The thing being watched (CPU alarm target) | ~₹625/mo (~$7.5) |
aws_cloudwatch_log_group |
Log group /app/demo |
App logs, retention 14 days | ~₹0 at demo volume |
aws_cloudwatch_log_metric_filter |
Metric filter | ERROR count → custom metric |
Free (metric billed) |
aws_cloudwatch_metric_alarm ×2 |
CPU alarm + error alarm | Fire on breach | $0.10/alarm/mo |
aws_cloudwatch_composite_alarm |
Composite | Page only when both fire | $0.50/mo |
aws_sns_topic + _subscription |
SNS topic + email sub | Notification fan-out | Free at demo volume |
aws_sns_topic_policy |
Topic access policy | Let CloudWatch publish | Free |
aws_cloudwatch_dashboard |
Dashboard | One-pane overview | Free (first 3) |
aws_iam_role + aws_lambda_function (opt.) |
Remediation Lambda | Auto-fix path | ~₹0 (idle) |
The EC2 instance is the only line item with a real hourly charge; everything CloudWatch and SNS here is effectively free at demo volume. It is still a build it, verify it, destroy it lesson — an instance left running for a month is a bill you did not mean to pay — and every costly or destructive step below is marked ⚠️.
Where this fits: the CPU alarm here targets a single instance so the lesson stays about observability, but in production you alarm on an Auto Scaling group (AutoScalingGroupName dimension) and let a scaling policy react — that compute layer is the subject of the AWS Auto Scaling & launch templates lesson. The ALB and RDS this plane watches are stood up properly in the 3-tier architecture, modules & SRE remote-state lesson, which is also where the S3 + DynamoDB backend these alarms live beside comes from. And when you outgrow raw CloudWatch alarms into SLOs, error budgets and synthetic browser checks, the Datadog monitors, SLOs & synthetics lesson picks up exactly there.
Why observability as code (and not click-ops)
Before the resources, the argument — because it governs every choice below. Monitoring drifts faster than almost any other infrastructure: someone bumps a threshold to stop a page, someone adds an alarm for one incident and never removes it, someone forgets the new service entirely. Code fixes each of those failure modes structurally, not by discipline.
| Concern | Click-ops (console) | Observability as code (Terraform) |
|---|---|---|
| Consistency across a fleet | Fifty hand-made alarms, all slightly different | One module, one threshold, for_each over the fleet |
| Change history | None — the console has no diff | Every threshold change is a reviewed git commit |
| Reproducibility (dev = prod) | Re-click it and hope | terraform apply with a different .tfvars |
| Coverage of new services | Manual, forgotten under load | New service in the list → alarms appear automatically |
| Rollback | Screenshot and pray | git revert + apply |
| Ownership / review | Whoever clicked last | CODEOWNERS on the .tf, PR review |
| Deletion of stale alarms | Nobody dares | plan shows the destroy explicitly |
| Cost control (retention, dashboards) | Invisible until the bill | retention_in_days and dashboard count are in code |
The SRE reframing is the important one: an alarm is a contract about what “healthy” means for a service, and a contract belongs in version control where it can be reviewed, tested and evolved — not in a UI where it can be silently edited. Everything that follows treats CloudWatch and SNS as declarative infrastructure, exactly like a VPC or an IAM role.
Metrics and alarms: aws_cloudwatch_metric_alarm
A CloudWatch alarm watches a single metric (or a metric-math expression) and moves between three states — OK, ALARM, and INSUFFICIENT_DATA — based on how the metric compares to a threshold over a window of time. The whole art is in the window: a good alarm fires on a real, sustained problem and stays quiet through a one-second blip. Here is the canonical resource — a CPU alarm on an EC2 instance:
resource "aws_cloudwatch_metric_alarm" "ec2_cpu_high" {
  alarm_name          = "${var.project}-ec2-cpu-high"
  alarm_description   = "EC2 CPUUtilization >= 80% for 3 of the last 5 minutes"
  namespace           = "AWS/EC2"
  metric_name         = "CPUUtilization"
  statistic           = "Average"
  period              = 60          # seconds per datapoint
  evaluation_periods  = 5           # look back over 5 datapoints
  datapoints_to_alarm = 3           # fire if 3 of those 5 breach (M-of-N)
  comparison_operator = "GreaterThanOrEqualToThreshold"
  threshold           = 80
  treat_missing_data  = "missing"
  dimensions          = { InstanceId = aws_instance.app.id }

  alarm_actions             = [aws_sns_topic.alerts.arn]
  ok_actions                = [aws_sns_topic.alerts.arn]
  insufficient_data_actions = []
  tags                      = local.tags
}
Read it as a sentence: average CPU, sampled every 60 seconds, alarms if it is at or above 80% in at least 3 of the last 5 samples, and when it does it publishes to the SNS topic. Every one of those words maps to an argument, and getting them right is the difference between a trustworthy alarm and pager fatigue.
| Argument | What it controls | Notes / gotcha |
|---|---|---|
alarm_name |
Unique name in the account/region | Must be unique; used by composite alarm_rule |
namespace |
Metric namespace | AWS/EC2, AWS/ApplicationELB, AWS/RDS, custom Custom/* |
metric_name |
The metric | e.g. CPUUtilization, HTTPCode_Target_5XX_Count |
statistic |
Aggregation | Average, Sum, Minimum, Maximum, SampleCount |
extended_statistic |
Percentile | e.g. p99; mutually exclusive with statistic |
period |
Seconds per datapoint | 10/30 = high-resolution (costs more); else multiple of 60 |
evaluation_periods |
How many datapoints in the window | The N in “M of N” |
datapoints_to_alarm |
How many must breach | The M; omit ⇒ M = N (all must breach) |
comparison_operator |
Direction of the test | see table below |
threshold |
The number compared against | omit when using threshold_metric_id (anomaly) |
treat_missing_data |
Behaviour when metric is silent | missing/notBreaching/breaching/ignore |
dimensions |
Which resource | wrong dimension ⇒ alarm watches nothing |
alarm_actions |
ARNs to notify on ALARM | SNS topic / Auto Scaling / OpsItem / EC2 action |
ok_actions |
ARNs to notify on recovery | send the “resolved” too, or Slack shows only fires |
insufficient_data_actions |
ARNs on INSUFFICIENT_DATA | usually empty to avoid noise |
unit |
Constrain the metric unit | leave unset unless a metric is multi-unit |
actions_enabled |
Master switch for actions | false = evaluate but stay silent (staging) |
metric_query |
Metric-math / anomaly blocks | replaces the flat metric args |
threshold_metric_id |
ID of the anomaly band | pairs with GreaterThanUpperThreshold |
The comparison operator picks the direction and, for anomaly detection, the band form:
comparison_operator |
Fires when metric is… | Typical use |
|---|---|---|
GreaterThanOrEqualToThreshold |
>= threshold |
CPU, latency, error count |
GreaterThanThreshold |
> threshold |
strictly-above rates |
LessThanThreshold |
< threshold |
healthy-host count too low |
LessThanOrEqualToThreshold |
<= threshold |
throughput floor |
LessThanLowerOrGreaterThanUpperThreshold |
outside anomaly band (either side) | anomaly detection |
GreaterThanUpperThreshold |
above anomaly band | one-sided anomaly (spikes) |
LessThanLowerThreshold |
below anomaly band | one-sided anomaly (drops) |
statistic vs extended_statistic trips people up: the flat statistics are cheap aggregates; percentiles need the extended argument, and you cannot set both:
| Aggregation | Argument | Meaning | Good for |
|---|---|---|---|
Average |
statistic |
mean over the period | CPU, memory |
Sum |
statistic |
total over the period | counts (5xx, requests) |
Maximum / Minimum |
statistic |
extremes | queue depth peaks |
SampleCount |
statistic |
number of samples | traffic presence |
p90 / p95 / p99 |
extended_statistic |
percentile latency | latency SLOs |
evaluation_periods + datapoints_to_alarm is the single most important tuning knob — the “M of N” rule that decides how twitchy the alarm is. period × evaluation_periods is the window; datapoints_to_alarm is how much of that window must breach:
| period | evaluation_periods | datapoints_to_alarm | Behaviour |
|---|---|---|---|
| 60s | 1 | 1 | Fires on a single bad minute — noisy |
| 60s | 5 | 5 | Fires only if all 5 minutes breach — slow, misses flapping |
| 60s | 5 | 3 | 3 of 5 — sustained breach, tolerates one blip (recommended) |
| 60s | 3 | 2 | Fast page for a paging alarm |
| 300s | 3 | 3 | 15-minute sustained — good for cost/slow metrics |
treat_missing_data is the argument that produces the most “why is my alarm stuck on INSUFFICIENT_DATA?” tickets. A metric can simply stop arriving — the instance was replaced, the ALB got no traffic, the Lambda wasn’t invoked — and this setting decides what the alarm does with the gap:
| Value | Missing datapoints treated as… | Use when |
|---|---|---|
missing (default) |
keep current state; go INSUFFICIENT_DATA if the whole window is empty | you genuinely don’t know |
notBreaching |
good (as if below threshold) | absence is fine (bursty/idle workloads) |
breaching |
bad (as if above threshold) | absence is the failure (heartbeat/liveness) |
ignore |
don’t change state at all | avoid flapping on sparse metrics |
The rule of thumb: for a liveness signal (“this thing should always be emitting”), breaching — silence is an outage. For a bursty metric that legitimately goes quiet (an ALB with no night traffic), notBreaching — silence is fine. Leaving it default missing is why so many alarms sit forever in INSUFFICIENT_DATA and never page.
The alarm catalog: which metric per service
The other half of “a good alarm” is choosing the right metric and dimension per service. Get the dimension wrong and the alarm watches nothing (it stays INSUFFICIENT_DATA forever). This is the table to keep next to you when you write alarms — the metric, its namespace, the statistic, a sane starting threshold, and the dimension that scopes it:
| Service | Namespace | Metric | Stat | Starter threshold | Key dimension |
|---|---|---|---|---|---|
| EC2 instance | AWS/EC2 |
CPUUtilization |
Average | ≥ 80% (3/5) | InstanceId |
| EC2 instance | AWS/EC2 |
StatusCheckFailed |
Maximum | ≥ 1 | InstanceId |
| Auto Scaling group | AWS/EC2 |
CPUUtilization (aggregated) |
Average | ≥ 70% | AutoScalingGroupName |
| ASG | AWS/AutoScaling |
GroupInServiceInstances |
Average | < desired | AutoScalingGroupName |
| ALB | AWS/ApplicationELB |
HTTPCode_Target_5XX_Count |
Sum | ≥ 5 / min | LoadBalancer |
| ALB | AWS/ApplicationELB |
TargetResponseTime |
p99 | ≥ 1.0 s | LoadBalancer (+ TargetGroup) |
| ALB | AWS/ApplicationELB |
UnHealthyHostCount |
Maximum | ≥ 1 | TargetGroup, LoadBalancer |
| ALB | AWS/ApplicationELB |
RejectedConnectionCount |
Sum | ≥ 1 | LoadBalancer |
| RDS | AWS/RDS |
CPUUtilization |
Average | ≥ 80% | DBInstanceIdentifier |
| RDS | AWS/RDS |
DatabaseConnections |
Average | ≥ 80% of max | DBInstanceIdentifier |
| RDS | AWS/RDS |
FreeStorageSpace |
Average | < 10 GB | DBInstanceIdentifier |
| RDS | AWS/RDS |
FreeableMemory |
Average | < 256 MB | DBInstanceIdentifier |
| RDS | AWS/RDS |
ReadLatency / WriteLatency |
Average | ≥ 20 ms | DBInstanceIdentifier |
| Lambda | AWS/Lambda |
Errors |
Sum | ≥ 1 | FunctionName |
| Lambda | AWS/Lambda |
Throttles |
Sum | ≥ 1 | FunctionName |
| Lambda | AWS/Lambda |
Duration |
p95 | near timeout | FunctionName |
| SQS | AWS/SQS |
ApproximateAgeOfOldestMessage |
Maximum | ≥ 300 s | QueueName |
| SQS | AWS/SQS |
ApproximateNumberOfMessagesVisible |
Average | backlog SLO | QueueName |
Two dimension gotchas worth their own line. First, ALB and Target Group dimensions want the arn_suffix, not the ARN — in Terraform that is aws_lb.this.arn_suffix and aws_lb_target_group.this.arn_suffix. Pass the full ARN and the alarm silently watches nothing. Second, ASG-aggregated CPU lives in AWS/EC2 keyed by AutoScalingGroupName (a roll-up across the group), while the group’s own metrics (GroupInServiceInstances, GroupDesiredCapacity) live in AWS/AutoScaling — and the latter must be explicitly enabled on the ASG (enabled_metrics) before they exist to alarm on.
Composite alarms, metric math and anomaly detection
Three techniques turn a pile of single-metric alarms into something an SRE actually trusts.
Composite alarms (aws_cloudwatch_composite_alarm) combine other alarms with boolean logic so you page on user impact, not on any single twitchy signal. The classic use: only page when CPU is high and 5xx is elevated — high CPU alone might just be a batch job; high CPU plus errors is a real incident. The composite has no metric of its own; it references other alarms by name in an alarm_rule:
resource "aws_cloudwatch_composite_alarm" "service_degraded" {
  alarm_name        = "${var.project}-service-degraded"
  alarm_description = "Page only when CPU high AND 5xx elevated (real user impact)"

  alarm_rule = join(" AND ", [
    "ALARM(${aws_cloudwatch_metric_alarm.ec2_cpu_high.alarm_name})",
    "ALARM(${aws_cloudwatch_metric_alarm.alb_5xx_rate.alarm_name})",
  ])

  alarm_actions   = [aws_sns_topic.pager.arn]   # this one pages
  ok_actions      = [aws_sns_topic.pager.arn]
  actions_enabled = true

  depends_on = [
    aws_cloudwatch_metric_alarm.ec2_cpu_high,
    aws_cloudwatch_metric_alarm.alb_5xx_rate,
  ]
}
The child alarms keep their (quieter) email actions; only the composite talks to the pager. That is how you cut alarm noise without going blind. The alarm_rule grammar is small:
| Token | Meaning |
|---|---|
ALARM("name") |
true when that alarm is in ALARM |
OK("name") |
true when in OK |
INSUFFICIENT_DATA("name") |
true when in INSUFFICIENT_DATA |
AND / OR / NOT |
boolean combinators |
TRUE / FALSE |
constants (useful to temporarily pin) |
( ) |
grouping |
Metric math lets an alarm compute a value that no single metric gives you — the most common being an error rate (5xx ÷ requests × 100) instead of a raw count, so a traffic spike doesn’t false-alarm. You express it with metric_query blocks: the raw metrics carry return_data = false (they feed the expression), and the expression carries return_data = true (it is what the alarm watches):
resource "aws_cloudwatch_metric_alarm" "alb_5xx_rate" {
  alarm_name          = "${var.project}-alb-5xx-rate"
  alarm_description   = "Target 5xx error rate > 5% for 2 of 3 minutes"
  comparison_operator = "GreaterThanThreshold"
  evaluation_periods  = 3
  datapoints_to_alarm = 2
  threshold           = 5            # percent
  treat_missing_data  = "notBreaching"
  alarm_actions       = [aws_sns_topic.alerts.arn]

  metric_query {
    id          = "e1"
    expression  = "(m_5xx / m_req) * 100"
    label       = "5xx error rate %"
    return_data = true
  }
  metric_query {
    id          = "m_5xx"
    return_data = false
    metric {
      metric_name = "HTTPCode_Target_5XX_Count"
      namespace   = "AWS/ApplicationELB"
      period      = 60
      stat        = "Sum"
      dimensions  = { LoadBalancer = aws_lb.this.arn_suffix }
    }
  }
  metric_query {
    id          = "m_req"
    return_data = false
    metric {
      metric_name = "RequestCount"
      namespace   = "AWS/ApplicationELB"
      period      = 60
      stat        = "Sum"
      dimensions  = { LoadBalancer = aws_lb.this.arn_suffix }
    }
  }
}
| Metric-math function | Does | Example |
|---|---|---|
arithmetic + - * / |
element-wise math | (m1/m2)*100 |
RATE(m1) |
per-second rate of change | throughput |
SUM([m1,m2]) |
sum across metrics | total across services |
AVG / MIN / MAX |
aggregate an array | fleet average |
FILL(m1, value) |
fill gaps | smooth sparse data |
ANOMALY_DETECTION_BAND(m1, n) |
expected band ± n stddev | anomaly alarms |
IF(cond, a, b) |
conditional | mask maintenance windows |
Anomaly detection replaces a hand-picked threshold with a model of the metric’s normal band. You point the alarm at an ANOMALY_DETECTION_BAND expression and set threshold_metric_id (not threshold) plus a band-aware comparison operator:
resource "aws_cloudwatch_metric_alarm" "cpu_anomaly" {
  alarm_name          = "${var.project}-ec2-cpu-anomaly"
  alarm_description   = "EC2 CPU outside its expected band (2 stddev)"
  comparison_operator = "GreaterThanUpperThreshold"   # spikes only
  evaluation_periods  = 3
  datapoints_to_alarm = 2
  threshold_metric_id = "e1"
  treat_missing_data  = "missing"
  alarm_actions       = [aws_sns_topic.alerts.arn]

  metric_query {
    id          = "e1"
    expression  = "ANOMALY_DETECTION_BAND(m1, 2)"
    label       = "CPU (expected band)"
    return_data = true
  }
  metric_query {
    id          = "m1"
    return_data = true
    metric {
      metric_name = "CPUUtilization"
      namespace   = "AWS/EC2"
      period      = 300
      stat        = "Average"
      dimensions  = { InstanceId = aws_instance.app.id }
    }
  }
}
| Static threshold | Anomaly detection | |
|---|---|---|
| You choose | the number | the band width (stddev) |
| Handles daily/weekly seasonality | no | yes (learned) |
| Good for | hard SLOs (latency ≤ 1 s) | metrics with no fixed “bad” value |
| Warm-up | none | needs history to learn the band |
| Cost | alarm only | alarm + anomaly-detector metrics |
| Risk | wrong static number | over/under-sensitive band |
Use static thresholds for anything with a real SLO (a latency budget, an error-rate ceiling) and anomaly detection for shape-shifting metrics — request volume, queue depth — where “normal” is a moving target and no fixed number is ever right.
SNS alerting: topics, subscriptions and alarm_actions
An alarm on its own only changes colour in a console. The alarm_actions list is what turns a state change into a notification, and the near-universal target is an SNS topic — a pub/sub fan-out that lets one firing alarm reach many places at once. You create the topic, subscribe endpoints to it, and put its ARN in the alarm’s alarm_actions:
resource "aws_sns_topic" "alerts" {
  name = "${var.project}-alerts"
  tags = local.tags
}

resource "aws_sns_topic_subscription" "email" {
  topic_arn = aws_sns_topic.alerts.arn
  protocol  = "email"
  endpoint  = var.alarm_email        # confirmed OUT OF BAND — see below
}
aws_sns_topic argument |
Purpose | Note |
|---|---|---|
name |
Topic name | name_prefix for generated names |
fifo_topic |
Ordered, deduped topic | name must end .fifo; not for alarms |
kms_master_key_id |
Encrypt at rest | ⚠️ CloudWatch can’t publish to an AWS-managed key — see gotchas |
delivery_policy |
Retry/backoff for HTTP(S) | JSON policy |
signature_version |
Message signing (1 or 2) | 2 for stronger verification |
tracing_config |
X-Ray active tracing | for traced pipelines |
Subscriptions are where the fan-out happens — the same topic can notify a human inbox, a phone, a webhook, an SQS queue for buffering, or a Lambda for action. The protocol decides both the endpoint format and, crucially, whether Terraform can finish the job:
| Protocol | Endpoint | Confirmation | Typical use |
|---|---|---|---|
email |
address | manual (click link in email) | humans; stays PendingConfirmation until clicked |
email-json |
address | manual | humans wanting raw JSON |
sms |
phone number | none | on-call SMS (per-message cost) |
https / http |
webhook URL | auto (endpoint must echo token) | Slack via incoming webhook, PagerDuty |
lambda |
function ARN | auto | auto-remediation / custom routing |
sqs |
queue ARN | auto | buffer, replay, decouple |
application |
platform-endpoint ARN | auto | mobile push |
firehose |
delivery-stream ARN (+ role) | auto | archive to S3 |
The single biggest SNS surprise for Terraform users: an email subscription cannot be confirmed by Terraform. apply creates the subscription in PendingConfirmation state and AWS sends a confirmation email; until a human clicks the link, no alarm notification is delivered. This is by design (anti-spam) and there is no argument to bypass it — you confirm out of band, once. For https/http/lambda/sqs, confirmation is automatic and the wiring is complete on apply.
Slack and PagerDuty ride on top of these protocols. The clean, code-only path to Slack is AWS Chatbot (aws_chatbot_slack_channel_configuration) subscribed to the topic — no webhook secret in state; alarms render as rich cards in a channel. The alternative is an https subscription pointed at a Slack Incoming Webhook, or at PagerDuty’s SNS integration URL, both of which auto-confirm. For anything that needs to reshape the message (SNS’s JSON is ugly in Slack), subscribe a small Lambda and let it format and forward.
Topic policy is the gotcha that produces “the alarm fires but nothing arrives.” An SNS topic’s default access policy allows the owning account’s principals, but a CloudWatch alarm publishes as the cloudwatch.amazonaws.com service principal — and if you have tightened the topic policy at all, you must explicitly allow it (with a SourceArn condition so only your alarms can publish):
data "aws_caller_identity" "me" {}

data "aws_iam_policy_document" "alerts_policy" {
  statement {
    sid       = "AllowCloudWatchAlarmsToPublish"
    effect    = "Allow"
    actions   = ["SNS:Publish"]
    resources = [aws_sns_topic.alerts.arn]
    principals {
      type        = "Service"
      identifiers = ["cloudwatch.amazonaws.com"]
    }
    condition {
      test     = "ArnLike"
      variable = "aws:SourceArn"
      values   = ["arn:aws:cloudwatch:${var.region}:${data.aws_caller_identity.me.account_id}:alarm:*"]
    }
  }
  # EventBridge → SNS needs events.amazonaws.com the same way
  statement {
    sid       = "AllowEventBridgeToPublish"
    effect    = "Allow"
    actions   = ["SNS:Publish"]
    resources = [aws_sns_topic.alerts.arn]
    principals {
      type        = "Service"
      identifiers = ["events.amazonaws.com"]
    }
  }
}

resource "aws_sns_topic_policy" "alerts" {
  arn    = aws_sns_topic.alerts.arn
  policy = data.aws_iam_policy_document.alerts_policy.json
}
Auto-remediation is the payoff of a Lambda subscription: instead of paging a human, the alarm’s SNS message triggers code that fixes the problem — reboot a wedged instance, bump ASG desired capacity, clear a queue, flush a cache. You subscribe the function and grant SNS permission to invoke it:
resource "aws_sns_topic_subscription" "remediate" {
  topic_arn = aws_sns_topic.alerts.arn
  protocol  = "lambda"
  endpoint  = aws_lambda_function.remediate.arn
}

resource "aws_lambda_permission" "allow_sns" {
  statement_id  = "AllowExecutionFromSNS"
  action        = "lambda:InvokeFunction"
  function_name = aws_lambda_function.remediate.function_name
  principal     = "sns.amazonaws.com"
  source_arn    = aws_sns_topic.alerts.arn
}
Forget the aws_lambda_permission and the subscription exists but SNS is denied at invoke time — the function never runs and, worse, the failure is silent unless you also alarm on SNS NumberOfNotificationsFailed.
Logs: log groups, retention, metric filters and shipping
Metrics tell you that something is wrong; logs tell you what. CloudWatch Logs organises log streams into log groups, and the single most important argument on a log group is the one Terraform makes you set on purpose: retention_in_days.
resource "aws_cloudwatch_log_group" "app" {
  name              = "/app/${var.project}"
  retention_in_days = 14           # ⚠️ omit this and logs are kept FOREVER
  kms_key_id        = var.logs_kms_key_arn   # optional CMK encryption
  tags              = local.tags
}
aws_cloudwatch_log_group argument |
Purpose | Note |
|---|---|---|
name / name_prefix |
Group name | app logs /app/*, Lambda /aws/lambda/<fn> |
retention_in_days |
How long to keep logs | default = never expire = unbounded bill |
kms_key_id |
Encrypt with a CMK | key policy must allow logs.<region>.amazonaws.com |
log_group_class |
STANDARD or INFREQUENT_ACCESS |
IA ≈ half the ingestion price, fewer features |
skip_destroy |
Keep logs on terraform destroy |
for audit logs you must not lose |
The default behaviour — retain logs forever — is the most common silent AWS cost leak there is: a chatty app ships gigabytes a day into a log group nobody set retention on, and years later it is a five-figure storage line. Always set retention_in_days to a real value. The allowed values are a fixed set; here is the cost intuition and the common choices:
retention_in_days |
Keeps | Fits |
|---|---|---|
1, 3, 5 |
days | high-volume debug logs |
7, 14 |
1–2 weeks | app logs, dev/staging |
30, 60, 90 |
1–3 months | prod app logs |
180, 365 |
6–12 months | security-relevant logs |
400, 545, 731 |
~1–2 years | compliance |
1827, 3653 |
5 / 10 years | long-retention audit |
0 / unset |
forever | almost never what you want |
CloudWatch Logs bills on ingestion (roughly $0.50/GB, or ~half that for the Infrequent Access class), storage (~$0.03/GB-month), and analysis (Logs Insights queries scan-billed). Retention caps the storage term; the log-group class caps the ingestion term. Both are one-line decisions in Terraform and invisible in the console until the bill.
Metric filters are the bridge back to alarming: they scan a log group for a pattern and emit a custom metric every time it matches — so you can alarm on “count of ERROR lines” exactly like a native metric. This is how you page on a log signal (a stack trace, an OOM, a specific error string) that has no metric of its own:
resource "aws_cloudwatch_log_metric_filter" "app_errors" {
  name           = "${var.project}-app-errors"
  log_group_name = aws_cloudwatch_log_group.app.name
  pattern        = "?ERROR ?Exception ?\"Traceback\""   # OR of terms

  metric_transformation {
    name          = "AppErrorCount"
    namespace     = "Custom/${var.project}"
    value         = "1"
    default_value = "0"       # emit 0 when no match → alarm can leave INSUFFICIENT_DATA
    unit          = "Count"
  }
}

resource "aws_cloudwatch_metric_alarm" "app_error_rate" {
  alarm_name          = "${var.project}-app-errors"
  alarm_description   = ">= 5 ERROR log lines per minute"
  namespace           = "Custom/${var.project}"
  metric_name         = "AppErrorCount"
  statistic           = "Sum"
  period              = 60
  evaluation_periods  = 1
  threshold           = 5
  comparison_operator = "GreaterThanOrEqualToThreshold"
  treat_missing_data  = "notBreaching"
  alarm_actions       = [aws_sns_topic.alerts.arn]
}
Two subtleties make or break this. Setting default_value = "0" means the filter emits a zero when nothing matches, so the metric is continuous and the alarm can sit in OK instead of INSUFFICIENT_DATA — without it, a quiet period looks like missing data. And the pattern grammar has two dialects:
| Pattern style | Example | Matches |
|---|---|---|
| Plain term | ERROR |
lines containing ERROR |
| OR of terms | ?ERROR ?WARN |
lines containing either |
| Exact/quoted | "Out of memory" |
the exact phrase |
| Exclude | -INFO |
lines not containing INFO |
| Space-delimited fields | [ip, id, user, ..., status=5*] |
5xx in a positional log |
| JSON selector | { $.level = "ERROR" } |
structured JSON logs |
| JSON numeric | { $.latency > 1000 } |
numeric field threshold |
For structured JSON logs the { $.field = "x" } form is far more robust than string matching — it survives log-format changes and lets you threshold numeric fields directly.
Subscription filters (aws_cloudwatch_log_subscription_filter) are the other direction — they stream matching log events out of CloudWatch in near-real-time to another service for processing or centralisation:
| Destination | Resource wiring | Use |
|---|---|---|
| Lambda | destination_arn + aws_lambda_permission |
transform, forward, alert |
| Kinesis Data Streams | destination_arn + role_arn |
high-throughput fan-in |
| Kinesis Data Firehose | destination_arn + role_arn |
archive to S3 / OpenSearch |
| Cross-account log destination | destination_arn (Logs Destination) |
central logging account |
Getting logs into the group is the last mile. Lambda writes to /aws/lambda/<fn> automatically. For EC2 and on-host app logs you run the CloudWatch agent, whose config (usually stored in SSM Parameter Store and pulled at boot) both ships log files and collects the metrics EC2 does not emit by default — memory and disk:
resource "aws_ssm_parameter" "cw_agent" {
  name = "/${var.project}/cloudwatch-agent/config"
  type = "String"
  value = jsonencode({
    agent   = { metrics_collection_interval = 60 }
    metrics = { namespace = "CWAgent", metrics_collected = {
      mem  = { measurement = ["mem_used_percent"] }
      disk = { measurement = ["used_percent"], resources = ["*"] }
    } }
    logs = { logs_collected = { files = { collect_list = [{
      file_path         = "/var/log/app/app.log"
      log_group_name    = aws_cloudwatch_log_group.app.name
      log_stream_name   = "{instance_id}"
      retention_in_days = 14
    }] } } }
  })
}
| Signal | Emitted by default? | How to get it |
|---|---|---|
| EC2 CPU, network, disk I/O | yes (hypervisor) | native AWS/EC2 |
| EC2 memory used % | no | CloudWatch agent → CWAgent |
| EC2 disk used % (filesystem) | no | CloudWatch agent → CWAgent |
| App log files | no | CloudWatch agent logs.collect_list |
| Lambda logs | yes | automatic /aws/lambda/* |
The memory/disk gap catches everyone: teams alarm on CPU, an instance runs out of memory, and there was never a metric because the agent was never installed.
Dashboards as code
A dashboard is the one artifact the team looks at without being paged, and aws_cloudwatch_dashboard renders it from a JSON body — which jsonencode lets you write as native HCL instead of a brittle string. Each widget is an object with a type, a position on a 24-column grid, and properties:
resource "aws_cloudwatch_dashboard" "overview" {
  dashboard_name = "${var.project}-overview"
  dashboard_body = jsonencode({
    widgets = [
      {
        type = "metric", x = 0, y = 0, width = 12, height = 6,
        properties = {
          title   = "EC2 CPU"
          region  = var.region
          view    = "timeSeries"
          metrics = [["AWS/EC2", "CPUUtilization", "InstanceId", aws_instance.app.id]]
          yAxis   = { left = { min = 0, max = 100 } }
          annotations = { horizontal = [{ label = "alarm", value = 80 }] }
        }
      },
      {
        type = "log", x = 12, y = 0, width = 12, height = 6,
        properties = {
          title  = "Recent errors"
          region = var.region
          query  = "SOURCE '${aws_cloudwatch_log_group.app.name}' | fields @timestamp, @message | filter @message like /ERROR/ | sort @timestamp desc | limit 20"
        }
      },
      {
        type = "alarm", x = 0, y = 6, width = 24, height = 3,
        properties = {
          title  = "Alarm status"
          alarms = [aws_cloudwatch_metric_alarm.ec2_cpu_high.arn]
        }
      }
    ]
  })
}
Widget type |
Shows | Key property |
|---|---|---|
metric |
time-series / stacked / number | metrics, view, stat, period |
log |
Logs Insights results | query |
alarm |
alarm status grid | alarms (ARNs) |
text |
Markdown notes | markdown |
number / gauge |
single value / gauge | view = "singleValue" / "gauge" |
For a dashboard reused across environments, move the body into a templatefile("dashboard.json.tpl", { instance_id = ..., region = ... }) so the same layout renders with per-environment IDs — the file stays valid JSON you can lint, and Terraform injects the values. CloudWatch bills $3/dashboard-month after the first three, so generate a few meaningful dashboards, not one per resource.
EventBridge for event-driven ops
Alarms watch metrics; EventBridge (aws_cloudwatch_event_rule + aws_cloudwatch_event_target) watches events — an instance changing state, an ECS task dying, a scheduled tick — and routes them to a target. It is the event-driven complement to metric alarms, and the same SNS topic is a natural target:
resource "aws_cloudwatch_event_rule" "ec2_stopped" {
  name        = "${var.project}-ec2-stopped"
  description = "Notify when an instance stops or terminates"
  event_pattern = jsonencode({
    source        = ["aws.ec2"]
    "detail-type" = ["EC2 Instance State-change Notification"]
    detail        = { state = ["stopped", "terminated"] }
  })
}

resource "aws_cloudwatch_event_target" "to_sns" {
  rule      = aws_cloudwatch_event_rule.ec2_stopped.name
  target_id = "notify-sns"
  arn       = aws_sns_topic.alerts.arn
}
| Rule trigger | Argument | Example |
|---|---|---|
| Event match | event_pattern (JSON) |
EC2 state change, ECS task stopped, GuardDuty finding |
| Schedule | schedule_expression |
rate(5 minutes), cron(0 3 * * ? *) |
| Targets | aws_cloudwatch_event_target |
SNS, Lambda, SQS, Step Functions, ECS task |
The same “let the service publish” rule applies: an EventBridge → SNS target needs the topic policy to allow events.amazonaws.com (shown earlier); an EventBridge → Lambda target needs an aws_lambda_permission for events.amazonaws.com. For pure cron use schedule_expression; note that AWS now steers new scheduling toward EventBridge Scheduler (aws_scheduler_schedule), but rules remain the right tool for event patterns.
SLOs and synthetics are the layer above all of this — turning these raw signals into error budgets and running scripted browser/API checks from outside your infrastructure. CloudWatch has Synthetics canaries and Application Signals for that; when you want first-class SLOs, burn-rate alerts and multi-step browser tests as code, the Datadog monitors, SLOs & synthetics lesson covers the same ideas with a dedicated observability provider.
Hands-on: build it with Terraform
Now the centrepiece — a complete, self-contained stack you run end to end: an EC2 instance, a retained log group with a metric filter, a CPU alarm and an error-count alarm both wired to an SNS email topic, a composite alarm, and a dashboard. You will apply, confirm the email, deliberately trigger the alarm to watch the notification land, then destroy. ⚠️ This creates a billable EC2 instance — do the whole loop in one sitting.
Step 0 — layout. Create a directory with these files:
cw-observability/
├── versions.tf
├── variables.tf
├── main.tf
├── outputs.tf
└── terraform.tfvars
Step 1 — versions.tf (provider pin + remote backend). The S3 bucket and DynamoDB lock table are assumed to exist (they come from the 3-tier / remote-state lesson); for a throwaway run you can delete the backend block and use local state.
terraform {
  required_version = ">= 1.6"
  required_providers {
    aws = {
      source  = "hashicorp/aws"
      version = "~> 5.60"
    }
  }
  backend "s3" {
    bucket         = "kloudvin-tfstate-apsouth1"
    key            = "labs/cw-observability/terraform.tfstate"
    region         = "ap-south-1"
    dynamodb_table = "kloudvin-tf-locks"
    encrypt        = true
  }
}
Step 2 — variables.tf.
variable "region" {
  type    = string
  default = "ap-south-1"
}
variable "project" {
  type    = string
  default = "cwlab"
}
variable "alarm_email" {
  type        = string
  description = "Address that must confirm the SNS subscription"
}
variable "instance_type" {
  type    = string
  default = "t3.micro"
}
Step 3 — main.tf (the whole plane). It uses the latest Amazon Linux 2023 AMI, a locals block for tags, and wires every resource discussed above.
provider "aws" {
  region = var.region
  default_tags { tags = local.tags }
}

locals {
  tags = {
    Project   = var.project
    ManagedBy = "Terraform"
    Lesson    = "cloudwatch-sns-observability"
  }
}

data "aws_caller_identity" "me" {}

data "aws_ami" "al2023" {
  most_recent = true
  owners      = ["amazon"]
  filter {
    name   = "name"
    values = ["al2023-ami-*-x86_64"]
  }
}

# --- The thing we watch ------------------------------------------------------
resource "aws_instance" "app" {
  ami           = data.aws_ami.al2023.id
  instance_type = var.instance_type
  tags          = { Name = "${var.project}-app" }
}

# --- SNS: topic + email subscription + policy --------------------------------
resource "aws_sns_topic" "alerts" {
  name = "${var.project}-alerts"
}

resource "aws_sns_topic_subscription" "email" {
  topic_arn = aws_sns_topic.alerts.arn
  protocol  = "email"
  endpoint  = var.alarm_email
}

data "aws_iam_policy_document" "alerts_policy" {
  statement {
    sid       = "AllowCloudWatchAlarmsToPublish"
    effect    = "Allow"
    actions   = ["SNS:Publish"]
    resources = [aws_sns_topic.alerts.arn]
    principals {
      type        = "Service"
      identifiers = ["cloudwatch.amazonaws.com"]
    }
    condition {
      test     = "ArnLike"
      variable = "aws:SourceArn"
      values   = ["arn:aws:cloudwatch:${var.region}:${data.aws_caller_identity.me.account_id}:alarm:*"]
    }
  }
}

resource "aws_sns_topic_policy" "alerts" {
  arn    = aws_sns_topic.alerts.arn
  policy = data.aws_iam_policy_document.alerts_policy.json
}

# --- Logs: retained group + metric filter ------------------------------------
resource "aws_cloudwatch_log_group" "app" {
  name              = "/app/${var.project}"
  retention_in_days = 14
}

resource "aws_cloudwatch_log_metric_filter" "app_errors" {
  name           = "${var.project}-app-errors"
  log_group_name = aws_cloudwatch_log_group.app.name
  pattern        = "?ERROR ?Exception"
  metric_transformation {
    name          = "AppErrorCount"
    namespace     = "Custom/${var.project}"
    value         = "1"
    default_value = "0"
    unit          = "Count"
  }
}

# --- Alarms ------------------------------------------------------------------
resource "aws_cloudwatch_metric_alarm" "ec2_cpu_high" {
  alarm_name          = "${var.project}-ec2-cpu-high"
  alarm_description   = "EC2 CPU >= 80% for 3 of 5 minutes"
  namespace           = "AWS/EC2"
  metric_name         = "CPUUtilization"
  statistic           = "Average"
  period              = 60
  evaluation_periods  = 5
  datapoints_to_alarm = 3
  threshold           = 80
  comparison_operator = "GreaterThanOrEqualToThreshold"
  treat_missing_data  = "missing"
  dimensions          = { InstanceId = aws_instance.app.id }
  alarm_actions       = [aws_sns_topic.alerts.arn]
  ok_actions          = [aws_sns_topic.alerts.arn]
}

resource "aws_cloudwatch_metric_alarm" "app_error_rate" {
  alarm_name          = "${var.project}-app-errors"
  alarm_description   = ">= 5 ERROR log lines per minute"
  namespace           = "Custom/${var.project}"
  metric_name         = "AppErrorCount"
  statistic           = "Sum"
  period              = 60
  evaluation_periods  = 1
  threshold           = 5
  comparison_operator = "GreaterThanOrEqualToThreshold"
  treat_missing_data  = "notBreaching"
  alarm_actions       = [aws_sns_topic.alerts.arn]
}

resource "aws_cloudwatch_composite_alarm" "degraded" {
  alarm_name        = "${var.project}-degraded"
  alarm_description = "CPU high AND errors elevated"
  alarm_rule = join(" AND ", [
    "ALARM(${aws_cloudwatch_metric_alarm.ec2_cpu_high.alarm_name})",
    "ALARM(${aws_cloudwatch_metric_alarm.app_error_rate.alarm_name})",
  ])
  alarm_actions = [aws_sns_topic.alerts.arn]
  depends_on    = [aws_cloudwatch_metric_alarm.ec2_cpu_high, aws_cloudwatch_metric_alarm.app_error_rate]
}

# --- Dashboard ---------------------------------------------------------------
resource "aws_cloudwatch_dashboard" "overview" {
  dashboard_name = "${var.project}-overview"
  dashboard_body = jsonencode({
    widgets = [
      { type = "metric", x = 0, y = 0, width = 12, height = 6, properties = {
        title = "EC2 CPU", region = var.region, view = "timeSeries",
        metrics = [["AWS/EC2", "CPUUtilization", "InstanceId", aws_instance.app.id]],
        yAxis = { left = { min = 0, max = 100 } },
        annotations = { horizontal = [{ label = "alarm", value = 80 }] } } },
      { type = "log", x = 12, y = 0, width = 12, height = 6, properties = {
        title = "Recent errors", region = var.region,
        query = "SOURCE '${aws_cloudwatch_log_group.app.name}' | fields @timestamp, @message | filter @message like /ERROR/ | sort @timestamp desc | limit 20" } }
    ]
  })
}
Step 4 — outputs.tf.
output "sns_topic_arn"   { value = aws_sns_topic.alerts.arn }
output "instance_id"     { value = aws_instance.app.id }
output "cpu_alarm_name"  { value = aws_cloudwatch_metric_alarm.ec2_cpu_high.alarm_name }
output "log_group_name"  { value = aws_cloudwatch_log_group.app.name }
output "dashboard_url" {
  value = "https://${var.region}.console.aws.amazon.com/cloudwatch/home?region=${var.region}#dashboards:name=${aws_cloudwatch_dashboard.overview.dashboard_name}"
}
Step 5 — init and plan. Put your email in terraform.tfvars (alarm_email = "you@example.com"), then:
terraform init
terraform plan -out tf.plan
Representative tail of the plan:
Plan: 12 to add, 0 to change, 0 to destroy.

Changes to Outputs:
  + cpu_alarm_name  = "cwlab-ec2-cpu-high"
  + dashboard_url   = (known after apply)
  + instance_id     = (known after apply)
  + log_group_name  = "/app/cwlab"
  + sns_topic_arn   = (known after apply)
Step 6 — apply. ⚠️ Billable EC2 instance from here.
terraform apply tf.plan
Step 7 — confirm the email subscription (the step Terraform can’t do). Check your inbox for “AWS Notification - Subscription Confirmation” and click Confirm subscription. Verify it took:
aws sns list-subscriptions-by-topic \
  --topic-arn "$(terraform output -raw sns_topic_arn)" \
  --query 'Subscriptions[].SubscriptionArn' --output text
# a real ARN = confirmed;  "PendingConfirmation" = you haven't clicked yet
Step 8 — verify the alarms exist and their state.
aws cloudwatch describe-alarms \
  --alarm-names "$(terraform output -raw cpu_alarm_name)" \
  --query 'MetricAlarms[0].[AlarmName,StateValue,Threshold]' --output text
# cwlab-ec2-cpu-high  INSUFFICIENT_DATA  80.0   (new alarm, no datapoints yet)
Step 9 — trigger the alarm and watch the email arrive. The fastest, cost-free way to prove the wiring (alarm → SNS → inbox) is to force the state with set-alarm-state:
aws cloudwatch set-alarm-state \
  --alarm-name "$(terraform output -raw cpu_alarm_name)" \
  --state-value ALARM \
  --state-reason "Manual test of SNS wiring"
Within seconds you should receive an email titled “ALARM: cwlab-ec2-cpu-high”. Because ok_actions is also set, it will auto-recover on the next real datapoint and send an “OK:” email too. To prove the metric filter path, push a matching log line and let the alarm evaluate:
aws logs create-log-stream --log-group-name "$(terraform output -raw log_group_name)" --log-stream-name test
aws logs put-log-events --log-group-name "$(terraform output -raw log_group_name)" \
  --log-stream-name test \
  --log-events "timestamp=$(( $(date +%s) * 1000 )),message=ERROR something broke x6"
# repeat / send 5+ within a minute; the app_error_rate alarm flips to ALARM
For a real CPU alarm (not forced), SSH in and run stress-ng --cpu 2 --timeout 300s (or sudo dnf install -y stress-ng first) and watch the alarm flip after ~3 minutes on the dashboard.
Step 10 — see the dashboard. terraform output -raw dashboard_url and open it — CPU on the left, recent ERROR logs on the right.
Step 11 — destroy (do not skip). ⚠️
terraform destroy
Confirm with aws cloudwatch describe-alarms --alarm-name-prefix cwlab returning empty and the EC2 instance gone. The log group is destroyed too (no skip_destroy), so no lingering storage cost.
Variables, outputs and making it reusable
Copy-pasting that CPU alarm onto every instance is exactly the click-ops we set out to kill — just in HCL. The fix is a small module that takes a resource identity and a set of thresholds and emits a standard alarm set, so a new service gets consistent monitoring by adding one block. Structure:
modules/standard-alarms/
├── variables.tf
├── main.tf
└── outputs.tf
modules/standard-alarms/variables.tf:
variable "name"          { type = string }                 # alarm name prefix
variable "sns_topic_arn" { type = string }
variable "dimensions"    { type = map(string) }            # e.g. { InstanceId = "i-…" }
variable "namespace"     {
  type = string
  default = "AWS/EC2"
}
variable "cpu_threshold" {
  type = number
  default = 80
}
variable "extra_alarms" {                                  # optional, per-metric
  type = map(object({
    metric_name         = string
    statistic           = string
    threshold           = number
    comparison_operator = string
    period              = optional(number, 60)
    evaluation_periods  = optional(number, 5)
    datapoints_to_alarm = optional(number, 3)
    treat_missing_data  = optional(string, "missing")
  }))
  default = {}
}
modules/standard-alarms/main.tf — a baseline CPU alarm plus a for_each over any extra alarms the caller declares:
resource "aws_cloudwatch_metric_alarm" "cpu" {
  alarm_name          = "${var.name}-cpu-high"
  namespace           = var.namespace
  metric_name         = "CPUUtilization"
  statistic           = "Average"
  period              = 60
  evaluation_periods  = 5
  datapoints_to_alarm = 3
  threshold           = var.cpu_threshold
  comparison_operator = "GreaterThanOrEqualToThreshold"
  treat_missing_data  = "missing"
  dimensions          = var.dimensions
  alarm_actions       = [var.sns_topic_arn]
  ok_actions          = [var.sns_topic_arn]
}

resource "aws_cloudwatch_metric_alarm" "extra" {
  for_each            = var.extra_alarms
  alarm_name          = "${var.name}-${each.key}"
  namespace           = var.namespace
  metric_name         = each.value.metric_name
  statistic           = each.value.statistic
  period              = each.value.period
  evaluation_periods  = each.value.evaluation_periods
  datapoints_to_alarm = each.value.datapoints_to_alarm
  threshold           = each.value.threshold
  comparison_operator = each.value.comparison_operator
  treat_missing_data  = each.value.treat_missing_data
  dimensions          = var.dimensions
  alarm_actions       = [var.sns_topic_arn]
}
Now every service is one call — and stamping the same alarm set across a fleet is a for_each over your instances:
module "app_alarms" {
  source        = "./modules/standard-alarms"
  for_each      = toset(["i-0abc", "i-0def", "i-0ghi"])
  name          = "app-${each.key}"
  sns_topic_arn = aws_sns_topic.alerts.arn
  dimensions    = { InstanceId = each.key }
  extra_alarms = {
    status-check = { metric_name = "StatusCheckFailed", statistic = "Maximum",
                     threshold = 1, comparison_operator = "GreaterThanOrEqualToThreshold" }
  }
}
| Module input | Type | Purpose |
|---|---|---|
name |
string | Alarm name prefix (per resource) |
sns_topic_arn |
string | Where alarms notify |
dimensions |
map(string) | Scopes every alarm to one resource |
namespace |
string | Service namespace |
cpu_threshold |
number | Baseline CPU alarm threshold |
extra_alarms |
map(object) | Any additional per-metric alarms |
Roll your own vs the registry. The community terraform-aws-modules/cloudwatch/aws module ships submodules for metric alarms, log groups and metric filters and is worth using once your needs stabilise — it handles the argument surface and edge cases for you. Roll your own (as above) when you want an opinionated house standard — every service gets exactly these alarms, named this way, wired to this topic — which is often the more valuable thing for an SRE team than raw flexibility. The two compose: your standard module can call the registry module internally.
Common mistakes and troubleshooting
Monitoring has a cruel failure mode: when it is broken, it fails silently — the page that should have fired simply doesn’t. These are the ones that bite, symptom → cause → fix:
| Symptom | Cause | Fix |
|---|---|---|
Alarm stuck in INSUFFICIENT_DATA |
No datapoints (wrong dimension, or metric truly silent) | Fix the dimension; set treat_missing_data; add default_value=0 on metric filters |
Alarm never leaves OK on a real problem |
Dimension watches the wrong/empty resource | Verify with get-metric-statistics; ALB/TG need arn_suffix, not ARN |
| Alarm fires but no email arrives | Email subscription still PendingConfirmation |
Click the confirmation link; check list-subscriptions-by-topic |
| Alarm fires, SNS silent, topic is KMS-encrypted | CloudWatch can’t use the AWS-managed key | Use a customer-managed KMS key whose policy allows cloudwatch.amazonaws.com |
| Alarm fires, SNS silent, topic policy tightened | Policy doesn’t allow cloudwatch.amazonaws.com |
Add the SNS:Publish statement with SourceArn condition |
| Lambda subscription never invoked | Missing aws_lambda_permission for sns.amazonaws.com |
Add the permission with source_arn = topic ARN |
| Log bill climbing every month | Log group has no retention_in_days (kept forever) |
Set retention; consider INFREQUENT_ACCESS class |
| Metric filter never produces datapoints | Pattern doesn’t match, or no default_value |
Test with a known line; add default_value="0" for continuity |
Percentile alarm errors on apply |
statistic and extended_statistic both set |
Use extended_statistic = "p99" alone for percentiles |
| Alarm flaps (fires and clears constantly) | datapoints_to_alarm too low / period too short |
Raise evaluation_periods; use M-of-N (3 of 5) |
| Composite alarm error: alarm not found | Child alarm created after composite | Add depends_on on the child alarms |
| ALB latency alarm reads wrong numbers | Averaging latency hides tail | Alarm on p99 (extended_statistic), not Average |
| EC2 memory alarm has no metric | Memory isn’t a default EC2 metric | Install the CloudWatch agent (CWAgent namespace) |
terraform destroy won’t remove log group |
skip_destroy = true set |
Remove skip_destroy or delete the group out of band |
The three that cost the most hours, in prose. The KMS-encrypted topic is the sneakiest: everything looks correct, the alarm goes red, and no message arrives — because the alarm publishes as cloudwatch.amazonaws.com and the default SNS encryption key (alias/aws/sns) does not grant that service principal kms:GenerateDataKey. The fix is a customer-managed CMK whose key policy allows cloudwatch.amazonaws.com (and events.amazonaws.com if EventBridge publishes), then kms_master_key_id on the topic. The unconfirmed email is the most common: Terraform reports success, the subscription resource exists, but it sits in PendingConfirmation and delivers nothing until a human clicks — so a freshly-applied stack looks monitored but is deaf until someone confirms. And treat_missing_data is the quiet killer of liveness alarms: leave it default and an alarm that should scream when a heartbeat stops instead drifts into INSUFFICIENT_DATA and never pages — set it to breaching for anything whose absence is the failure.
Cost, cleanup and production notes
What it costs left running. The EC2 t3.micro is the only meaningful charge (~₹625/$7.5 a month). CloudWatch here is nearly free: standard alarms are $0.10 each per month, the composite is $0.50, custom metrics from the filter $0.30 each, and the first three dashboards are free. The real cost risks in production are two: log ingestion/storage on a chatty app with no retention (this is the one that produces surprise five-figure lines), and high-resolution alarms (period 10 or 30) at $0.30 each versus $0.10 — only pay for sub-minute resolution where you genuinely act on it.
| Item | Rough price (indicative) | Control |
|---|---|---|
| Standard alarm | $0.10 / alarm-month | consolidate with composites |
| High-resolution alarm | $0.30 / alarm-month | use only where needed |
| Composite alarm | $0.50 / alarm-month | one per service, not per metric |
| Custom metric | $0.30 / metric-month | reuse dimensions, don’t explode cardinality |
| Dashboard | $3 / month after first 3 | a few good ones, not one per resource |
| Logs ingestion | ~$0.50 / GB (½ for IA class) | log level, sampling, IA class |
| Logs storage | ~$0.03 / GB-month | retention_in_days |
| SNS email | first 1,000 free, then ~$2/100k | fan-out, not per-alarm topics |
Clean up with terraform destroy; the only thing that survives a destroy is a log group flagged skip_destroy (which you would only set for audit logs you must keep). Production hardening notes:
- Remote state, always. These alarms reference EC2/ALB/RDS IDs; keep them in the same S3 + DynamoDB backend as the resources they watch so a rename can’t orphan an alarm. The backend itself comes from the 3-tier / remote-state lesson.
- Tag every alarm and topic.
default_tagson the provider plus aTeam/Servicetag makes cost allocation and ownership queryable — and lets you find the stale alarms nobody deletes. - Least privilege on the notification path. Scope the SNS topic policy with a
SourceArncondition; give the remediation Lambda’s role only the exact actions it needs (reboot this ASG, notec2:*). - Guard against drift. Someone will edit a threshold in the console during an incident; a scheduled
terraform planin CI surfaces that drift as a diff so it gets folded back into code (or reverted) instead of silently diverging. - Route by severity. Two topics — one for email/Slack (warnings), one for the pager (composites only) — keep the pager meaningful.
actions_enabled = falselets you ship an alarm in “observe” mode before it can wake anyone.
Going deeper
The core sections gave you the resources and their arguments. This one is the layer underneath — how CloudWatch actually decides an alarm has tripped, where the metric numbers live and for how long, the cheaper ways to emit custom metrics, the alarm actions that skip SNS entirely, and the pieces you reach for once one account and one region stop being enough. None of it is required to ship the hands-on, but all of it is what separates an alarm that looks right from one you’d stake a pager on.
How an alarm is actually evaluated
The M-of-N rule (datapoints_to_alarm of evaluation_periods) is only half the mechanism. What trips people up is what CloudWatch does before it counts breaches: it assembles an evaluation range. On each period it wants the most recent evaluation_periods datapoints — but if some of those are missing, it reaches further back in time to pull additional real datapoints into the window, up to a documented cap, so it evaluates against as many actual numbers as it can find. Only after that backfill does treat_missing_data decide how any still-missing slots are counted, and only then is the M-of-N test applied.
That ordering explains two confusing behaviours. First, an alarm can transition on a datapoint that is several minutes older than “now,” because CloudWatch pulled it in to fill the range — so an alarm may fire slightly later than a naive period × evaluation_periods estimate suggests. Second, treat_missing_data = "missing" (the default) means “if the entire range is empty, go INSUFFICIENT_DATA; if it’s partly full, evaluate on what’s there and ignore the gaps” — which is precisely why a metric that goes fully silent lands in INSUFFICIENT_DATA and stops paging. For a liveness signal you almost always want breaching, so that silence is the alarm.
Every state transition is written to the alarm’s history, retained for 14 days and queryable with aws cloudwatch describe-alarm-history --alarm-name <n>. That history — with the exact datapoints and the reason string CloudWatch recorded — is the first thing to read when an alarm did something surprising; it tells you what CloudWatch actually saw, not what you assumed it saw.
Metric resolution and the retention roll-up
CloudWatch does not keep every datapoint at full resolution forever. Metrics age into coarser buckets, and alarms and dashboards can only see what still exists at the granularity they ask for:
| Data age | Finest resolution retained |
|---|---|
| 0–3 hours | 1-second (high-resolution metrics only) |
| 3 hours – 15 days | 1-minute |
| 15 – 63 days | 5-minute |
| 63 – 455 days | 1-hour |
| > 455 days | deleted |
Two consequences follow. A dashboard that reaches back a month can only draw 1-hour points no matter what period you request — the fine-grained data has already been rolled up and cannot be recovered. And high-resolution metrics (sub-minute: storage_resolution = 1 on a PutMetricData call, or a period of 10/30 on an alarm) buy 1-second granularity for only three hours and cost more per alarm ($0.30 vs $0.10) — so pay for them only where you genuinely act on a sub-minute signal, such as a latency SLO on a checkout path.
Custom metrics: PutMetricData, metric filters, and the Embedded Metric Format
There are three ways to get an application-defined number into CloudWatch, and they bill very differently. The direct PutMetricData API call is simplest but chatty — you pay per request and per custom metric. A metric filter (covered earlier) counts log-pattern matches cheaply but only produces counts. The modern middle path is the Embedded Metric Format (EMF): your app writes a structured JSON log line with an _aws metadata block naming the metrics and dimensions, and CloudWatch Logs auto-extracts them into real metrics as the logs land — one write gives you both the searchable log and the metric, with no separate API call:
{
  "_aws": {
    "Timestamp": 1720512000000,
    "CloudWatchMetrics": [
      {
        "Namespace": "Custom/checkout",
        "Dimensions": [["Service"]],
        "Metrics": [{ "Name": "OrderLatencyMs", "Unit": "Milliseconds" }]
      }
    ]
  },
  "Service": "checkout",
  "OrderLatencyMs": 87,
  "orderId": "ord_PLACEHOLDER"
}
The catch that governs all three is cardinality: a custom metric is one unique combination of namespace + metric name + dimension values, and each such combination is billed (~$0.30/month). Put a high-cardinality field like orderId into a dimension and you mint a new paid metric for every order; keep those fields as ordinary log properties instead (as above — orderId is a plain field, only Service is a dimension) so they stay searchable in Logs Insights without exploding the metric bill.
Alarm actions that skip SNS entirely
alarm_actions accepts any action ARN, not just an SNS topic. Several of the most useful ones let an alarm act on the resource directly, with no topic or Lambda in between:
| Action | ARN shape | Effect |
|---|---|---|
| EC2 recover | arn:aws:automate:<region>:ec2:recover |
recover an impaired instance on new hardware |
| EC2 reboot / stop / terminate | arn:aws:automate:<region>:ec2:reboot (etc.) |
act on the instance the alarm watches |
| Auto Scaling policy | the scaling-policy ARN | scale the group up or down |
| Systems Manager OpsItem | arn:aws:ssm:<region>:<account-id>:opsitem:<severity> |
open an OpsItem in OpsCenter |
| Systems Manager Incident | an Incident Manager response-plan ARN | start a managed incident |
The EC2 recover action pairs naturally with a StatusCheckFailed_System alarm — the instance heals itself with no human and no SNS hop. These are plain strings you drop into alarm_actions; Terraform doesn’t validate them, so a typo silently no-ops, and you should confirm in the console after apply that the action attached.
At scale: metric streams and cross-account observability
Polling GetMetricData is fine for one account; a fleet outgrows it. Two features matter once you scale:
- Metric Streams (
aws_cloudwatch_metric_stream) push metrics in near-real-time to a Kinesis Data Firehose — and onward to S3, a data lake, or a third party such as Datadog or New Relic — instead of anyone polling. It is the pull-to-push switch for the whole metric plane. - Cross-account observability (
aws_oam_sinkin a central monitoring account,aws_oam_linkin each source account) gives one pane of glass over many accounts’ metrics, logs and traces without copying the data — the SRE answer to “we have thirty accounts and no single dashboard.”
Both are pure Terraform, and both belong in the same reviewed code as the alarms they complement.
EventBridge vs “CloudWatch Events”
A naming footgun worth clearing up: EventBridge is CloudWatch Events, renamed in 2019 and vastly expanded. Terraform kept the original resource names for compatibility — aws_cloudwatch_event_rule and aws_cloudwatch_event_target are EventBridge resources despite the cloudwatch_ prefix. Keep the mental split clear:
- A metric alarm watches numbers over time and applies an M-of-N threshold. Use it for “CPU high,” “5xx elevated,” “queue too deep.”
- An EventBridge rule matches the shape of an event (a JSON document AWS emits when something happens) or fires on a schedule. Use it for “an instance entered
stopped,” “an ECS task died,” “a GuardDuty finding appeared,” “every day at 03:00.”
EventBridge adds what plain CloudWatch Events never had: custom and partner event buses, a schema registry, Pipes for point-to-point integration, and EventBridge Scheduler (aws_scheduler_schedule) — AWS’s steer for new cron-style jobs, though aws_cloudwatch_event_rule with a schedule_expression still works. Alarms and rules complement each other; a mature setup uses both, and often points both at the same SNS topic.
Practice challenges
Six exercises that rebuild the lesson’s spine from the ground up — retention, a trustworthy alarm, the delivery chain, silence-as-failure, error rate, and paging on real impact across a fleet. Each has a worked solution; try it before you open it. Assume a provider "aws" and an aws_sns_topic.alerts already exist unless the task says otherwise.
1. Beginner — stop a log group billing you forever. Declare a log group /app/shop that keeps logs for 30 days and nothing longer.
<details><summary>Solution</summary>
resource "aws_cloudwatch_log_group" "shop" {
  name              = "/app/shop"
  retention_in_days = 30
}
Why: omitting retention_in_days means never expire — the single most common silent CloudWatch cost leak. 30 is one of the fixed set of allowed values.
</details>
2. Beginner → intermediate — a CPU alarm that tolerates a blip. Alarm on EC2 CPUUtilization ≥ 80%, but only when it’s sustained: 3 breaching minutes out of the last 5. Notify aws_sns_topic.alerts.
<details><summary>Solution</summary>
resource "aws_cloudwatch_metric_alarm" "cpu" {
  alarm_name          = "shop-cpu-high"
  namespace           = "AWS/EC2"
  metric_name         = "CPUUtilization"
  statistic           = "Average"
  period              = 60
  evaluation_periods  = 5
  datapoints_to_alarm = 3
  threshold           = 80
  comparison_operator = "GreaterThanOrEqualToThreshold"
  treat_missing_data  = "missing"
  dimensions          = { InstanceId = aws_instance.app.id }
  alarm_actions       = [aws_sns_topic.alerts.arn]
  ok_actions          = [aws_sns_topic.alerts.arn]
}
Why: datapoints_to_alarm = 3 of evaluation_periods = 5 is the M-of-N rule that ignores a one-minute spike while still catching a real, sustained breach.
</details>
3. Intermediate — make it actually deliver. Your alarm from #2 fires but no email arrives. Add an email subscription and a topic policy so CloudWatch can publish, and state the one step Terraform cannot do.
<details><summary>Solution</summary>
resource "aws_sns_topic_subscription" "email" {
  topic_arn = aws_sns_topic.alerts.arn
  protocol  = "email"
  endpoint  = "oncall@example.com"
}

data "aws_iam_policy_document" "allow_cw" {
  statement {
    actions   = ["SNS:Publish"]
    resources = [aws_sns_topic.alerts.arn]
    principals {
      type        = "Service"
      identifiers = ["cloudwatch.amazonaws.com"]
    }
  }
}

resource "aws_sns_topic_policy" "alerts" {
  arn    = aws_sns_topic.alerts.arn
  policy = data.aws_iam_policy_document.allow_cw.json
}
The step Terraform can’t do: confirm the email subscription. apply leaves it in PendingConfirmation; a human must click the link in the confirmation email before any notification is delivered.
Why: the delivery chain is alarm → action → topic → confirmed subscriber, and the topic policy must allow the cloudwatch.amazonaws.com service principal to SNS:Publish. Break any link and the alarm goes red in silence.
</details>
4. Intermediate — silence is the failure. A batch job emits a heartbeat metric Heartbeat in namespace Custom/batch every minute. Alarm when it stops (no heartbeat = the job died), not when it’s high.
<details><summary>Solution</summary>
resource "aws_cloudwatch_metric_alarm" "heartbeat_missing" {
  alarm_name          = "batch-heartbeat-missing"
  namespace           = "Custom/batch"
  metric_name         = "Heartbeat"
  statistic           = "Sum"
  period              = 60
  evaluation_periods  = 3
  datapoints_to_alarm = 3
  threshold           = 1
  comparison_operator = "LessThanThreshold"
  treat_missing_data  = "breaching"   # ← the whole trick
  alarm_actions       = [aws_sns_topic.alerts.arn]
}
Why: for a liveness signal, absence is the outage — treat_missing_data = "breaching" makes missing datapoints count as a breach, so the alarm pages instead of drifting into INSUFFICIENT_DATA and staying quiet forever.
</details>
5. Advanced — alarm on the rate, not the count. A raw 5xx count false-alarms during traffic spikes. Alarm when the ALB target 5xx rate exceeds 5% (5xx ÷ requests × 100) for 2 of 3 minutes.
<details><summary>Solution</summary>
resource "aws_cloudwatch_metric_alarm" "err_rate" {
  alarm_name          = "shop-5xx-rate"
  comparison_operator = "GreaterThanThreshold"
  evaluation_periods  = 3
  datapoints_to_alarm = 2
  threshold           = 5
  treat_missing_data  = "notBreaching"
  alarm_actions       = [aws_sns_topic.alerts.arn]

  metric_query {
    id          = "rate"
    expression  = "(errors / requests) * 100"
    label       = "5xx rate %"
    return_data = true
  }
  metric_query {
    id = "errors"
    metric {
      metric_name = "HTTPCode_Target_5XX_Count"
      namespace   = "AWS/ApplicationELB"
      period      = 60
      stat        = "Sum"
      dimensions  = { LoadBalancer = aws_lb.this.arn_suffix }
    }
  }
  metric_query {
    id = "requests"
    metric {
      metric_name = "RequestCount"
      namespace   = "AWS/ApplicationELB"
      period      = 60
      stat        = "Sum"
      dimensions  = { LoadBalancer = aws_lb.this.arn_suffix }
    }
  }
}
Why: metric math computes a value no single metric gives you; the expression carries return_data = true (it is what the alarm watches) and the raw metrics feed it with return_data left to its default of false. Note the dimension is arn_suffix, not the full ARN.
</details>
6. Advanced — page on user impact, across a fleet. Two things: (a) a composite alarm that pages only when CPU is high AND the 5xx-rate alarm is firing, and (b) stamp the CPU alarm across three instances without repeating HCL.
<details><summary>Solution</summary>
resource "aws_cloudwatch_composite_alarm" "impact" {
  alarm_name = "shop-user-impact"
  alarm_rule = join(" AND ", [
    "ALARM(${aws_cloudwatch_metric_alarm.cpu.alarm_name})",
    "ALARM(${aws_cloudwatch_metric_alarm.err_rate.alarm_name})",
  ])
  alarm_actions = [aws_sns_topic.pager.arn]   # only the composite pages
  depends_on    = [aws_cloudwatch_metric_alarm.cpu, aws_cloudwatch_metric_alarm.err_rate]
}

module "fleet" {
  source        = "./modules/standard-alarms"
  for_each      = toset(["i-0aaa", "i-0bbb", "i-0ccc"])
  name          = "app-${each.key}"
  sns_topic_arn = aws_sns_topic.alerts.arn
  dimensions    = { InstanceId = each.key }
}
Why: the composite fires on correlated conditions (real impact, not a lone batch job spiking CPU) and keeps the pager quiet otherwise; for_each over a module gives every instance the identical alarm set from one source of truth. The children keep their quieter email actions; only the composite talks to the pager.
</details>
Common beginner mistakes
These are misconceptions, not typos — the wrong mental model that produces a broken monitor even when the HCL is valid. Each is the belief, why it’s wrong, and the model to hold instead. (The symptom → cause → fix table earlier is the companion for when something is already misbehaving.)
“The alarm went red, so the team got paged.” No — ALARM is just a state in a console. A state change only notifies if the alarm has alarm_actions, those point at an SNS topic, the topic has a confirmed subscriber, and the topic policy lets cloudwatch.amazonaws.com publish. Right model: red is a light bulb; the wiring to the phone is a separate, breakable chain you must build and verify end to end.
“More alarms mean better coverage.” A hundred twitchy alarms is worse than ten trustworthy ones — the pager gets ignored (alert fatigue) and the real page is lost in the noise. Right model: alarm on symptoms the user feels (errors, latency, saturation) and combine correlated signals into composite alarms; every alarm should be one you’d act on at 3 a.m.
“period is how often the alarm checks the metric.” period is the aggregation granularity of the metric — how many seconds of data become one datapoint — not a polling interval. What decides sensitivity is the window (period × evaluation_periods) and the M-of-N (datapoints_to_alarm). Right model: period sizes the datapoint; evaluation_periods and datapoints_to_alarm size the judgement.
“INSUFFICIENT_DATA means something is broken.” It is a normal, valid third state — the alarm simply lacks enough datapoints to judge. What is actually broken is leaving treat_missing_data at its default for a liveness signal, so a stopped heartbeat drifts into INSUFFICIENT_DATA and never pages. Right model: decide what silence means for each metric and set treat_missing_data to say so (breaching for heartbeats, notBreaching for bursty or idle workloads).
“Averaging latency is fine.” An Average of TargetResponseTime hides exactly the tail you care about — the slow 1% of requests that make users leave. Right model: alarm on a percentile (extended_statistic = "p99"), because SLOs live in the tail, not the mean.
“I set the dimension to the ALB’s ARN.” ALB and Target-Group dimensions want the arn_suffix (aws_lb.this.arn_suffix), not the full ARN — pass the ARN and the alarm silently watches nothing and sits in INSUFFICIENT_DATA forever. Right model: a wrong dimension isn’t an error, it’s an alarm watching the void; always confirm with get-metric-statistics that data actually arrives.
“Terraform will confirm my email subscription.” It can’t — SNS email confirmation is deliberately out of band (anti-spam). apply reports success with the subscription still PendingConfirmation. Right model: a freshly-applied stack looks monitored but is deaf until a human clicks the link; confirmation is a manual step you bake into the runbook, and you verify it with list-subscriptions-by-topic.
Glossary
- CloudWatch — AWS’s built-in metrics, logs and alarms service; the observability plane this lesson builds in code.
- Metric — a time-ordered series of numbers (CPU %, request count, latency) that CloudWatch stores and you alarm on.
- Namespace — a container that groups metrics, e.g.
AWS/EC2,AWS/ApplicationELB, or your ownCustom/<app>. - Dimension — a name/value pair that scopes a metric to one resource, e.g.
InstanceId = i-0abc; the wrong dimension makes an alarm watch nothing. - Datapoint — one aggregated value covering one
period(e.g. the average CPU over 60 seconds). period— seconds of data aggregated into one datapoint; 10/30 = high-resolution (pricier), otherwise a multiple of 60.- Statistic — how raw samples are aggregated into a datapoint:
Average,Sum,Minimum,Maximum,SampleCount. extended_statistic— a percentile aggregation (p90/p95/p99); mutually exclusive withstatistic.- Alarm — a rule that watches one metric (or expression) and moves between states when it breaches a threshold.
- Alarm state —
OK(within bounds),ALARM(breached per M-of-N),INSUFFICIENT_DATA(not enough datapoints to judge). evaluation_periods(N) — how many datapoints CloudWatch inspects in the window.datapoints_to_alarm(M) — how many of those N must breach to fire; omitting it means M = N.- M-of-N — the “3 of the last 5” rule; the main knob that trades detection speed against noise.
treat_missing_data— how missing datapoints are counted:missing(default),notBreaching,breaching,ignore.threshold— the number the metric is compared against; omitted for anomaly detection (usethreshold_metric_id).comparison_operator— the direction of the test (GreaterThanOrEqualToThreshold, etc.) or the anomaly-band form.- Composite alarm — an alarm with no metric of its own that combines other alarms with
AND/OR/NOTto page on correlated conditions. - Metric math — an expression (e.g.
(errors/requests)*100) computed across metrics insidemetric_queryblocks;return_data = truemarks what the alarm watches. - Anomaly detection — a learned “normal” band (
ANOMALY_DETECTION_BAND) used in place of a fixed threshold for seasonal metrics. - SNS (Simple Notification Service) — the pub/sub fan-out that turns an alarm’s action into notifications.
- Topic — an SNS channel alarms publish to; every subscriber receives whatever is published.
- Subscription — an endpoint attached to a topic (email, SMS, HTTPS, Lambda, SQS);
emailneeds manual confirmation. alarm_actions— the ARNs an alarm notifies onALARM(usually an SNS topic; can also be EC2/ASG/SSM actions).- Topic policy — the resource policy that says who may publish; must allow
cloudwatch.amazonaws.com(andevents.amazonaws.comfor EventBridge). - Log group — a named container for log streams;
retention_in_dayscaps how long, and how expensively, they’re kept. - Log stream — a single source’s sequence of log events within a group (e.g. one instance).
retention_in_days— how long logs live; the default is never expire (the classic cost leak).- Metric filter — a rule that counts log-pattern matches into a custom metric, so you can alarm on a log line.
default_value— the value a metric filter emits when nothing matches (set0to keep the metric continuous).- Subscription filter — streams matching log events out to Lambda/Kinesis/Firehose in near-real-time (log → pipeline).
- CloudWatch agent — the on-host agent that ships log files and the metrics EC2 doesn’t emit by default (memory, disk).
- Embedded Metric Format (EMF) — a structured JSON log line CloudWatch auto-extracts into metrics; one write gives log + metric.
- Custom metric — an app-defined metric (one per unique namespace + name + dimension combination), billed per metric.
- Dashboard — a
jsonencoded layout of widgets (metric/log/alarm/text) rendered byaws_cloudwatch_dashboard. - EventBridge — the renamed, expanded CloudWatch Events; rules match event shapes or schedules, complementing metric alarms.
arn_suffix— the trailing portion of an ALB/Target-Group ARN that CloudWatch dimensions require (not the full ARN).- CMK (customer-managed KMS key) — the key type an encrypted SNS topic needs so CloudWatch is allowed to publish to it.
Cheat-sheet
Resources and the argument that matters most on each:
| Resource | Key arguments |
|---|---|
aws_cloudwatch_metric_alarm |
namespace metric_name statistic/extended_statistic period evaluation_periods datapoints_to_alarm comparison_operator threshold treat_missing_data dimensions alarm_actions |
aws_cloudwatch_metric_alarm (math/anomaly) |
metric_query { id expression/metric{} return_data } threshold_metric_id |
aws_cloudwatch_composite_alarm |
alarm_rule (ALARM()/OK()/AND/OR/NOT) alarm_actions depends_on |
aws_sns_topic |
name kms_master_key_id (⚠️ CMK for CW) |
aws_sns_topic_subscription |
protocol endpoint (email = manual confirm) |
aws_sns_topic_policy |
allow cloudwatch.amazonaws.com / events.amazonaws.com |
aws_cloudwatch_log_group |
retention_in_days (⚠️ default = forever) kms_key_id log_group_class |
aws_cloudwatch_log_metric_filter |
pattern metric_transformation{ name namespace value default_value } |
aws_cloudwatch_log_subscription_filter |
filter_pattern destination_arn role_arn |
aws_cloudwatch_dashboard |
dashboard_body = jsonencode({ widgets = [...] }) |
aws_cloudwatch_event_rule / _target |
event_pattern / schedule_expression; arn target |
Verification and trigger commands:
| Task | Command |
|---|---|
| List alarms + state | aws cloudwatch describe-alarms --alarm-name-prefix <p> |
| Force an alarm (test wiring) | aws cloudwatch set-alarm-state --alarm-name <n> --state-value ALARM --state-reason test |
| Read a metric | aws cloudwatch get-metric-statistics --namespace AWS/EC2 --metric-name CPUUtilization ... |
| Check subscription confirmed | aws sns list-subscriptions-by-topic --topic-arn <arn> |
| Push a test log line | aws logs put-log-events --log-group-name <g> --log-stream-name <s> --log-events ... |
| Tail logs live | aws logs tail /app/<p> --follow |
Alarm states: OK (metric within bounds), ALARM (threshold breached per M-of-N), INSUFFICIENT_DATA (not enough datapoints — governed by treat_missing_data).
Interview and exam questions
-
What do
evaluation_periodsanddatapoints_to_alarmdo together? They define the “M of N” rule:evaluation_periods(N) is the window of datapoints CloudWatch inspects;datapoints_to_alarm(M) is how many of them must breach for the alarm to fire.3of5tolerates a one-datapoint blip while still catching a sustained problem. Omitting M makes it N-of-N. -
An alarm is stuck in
INSUFFICIENT_DATA. Give two causes. Either no datapoints are arriving (wrongdimensions, so it’s watching a resource that emits nothing — e.g. an ALB alarm given the ARN instead ofarn_suffix), or the metric is legitimately silent andtreat_missing_datais left atmissing. Fix the dimension, or settreat_missing_datatobreaching/notBreachingper intent, and setdefault_value=0on metric filters. -
Why might an alarm fire but no email arrive? Most often the email subscription is unconfirmed (
PendingConfirmation— Terraform can’t confirm it). Otherwise the topic is KMS-encrypted with a key CloudWatch can’t use, or the topic policy doesn’t allowcloudwatch.amazonaws.comtoSNS:Publish. -
When would you use a composite alarm? To page on correlated conditions and cut noise — e.g. only page when CPU is high AND 5xx is elevated (real user impact), leaving the individual alarms on quieter email actions.
aws_cloudwatch_composite_alarmreferences child alarms by name inalarm_rule. -
How do you alarm on p99 latency? Use
extended_statistic = "p99"(notstatistic) on theTargetResponseTimemetric — the two are mutually exclusive, and averaging latency hides the tail you actually care about. -
What’s the difference between a metric filter and a subscription filter? A metric filter counts log-pattern matches into a CloudWatch metric you can alarm on (log → metric → alarm). A subscription filter streams matching log events out to Lambda/Kinesis/Firehose in near-real-time for processing or centralisation (log → external pipeline).
-
Why set
retention_in_days? The default is never expire — logs accumulate and bill for storage forever. Setting retention caps storage cost; theINFREQUENT_ACCESSlog-group class further cuts ingestion price. -
How does an alarm trigger auto-remediation?
alarm_actionspublishes to an SNS topic that has a Lambda subscription; the function runs the fix (reboot, scale, flush). You must addaws_lambda_permissionallowingsns.amazonaws.comto invoke it, or the invoke is denied silently. -
Static threshold vs anomaly detection — when each? Static for hard SLOs where a fixed “bad” number exists (latency ≤ 1 s, error rate ≤ 1%). Anomaly detection for seasonal/shape-shifting metrics (request volume) where no fixed threshold is ever right; it needs history to learn the band and uses
threshold_metric_idwith a band comparison operator. -
(Terraform Associate style) You add an
emailsubscription andapplysucceeds, but notifications don’t arrive. Why? The subscription is created inPendingConfirmation; SNS email subscriptions require out-of-band confirmation that Terraform cannot perform. Notifications flow only after the recipient clicks the confirmation link. -
(Terraform Associate style) How do you emit the same alarm set across 30 instances without repeating HCL? Author a module that takes the resource identity + thresholds and emits the alarms, then call it with
for_eachover the instance IDs — one source of truth, consistent alarms, one place to change a threshold. -
Which EC2 signals are not available by default, and how do you get them? Memory and filesystem disk usage — the hypervisor doesn’t see them. Install the CloudWatch agent, which publishes them under the
CWAgentnamespace and can also ship app log files to a log group.
Key takeaways
- Observability belongs in code: alarms, topics, retention and dashboards are infrastructure — versioned, reviewed, and stamped identically across the fleet from one module, never clicked together per host.
- The alarm’s honesty lives in three arguments:
evaluation_periods+datapoints_to_alarm(M-of-N tames flapping) andtreat_missing_data(decides what silence means). Get these wrong and the alarm is either noise or deaf. - Pick the right metric and dimension per service — the alarm catalog is the reference; ALB/Target-Group dimensions want
arn_suffix, and a wrong dimension leaves the alarm watching nothing. - SNS is the fan-out:
alarm_actions→ topic → email/Slack/PagerDuty or a Lambda that auto-remediates. Email needs manual confirmation; a KMS-encrypted topic needs a CMK CloudWatch can use; a tightened topic policy must allowcloudwatch.amazonaws.com. retention_in_daysis not optional — the default keeps logs forever and is the classic silent AWS cost leak. Metric filters promote a log pattern to an alarm (withdefault_value=0so it stays continuous).- Composite alarms, metric math and anomaly detection turn raw single-metric alarms into signals an on-call actually trusts: page on user impact, on error rate, and on deviation from normal.
- Always finish the loop:
apply, confirm the subscription, trigger the alarm to prove the wiring, thendestroy— a stack that was never triggered is a stack you don’t know is monitored.