Every signal Azure Monitor collects — VM performance counters, App Service logs, Activity Log, AKS container stdout, sign-in events — has to land somewhere before you can query it. That somewhere is a Log Analytics workspace: a regional, schema-on-read log store you query with KQL (Kusto Query Language). Create it badly and you pay for months. Put it in the wrong region and your data sits far from your resources. Leave the access control mode on the legacy default and one broad role grant lets every reader query everyone’s logs. Forget retention and you either hoard expensive data or lose the history an auditor asks for. None of these are reversible with a click — region is fixed for the life of the workspace, and re-homing data means a migration.
This article walks you through creating one workspace correctly, end to end, explaining each decision as you make it. We build the exact same workspace three ways — in the Azure portal, with the az monitor log-analytics CLI, and as a Bicep template — so you can use whichever fits your workflow and see what the portal does under the hood. The centerpiece is a numbered hands-on lab you copy-paste in Cloud Shell: provision the workspace, point diagnostic data at it, run a KQL query to prove data is flowing, grant a teammate resource-context read access so they see only their resource’s logs, then tear it all down so you pay nothing.
By the end you will know which region to pick and why it cannot change, the difference between the two access control modes and why resource-context is the modern default, how retention and archive drive the bill, and how to grant RBAC so a developer reads their app’s logs without seeing the security team’s. These four decisions separate a workspace you are happy with a year later from one you quietly recreate.
What problem this solves
Without a deliberately designed workspace, two failure modes show up within weeks. The first is a cost surprise: someone enables verbose diagnostic settings on fifty resources pointing at a workspace nobody sized, and the monthly ingestion-plus-retention bill balloons because the defaults keep data longer than anyone intended. The second is an access leak: the workspace was created with the legacy access mode, a team lead was granted Log Analytics Reader at the subscription to “see logs,” and now that person — and everyone they share a query with — can read sign-in logs, Key Vault audit events, and every other workload’s data, because a workspace-context grant ignores per-resource boundaries.
Both come from treating the workspace as a throwaway bucket instead of a governed data store. Region, access mode, retention, and RBAC are set at (or just after) creation, and the first three are awkward-to-impossible to change later. Region is immutable — to move data you create a new workspace and migrate. Switching access modes is possible but quietly changes who can see what, so doing it on a busy production workspace is a risk. Getting these right on day one is far cheaper than fixing them under an audit deadline.
Who hits this: anyone standing up observability for the first time — a solo engineer wiring Azure Monitor for one app, or a platform team building the central logging workspace every subscription sends diagnostics to. The same four decisions apply at both scales; only the blast radius differs.
Learning objectives
By the end of this article you can:
- Create a Log Analytics workspace in the portal, with
azCLI, and with Bicep — and explain what each parameter does. - Choose the right region and explain why it is permanent and how it affects data residency and egress.
- Pick the correct access control mode (
resource-contextvsworkspace-context) and explain the security difference between them. - Set retention and understand the interactive-retention vs archive split and how each is billed.
- Grant resource-context RBAC so a user reads only the logs of resources they own, without workspace-wide access.
- Send a resource’s diagnostic data to the workspace and validate ingestion with a KQL query.
- Estimate the monthly cost of a workspace from ingestion volume and retention, and apply the free-tier allowances.
Prerequisites & where this fits
You need an Azure subscription where you hold Contributor (to create the workspace) and Owner or User Access Administrator (to grant the RBAC role in the lab). Be comfortable opening Azure Cloud Shell, running az, and reading JSON. No prior KQL is required — the one query in the lab is given in full. The Bicep section is self-contained, but Deploy Your First Bicep File From Scratch covers the toolchain in more depth.
This sits at the foundation of the Observability track. A workspace is the destination; the things that fill it — diagnostic settings, Azure Monitor Agent, Application Insights — come next. The natural follow-on is Azure Monitor and Application Insights: Full-Stack Observability, which uses a workspace like this one as its log store. Because access is governed by Azure RBAC, the role concepts from Azure Resource Hierarchy Explained: Subscriptions, Resource Groups and Resources are assumed. If you plan one central workspace for many subscriptions, the scoping ideas in Management Groups 101: Designing a Hierarchy That Scopes Policy and RBAC apply to how you place and govern it.
Core concepts
Five ideas make every decision in this guide obvious.
A workspace is a regional, schema-on-read log store. A Log Analytics workspace is a container of tables (Heartbeat, Perf, AzureActivity, AppRequests, SigninLogs, and many more). Data is written without a fixed schema and structured when you query it with KQL. The workspace lives in exactly one Azure region — the region where your ingested log data physically resides. That choice is permanent for the life of the resource.
Azure Monitor is the platform; the workspace is one of its stores. Azure Monitor is the umbrella service for metrics, logs, alerts and dashboards. Logs (queryable structured/text records) go to a Log Analytics workspace; metrics (numeric time series) go to a separate metrics store. When a resource has a diagnostic setting pointed at your workspace, its logs flow in — the workspace does not pull data; sources push to it.
Ingestion and retention are what you pay for. Two main levers: GB ingested per day (priced per GB, with a daily free allowance) and retention — how long data stays queryable. The first 31 days are free; beyond that you pay per GB-month for interactive retention, and a cheaper archive tier holds rarely queried data. Sizing means estimating GB/day and choosing a retention period.
Access control mode decides whether RBAC is workspace-wide or per-resource. A workspace has an access control mode: resource-context (the modern default, called “Use resource or workspace permissions” in the portal) or workspace-context (“Require workspace permissions”). In resource-context mode, a user who has read access to an Azure resource can query that resource’s logs through the resource’s own Logs blade — without any role on the workspace. In workspace-context mode, only roles granted on the workspace itself grant query access, and such a grant sees all tables. The first scopes visibility by resource ownership; the second is all-or-nothing.
The built-in roles are coarse; resource-context is how you get least privilege. Log Analytics Reader reads all data and runs queries; Log Analytics Contributor also changes the workspace and diagnostic settings. Granting either at the workspace gives full-data visibility. To let a team see only their own logs, you rely on resource-context mode plus the team’s existing Reader on their resources — not a workspace role.
The vocabulary in one table
Pin down every moving part before the deep sections:
| Concept | One-line definition | Where it lives | Why it matters |
|---|---|---|---|
| Workspace | Regional store of log tables, queried with KQL | A resource group, one region | The destination for all logs |
| Region | Azure location where ingested data resides | Set at create, immutable | Residency, egress, latency |
| Table | A typed collection of records (e.g. Heartbeat) |
Inside the workspace | What KQL queries |
| Diagnostic setting | Rule sending a resource’s logs to a destination | On the source resource | How data gets in |
| Ingestion | GB of data written per day | Billing dimension | Main cost driver |
| Retention | Days data stays queryable | Per workspace / per table | Cost + compliance |
| Archive | Cheap long-term tier for rarely queried data | Per table | Cuts long-retention cost |
| Access control mode | resource-context vs workspace-context |
Workspace property | Who can see which logs |
| Log Analytics Reader | Built-in role: read all data, run queries | Azure RBAC | Workspace-wide read |
| Resource-context | Query a resource’s logs via its own Logs blade | Mode + resource RBAC | Least-privilege visibility |
Choosing the region — and why it is permanent
The first field you set is the region, and it is the one decision you cannot undo. The region is where your ingested log data physically lives. You generally want the workspace in the same region as the bulk of the resources sending to it, for three reasons: lower ingestion latency, no cross-region data-transfer cost on the way in, and data residency — if logs must stay in an EU region for compliance, the workspace region enforces it.
You can send data from resources in other regions and subscriptions; nothing forbids it. But cross-region ingestion can incur egress from the source side and adds latency, so a workspace per major region (or a few regional hubs) is the common pattern rather than one global workspace.
| Decision factor | Guidance | Consequence if wrong |
|---|---|---|
| Co-locate with most sources | Pick the region most of your resources live in | Cross-region egress + latency on ingest |
| Data residency / sovereignty | Region must satisfy the compliance boundary | Logs in the wrong jurisdiction; hard to fix |
| Region availability of features | A few Monitor features vary by region | A feature you need is unavailable |
| Permanence | Treat region as final | Re-homing = new workspace + migration |
There is no “move workspace to another region” operation. If you must change region, you create a new workspace in the target region, repoint every diagnostic setting, and accept that historical data stays in the old workspace until its retention expires. Decide carefully once.
Choosing the access control mode
This is the security decision people most often get wrong, because the wrong choice is invisible until someone reads logs they shouldn’t. The workspace access control mode has two values:
| Mode (API value) | Portal label | Who can query | Granularity | Use when |
|---|---|---|---|---|
resource-context |
“Use resource or workspace permissions” | Anyone with read on a resource can query that resource’s logs; workspace roles also work | Per resource | Default / recommended — least privilege |
workspace-context |
“Require workspace permissions” | Only users with a role on the workspace; they see all data | All-or-nothing | Central security/SOC workspace where readers are vetted and should see everything |
In resource-context mode, the access check is “does this user have read on this resource?” Granting a developer Reader on their App Service lets them open that app’s Logs blade and query its records — scoped to that resource — with no workspace role. They cannot see another team’s VM logs because they have no read on that VM. This is least-privilege observability: visibility follows resource ownership.
In workspace-context mode, the only way to query is a role on the workspace (such as Log Analytics Reader), and that role sees every table — sign-in logs, security events, all workloads. That fits a dedicated security/SOC workspace whose readers are vetted analysts who should see everything, but it is the wrong default for a shared platform workspace because one broad grant leaks everyone’s data.
One subtlety: some sensitive tables (certain Microsoft Entra and security tables) are not exposed through resource-context and require an explicit workspace role regardless of mode. Resource-context governs the resource-scoped tables that make up the bulk of operational telemetry. The takeaway is unchanged: start in resource-context and grant workspace roles only to the few who need cross-resource visibility.
Setting retention and archive
Retention is two dials, and conflating them overpays. Interactive retention is how long data stays fully queryable with KQL; archive is a cheaper tier for data you must keep but rarely touch, which you restore or search on demand when needed.
| Setting | Range / default | Billed | When to change |
|---|---|---|---|
| Interactive retention (workspace default) | 30–730 days; first 31 days free | Per GB-month beyond 31 days | Match your routine investigation window |
| Per-table retention override | Set on individual tables | Same model, per table | Keep one chatty table short, one audit table long |
| Archive | Up to total of several years | Cheaper per GB-month than interactive | Compliance retention you seldom query |
| Total retention | Interactive + archive combined | Sum of both | The full lifespan of a record |
The free 31 days of interactive retention covers most operational needs — incident investigation usually looks at the last few days. Pay for longer interactive retention only on tables you query far back; push long-tail compliance data to archive, a fraction of interactive per GB-month. Per-table retention lets you keep a high-volume, low-value table (verbose container stdout) at the minimum while keeping an audit table for years.
A second lever, beyond a first workspace: a daily cap limits GB ingested per day, stopping a runaway diagnostic setting from blowing the budget — at the cost of dropping data once the cap is hit. For a first workspace, leave it off and rely on cost alerts; enable it later if the misconfiguration risk is real.
Naming, resource group and tags
A workspace is an ordinary Azure resource: it lives in a resource group and follows your naming and tagging standards. A clear convention pays off when you have several — log-<scope>-<env>-<region> reads well (e.g. log-platform-prod-eastus). Tags such as env, owner, and costCenter let you attribute the ingestion bill to a team. The budget patterns in Set Up Azure Budgets: Threshold Alerts to Email, Action Groups, and Automation pair well with watching workspace spend.
| Element | Recommendation | Why |
|---|---|---|
| Name | log-<scope>-<env>-<region>, 4–63 chars |
Self-describing; sortable |
| Resource group | A platform/monitoring RG, not per-app | Workspace outlives individual apps |
| Tags | env, owner, costCenter |
Attribute the ingestion bill |
Architecture at a glance
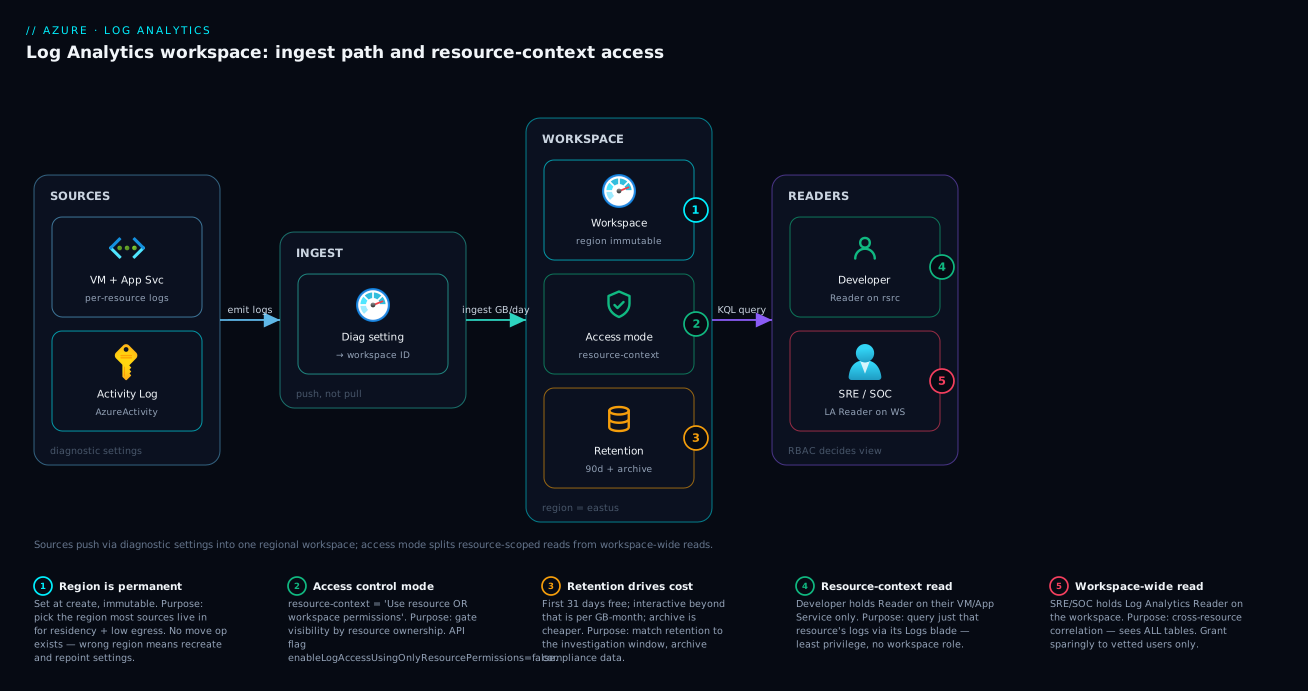
The path is short but every hop matters. On the left, your source resources — a VM, an App Service, the subscription’s Activity Log — each carry a diagnostic setting naming the destination. That setting pushes the resource’s logs into the Log Analytics workspace in your chosen region, where they land in typed tables. On the right, two readers consume that data differently: a developer with only Reader on their own resource opens that resource’s Logs blade and, because the workspace is in resource-context mode, queries just that resource’s records; a platform/SOC reader holds Log Analytics Reader on the workspace and queries all tables. The access control mode is the gate deciding which view a person gets.
Follow the numbered badges: badge 1 marks the immutable region choice on the workspace, badge 2 the access control mode that splits resource-scoped from workspace-wide reads, badge 3 the retention/archive dial that drives cost, badge 4 the resource-context path that grants a developer least-privilege visibility, and badge 5 the workspace-role path for cross-resource readers.
Real-world scenario
Northwind Retail runs a customer-facing storefront on App Service plus a fleet of VMs for batch jobs, all in East US, across two subscriptions: sub-prod and sub-shared. Their first attempt at logging was the kind everyone makes. An engineer created a workspace named loganalytics1 in West Europe (it was the default the portal happened to offer that day), accepted the legacy workspace-context mode without reading the tooltip, set no retention override, and to “let the dev team see logs” granted the four lead developers Log Analytics Reader at the subscription scope.
Three problems surfaced over the next quarter. First, every diagnostic setting from East US resources shipped data across the Atlantic to West Europe, adding latency and a real cross-region egress line — and because the storefront handled EU and US customer data, legal flagged that operational logs now resided in the wrong region. Second, with workspace-context mode plus subscription-scoped Reader, those four developers could query everything, including the SigninLogs and Key Vault audit events the security team assumed were private. Third, with default retention on a chatty container-stdout table, ingestion crept up and the monthly logging cost roughly doubled before anyone noticed — no one had tagged the workspace to attribute the spend.
The fix was a clean rebuild, not a patch. The platform team created log-platform-prod-eastus in East US, in a dedicated rg-monitoring group, in resource-context mode, tagged env=prod, owner=platform, costCenter=cc-1042. They set interactive retention to 90 days for the investigation window, applied a 30-day per-table retention on the verbose stdout table, and pushed older audit data to archive. Crucially, they removed the four subscription-scoped Log Analytics Reader grants. Developers now read their own app and VM logs through each resource’s Logs blade — their existing Reader is enough in resource-context mode — and only two SRE leads who need cross-resource correlation hold Log Analytics Reader on the workspace. The security team’s sensitive tables are no longer visible to app developers. They left the old West Europe workspace until its retention expired, repointing all new settings to East US. Net result: lower egress, correct residency, least-privilege access, and an attributable bill.
Advantages and disadvantages
A single, well-designed workspace is the right model for most teams, but it has trade-offs worth naming.
| Advantages | Disadvantages |
|---|---|
| One place to query across many sources with KQL | Region is immutable — wrong choice is costly to fix |
| Resource-context mode gives least-privilege reads for free | Access mode is subtle; easy to misconfigure and leak data |
| Granular retention/archive controls cost precisely | Cost can creep silently if ingestion isn’t watched |
| Standard Azure RBAC and tagging apply | Coarse built-in roles; fine scoping relies on resource-context |
| Cross-region, cross-subscription ingestion is possible | Cross-region ingest adds egress + latency |
| 31 days retention + a daily free GB allowance included | Verbose sources blow past free tiers quickly |
The single-workspace model shines when resources cluster in one or two regions and you want one query surface. It strains under strict residency across many regions (favoring a workspace per region) or a hard split between operational and security logs (favoring a dedicated SOC workspace in workspace-context mode alongside the operational one). The decision is about residency boundaries and who must see what — not volume, which a single workspace handles fine.
Hands-on lab
This is the core of the guide. You create one workspace three ways (portal, az CLI, Bicep), send a resource’s diagnostic data to it, prove ingestion with a KQL query, grant resource-context read access to a teammate, then tear everything down. The lab is free-tier friendly: a workspace has no fixed hourly charge — you pay only for data ingested and retained, and the trickle of Activity data here stays within free allowances. Total cost if torn down within the hour: effectively zero.
Prerequisites for the lab
| Requirement | How to check |
|---|---|
| Azure subscription, Contributor+ | az account show returns your subscription |
| Owner or User Access Administrator (for the RBAC step) | You can run az role assignment create |
Cloud Shell or local az ≥ 2.50 |
az version |
| A second user/principal object ID (for the grant) | az ad user list or use your own object ID |
Set shared variables first (Bash, in Cloud Shell):
LOCATION=eastus
RG=rg-monitoring-lab
WS=log-lab-$RANDOM            # globally unique-ish within your sub
az group create --name "$RG" --location "$LOCATION" -o table
Expected output: a table showing the resource group rg-monitoring-lab with provisioningState Succeeded.
Part A — Create the workspace in the Azure portal
Do this once to see the parameters in the UI, then use CLI/Bicep for automation.
| Step | Action | What to enter / expect |
|---|---|---|
| 1 | Portal → search Log Analytics workspaces → Create | The Create blade opens |
| 2 | Subscription + Resource group | Pick your sub; select rg-monitoring-lab |
| 3 | Name | log-lab-portal |
| 4 | Region | East US — note the tooltip: this is permanent |
| 5 | Pricing tier (Pricing tier tab) | Leave Pay-as-you-go (Per GB 2018) — the standard tier |
| 6 | Tags tab | env=lab, owner=you |
| 7 | Review + create → Create | Deployment succeeds in ~30–60s |
| 8 | Open the workspace → Properties | Note the Workspace ID (a GUID); confirm Access control mode = “Use resource or workspace permissions” |
If step 8 shows “Require workspace permissions,” switch it to “Use resource or workspace permissions” and save. New workspaces default to resource-context, but always verify.
Part B — Create the same workspace with az CLI
This is the repeatable path. One command creates the workspace; flags set retention and SKU:
az monitor log-analytics workspace create \
  --resource-group "$RG" \
  --workspace-name "$WS" \
  --location "$LOCATION" \
  --retention-time 90 \
  --sku PerGB2018 \
  --tags env=lab owner=you \
  -o table
Expected output: a table with your workspace name, provisioningState Succeeded, retentionInDays 90. Capture the resource ID for later steps:
WS_ID=$(az monitor log-analytics workspace show \
  --resource-group "$RG" --workspace-name "$WS" --query id -o tsv)
echo "$WS_ID"
Expected: a resource ID ending in /workspaces/log-lab-<random>.
Now set the access control mode to resource-context explicitly (it is the default, but make it intentional):
WS_GUID=$(az monitor log-analytics workspace show \
  --resource-group "$RG" --workspace-name "$WS" --query customerId -o tsv)

# Access control mode is a workspace 'features' property
az resource update --ids "$WS_ID" \
  --set properties.features.enableLogAccessUsingOnlyResourcePermissions=false \
  -o none
The flag reads backwards from the portal label, so read it carefully: enableLogAccessUsingOnlyResourcePermissions=false means “do NOT require only resource permissions” — i.e. “Use resource OR workspace permissions” (resource-context). Setting it true forces workspace-context. The table makes the mapping unambiguous:
| You want | Portal label | API flag value |
|---|---|---|
| Resource-context (default, recommended) | Use resource or workspace permissions | enableLogAccessUsingOnlyResourcePermissions = false |
| Workspace-context | Require workspace permissions | enableLogAccessUsingOnlyResourcePermissions = true |
Part C — Send a resource’s diagnostic data to the workspace
A brand-new workspace is empty; you need a source. The cheapest one that proves the pipe works is the subscription Activity Log — it costs nothing extra to send and produces the AzureActivity table within minutes.
SUB_ID=$(az account show --query id -o tsv)
az monitor diagnostic-settings subscription create \
  --name "to-loganalytics-lab" \
  --location "$LOCATION" \
  --workspace "$WS_ID" \
  --logs '[{"category":"Administrative","enabled":true},{"category":"Security","enabled":true}]' \
  -o table
Expected output: a table confirming the subscription diagnostic setting to-loganalytics-lab with the two categories enabled. (If your az version uses a different --logs shape, the portal path is Subscription → Activity log → Export Activity Logs → Add diagnostic setting → your workspace.) To generate a guaranteed AzureActivity row right away, do any small control-plane action — e.g. az group update --name "$RG" --set tags.touched=1 -o none.
Part D — Validate ingestion with a KQL query
Wait 3–8 minutes for the first records to land (Activity Log ingestion is near-real-time but not instant). Then query the workspace by its GUID:
az monitor log-analytics query \
  --workspace "$WS_GUID" \
  --analytics-query "AzureActivity | where TimeGenerated > ago(30m) | summarize events=count() by OperationNameValue | top 10 by events desc" \
  -o table
Expected output: a table of recent operations with counts (including the resource-group update you just ran). If it returns no rows, the data hasn’t landed yet — wait a few minutes and rerun; ingestion latency, not misconfiguration, is the usual cause on a fresh setting.
A second query confirms the workspace is healthy and lists which tables already have data:
az monitor log-analytics query \
  --workspace "$WS_GUID" \
  --analytics-query "search * | where TimeGenerated > ago(1h) | summarize rows=count() by \$table | sort by rows desc" \
  -o table
Expected: at least AzureActivity (and possibly Operation) with non-zero row counts.
Part E — Grant resource-context read access to a teammate
Now prove least-privilege visibility. The goal: a teammate reads logs for a specific resource without any workspace role. Because the workspace is in resource-context mode, granting them Reader on the resource is enough to query that resource’s logs via its own Logs blade.
First, get the teammate’s object ID (or use your own to test):
ASSIGNEE_OID=$(az ad signed-in-user show --query id -o tsv) # or a teammate's OID
Grant Reader on the resource group holding the lab resources (so the assignee can read those resources and, in resource-context mode, their logs):
az role assignment create \
  --assignee-object-id "$ASSIGNEE_OID" \
  --assignee-principal-type User \
  --role "Reader" \
  --scope "/subscriptions/$SUB_ID/resourceGroups/$RG" \
  -o table
Expected output: a table confirming the Reader role assignment scoped to rg-monitoring-lab.
Contrast with the workspace-wide grant you would use only for an SRE/SOC reader who must query all tables across resources:
# Cross-resource reader (use sparingly): full read on the workspace's data
az role assignment create \
  --assignee-object-id "$ASSIGNEE_OID" \
  --assignee-principal-type User \
  --role "Log Analytics Reader" \
  --scope "$WS_ID" \
  -o table
The difference is the whole point of the access model:
| Grant | Scope | What the user can query | Use for |
|---|---|---|---|
| Reader (or app/VM-specific role) | A resource or resource group | Only that resource’s logs, via its Logs blade (resource-context) | App/VM owners — least privilege |
| Log Analytics Reader | The workspace | All tables in the workspace | SRE/SOC who need cross-resource correlation |
For the lab, keep only the resource-scoped Reader grant; remove the workspace grant if you created it, leaving the least-privilege model intact:
az role assignment delete \
  --assignee "$ASSIGNEE_OID" --role "Log Analytics Reader" --scope "$WS_ID"
Part F — Teardown
Delete the resource group (removes the workspace and the resource-scoped role assignment), then the subscription diagnostic setting (it lives at subscription scope, outside the RG):
az monitor diagnostic-settings subscription delete \
  --name "to-loganalytics-lab" --yes

az group delete --name "$RG" --yes --no-wait
Expected: the diagnostic setting deletes immediately; the resource-group deletion proceeds in the background. Confirm with az group exists --name "$RG" returning false after a minute.
Soft-delete note: a deleted Log Analytics workspace is recoverable for 14 days by default (soft delete), and the name stays reserved during that window. To recreate immediately with the same name, recover it instead of creating a new one, or use a different name.
Part G — The same workspace as Bicep
For real environments, define the workspace as code so it is repeatable and reviewable. This template builds it with 90-day retention, resource-context mode, and tags:
@description('Workspace name')
param workspaceName string

@description('Region — immutable after creation')
param location string = resourceGroup().location

@description('Interactive retention in days (30–730; first 31 free)')
@minValue(30)
@maxValue(730)
param retentionInDays int = 90

resource workspace 'Microsoft.OperationalInsights/workspaces@2023-09-01' = {
  name: workspaceName
  location: location
  tags: {
    env: 'lab'
    owner: 'platform'
  }
  properties: {
    sku: {
      name: 'PerGB2018'
    }
    retentionInDays: retentionInDays
    features: {
      // false => "Use resource OR workspace permissions" (resource-context)
      enableLogAccessUsingOnlyResourcePermissions: false
    }
  }
}

output workspaceId string = workspace.id
output customerId string = workspace.properties.customerId
Deploy and validate it:
az deployment group create \
  --resource-group "$RG" \
  --template-file workspace.bicep \
  --parameters workspaceName="log-lab-bicep" \
  -o table
Expected output: a deployment table with provisioningState Succeeded and the two outputs (workspaceId, customerId). You have now built the identical workspace declaratively — the form you commit to a repo and deploy through a pipeline.
Common mistakes & troubleshooting
The failures below are the ones that actually bite when you first stand up a workspace. Each row gives the symptom, the real cause, how to confirm it, and the fix.
| # | Symptom | Root cause | Confirm with | Fix |
|---|---|---|---|---|
| 1 | Logs land in the wrong region / residency flag | Picked the portal’s default region, not your sources’ | Workspace Overview shows the region | No move op — recreate in the right region, repoint settings |
| 2 | A developer can read everyone’s logs | workspace-context mode + broad workspace role |
Properties → Access control mode; check role assignments | Switch to resource-context; remove broad workspace grants |
| 3 | A developer can’t see their own app’s logs | Resource-context mode but user lacks read on the resource | az role assignment list --assignee <oid> --scope <resource> |
Grant Reader on their resource/RG |
| 4 | KQL query returns no rows right after setup | Ingestion latency on a brand-new diagnostic setting | Re-run after 5–10 min; check the setting exists | Wait; verify the diagnostic setting targets this workspace |
| 5 | Monthly logging bill creeps up | Verbose source + long default retention | Usage | summarize sum(Quantity) by DataType (KQL) |
Per-table retention; archive; trim noisy categories |
| 6 | “Workspace name already exists / reserved” on create | Soft-deleted workspace holding the name (14-day window) | az monitor log-analytics workspace list --query "[?name=='<name>']" |
Recover the soft-deleted workspace, or use a new name |
| 7 | Diagnostic setting won’t save / “destination not found” | Workspace in a region/sub the source can’t target, or wrong ID | Compare source region & the --workspace resource ID |
Use the full workspace resource ID; co-locate where possible |
| 8 | Sensitive tables (e.g. SigninLogs) invisible to an analyst |
Those tables need a workspace role even in resource-context | Try query as that user; check workspace role assignments | Grant Log Analytics Reader on the workspace to vetted analysts |
| 9 | az monitor log-analytics query errors on workspace ID |
Passed the resource ID, not the customerId GUID | --workspace expects the GUID (customerId) |
Use the customerId value, not the /subscriptions/.../workspaces/... ID |
| 10 | Data unexpectedly dropped at midday | Daily cap reached | Workspace → Usage and estimated costs → daily cap | Raise/remove the cap; fix the runaway source |
Best practices
- Co-locate the workspace with most of its sources and treat the region as final; decide it deliberately because there is no move operation.
- Default to
resource-contextaccess mode; reserveworkspace-contextfor a dedicated, vetted security/SOC workspace. - Grant workspace roles sparingly. Most readers should reach their logs through resource RBAC, not a Log Analytics Reader role on the whole workspace.
- Set retention intentionally, not by default. Match interactive retention to your investigation window; push compliance data to archive.
- Override retention per table for noisy, low-value tables (verbose stdout) versus long-lived audit tables.
- Tag the workspace with
env,owner,costCenterso ingestion cost is attributable. - Watch ingestion with KQL (
Usagetable) and a cost alert; logging spend creeps quietly. - Use the full workspace resource ID when wiring diagnostic settings, and the
customerIdGUID when running queries — they are different identifiers. - Define the workspace as code (Bicep/Terraform) so region, retention, and access mode are reviewed and reproducible.
- Plan one workspace per region (or a few regional hubs) rather than one global workspace when residency or egress matters.
Security notes
The workspace is a high-value target: it holds sign-in events, audit trails, and potentially sensitive payloads from app logs. Treat access to it as you would access to a database of secrets.
- Least privilege via resource-context. A developer reads their own app’s logs because they hold Reader on the app, not a workspace-wide role.
- Restrict the powerful roles. Log Analytics Contributor changes settings/retention and reads all data — limit to platform owners. Log Analytics Reader sees all tables — limit to SRE/SOC.
- Know which tables bypass resource-context. Certain Entra/security tables need an explicit workspace role; don’t assume resource-context hides everything.
- Encryption. Data is encrypted at rest by default with Microsoft-managed keys; customer-managed keys (CMK) are available if compliance requires control of the key.
- Audit the auditors. Periodically review workspace role holders (
az role assignment list --scope <workspace-id>); a stale subscription-scoped Log Analytics Reader is the classic leak. - Govern destinations. With a central workspace, use Azure Policy to require diagnostic settings point at it — the Azure Policy Effects Decoded: Deny vs Audit vs Modify vs DeployIfNotExists (DeployIfNotExists) effect enforces this at scale.
Cost & sizing
A workspace has no fixed hourly charge. You pay for two things: data ingested (per GB, Pay-as-you-go / Per GB 2018) and retention beyond the free window. Sizing is therefore an estimate of GB/day and how long to keep it.
| Cost lever | What drives it | How to control |
|---|---|---|
| Ingestion (GB/day) | Number/verbosity of sources | Trim categories; sample; drop noisy logs |
| Interactive retention | Days beyond the free 31 | Shorten default; per-table overrides |
| Archive | Long-term compliance data | Move rarely queried tables to archive |
| Commitment tiers | Sustained high volume | Buy a daily capacity reservation for a discount |
| Daily cap | Runaway sources | Cap GB/day (drops data once hit) |
Rough figures (Pay-as-you-go; check current regional pricing): ingestion runs on the order of a few USD per GB (roughly ₹200–₹260/GB), with the first ~5 GB/day and the first 31 days of retention free. A small workload under 5 GB/day querying only the last month runs at or near zero. A chatty environment at 50 GB/day (~$2.30/GB) is on the order of $115/day (~₹9,600/day) before retention — which is why per-table retention, sampling, and a daily cap matter. At sustained high volume a commitment (capacity reservation) tier discounts the per-GB rate. The lab here ingests a trickle of Activity Log data and, torn down within the hour, costs effectively nothing.
To see your own number once data flows, run the Usage query:
Usage
| where TimeGenerated > ago(7d)
| summarize GB = sum(Quantity) / 1000 by bin(TimeGenerated, 1d), DataType
| sort by TimeGenerated desc
That breaks ingestion down by day and table, telling you which source to trim first.
Interview & exam questions
1. Can you change a Log Analytics workspace’s region after creation? No. The region is immutable. To change it you create a new workspace in the target region and repoint all diagnostic settings; historical data stays in the old workspace until its retention expires or is exported. (Relevant to AZ-104 / AZ-500 monitoring topics.)
2. What is the difference between resource-context and workspace-context access modes? In resource-context, a user with read access to a resource can query that resource’s logs via its own Logs blade, with no workspace role. In workspace-context, only roles on the workspace grant query access, and those see all tables. Resource-context gives least privilege; workspace-context is all-or-nothing.
3. A developer needs to read only their App Service’s logs. What do you grant? With the workspace in resource-context mode, grant the developer Reader (or an app-specific read role) on the App Service. No workspace role is needed; they query that resource’s logs through its Logs blade.
4. What does Log Analytics Reader allow, and the risk of granting it broadly? It reads all data and runs queries across every table in the workspace. Granting it at subscription scope (or on the workspace) lets that user read everyone’s logs, including security tables — a common data-leak misconfiguration.
5. How is a Log Analytics workspace billed? By data ingested (per GB) and by retention beyond the free window. There is no fixed hourly charge. The first ~5 GB/day and the first 31 days of retention are free; longer interactive retention and archive add per-GB-month cost.
6. What is the difference between interactive retention and archive? Interactive retention keeps data fully queryable with KQL; archive is a cheaper tier for data you keep but rarely query, which you restore or search on demand. Total retention is the two combined.
7. You created a diagnostic setting but a KQL query returns no rows. First thing to check? Ingestion latency on a fresh setting — wait several minutes and rerun. Then confirm the diagnostic setting actually targets this workspace’s resource ID and that the source is producing the category you enabled.
8. Why does az monitor log-analytics query sometimes reject the workspace ID?
The --workspace flag for queries expects the workspace’s customerId GUID, not the /subscriptions/.../workspaces/... resource ID. Creation and RBAC use the resource ID; querying uses the GUID.
9. How do you stop a runaway diagnostic setting from blowing the budget? Set a daily cap (limits GB/day, dropping data once hit) and/or trim noisy categories and shorten per-table retention. A cost alert on the workspace’s spend is the early warning.
10. You try to recreate a workspace and the name is “reserved.” Why? A soft-deleted workspace holds its name for 14 days. Recover the soft-deleted workspace to reuse it immediately, or choose a different name.
11. Where should a central platform workspace live in the resource hierarchy? In a dedicated monitoring resource group (not a per-app RG), in the region most sources use, governed so diagnostic settings across subscriptions point at it — often enforced with Azure Policy.
12. Do all tables respect resource-context mode? No. Some sensitive tables (certain Entra/security tables) need an explicit workspace role regardless of mode. Resource-context governs the resource-scoped operational tables that make up most telemetry.
Quick check
- Is a workspace’s region changeable after creation?
- Which access control mode lets a resource owner query their resource’s logs without a workspace role?
- How many days of retention are free?
- Which identifier does
az monitor log-analytics query --workspaceexpect — the resource ID or thecustomerIdGUID? - Which built-in role lets a user read all tables in a workspace?
Answers
- No — it is immutable; you must recreate in a new region and repoint settings.
resource-context(“Use resource or workspace permissions”).- The first 31 days of interactive retention (plus a free daily ingestion allowance of about 5 GB/day).
- The
customerIdGUID — not the resource ID. - Log Analytics Reader.
Glossary
- Log Analytics workspace — A regional store of log tables, queried with KQL; the destination for Azure Monitor logs.
- Azure Monitor — The umbrella service for metrics, logs, alerts and dashboards; the workspace is its log store.
- KQL (Kusto Query Language) — The read-only query language used to search and aggregate workspace data.
- Table — A typed collection of records in the workspace (e.g.
Heartbeat,AzureActivity,AppRequests). - Diagnostic setting — A rule on a resource that sends its logs/metrics to a destination such as a workspace.
- Ingestion — The volume of data (GB/day) written into the workspace; a primary cost driver.
- Interactive retention — How long data stays fully queryable with KQL; first 31 days free.
- Archive — A cheaper tier for data kept long-term but rarely queried; restored/searched on demand.
- Access control mode — Workspace property:
resource-context(per-resource visibility) orworkspace-context(workspace-wide). - Resource-context — Querying a resource’s logs through its own Logs blade, gated by resource RBAC.
- Log Analytics Reader — Built-in role that can read all data and run queries across the workspace.
- customerId — The workspace GUID used by the query API (
--workspace), distinct from the resource ID. - Daily cap — A GB/day ingestion limit that protects the budget by dropping data once reached.
Next steps
- Azure Monitor and Application Insights: Full-Stack Observability — fill this workspace with app telemetry and build alerts and dashboards on top of it.
- Azure Resource Hierarchy Explained: Subscriptions, Resource Groups and Resources — the RBAC scopes that resource-context access relies on.
- Azure Policy Effects Decoded: Deny vs Audit vs Modify vs DeployIfNotExists — enforce that every resource’s diagnostic settings point at your central workspace.
- Set Up Azure Budgets: Threshold Alerts to Email, Action Groups, and Automation — put a guardrail on ingestion spend before it surprises you.
- Deploy Your First Bicep File From Scratch — go deeper on the IaC toolchain you used in Part G.