You shipped the app. It works on your laptop, it works in the demo, and then a customer says “the checkout page is slow sometimes” and you have nothing — no number, no trace, no idea which of the six downstream calls is the culprit. Logging Console.WriteLine to stdout is not observability; it is archaeology. What you want is to ask a running production system why a request was slow or where it threw, and get an answer in seconds. That is what Application Insights gives you — the application-performance-monitoring (APM) arm of Azure Monitor — and the modern, vendor-neutral way to feed it is OpenTelemetry (OTel), the CNCF standard for emitting traces, metrics and logs from your code.
This guide wires the two together end to end. You will instrument a real web app so that every incoming request becomes a distributed trace, every outbound call to SQL or another service becomes a dependency span on that same trace, exceptions attach to the span that threw, and custom metrics and structured logs flow to the same backend — all correlated by a shared trace ID you can paste into the portal and watch the whole request light up across services. The instrumentation is done through the Azure Monitor OpenTelemetry Distro, a one-line bootstrap that configures the OTel SDK with the Azure exporter, so you write standard OTel code and it lands in Application Insights with zero proprietary lock-in at the call sites.
By the end you will have done the real thing — created the resource, set the connection string, added auto-instrumentation, emitted a custom span and metric, run load through it, and confirmed in Transaction search, the Application map, Live Metrics and a KQL query that the data is flowing and correlated. You will do it three ways: click-by-click in the portal, command-by-command with the az CLI, and declaratively in Bicep for CI/CD. The option matrices, sampling controls, cost levers and failure-mode playbook sit as scannable tables alongside the code, because the gap between “telemetry appears” and “telemetry appears, correctly correlated, at a cost you can afford” is exactly the set of settings most teams get wrong the first time.
What problem this solves
Without instrumentation, a production incident is a guessing game. The page is slow — is it the app, the database, a third-party API, a cold start, garbage collection? You restart things, add a log line and redeploy (twenty minutes gone), stare at CPU graphs that look fine. The information you need — this request spent 3.1 seconds waiting on the inventory service, which timed out twice and retried — exists in principle but was never captured, so it is gone the moment the request completes.
Instrumentation captures it as it happens, structured and queryable. A trace records the end-to-end journey of one request as a tree of spans (one per unit of work: the HTTP request, each DB call, each outbound call), each with a duration, status and attributes. Metrics record aggregate numbers over time (requests/sec, p95 latency, a custom counter like orders-placed). Logs record discrete structured events, correlated to the trace that produced them. Application Insights ingests all three and gives you the views that turn them into answers: Transaction search (find the slow/failed request, expand its trace), the Application map (every dependency and its failure rate as a graph), the Failures and Performance blades, Live Metrics (a real-time firehose for deploys), and the full Logs (KQL) surface.
Who needs this: every team running a web app, API or microservice in production, and it is non-negotiable for distributed systems — the moment a request crosses a service boundary, only distributed tracing can tell you which hop is at fault. The reason to choose OpenTelemetry over the legacy Application Insights SDK is portability and breadth: OTel is the industry standard, instruments most popular libraries automatically, and keeps your instrumentation code unmarried to Azure — add a second backend (Grafana, Jaeger, Datadog) and you change the exporter, not your code. The trade-off is a specific Azure bootstrap and a few feature gaps versus the classic SDK; getting the connection string, sampling and correlation right is the whole job.
To frame the field before the deep dive, here is what each telemetry signal is, where you see it, and the first question it answers:
| Signal | What it records | Where you see it in App Insights | First question it answers |
|---|---|---|---|
| Trace (request + spans) | End-to-end journey of one request as a span tree | Transaction search, Application map | Where did this request spend its time / fail? |
| Dependency span | One outbound call (SQL, HTTP, queue) within a trace | The trace’s timeline; Application map edges | Which downstream is slow or erroring? |
| Metric | Aggregate number over time (rate, percentile, counter) | Metrics explorer, dashboards, Live Metrics | How much / how often across all requests? |
| Log / trace message | Discrete structured event, correlated to a trace | Logs (KQL), the trace’s “all telemetry” view | What happened at this exact moment, with context? |
| Exception | A thrown error, attached to its span | Failures blade, the failing trace | What threw, and on which request? |
Learning objectives
By the end of this article you can:
- Explain how Application Insights, Azure Monitor and OpenTelemetry fit together, and why the Azure Monitor OpenTelemetry Distro is the recommended path over the classic SDK and the codeless agent.
- Create an Application Insights resource (workspace-based) in the portal, with
az, and in Bicep, and retrieve its connection string the right way. - Add OTel auto-instrumentation to a .NET (and conceptually Node.js/Python/Java) web app so incoming requests, outbound HTTP and SQL calls are traced automatically with no per-call code.
- Emit a custom span, a custom metric, and a correlated structured log using the standard OTel APIs, and find each in the portal.
- Read a distributed trace across two services in Transaction search and the Application map, and confirm correlation via the shared
operation_Id. - Configure sampling (fixed-rate and the SDK’s rate limiter), set the Cloud Role Name, and reason about what each does to fidelity and cost.
- Validate the whole pipeline end to end (Live Metrics, KQL count, the trace tree) and diagnose the common “no data” failures with the exact command or portal path to confirm each.
Prerequisites & where this fits
You should have an Azure subscription with rights to create resources, the az CLI (via az login, or use Cloud Shell), and a web app you can run and redeploy. The examples use ASP.NET Core because the OTel story there is the most mature, but the concepts (a distro, a connection string, auto-instrumentation, custom signals) map directly to Node.js, Python and Java, with a per-language table included. Familiarity with HTTP and reading JSON output helps; no prior Application Insights experience is needed.
This sits in the Observability track. The data platform underneath — metrics, logs and traces as first-class Azure Monitor concepts, and the Log Analytics workspace that stores it all — is covered in Azure Monitor & Application Insights for Observability and Create and Design a Log Analytics Workspace with RBAC; this article is the hands-on “instrument the code” companion to those. The querying you will do at the end is the subject of KQL for Log Analytics: summarize, join & time-series. And the payoff — using this telemetry to localise a production 5xx to a specific hop — is the entire premise of Troubleshooting Azure App Service: 502/503, Cold Starts & Restart Loops, where Application Insights is the single most useful tool.
Here is the layered picture of what you are about to assemble, so the moving parts have a home before we define them:
| Layer | Component | What it does | You configure it via |
|---|---|---|---|
| Your code | OpenTelemetry SDK + Azure Monitor Distro | Generates traces/metrics/logs; exports to Azure | NuGet/npm/pip package + one bootstrap call |
| Auto-instrumentation | OTel instrumentation libraries | Wraps ASP.NET Core, HttpClient, SQL automatically | Included in the distro / added per library |
| Identity of the app | Cloud Role Name + connection string | Names the app on the map; routes data to the resource | OTEL_SERVICE_NAME / env var / Bicep |
| Ingestion | Application Insights resource | The APM endpoint that receives and indexes telemetry | Portal / az monitor app-insights / Bicep |
| Storage | Log Analytics workspace | Where workspace-based App Insights actually stores data | Linked at create time |
| Analysis | Portal blades + KQL | Transaction search, App map, Live Metrics, Logs | The Azure portal / az monitor queries |
Core concepts
Six mental models make every later step obvious.
Application Insights is the backend; OpenTelemetry is how your code talks to it. Application Insights is an Azure resource — an APM service that ingests, stores and visualises application telemetry. OpenTelemetry is a vendor-neutral SDK and wire format your application uses to produce telemetry. They meet at an exporter: the OTel SDK in your process collects spans/metrics/logs and an Azure Monitor exporter ships them to the Application Insights resource identified by your connection string. You write standard OTel; the exporter handles the Azure-specific delivery.
The Distro is a curated bundle that wires OTel for Azure in one line. The Azure Monitor OpenTelemetry Distro (Azure.Monitor.OpenTelemetry.AspNetCore for .NET, @azure/monitor-opentelemetry for Node.js, azure-monitor-opentelemetry for Python) is a single package that pulls in the OTel SDK, the right auto-instrumentation libraries, and the Azure exporter, and exposes one bootstrap call (builder.Services.AddOpenTelemetry().UseAzureMonitor() in .NET). It is the recommended, supported path. You can assemble raw OTel plus the bare Azure.Monitor.OpenTelemetry.Exporter yourself for more control, but the distro is the default for a reason.
A trace is a tree of spans sharing one trace ID. When a request arrives, the SDK starts a root span (the request) and assigns a trace ID (in App Insights this surfaces as operation_Id). Every unit of work inside — a SQL query, an outbound HTTP call, a custom block you wrap — is a child span carrying the same trace ID and a parent-span reference. The SDK propagates that context across service boundaries via the W3C Trace Context traceparent HTTP header, so a call from service A to service B continues the same trace. That shared ID is what lets Transaction search reconstruct the whole journey and what you confirm correlation with.
Auto-instrumentation covers the common libraries for free. You do not hand-write a span for every HTTP or DB call. The distro registers instrumentation libraries that hook well-known frameworks — ASP.NET Core (incoming requests), HttpClient (outbound HTTP), SqlClient (database), and more — and emit spans automatically. You only write manual instrumentation for your business operations (a custom span around “reconcile invoice”, a counter for “orders placed”) that no library knows about.
The connection string is the routing address — not the old instrumentation key. Telemetry reaches the right resource via the connection string (InstrumentationKey=…;IngestionEndpoint=…;LiveEndpoint=…). The bare instrumentation key alone is deprecated for new work because it lacks the region-specific endpoints the connection string carries. Set it as the APPLICATIONINSIGHTS_CONNECTION_STRING environment variable (the distro reads it automatically) rather than hardcoding it.
Sampling is the cost dial, and it must be head-based to stay correlated. At high traffic you do not keep every trace — you sample. The distro uses fixed-rate, head-based sampling: a sampling decision is made once at the root and propagated to all child spans, so you keep or drop entire traces, never half a trace. Setting the sampling ratio is the single biggest lever on your ingestion bill, traded against how many traces you can inspect. (App Insights also has server-side adaptive sampling for the classic SDK; with OTel you control the rate in the distro.)
The vocabulary in one table
Pin down every moving part before the deep sections; the glossary repeats these for lookup.
| Term | One-line definition | Where it lives | Why it matters |
|---|---|---|---|
| Application Insights | The APM resource that ingests/visualises telemetry | Azure subscription / RG | The backend everything ships to |
| Azure Monitor | The umbrella metrics/logs/alerting platform | Azure | App Insights is its APM component |
| OpenTelemetry (OTel) | Vendor-neutral SDK + format for telemetry | Your process | How your code produces telemetry |
| Distro | Curated bundle wiring OTel for Azure | NuGet/npm/pip | One-line bootstrap; the supported path |
| Connection string | Routing address (key + endpoints) | App setting / env var | Sends data to the right resource/region |
Trace / operation_Id |
One request’s end-to-end span tree | Telemetry | Correlates everything for that request |
| Span | One timed unit of work in a trace | Telemetry | Request, dependency, or custom block |
| Dependency | A span for an outbound call (DB/HTTP/queue) | Telemetry | Shows which downstream is slow/failing |
| Cloud Role Name | The app’s name on the Application map | OTEL_SERVICE_NAME |
Distinguishes services in a multi-service map |
| Auto-instrumentation | Library hooks that emit spans for you | The distro | No code for common HTTP/SQL calls |
| Sampling | Keeping a fraction of traces | Distro config | The primary cost vs fidelity dial |
| Live Metrics | Real-time, unsampled telemetry stream | Portal | Watch a deploy as it happens |
Choosing your instrumentation approach
Before any code, decide how you instrument, because the three options have very different ergonomics and capability ceilings. This decision is the one most teams make by accident and regret later.
| Approach | What it is | Best for | Limitation |
|---|---|---|---|
| Codeless / auto-instrumentation agent | Enable App Insights on App Service/Functions with no code change | Existing apps you can’t rebuild; a quick first signal | Less control; no custom spans/metrics; language/runtime gaps |
| OpenTelemetry Distro (manual) | Add the distro package + one bootstrap call | New and existing apps; the recommended default | You edit and redeploy the app; small OTel-vs-classic feature gaps |
| Classic Application Insights SDK | The older Microsoft.ApplicationInsights SDK |
Legacy apps already on it; a few features OTel lacks | Azure-specific lock-in; not the future direction |
The guidance is straightforward: for new work, use the OpenTelemetry Distro. It is Microsoft’s recommended direction, it is portable, and it covers the overwhelming majority of needs. Reach for codeless only when you cannot touch the code and just want a baseline. Stay on the classic SDK only for an existing app that already uses it and depends on a feature OTel has not yet reached.
A few capability differences worth knowing before you commit, so a missing feature does not surprise you mid-project:
| Capability | OTel Distro | Classic SDK | Notes |
|---|---|---|---|
| Auto-trace ASP.NET Core / HttpClient / SQL | Yes | Yes | Both cover the common libraries |
| Custom spans / metrics / logs | Yes (standard OTel APIs) | Yes (TelemetryClient) |
OTel APIs are portable across backends |
Distributed trace via W3C traceparent |
Yes (default) | Yes | Both speak W3C Trace Context |
| Live Metrics | Yes | Yes | Real-time stream in both |
| Server-side adaptive sampling | No (use fixed-rate in the distro) | Yes | OTel uses head-based fixed-rate instead |
| Telemetry processors / initializers | Via OTel processors / ActivityEnrichment |
Yes (ITelemetryInitializer) |
Different API, similar power |
| Profiler / Snapshot Debugger | Limited | Yes | A reason some teams stay on classic |
| Vendor portability (export elsewhere) | Yes | No | The headline OTel advantage |
The language SDKs are at different maturity levels; pick the package that matches your stack and know what auto-instrumentation you get:
| Language | Distro package | Bootstrap entry point | Auto-instruments (highlights) |
|---|---|---|---|
| .NET (ASP.NET Core) | Azure.Monitor.OpenTelemetry.AspNetCore |
AddOpenTelemetry().UseAzureMonitor() |
ASP.NET Core, HttpClient, SqlClient |
| Node.js | @azure/monitor-opentelemetry |
useAzureMonitor() |
http, Express, MySQL, PostgreSQL, Redis |
| Python | azure-monitor-opentelemetry |
configure_azure_monitor() |
Django, Flask, FastAPI, requests, psycopg2 |
| Java | Application Insights Java agent (-javaagent) |
JVM flag, no code change | Servlet, JDBC, JMS, many libraries (codeless) |
Creating the Application Insights resource
Everything downstream needs the resource and its connection string first. The one decision that matters at create time is workspace-based vs classic: modern Application Insights stores its data in a Log Analytics workspace (workspace-based) — the default and the only sane choice, since classic standalone resources are retired for new creation. You either point at an existing workspace or create one alongside.
The create-time options and what each controls:
| Option | What it sets | Recommended | Why |
|---|---|---|---|
| Resource mode | Workspace-based vs classic | Workspace-based | Classic is retired; unifies storage with Log Analytics |
| Linked workspace | Which Log Analytics workspace stores data | A dedicated or shared one | Controls retention, RBAC, cross-resource KQL |
| Region | Where the ingestion endpoint lives | Same region as the app | Lower latency; data residency |
| Application type | A hint (web, other) |
web for web apps |
Minor; affects a few default views |
| Retention | How long data is kept (workspace setting) | 30–90 days typical | Cost vs how far back you can query |
| Daily cap | Max GB/day ingested (safety brake) | Set one in non-prod | Prevents a telemetry storm blowing the bill |
Portal
- In the portal, search Application Insights → Create.
- Choose the Subscription and Resource group (create
rg-otel-labif needed). - Name:
appi-otel-lab. Region: your app’s region (e.g. Central India). - Resource Mode: leave Workspace-based (default). Under Log Analytics Workspace, pick an existing one or click Create new →
log-otel-lab. - Review + create → Create. After deployment, open the resource — the Overview blade shows the Connection String at the top right. Copy it; you will set it on the app.
az CLI
The application-insights commands live in an extension; the CLI installs it on first use. Create the workspace, then the workspace-based App Insights component, then read the connection string:
RG=rg-otel-lab
LOC=centralindia
WS=log-otel-lab
APPI=appi-otel-lab

az group create -n $RG -l $LOC -o table

# 1) Log Analytics workspace (storage for workspace-based App Insights)
WS_ID=$(az monitor log-analytics workspace create \
  -g $RG -n $WS -l $LOC --query id -o tsv)

# 2) Workspace-based Application Insights component
az monitor app-insights component create \
  --app $APPI -g $RG -l $LOC \
  --application-type web \
  --workspace "$WS_ID" -o table

# 3) The value you actually need downstream — the connection string
az monitor app-insights component show \
  --app $APPI -g $RG \
  --query connectionString -o tsv
Expected output: the create command returns a JSON/table row with provisioningState: Succeeded, and the final command prints a string beginning InstrumentationKey=...;IngestionEndpoint=https://.... That string is the only credential the app needs.
Bicep
For CI/CD, declare the workspace and the component together so the link is explicit and reproducible:
@description('Region for all resources')
param location string = resourceGroup().location

resource workspace 'Microsoft.OperationalInsights/workspaces@2023-09-01' = {
  name: 'log-otel-lab'
  location: location
  properties: {
    sku: { name: 'PerGB2018' }
    retentionInDays: 30
  }
}

resource appInsights 'Microsoft.Insights/components@2020-02-02' = {
  name: 'appi-otel-lab'
  location: location
  kind: 'web'
  properties: {
    Application_Type: 'web'
    WorkspaceResourceId: workspace.id   // makes it workspace-based
    IngestionMode: 'LogAnalytics'
  }
}

// Surface the connection string as an output to feed into the app's settings
output connectionString string = appInsights.properties.ConnectionString
The WorkspaceResourceId property is what makes the component workspace-based; omit it and you get a (now-discouraged) classic resource. Never commit the resulting connection string to source — treat it as configuration, injected at deploy time.
Wiring the OpenTelemetry Distro into the app
With the resource live and its connection string in hand, instrument the app. For ASP.NET Core this is two steps: add the package, add one bootstrap line. Auto-instrumentation for incoming requests, outbound HttpClient and SqlClient comes on automatically.
1. Add the distro package.
dotnet add package Azure.Monitor.OpenTelemetry.AspNetCore
2. Bootstrap it in Program.cs.
using Azure.Monitor.OpenTelemetry.AspNetCore;

var builder = WebApplication.CreateBuilder(args);

// One line: configures the OTel SDK + auto-instrumentation + Azure exporter.
// Reads APPLICATIONINSIGHTS_CONNECTION_STRING from configuration/env automatically.
builder.Services.AddOpenTelemetry().UseAzureMonitor();

var app = builder.Build();
app.MapGet("/", () => "hello otel");
app.Run();
That single UseAzureMonitor() call registers the request, HTTP-client and SQL instrumentation plus the Azure Monitor exporter for traces, metrics and logs — no per-signal exporter config; the distro does it.
3. Provide the connection string — as configuration, not code. The distro reads APPLICATIONINSIGHTS_CONNECTION_STRING. Locally, use user-secrets or an environment variable; in Azure, an app setting:
# Local (do NOT hardcode in Program.cs or commit it)
export APPLICATIONINSIGHTS_CONNECTION_STRING="<paste the connection string>"

# On App Service, set it as an app setting so the distro picks it up.
# In Bicep, set the same key on the site's appSettings to
# appInsights.properties.ConnectionString (using the output from the create step).
az webapp config appsettings set -n <app-name> -g $RG \
  --settings APPLICATIONINSIGHTS_CONNECTION_STRING="<connection-string>"
4. Set the Cloud Role Name so this app has a sensible name on the Application map (otherwise it shows up as the process name). With OTel, set OTEL_SERVICE_NAME:
az webapp config appsettings set -n <app-name> -g $RG \
  --settings OTEL_SERVICE_NAME="checkout-api"
The startup knobs you most often set, with their effect:
| Setting | What it controls | Default | Set it when |
|---|---|---|---|
APPLICATIONINSIGHTS_CONNECTION_STRING |
Which resource telemetry goes to | none (no export) | Always — it is the routing address |
OTEL_SERVICE_NAME |
Cloud Role Name on the map | process/host name | Always in multi-service systems |
OTEL_SERVICE_INSTANCE_ID |
Cloud Role Instance | host/instance id | Rarely; to distinguish instances |
Sampling ratio (in UseAzureMonitor options) |
Fraction of traces kept | 1.0 (keep all) | High-traffic apps to cut cost |
OTEL_RESOURCE_ATTRIBUTES |
Extra resource attributes (env, version) | none | Tag telemetry with env/version |
The same idea in other languages
The bootstrap differs per language but the shape is identical — install the distro, call one configure function, set the connection string env var:
// Node.js — MUST run before other requires so instrumentation can hook libraries
const { useAzureMonitor } = require("@azure/monitor-opentelemetry");
useAzureMonitor(); // reads APPLICATIONINSIGHTS_CONNECTION_STRING
# Python — call once at startup, before creating the app
from azure.monitor.opentelemetry import configure_azure_monitor
configure_azure_monitor()  # reads APPLICATIONINSIGHTS_CONNECTION_STRING
Java is the exception: you edit no code, attaching the Application Insights Java agent as a JVM argument (-javaagent:applicationinsights-agent.jar) with the connection string via env var — the agent instruments servlets, JDBC and dozens of libraries codelessly.
Emitting custom telemetry: spans, metrics, and logs
Auto-instrumentation gives you requests, HTTP and SQL for free. The value you add by hand is telemetry about your domain — a span around a business operation, a counter for a business event, a structured log correlated to the trace — all via the standard, portable OTel APIs.
The three custom signals, the API to emit each, and where it lands in App Insights:
| Custom signal | OTel API (.NET) | Lands in App Insights as | When to use |
|---|---|---|---|
| Custom span | ActivitySource.StartActivity(...) |
A dependency/operation in the trace | Time a business operation (e.g. “price order”) |
| Custom metric | Meter.CreateCounter/Histogram(...) |
customMetrics |
Count/measure a business event (orders, bytes) |
| Span attributes | activity?.SetTag("key", value) |
Custom dimensions on the span | Add context (customerId, sku) for filtering |
| Correlated log | ILogger.LogInformation(...) |
traces, correlated by operation_Id |
Record an event with full trace context |
| Exception on a span | activity?.AddException(ex) / throw |
exceptions, attached to the span |
Capture a handled error with its trace |
Custom span. Define an ActivitySource once, register it with the distro, then start activities:
using System.Diagnostics;

// 1) One ActivitySource for your app (a stable name you'll reference)
public static class Telemetry
{
    public static readonly ActivitySource Source = new("Shop.Checkout");
}

// 2) Register the source so OTel listens to it (in Program.cs)
builder.Services.AddOpenTelemetry()
    .UseAzureMonitor()
    .WithTracing(t => t.AddSource("Shop.Checkout"));

// 3) Wrap a business operation — this becomes a span on the current trace
using (var activity = Telemetry.Source.StartActivity("PriceOrder"))
{
    activity?.SetTag("order.id", orderId);
    activity?.SetTag("order.itemCount", items.Count);
    var total = await pricingService.PriceAsync(items); // child spans nest under this
    activity?.SetTag("order.total", total);
}
Because StartActivity picks up the current trace context, this span automatically nests under the incoming request’s trace and shares its operation_Id — no manual correlation.
Custom metric. Define a Meter and an instrument, register the meter, then record:
using System.Diagnostics.Metrics;

public static class Metrics
{
    public static readonly Meter Meter = new("Shop.Checkout");
    public static readonly Counter<long> OrdersPlaced =
        Meter.CreateCounter<long>("shop.orders.placed");
}

// Register the meter with the distro (in Program.cs)
builder.Services.AddOpenTelemetry()
    .UseAzureMonitor()
    .WithMetrics(m => m.AddMeter("Shop.Checkout"));

// Record a business event (optionally with dimensions)
Metrics.OrdersPlaced.Add(1, new KeyValuePair<string, object?>("channel", "web"));
This surfaces in Metrics explorer and customMetrics, queryable and alertable like any platform metric.
Correlated structured log. Just use ILogger. With the distro, logs are exported to App Insights and automatically carry the current operation_Id, so a log line written inside a request is correlated to that request’s trace:
public class CheckoutService(ILogger<CheckoutService> logger)
{
    public async Task PlaceAsync(Order order)
    {
        // Structured (not string-concatenated) — the {OrderId} becomes a queryable dimension
        logger.LogInformation("Placing order {OrderId} for {ItemCount} items",
            order.Id, order.Items.Count);
        // ... and this log is correlated to the current trace's operation_Id
    }
}
Log everything as structured properties ({OrderId} placeholders), never string concatenation — the placeholders become queryable customDimensions in KQL, which is the difference between “grep the logs” and “ask a precise question.”
Distributed tracing across services
The single most valuable thing this setup buys you is distributed tracing: one request fanning out across multiple services shows up as one trace, so you can see which service in the chain was slow or failed. It works through W3C Trace Context propagation: when service A calls service B over HTTP, the auto-instrumented HttpClient injects a traceparent header carrying the trace ID and parent span ID, and B’s auto-instrumented ASP.NET Core reads it and continues the same trace rather than starting a new one.
You do not write correlation code — you get it free provided both services use the distro (or any W3C-compatible OTel setup) and nothing breaks the header. What to verify: each service has a distinct Cloud Role Name (two named nodes on the map, not one), the outbound dependency span in A and the inbound request span in B both appear, and — the clincher — both share one operation_Id. A KQL query that proves correlation — given one operation_Id, list every piece of telemetry across both services on that trace, ordered by time:
// Paste an operation_Id from Transaction search to see the whole distributed trace
let opId = "0123abcd...";   // the trace ID from a request you care about
union requests, dependencies, traces, exceptions
| where operation_Id == opId
| project timestamp, itemType, name, cloud_RoleName, duration=todouble(duration), success
| order by timestamp asc
If service B’s requests share the same operation_Id as service A’s dependencies, correlation works. If B starts a new operation_Id, the trace is broken — almost always because B isn’t instrumented, a non-HTTP transport dropped the header, or a proxy stripped it. The propagation pitfalls and their fixes:
| Pitfall | Why correlation breaks | Fix |
|---|---|---|
| Downstream service not instrumented | No one reads traceparent; B starts a fresh trace |
Add the distro to B |
| Custom HTTP client bypassing instrumentation | Header never injected on the outbound call | Use the instrumented HttpClient/IHttpClientFactory |
| Message queue / event hop | HTTP propagation doesn’t apply to AMQP/queues | Manually propagate context in message properties |
| Proxy/gateway strips unknown headers | traceparent removed in transit |
Allow-list the header at the proxy |
| Mixed legacy + OTel using different formats | Header format mismatch (W3C vs legacy) | Standardise on W3C Trace Context everywhere |
Sampling, role name, and shaping the data
Once data flows, two settings decide whether it is useful and affordable: sampling (how much you keep) and Cloud Role Name (how services are labelled). Get these wrong and you either drown in cost or stare at a map where every service is called “dotnet”.
Sampling. The distro applies head-based, fixed-rate sampling — one decision at the root, propagated to the whole trace. Configure the ratio in the UseAzureMonitor options:
builder.Services.AddOpenTelemetry().UseAzureMonitor(o =>
{
    // Keep ~25% of traces. 1.0 = keep all (default); 0.0 = drop all.
    o.SamplingRatio = 0.25F;
});
Choosing a ratio is a fidelity-vs-cost trade. The decision table:
| Traffic level | Suggested ratio | Rationale | Watch-out |
|---|---|---|---|
| Low (< ~5 req/s) | 1.0 (keep all) | Volume is cheap; full fidelity | None |
| Medium | 0.25–0.5 | Plenty of traces to inspect; halve cost | Rare events may be under-sampled |
| High (sustained) | 0.05–0.1 | Cost control dominates | Investigating a specific user is harder |
| Per-environment | dev 1.0 / prod lower | Full detail where it’s cheap | Keep prod high enough to debug |
Because sampling is head-based and propagated, a kept trace is kept whole across services — you never see half a distributed trace. SamplingRatio is the main dial; for advanced cases OTEL_TRACES_SAMPLER can override the sampler entirely, but leave it to the distro default unless you have a specific need. Pair sampling with a daily cap on the resource (a hard GB/day brake that drops data past it) and a sensible workspace retention window — both detailed in Cost & sizing.
Cloud Role Name and instance. On the Application map, each node is a Cloud Role Name; each replica is a Cloud Role Instance. Set the name via OTEL_SERVICE_NAME (env var) or in code via a resource attribute. If you skip it, a multi-service map collapses into indistinguishable nodes:
// Alternative to OTEL_SERVICE_NAME: set the role name as a resource attribute in code
builder.Services.AddOpenTelemetry()
    .ConfigureResource(r => r.AddService(serviceName: "checkout-api"))
    .UseAzureMonitor();
You can also enrich or filter spans before export with an OTel processor — drop noisy health-check requests, add a tenant attribute, or scrub anything sensitive (see Security notes) before it leaves the process. This is the OTel equivalent of the classic SDK’s telemetry initializers.
Architecture at a glance
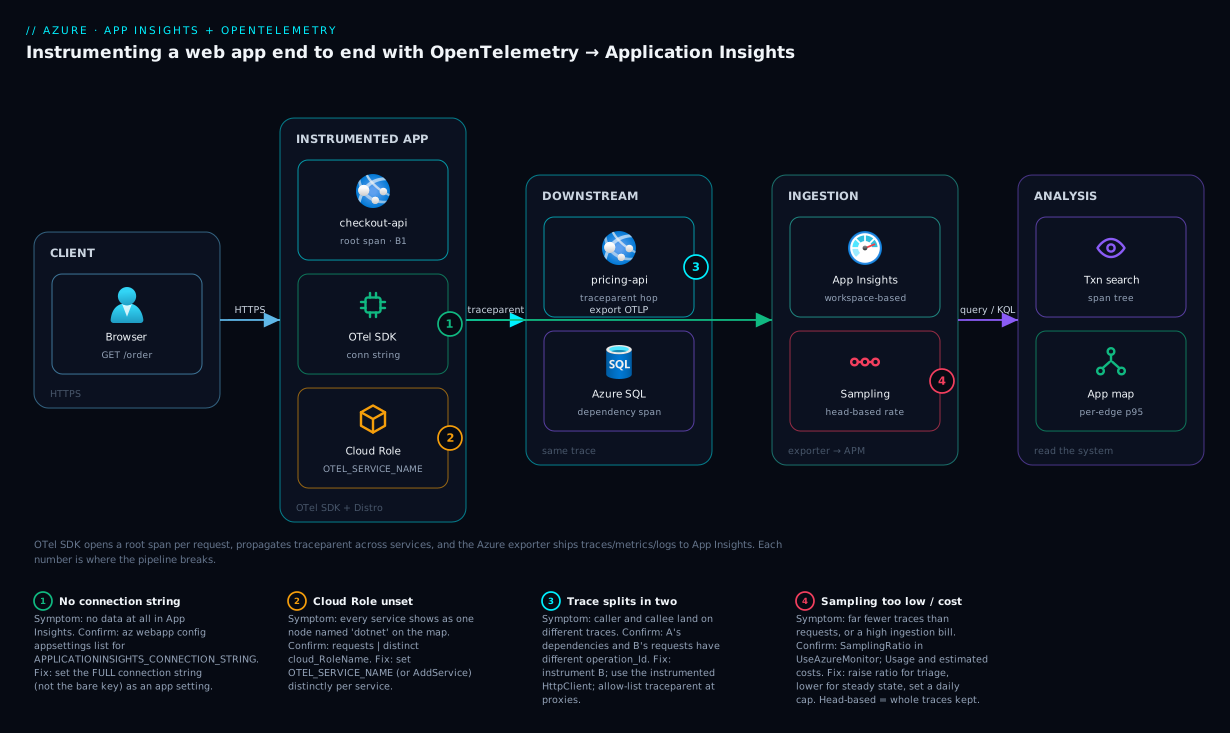
Follow a single request left to right. A browser hits your checkout-api running on App Service; the moment it arrives, the OTel SDK (configured by the Azure Monitor Distro) opens a root span and stamps a trace ID. Inside the request the app makes an outbound call to a downstream pricing-api — the instrumented HttpClient injects the traceparent header, so pricing-api continues the same trace as a nested span rather than starting a new one — and a query to Azure SQL, which SqlClient instrumentation records as a dependency span on that same trace. The app may also emit a custom span (“PriceOrder”), a custom counter (“orders.placed”) and a structured log, all of which inherit the current trace’s operation_Id. The SDK batches these spans, metrics and logs and the Azure Monitor exporter ships them — addressed by the connection string — to the Application Insights resource, which stores them in a Log Analytics workspace.
From there you read the system: Transaction search reconstructs the full span tree for any request, the Application map draws checkout-api → pricing-api → SQL as a graph with per-edge latency and failure rates, Live Metrics streams an unsampled real-time view during a deploy, and Logs (KQL) answers arbitrary questions. The numbered badges below mark the points where this pipeline most often breaks — a missing connection string, a dropped traceparent, an unset role name, over-aggressive sampling — each of which turns “rich correlated telemetry” into “no data” or “a useless map”.
Real-world scenario
Lumio Retail runs a checkout flow as three .NET services on App Service: web-bff (the browser-facing API), pricing-api, and inventory-api, all talking to an Azure SQL database and a third-party tax API. During a Diwali sale, customers reported that “placing an order sometimes takes 8–9 seconds, sometimes it’s instant.” The team had Console.WriteLine logs and App Service CPU charts — both unremarkable, because the slowness was intermittent and lived between services. They were, in their own words, “debugging by vibes.”
They instrumented all three services with the Azure Monitor OpenTelemetry Distro in an afternoon: Azure.Monitor.OpenTelemetry.AspNetCore, one UseAzureMonitor() line per service, APPLICATIONINSIGHTS_CONNECTION_STRING and a distinct OTEL_SERVICE_NAME per app, then shipped. They started at SamplingRatio = 1.0 to capture everything during triage.
Within an hour the Application map told the story their logs never could. It drew web-bff → pricing-api → tax-api (third party), and the edge to tax-api carried a 15% failure rate and a p95 of 7.8 seconds. Opening a slow transaction in Transaction search, the trace tree was unambiguous: 60 ms in web-bff, 40 ms in pricing-api’s own code, then two failed calls to tax-api that each timed out at ~3.5 s and retried before the third succeeded. The tax API was rate-limiting them under sale load, and their retry policy hammered it harder. No CPU graph could have shown this — the services were idle, waiting.
The fixes were precise because the diagnosis was precise. They added a short timeout and a circuit breaker around the tax-api call (fail fast and use a cached tax rate rather than retry-storming), and they cached tax rates per postcode for the duration of the sale. A KQL query confirmed the result the next day:
// p95 of the pricing-api → tax-api dependency, before vs after
dependencies
| where timestamp > ago(2d) and target contains "tax-api"
| summarize p95=percentile(duration, 95), failRate=100.0*countif(success==false)/count()
          by bin(timestamp, 1h)
| order by timestamp asc
p95 on that edge dropped from 7.8 s to 220 ms, failure rate from 15% to under 1%, and the “sometimes 8 seconds” complaints stopped. After the sale they dialled SamplingRatio down to 0.2 in production to control the ongoing telemetry bill — full fidelity for triage, sampled for steady state. The lesson the team repeated afterward: the outage was never in any one service’s logs; it was in the edges between them, and only a correlated distributed trace shows the edges.
Advantages and disadvantages
Instrumenting via OpenTelemetry rather than the classic SDK (or nothing) is the right default, but it is an engineering choice with real trade-offs:
| Advantages | Disadvantages |
|---|---|
| Vendor-neutral — your instrumentation code isn’t tied to Azure; swap the exporter to send elsewhere | Small feature gaps vs the classic SDK (e.g. Profiler/Snapshot Debugger maturity) you may hit |
| One-line bootstrap with the distro; auto-instruments the common HTTP/SQL libraries | You must edit and redeploy the app (codeless agent avoids this but gives less control) |
| Distributed tracing for free across services via W3C Trace Context | Correlation silently breaks if any hop isn’t instrumented or a proxy strips traceparent |
| Standard OTel APIs for custom spans/metrics/logs — portable skills and code | OTel-on-Azure has its own config surface (sampling in the distro, not server-side adaptive) |
| Workspace-based storage unifies app + infra telemetry for cross-resource KQL | Cost scales with ingestion — unsampled high-traffic apps get expensive fast |
| Future direction Microsoft is investing in; community instrumentation for many libraries | Some languages/libraries are less mature than .NET; check the per-language coverage |
The model is right for essentially every new web app and especially any distributed system, where the portability and free cross-service correlation pay for themselves the first time you debug an inter-service slowdown. It bites when you cannot redeploy (use the codeless agent for a baseline), when you depend on a classic-SDK-only feature, or when you forget ingestion is metered and ship an unsampled firehose. Every disadvantage is manageable — but only if you know it exists, which is why you do this deliberately rather than copy-pasting a bootstrap line and hoping.
Hands-on lab
This is the centerpiece. You will stand up a workspace-based Application Insights resource, instrument a minimal ASP.NET Core app with the OTel distro, add a custom span and metric, generate load, and confirm end to end in Live Metrics, Transaction search and KQL — then tear it all down. It is free-tier-friendly: the only cost is a few hours of a B1 App Service plan (well under ₹50) plus negligible telemetry ingestion, and you delete the resource group at the end. Run the CLI in Cloud Shell (Bash) or any shell with az logged in; the app you build and zip deploy.
Part A — Provision the backend
Step 1 — Variables and resource group.
RG=rg-otel-lab
LOC=centralindia
WS=log-otel-lab
APPI=appi-otel-lab
PLAN=plan-otel-lab
APP=app-otel-$RANDOM     # globally-unique hostname
az group create -n $RG -l $LOC -o table
Expected: a resource-group row with provisioningState: Succeeded.
Step 2 — Log Analytics workspace + workspace-based App Insights.
WS_ID=$(az monitor log-analytics workspace create -g $RG -n $WS -l $LOC --query id -o tsv)

az monitor app-insights component create \
  --app $APPI -g $RG -l $LOC --application-type web --workspace "$WS_ID" -o table

CONN=$(az monitor app-insights component show --app $APPI -g $RG --query connectionString -o tsv)
echo "$CONN"
Expected: the component row shows Succeeded, and echo "$CONN" prints a string starting InstrumentationKey=...;IngestionEndpoint=https://.... Capturing it in $CONN lets later steps inject it without copy-paste.
Step 3 — App Service plan (B1, Linux) and a placeholder web app.
az appservice plan create -n $PLAN -g $RG --is-linux --sku B1 -o table
az webapp create -n $APP -g $RG -p $PLAN --runtime "DOTNETCORE:8.0" -o table
Expected: a plan with sku.name: B1 and a web app with a default hostname https://$APP.azurewebsites.net.
Part B — Build and instrument the app
Step 4 — Scaffold a minimal API.
mkdir otel-lab && cd otel-lab
dotnet new web -n OtelLab
cd OtelLab
dotnet add package Azure.Monitor.OpenTelemetry.AspNetCore
Expected: a project that builds, with the distro package added to the .csproj.
Step 5 — Replace Program.cs with an instrumented app (auto-instrumentation + a custom span, metric and log, plus an endpoint that calls an outbound HTTP dependency and one that throws):
using System.Diagnostics;
using System.Diagnostics.Metrics;
using Azure.Monitor.OpenTelemetry.AspNetCore;

var builder = WebApplication.CreateBuilder(args);

// Custom telemetry sources
var activitySource = new ActivitySource("OtelLab");
var meter = new Meter("OtelLab");
var ordersPlaced = meter.CreateCounter<long>("otellab.orders.placed");

builder.Services.AddOpenTelemetry()
    .UseAzureMonitor()                       // exporter + auto-instrumentation
    .WithTracing(t => t.AddSource("OtelLab")) // listen to our ActivitySource
    .WithMetrics(m => m.AddMeter("OtelLab")); // listen to our Meter

builder.Services.AddHttpClient(); // instrumented outbound HTTP

var app = builder.Build();

app.MapGet("/", () => "otel-lab up");

// A custom span + metric + correlated log + an outbound dependency call
app.MapGet("/order", async (IHttpClientFactory http, ILogger<Program> log) =>
{
    using var activity = activitySource.StartActivity("PlaceOrder");
    activity?.SetTag("order.id", Guid.NewGuid().ToString());

    // Outbound HTTP — auto-instrumented, becomes a dependency span on this trace
    var client = http.CreateClient();
    var status = await client.GetAsync("https://example.com/");

    ordersPlaced.Add(1, new KeyValuePair<string, object?>("channel", "web"));
    log.LogInformation("Order placed; downstream status {Status}", (int)status.StatusCode);

    return Results.Ok(new { ok = true, downstream = (int)status.StatusCode });
});

// An endpoint that throws, to populate the Failures blade
app.MapGet("/boom", () =>
{
    throw new InvalidOperationException("deliberate failure for the Failures blade");
});

app.Run();
Step 6 — Publish and zip-deploy, injecting the connection string and role name as app settings.
dotnet publish -c Release -o ./publish
(cd publish && zip -r ../app.zip . >/dev/null)

az webapp config appsettings set -n $APP -g $RG --settings \
  APPLICATIONINSIGHTS_CONNECTION_STRING="$CONN" \
  OTEL_SERVICE_NAME="otel-lab-api" -o none

az webapp deploy -n $APP -g $RG --src-path app.zip --type zip -o table
Expected: the deploy returns a success row. The connection string is supplied as an app setting (never compiled in), and OTEL_SERVICE_NAME names the app on the map.
Part C — Generate load and validate
Step 7 — Drive traffic so there is something to see. Hit the healthy endpoint, the dependency endpoint, and the failing one:
BASE="https://$APP.azurewebsites.net"
for i in $(seq 1 30); do curl -s "$BASE/order" >/dev/null; done
for i in $(seq 1 5);  do curl -s "$BASE/boom"  >/dev/null; done
echo "generated 30 /order and 5 /boom requests"
Step 8 — Watch Live Metrics (real-time, unsampled). Open the appi-otel-lab resource → Live Metrics, re-run the Step 7 curl loop, and watch the incoming request rate, dependency calls and failures move in real time — the fastest confirmation that telemetry is flowing right now.
Step 9 — Find the distributed trace in Transaction search. Resource → Transaction search (or Investigate → Transaction search). Filter to the last 30 minutes. You should see GET /order requests; click one and expand it. Expected: a span tree with the request at the root, a nested dependency for the outbound GET example.com, your custom “PlaceOrder” span, and the log message — all under one operation_Id. Click a GET /boom to see the exception attached to its request.
Step 10 — Confirm with KQL. Resource → Logs. Run each query and check the counts are non-zero:
// Requests in the last 30 min, by route and result code
requests
| where timestamp > ago(30m)
| summarize count() by name, resultCode
| order by count_ desc
// The custom metric you emitted
customMetrics
| where timestamp > ago(30m) and name == "otellab.orders.placed"
| summarize total = sum(valueSum)
// One full trace: pick an operation_Id from the requests above, then expand it
union requests, dependencies, traces, exceptions
| where timestamp > ago(30m)
| where operation_Id == "<paste-an-operation_Id-here>"
| project timestamp, itemType, name, success, duration
| order by timestamp asc
Expected: the first query shows GET /order (200) and GET /boom (500); customMetrics shows a positive total; the trace query lists the request, the example.com dependency, your custom span, and the log line together.
The lab steps mapped to what each proves:
| Step | What you did | What it proves |
|---|---|---|
| 2 | Workspace-based App Insights + connection string | The backend exists and you have its routing address |
| 5 | UseAzureMonitor() + custom source/meter |
One line wires auto-instrumentation; custom signals are easy |
| 6 | Connection string as an app setting | Config-not-code; the distro reads the env var |
| 7–8 | Load + Live Metrics | Telemetry is flowing in real time |
| 9 | Transaction search trace tree | Request, dependency, custom span and log share one trace |
| 10 | KQL counts | The data is queryable and the custom metric landed |
Validation checklist. You provisioned workspace-based App Insights, instrumented an app with a single bootstrap line, added a custom span/metric/log, generated load, and confirmed the data three ways (Live Metrics, the Transaction search trace tree, and KQL counts) — including a correctly correlated distributed trace and a captured exception. That is the entire pipeline, end to end.
Teardown
az group delete -n $RG --yes --no-wait
Cost note. A B1 plan is a few rupees per hour and telemetry for this volume is effectively free; an hour of this lab is well under ₹50, and deleting the resource group stops every charge. There is no orphaned workspace to worry about — it lived in the same group.
Common mistakes & troubleshooting
The gap between “I added the line” and “telemetry appears, correlated” is a short list of specific failures — symptom, root cause, the exact way to confirm, and the fix:
| # | Symptom | Root cause | Confirm (exact cmd / portal path) | Fix |
|---|---|---|---|---|
| 1 | No data at all in App Insights | Connection string missing/wrong; export never happens | az webapp config appsettings list -n <app> -g <rg> --query "[?name=='APPLICATIONINSIGHTS_CONNECTION_STRING']" |
Set the full connection string (not the bare key) as an app setting |
| 2 | Data appears but lags / batched | Telemetry is batched then flushed; short test ended too soon | Live Metrics shows it in real time even when Logs lag | Wait 1–3 min, or use Live Metrics for instant confirmation |
| 3 | App on the map is named “dotnet”/host name | Cloud Role Name unset | App map shows a generic node; requests | distinct cloud_RoleName |
Set OTEL_SERVICE_NAME (or AddService(serviceName:)) |
| 4 | Distributed trace splits into two traces | Downstream not instrumented or traceparent dropped |
KQL: A’s dependencies and B’s requests have different operation_Id |
Instrument B with the distro; use instrumented HttpClient; allow-list the header at proxies |
| 5 | Far fewer traces than requests sent | Sampling ratio too low | Check SamplingRatio in UseAzureMonitor options |
Raise the ratio (1.0 for triage); remember it preserves whole traces |
| 6 | Telemetry bill is high | Unsampled high-traffic app; no daily cap | App Insights Usage and estimated costs; ingestion GB/day | Set SamplingRatio < 1; set a daily cap; tune retention |
| 7 | Custom span/metric never appears | ActivitySource/Meter not registered with the SDK |
Grep Program.cs for AddSource("…") / AddMeter("…") |
Register the exact source/meter name with WithTracing/WithMetrics |
| 8 | SQL/HTTP calls not showing as dependencies | A custom client bypasses the instrumented one; or library unsupported | Trace tree has the request but no child dependency | Use IHttpClientFactory/SqlClient; check the library is auto-instrumented |
| 9 | Logs not correlated to traces | Logging provider not wired to OTel, or log written outside a request | traces rows have empty operation_Id |
Use the framework ILogger (the distro wires the log provider) |
| 10 | Duplicated telemetry / double counts | Both the codeless agent and the SDK are enabled | App Service has App Insights “on” and the distro in code | Pick one: disable the App Service auto-instrumentation if using the SDK |
| 11 | 403/auth errors exporting (AMPLS/firewall) |
Private Link / firewall blocks the ingestion endpoint | Network rules on the workspace; egress to *.applicationinsights.azure.com |
Allow the ingestion/live endpoints; configure AMPLS correctly |
| 12 | Works locally, nothing from App Service | Env var set locally but not as an App Service app setting | az webapp config appsettings list lacks the connection string |
Set APPLICATIONINSIGHTS_CONNECTION_STRING on the web app |
The four that bite hardest, expanded:
1. No data at all. The number-one cause is the connection string — unset, or someone used the deprecated bare instrumentation key. The distro only exports when APPLICATIONINSIGHTS_CONNECTION_STRING resolves to a full string with endpoints. Confirm it is present as an app setting (row 1 command), not just in your local shell; if present and still nothing, check egress (row 11).
4. The distributed trace splits. You expect one trace across two services and get two. The confirm is decisive: check whether A’s outbound dependencies row and B’s inbound requests row carry the same operation_Id. If they differ, B is starting a fresh trace — because B is not instrumented, the call crossed a non-HTTP transport that does not carry traceparent (a queue, an event), or a proxy stripped the header. Instrument B, use the instrumented HTTP client, or manually propagate context across the non-HTTP hop.
5/6. Too few traces, or too much cost. Two sides of sampling. Sent 1,000 requests and see ~250 traces? Your SamplingRatio is 0.25 — working as designed; raise it to 1.0 while actively debugging. Conversely, if Usage and estimated costs shows ingestion climbing, lower the ratio and set a daily cap as a brake. Because sampling is head-based, you trade number of traces, never trace completeness.
10. Duplicated telemetry. A classic foot-gun: you enable App Insights on the App Service blade (codeless agent) and add the OTel distro in code. Two pipelines export, so you double-count requests and pay twice. Choose one — for a code-instrumented app, turn off the App Service auto-instrumentation toggle.
Best practices
- Use the connection string, never the bare instrumentation key. The key alone is deprecated; the connection string carries the region-specific endpoints the SDK needs.
- Inject it as configuration, not code. Set
APPLICATIONINSIGHTS_CONNECTION_STRINGas an app setting / env var so it never ships in source control and differs cleanly per environment. - Always set the Cloud Role Name (
OTEL_SERVICE_NAME). An unnamed service makes the Application map useless in any multi-service system. - Instrument every service in a request path. Distributed tracing only works end to end if every hop participates; one un-instrumented service breaks the trace at that point.
- Prefer the distro over raw OTel for app code. One supported bootstrap, the right instrumentation libraries, and the Azure exporter — assemble raw OTel only when you need control the distro doesn’t expose.
- Log structured, not concatenated.
LogInformation("...{OrderId}...", id)makesOrderIda queryable dimension; string interpolation throws that away. - Set sampling deliberately per environment. 1.0 in dev and during triage; a lower ratio in steady-state production. Head-based sampling keeps whole traces, so lower ratios stay debuggable.
- Put a daily cap on non-prod resources. A misbehaving loop or a load test can otherwise ingest gigabytes and surprise the bill.
- Use Live Metrics to validate deploys. It is unsampled and real-time — the fastest way to confirm a new build is healthy and emitting telemetry.
- Scrub sensitive data before export with an OTel processor / enrichment, not after. Never let tokens, PII or full SQL parameter values reach the backend.
- Pick one instrumentation pipeline. Don’t run the codeless App Service agent and the SDK at once — you’ll double-count and double-pay.
- Tie telemetry to a release. Add
service.version(viaOTEL_RESOURCE_ATTRIBUTESorAddService) so you can compare error rates and latency across deploys.
Security notes
- Treat the connection string as a routing secret. It contains the instrumentation key; anyone with it can send (or spoof) telemetry to your resource. Store it as an app setting or in Key Vault referenced from app settings — see Azure Key Vault: Secrets, Keys & Certificates — and keep it out of git.
- Scrub PII and secrets in a processor before export. Spans and logs can accidentally carry tokens, emails, card numbers, or full SQL parameters. Add an OTel span processor/log enrichment that redacts known-sensitive attributes in-process, so sensitive data never leaves the app.
- Lock down ingestion with Private Link if required. For regulated workloads, an Azure Monitor Private Link Scope (AMPLS) keeps telemetry on the private backbone; if you enable it, remember it changes the endpoints and can cause the “403/no export” failure (troubleshooting row 11) until configured.
- Apply least-privilege RBAC on the data. The workspace holds your telemetry — grant Monitoring Reader to people who only query, not Contributor. Use Azure RBAC fundamentals to scope it tightly.
- Be careful what you put in custom dimensions. Tagging spans with
customerIdis fine; tagging with a full auth token or a national ID is a data-leak. Decide what is allowed and enforce it in the processor. - Secure the health/diagnostic endpoints you add. A
/healthzor debug endpoint should return a status, not internal hostnames, versions, or dependency topology that aids an attacker. - Use managed identity for any Azure resource the app calls, so the telemetry you capture about those calls never includes plaintext credentials — see Managed Identity: System vs User-Assigned Patterns.
The security controls and what each protects against:
| Control | Mechanism | Protects against |
|---|---|---|
| Connection string as app setting / Key Vault ref | App config, not source | Leaked credential in git; telemetry spoofing |
| In-process PII/secret scrubbing | OTel span/log processor | Sensitive data reaching the backend |
| Private Link (AMPLS) | Private ingestion endpoint | Telemetry traversing the public internet |
| RBAC on the workspace | Monitoring Reader vs Contributor | Over-broad access to telemetry data |
| Curated custom dimensions | Allow-list of safe attributes | PII/secret leakage via span tags |
| Managed identity for app→Azure calls | Entra identity, no secrets | Credentials captured in dependency telemetry |
Cost & sizing
Application Insights bills on data ingested (per GB) into the linked Log Analytics workspace, plus retention beyond the free period. The dial you control is how much telemetry you send — sampling, what you log, and how long you keep it.
- Ingestion (per GB) is the main bill. Every trace, dependency, log and metric you keep counts. A chatty app at full fidelity can ingest gigabytes a day; the same app at
SamplingRatio = 0.1ingests roughly a tenth. A monthly free ingestion grant per resource keeps small apps near-free. - Sampling is the biggest lever. 1.0 → 0.2 cuts trace ingestion ~80% while leaving plenty to inspect (and, being head-based, every kept trace is complete). Set it lower the higher your traffic.
- Retention drives storage cost. The workspace keeps data for a configurable window (a free period, then per-GB-month). 30–90 days suits most teams; archive longer-term data to cheaper tiers.
- A daily cap is cheap insurance. It bounds the worst case — a runaway log loop or a load test — by dropping data past the ceiling rather than billing for it.
- Logs are sneaky-expensive. Verbose
Information/Debuglogging on a hot path can dwarf trace volume. Log at the right level; prefer structured events over chatter.
A rough monthly picture and what each lever buys:
| Cost driver | What you pay for | Rough INR / month | Control |
|---|---|---|---|
| Ingestion — small app | A few hundred MB/day, sampled | ~₹0–1,500 (often within free grant) | Stay near the free grant; sample |
| Ingestion — busy app | Multiple GB/day | ~₹5,000–20,000+ | SamplingRatio is the main lever |
| Retention beyond free | Per-GB-month storage past the window | scales with volume × days | Set 30–90 days; archive the rest |
| Daily cap (safety) | (Caps cost; nothing past it) | bounds the worst case | Set in non-prod and load tests |
| Verbose logging | Extra ingestion from chatty logs | can dominate the bill | Right log level; structured events |
Sizing rule of thumb: start at SamplingRatio = 1.0 to learn the real volume, watch Usage and estimated costs for a week, then set the ratio so steady-state ingestion lands inside budget — typically 0.1–0.3 for real traffic, 1.0 for low-traffic internal apps where full fidelity is essentially free.
Interview & exam questions
1. What is the relationship between Application Insights, Azure Monitor, and OpenTelemetry? Azure Monitor is the umbrella platform for metrics, logs, traces and alerting; Application Insights is its application-performance-monitoring component (the resource your app’s telemetry lands in). OpenTelemetry is the vendor-neutral SDK and wire format your code uses to produce that telemetry, delivered to Application Insights via the Azure Monitor exporter.
2. Why use the OpenTelemetry Distro instead of the classic Application Insights SDK? Portability and direction: OTel is the industry standard, so your instrumentation code isn’t locked to Azure and can export elsewhere by swapping the exporter, and it’s where Microsoft is investing. The classic SDK has a few features OTel hasn’t fully reached (e.g. Profiler/Snapshot Debugger), so legacy apps depending on those may stay on it.
3. What does the connection string contain and why not just use the instrumentation key? The connection string carries the instrumentation key plus the region-specific ingestion and live-metrics endpoints. The bare key is deprecated for new work because it lacks those endpoints; the SDK needs them to route data correctly, especially across regions and sovereign clouds.
4. How does distributed tracing correlate a request across two services? The SDK propagates W3C Trace Context: the caller’s instrumented HTTP client injects a traceparent header carrying the trace ID and parent span ID; the callee’s instrumentation reads it and continues the same trace. Both services’ telemetry then shares one operation_Id, which Transaction search uses to reconstruct the full span tree.
5. What is the difference between a trace, a span, and a dependency? A trace is the end-to-end record of one request; a span is one timed unit of work within it (the request itself, or any nested operation); a dependency is specifically a span representing an outbound call (to SQL, HTTP, a queue). A trace is a tree of spans, some of which are dependencies.
6. How does sampling work with the OTel distro, and why is “head-based” important? The distro uses fixed-rate, head-based sampling — the keep/drop decision is made once at the root span and propagated to all children, so you keep or drop entire traces. That’s what guarantees you never see half a distributed trace; lowering the ratio reduces the number of traces, not their completeness.
7. You added the distro but see no data in Application Insights. What do you check first? The connection string — that APPLICATIONINSIGHTS_CONNECTION_STRING is set (as an app setting in Azure, not just locally) and is the full string with endpoints, not the bare key. If present, check egress to the ingestion endpoint (firewall/Private Link). Live Metrics confirms flow instantly without waiting on batching.
8. The Application map shows all services as one node named “dotnet”. Why, and the fix? The Cloud Role Name is unset, so every service reports the default (process/host) name and collapses together. Set OTEL_SERVICE_NAME (or ConfigureResource(r => r.AddService("name"))) distinctly per service so each appears as its own node with its own edges.
9. A distributed call shows as two separate traces instead of one. What broke? Trace context didn’t propagate: the downstream isn’t instrumented, the call used a client that bypassed instrumentation (no traceparent injected), the hop was a non-HTTP transport (queue/event) that doesn’t carry the header, or a proxy stripped it. Confirm by checking the two services’ telemetry have different operation_Id; fix by instrumenting the downstream and using the instrumented client (or manually propagating context).
10. How do you emit a custom metric with OpenTelemetry in .NET, and where does it land? Create a Meter and an instrument (e.g. CreateCounter<long>), register the meter with the SDK (WithMetrics(m => m.AddMeter("..."))), and call .Add(...). It lands in App Insights customMetrics, queryable in KQL and usable in Metrics explorer and alerts.
11. What drives the Application Insights bill, and the single biggest lever to control it? Data ingestion (per GB) dominates, plus retention. The biggest lever is sampling — lowering SamplingRatio cuts ingestion proportionally while keeping whole traces; a daily cap bounds the worst case and right log levels prevent chatty-log blowups.
12. What’s the risk of enabling both the App Service codeless agent and the OTel SDK? Two telemetry pipelines run at once, so requests and dependencies are double-counted and you pay twice. Pick one: for a code-instrumented app, disable the App Service auto-instrumentation toggle.
These map to AZ-204 (Developer Associate) — instrument an app for monitoring; integrate caching and CDN; troubleshoot solutions — squarely on the Application Insights and telemetry objectives, and to AZ-400 (DevOps Engineer) for the observability and continuous-monitoring practices. The KQL and workspace angle touches AZ-104.
| Question theme | Primary cert | Objective area |
|---|---|---|
| App Insights vs OTel vs Monitor | AZ-204 | Instrument apps for monitoring |
| Connection string, distro setup | AZ-204 | Integrate Application Insights |
| Distributed tracing / correlation | AZ-204 / AZ-400 | Monitor and troubleshoot solutions |
| Sampling, cost, daily cap | AZ-204 / AZ-104 | Optimize and manage monitoring cost |
| KQL on telemetry | AZ-104 / AZ-400 | Query and analyze logs |
Quick check
- Telemetry isn’t reaching Application Insights even though you added
UseAzureMonitor(). What is the single most likely cause and how do you confirm it? - Two services in one request path show up as two separate traces. Name the most likely reason and the exact thing you’d query to confirm.
- True or false: lowering the sampling ratio can give you half a distributed trace (some services missing for a given request).
- Your Application map shows every service as one node called “dotnet”. What setting fixes this?
- Which costs you money in Application Insights, and what is the biggest single lever to control it?
Answers
- The connection string is missing or wrong — most often not set as an app setting in Azure (only locally), or someone used the deprecated bare instrumentation key. Confirm with
az webapp config appsettings list -n <app> -g <rg> --query "[?name=='APPLICATIONINSIGHTS_CONNECTION_STRING']"; use Live Metrics to verify flow instantly. - Trace context (
traceparent) didn’t propagate — usually the downstream service isn’t instrumented, a client bypassed instrumentation, the hop was a non-HTTP transport, or a proxy stripped the header. Confirm by checking that the caller’sdependenciesand the callee’srequestscarry differentoperation_Idvalues. - False. The distro uses head-based sampling — the decision is made once at the root and propagated, so you keep or drop entire traces. Lowering the ratio reduces the number of traces, never their completeness.
- The Cloud Role Name is unset. Set
OTEL_SERVICE_NAME(orConfigureResource(r => r.AddService("name"))) distinctly per service. - Data ingestion (per GB) into the workspace (plus retention) is the bill. The biggest lever is sampling (lower
SamplingRatio), backed by a daily cap and sensible log levels.
Glossary
- Application Insights — the Azure Monitor component (an APM resource) that ingests, stores and visualises application telemetry: requests, dependencies, exceptions, metrics and logs.
- Azure Monitor — the umbrella platform for Azure metrics, logs, traces, dashboards and alerts; Application Insights is its application-monitoring arm.
- OpenTelemetry (OTel) — the CNCF vendor-neutral standard (SDK + wire format) for generating traces, metrics and logs from application code.
- Azure Monitor OpenTelemetry Distro — a curated package (e.g.
Azure.Monitor.OpenTelemetry.AspNetCore) that wires the OTel SDK, auto-instrumentation and the Azure exporter with one bootstrap call. - Connection string — the routing address (
InstrumentationKey=…;IngestionEndpoint=…;LiveEndpoint=…) telling the SDK which resource and endpoints to send to; replaces the bare instrumentation key. - Trace — the end-to-end record of one request as a tree of spans sharing a trace ID (
operation_Idin App Insights). - Span — one timed unit of work within a trace (the request, a DB call, a custom block), with a duration, status and attributes.
- Dependency — a span representing an outbound call (SQL, HTTP, queue) made during a request.
- W3C Trace Context /
traceparent— the standard HTTP header that carries trace and parent-span IDs across service boundaries so a trace continues across hops. - Cloud Role Name — the name a service shows under on the Application map; set via
OTEL_SERVICE_NAMEor a service resource attribute. - Cloud Role Instance — the specific replica/host of a service, distinguishing instances of the same role.
- Auto-instrumentation — instrumentation libraries that automatically emit spans for common frameworks (ASP.NET Core, HttpClient, SqlClient) with no per-call code.
- Custom telemetry — spans (
ActivitySource), metrics (Meter) and logs you emit by hand for your own business operations. - Sampling — keeping a fraction of traces to control cost; the distro uses head-based fixed-rate sampling that preserves whole traces.
- Live Metrics — a real-time, unsampled stream of incoming telemetry, ideal for validating a deploy as it happens.
- Transaction search — the App Insights view that finds a request and expands its full distributed trace (span tree).
- Application map — a graph of services and dependencies with per-edge latency and failure rates, built from correlated traces.
- Workspace-based — an App Insights resource that stores its data in a linked Log Analytics workspace (the modern default); enables cross-resource KQL.
- Daily cap — a hard GB/day ingestion ceiling on a resource/workspace; data past it is dropped, bounding cost.
Next steps
You can now instrument a web app end to end and read its telemetry. Build outward:
- Next: Azure Monitor & Application Insights for Observability — go wider on Failures, Performance, alerts and the full observability surface this article feeds.
- Related: KQL for Log Analytics: summarize, join & time-series — turn the telemetry you’re now collecting into precise answers.
- Related: Create and Design a Log Analytics Workspace with RBAC — the storage layer behind workspace-based App Insights, and how to secure it.
- Related: Troubleshooting Azure App Service: 502/503, Cold Starts & Restart Loops — use this telemetry to localise a production 5xx to a specific hop.
- Related: Azure Key Vault: Secrets, Keys & Certificates — keep the connection string and any app secrets out of source control.