Open the Azure Monitor blade for the first time and it feels like ten products wearing one name: a Metrics explorer, a Logs query window, an Application Insights resource, a Log Analytics workspace, alert rules, dashboards, workbooks, and a “Diagnostic settings” panel that asks you to route things you have not heard of to places you have not created. The questions that actually slow people down are simple: Where does my CPU graph come from? Why can I chart it instantly but have to write a query for my app’s logs? Why does one signal cost almost nothing and the other shows up on the bill? And when something breaks, which do I open first?
The confusion has a clean root cause: Azure Monitor is not one store. It is a data platform built on two fundamentally different databases, fed by a handful of signal types, with shared tools on top. Metrics are small, numeric, pre-aggregated time series in a fast purpose-built database. Logs (and traces, which are a kind of log) are rich, queryable, schema-on-read records in a Log Analytics workspace powered by the same engine as Azure Data Explorer. They have different shapes, latencies, retentions and costs — and the most common Azure Monitor mistake is treating them as interchangeable.
This article gives you that mental model and nothing you do not need as a beginner. You will learn what a metric, a log and a trace each are, where each is collected, where each lives, how long it survives, and roughly what it costs — so the next time you face a slow endpoint or wire up your first alert, you know which signal to reach for and which blade to open. We keep it concrete with real table names, units, free-tier limits and a few az/Bicep snippets, but the goal is the map, not the manual.
What problem this solves
Before you have this map, three predictable things go wrong, and they cost real money and real hours.
First, you look in the wrong place and conclude the data does not exist. A teammate says “we have no logs for that request,” opens the Metrics explorer, sees only numeric charts, and gives up — when the request, its exception and full call stack were sitting in Application Insights the whole time, one KQL query away. The data was captured; the searcher opened the store that does not hold it.
Second, you turn on everything and get a surprise bill. Diagnostic settings make it trivial to fire-hose every resource log into Log Analytics. The logs store is billed per gigabyte, so a single chatty firewall or activity log left at full verbosity can quietly add thousands of rupees a month. People who know that metrics are free but logs are paid-by-the-GB make much cheaper choices about what to collect.
Third, you build fragile or expensive alerts. A metric alert is cheap, fast and near-real-time; a log-query alert runs a scheduled KQL search billed per execution. A beginner will write a log-search alert for something a metric alert handles for free, or expect a log alert to fire in five seconds when its evaluation interval is five minutes. Knowing which signal an alert sits on is the difference between reliable and slow-and-costly.
Who hits this? Everyone who runs anything on Azure. The moment you deploy a VM, App Service, AKS cluster or Function, Azure emits platform metrics for free and offers to collect logs. Every team must decide what to keep, where it goes, how long to hold it and what to pay — decisions that are impossible to make well without this map.
Learning objectives
By the end of this article you can:
- Explain in one sentence each what a metric, a log and a trace is, and how they differ in shape, latency and cost.
- Name the two stores behind Azure Monitor — the metrics time-series database and the Log Analytics workspace — and state which signal lands in which.
- Describe how each signal is collected: platform metrics and platform logs for free vs. resource logs routed by a diagnostic setting, and app telemetry sent by the Application Insights SDK or auto-instrumentation.
- Read a diagnostic setting and say what it does: which categories it exports and to which destination (Log Analytics, a storage account, or an event hub).
- Pick the right signal for a task: chart and alert on metrics for fast numeric health, query logs/traces for “what exactly happened to this one request.”
- State rough retention defaults (metrics ~93 days; logs configurable, 30 days free in the Analytics tier) and the basic cost model (metrics free to store; logs billed per GB ingested and per GB-month retained).
- Avoid the three classic beginner traps: searching the wrong store, over-collecting logs, and building the wrong kind of alert.
Prerequisites & where this fits
You only need the basics. You should know that Azure resources live in a resource group inside a subscription, that you can run az commands in Cloud Shell, and that “telemetry” just means the data a system emits about itself. No prior Azure Monitor exposure is assumed — this is the on-ramp.
Where this sits: think of it as the first thing to read in the Observability track. It is the conceptual floor under everything else. Once you have this map, the natural next stop is the hands-on, query-heavy companion, Azure Monitor and Application Insights: Full-Stack Observability, which goes deep on writing KQL, building workbooks and instrumenting an app. When a real incident hits a specific service, the troubleshooting deep-dives — for example Troubleshooting Azure App Service: 502/503 Errors, Cold Starts & Restart Loops — show you these signals being read in anger. If you route logs or archives to storage, Azure Storage Account Fundamentals: Blobs, Files, Queues and Tables explains the destination. Knowing where each signal lives is the prerequisite for all of it.
Core concepts
Four ideas carry the entire article. Get these and the rest is detail.
Azure Monitor is a pipeline with two reservoirs. Telemetry flows in from three kinds of source — your Azure resources, your operating systems/agents, and your application code — through a collection layer, and lands in one of two stores. One reservoir is optimised for numbers over time. The other is optimised for rich records you search. Almost every confusion about Azure Monitor dissolves once you know which reservoir a given signal flows into.
A metric is a number, at a time, with dimensions. “CPU was 62% on this VM at 14:03.” Metrics are tiny, they are pre-aggregated into fixed time grains (commonly one minute), and they are stored in a specialised time-series database built for instant charting and fast threshold checks. Because they are small and uniform, they are cheap to store, fast to query, and available within a minute or two of the event — but they carry almost no context. A CPU spike metric will not tell you which request caused it.
A log is a structured event record you query. “At 14:03:11 this HTTP request to /checkout took 8.2s, returned 500, threw SqlException, on instance _3.” Logs are bigger, they keep their detail, and they live in a Log Analytics workspace — a columnar analytics store you interrogate with KQL (Kusto Query Language). Logs are schema-on-read: you do not predefine columns, you query whatever was written. They answer “what exactly happened,” but they cost money to ingest and retain, and they are typically queryable seconds-to-minutes after the event rather than instantly charted.
A trace is a special kind of log for application telemetry. When you instrument an app with Application Insights, each operation (a web request, a background job) becomes a request record, the outbound calls it made become dependency records, errors become exceptions, and your own log lines become traces — all correlated by a shared operation ID so you can reconstruct one user’s journey end to end. Crucially, Application Insights data is stored in a Log Analytics workspace and queried with the same KQL. A “trace” is not a third kind of store; it is application-flavoured data in the logs reservoir.
The whole platform in one table
Here is the map in a single grid. If you remember only one table from this article, make it this one.
| Signal | What it is | Example | Where it LIVES | Query/read with | Typical latency | Cost to store |
|---|---|---|---|---|---|---|
| Metric | Pre-aggregated number over time, with dimensions | Percentage CPU = 62, Http5xx = 3 |
Metrics time-series DB (per resource) | Metrics explorer, metric alerts | ~1–3 min | Free (platform metrics) |
| Log (platform/resource) | Structured event record | A firewall allow/deny, an audit entry | Log Analytics workspace | KQL (Logs blade) | Seconds–minutes | Per GB ingested + retained |
| Trace / app telemetry | Correlated request, dependency, exception, custom trace | A /checkout request with its SQL call |
Log Analytics workspace (via App Insights) | KQL / Transaction search | Seconds–minutes | Per GB ingested + retained |
| Activity log | Control-plane “who did what” | “User X deleted VM Y” | Activity log store (90 days free); exportable to logs | Activity log blade / KQL | Seconds–minutes | Free (90-day view) |
| Change/Resource graph | Inventory & change snapshots | “This NSG rule changed” | Resource Graph / Change Analysis | Resource Graph queries | Minutes | Free (within limits) |
The two rows that matter most are the first two: metrics live in a fast numeric store and are free; logs and traces live in a Log Analytics workspace and are paid. Everything else hangs off that.
Metrics: the fast numeric reservoir
A metric is a stream of pre-aggregated numeric samples for one measurement on one resource, sliced by optional dimensions. “Requests on app shop-web, split by HTTP status code” is one metric (Requests) with one dimension (StatusCode). The platform emits a huge catalogue of these for free the instant a resource exists — no agent, no config, no diagnostic setting.
What makes the metrics store special is what it gives up. By storing only aggregates (min, max, average, total, count) at a fixed time grain, it stays tiny and uniform — so charts render instantly, threshold alerts evaluate in near-real-time, and it costs nothing to keep. The price is no per-event detail: you see that 5xx errors rose, but not the URL, the exception or the user. For that you cross into logs.
There are two flavours of metric worth distinguishing, because they behave differently:
| Metric type | Source | Setup required | Retention | Notes |
|---|---|---|---|---|
| Platform metrics | Emitted by the Azure resource itself | None — automatic | ~93 days (rolling) | Free; the CPU/requests/IOPS graphs you see by default |
| Custom metrics | Sent by your app/agent (App Insights, OTel, Azure Monitor Agent) | SDK or agent config | ~93 days | Small per-metric charge beyond a free allotment |
A few concrete anchors so the abstraction has edges:
| Property | Reality for metrics | Why it matters to you |
|---|---|---|
| Standard time grain | 1 minute (some at finer/coarser grains) | Sub-minute spikes get averaged away |
| Default platform retention | ~93 days | Older numeric history is gone unless you exported it |
| Aggregations | Avg, Min, Max, Sum (Total), Count | Pick the right one — averaging a count hides bursts |
| Dimensions | Split a metric by a property (status, instance) | Lets you chart “5xx by instance” without logs |
| Multi-resource charts | Chart one metric across many resources | Fleet-wide CPU in a single graph |
You reach metrics through the Metrics explorer, where you pick a resource (the scope), a metric, an aggregation and optionally a dimension to split by. To list what a resource emits and read a value from the CLI:
# What metrics does this resource emit?
az monitor metrics list-definitions \
  --resource $(az webapp show -n shop-web -g rg-shop --query id -o tsv) \
  --query "[].{name:name.value, unit:unit}" -o table

# Read the last hour of HTTP 5xx counts, 1-minute grain
az monitor metrics list \
  --resource $(az webapp show -n shop-web -g rg-shop --query id -o tsv) \
  --metric Http5xx --interval PT1M --aggregation Total -o table
The mental shortcut: metrics answer “how much / how many / how fast, right now and over time.” If your question is numeric and you want it charted or alerted instantly and for free, it is a metrics question.
Logs: the rich, queryable reservoir
A log is a structured event written as a row into a Log Analytics workspace — the second store, and the one that costs money. Where a metric is a number, a log row is a record with many columns: a timestamp, the resource, and whatever fields that event type carries. A workspace holds dozens of tables, each named for what it stores, queried with KQL.
The workspace is schema-on-read and columnar — built to ingest heterogeneous events cheaply and let you slice them after the fact with fast queries that filter, aggregate and join across tables. That flexibility is why logs carry the context metrics lack, and why they are billed by the gigabyte: you pay to store and index rich detail.
You will meet a small set of tables constantly. Knowing them by name removes most of the mystery:
| Table | What lands in it | Comes from |
|---|---|---|
AzureActivity |
Control-plane operations (“who created/deleted what”) | Activity log export |
AzureDiagnostics / resource-specific tables |
Resource logs (firewall, gateway, Key Vault, SQL, etc.) | A diagnostic setting on the resource |
AzureMetrics |
Platform metrics routed into logs (optional) | Diagnostic setting (metrics category) |
Heartbeat |
Agent liveness pings | Azure Monitor Agent |
Perf / InsightsMetrics |
OS performance counters | Azure Monitor Agent (VM/Container Insights) |
requests, dependencies, exceptions, traces |
Application telemetry | Application Insights SDK/auto-instrumentation |
A first taste of KQL — the same language reads every table. “Show me the failed checkout requests in the last hour and what they threw”:
requests
| where timestamp > ago(1h) and name == "POST /checkout" and success == false
| join kind=leftouter (exceptions | project operation_Id, type, outerMessage) on operation_Id
| project timestamp, resultCode, duration, type, outerMessage
| order by timestamp desc
Two properties of the logs store drive every cost and design decision you will make later:
| Property | Reality for logs | Why it matters to you |
|---|---|---|
| Billing — ingestion | Per GB ingested into the workspace | Verbose categories = real money; collect deliberately |
| Billing — retention | First 30 days included (Analytics tier), then per GB-month | Long retention of big tables adds up |
| Schema | Schema-on-read; many tables, you query columns | No upfront modelling; you filter after the fact |
| Latency | Seconds to a few minutes to be queryable | Not instant; not for sub-second dashboards |
| Query engine | KQL (same as Azure Data Explorer) | One language for resource logs and app traces |
The mental shortcut: logs answer “what exactly happened, to which request, in what detail.” If your question is “show me the actual events,” it is a logs question — and you pay for the privilege, so collect with intent.
Traces and application telemetry: logs with a story
When people say “traces” in an Azure context, they usually mean the rich, correlated telemetry that Application Insights produces for an instrumented app. It deserves its own section because it is where most developers first feel the power of the logs reservoir — and because it is frequently misunderstood as a separate store. It is not. Application Insights data is stored in a Log Analytics workspace (this is the modern “workspace-based” model) and queried with the same KQL.
The magic is correlation. Every piece of telemetry from one logical operation shares an operation_Id, so you can take a single slow web request and pull up the exact downstream SQL call, the cache miss, the exception and the log lines it produced — reconstructing one user’s journey across services. That is what a “trace” buys you that a metric never can: not “latency went up,” but “this request was slow because this dependency took 7 seconds.”
The Application Insights telemetry types map cleanly onto KQL tables:
| Telemetry type | KQL table | What it captures | Beginner use |
|---|---|---|---|
| Request | requests |
One incoming operation (HTTP request, queue trigger) | “Which endpoints are slow or failing?” |
| Dependency | dependencies |
An outbound call (SQL, HTTP, blob, queue) | “Is my DB or a downstream API the bottleneck?” |
| Exception | exceptions |
A captured error with stack | “What threw, and how often?” |
| Trace | traces |
Your own log lines (ILogger/console) | “What did the code log around the failure?” |
| Custom event/metric | customEvents / customMetrics |
App-defined signals | Business events, feature usage |
| Page view / browser | pageViews, browserTimings |
Client-side timing (web) | Real-user front-end performance |
How does this data get in? Either you add the Application Insights SDK to your app, or you enable auto-instrumentation (codeless attach) on supported hosts like App Service and Functions — which captures requests, dependencies and exceptions without code changes. Either way it flows to the connected workspace. The shortcut: traces are application logs with built-in correlation — same store as logs, with a story attached.
How collection actually works: the three on-ramps
The piece that ties metrics and logs together is how the data gets in, and there are exactly three on-ramps. Beginners conflate them; keeping them separate explains why some data appears for free and some only after you configure it.
On-ramp 1 — platform, automatic, free. Every Azure resource emits platform metrics and a stream of platform logs about itself with zero setup. The default CPU, memory, request and IOPS charts you see on any resource come from here. You did nothing and you pay nothing.
On-ramp 2 — diagnostic settings, opt-in, mostly paid. A resource’s richer logs — and optionally its metrics — are not collected anywhere until you create a diagnostic setting that routes named categories to a destination. This is the on-ramp people forget exists, then wonder why “there are no firewall logs.” A diagnostic setting answers two questions: which categories (e.g. FirewallLog, AuditEvent) and to where.
On-ramp 3 — agents and SDKs, for OS and app data. Azure cannot see inside a VM’s OS or your application code by itself. The Azure Monitor Agent collects OS performance counters and event/syslog from VMs (this is what powers VM Insights and Container Insights), and the Application Insights SDK / auto-instrumentation collects the app telemetry from the previous section. Both flow into a Log Analytics workspace.
Here is the same idea as a decision-style grid — read down the “I want…” column:
| I want to collect… | On-ramp | Setup | Lands in | Cost |
|---|---|---|---|---|
| Built-in resource metrics (CPU, requests) | Platform metrics | None | Metrics DB | Free |
| Basic platform health logs | Platform logs | None | Platform (limited) | Free |
| Resource logs (firewall, SQL audit, gateway) | Diagnostic setting | Create setting → pick categories | Log Analytics / storage / event hub | Per GB (if to logs) |
| OS counters, event log, syslog from a VM | Azure Monitor Agent | Install agent + data collection rule | Log Analytics | Per GB |
| App requests, dependencies, exceptions | App Insights SDK / auto-instrument | Add SDK or enable codeless | Log Analytics (App Insights) | Per GB |
| Custom app metrics | App Insights / OTel | SDK call | Metrics DB (+ logs) | Small custom-metric charge |
A diagnostic setting also chooses where the data goes, and the destination changes what you can do with it. This trio is worth memorising:
| Destination | Best for | Query/access | Rough cost driver |
|---|---|---|---|
| Log Analytics workspace | Querying, alerting, dashboards | KQL | Per GB ingested + retained |
| Storage account | Cheap long-term archive, compliance | Download/parse files | Cheap per-GB blob storage |
| Event hub | Streaming to a SIEM or third-party tool | Consumer reads the stream | Event hub throughput units |
To wire resource logs into a workspace from the CLI, you create one diagnostic setting on the resource and point it at the workspace:
# Send a resource's logs + metrics to a Log Analytics workspace
az monitor diagnostic-settings create \
  --name to-law \
  --resource $(az network firewall show -n fw-hub -g rg-net --query id -o tsv) \
  --workspace $(az monitor log-analytics workspace show -g rg-obs -n law-prod --query id -o tsv) \
  --logs    '[{"category":"AzureFirewallApplicationRule","enabled":true}]' \
  --metrics '[{"category":"AllMetrics","enabled":true}]'
The same intent in Bicep, which is how you should do it in production so collection is reproducible:
resource diag 'Microsoft.Insights/diagnosticSettings@2021-05-01-preview' = {
  name: 'to-law'
  scope: firewall                    // the resource emitting logs
  properties: {
    workspaceId: workspace.id        // destination = Log Analytics workspace
    logs: [
      { category: 'AzureFirewallApplicationRule', enabled: true }
      { category: 'AzureFirewallNetworkRule',     enabled: true }
    ]
    metrics: [
      { category: 'AllMetrics', enabled: true }
    ]
  }
}
The shortcut for the whole section: if data appears with no setup it is a platform metric/log; if you had to create a diagnostic setting or install an agent/SDK, it is opt-in and probably billed.
Architecture at a glance
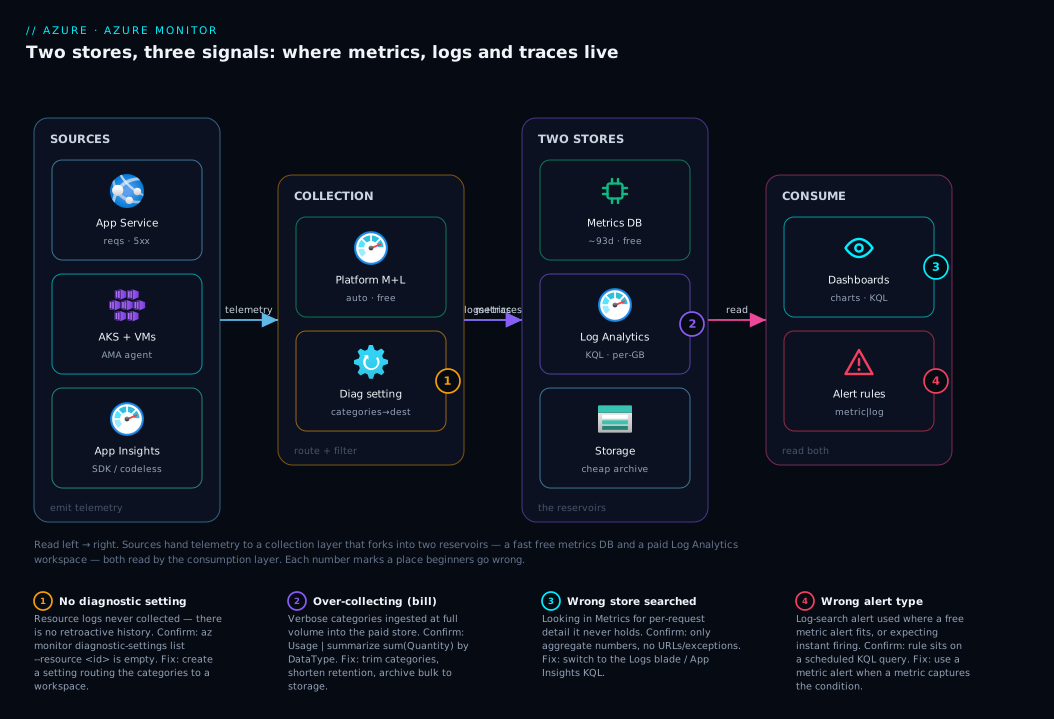
Read the diagram left to right and it tells this article as a flow. On the left are the sources — Azure resources (App Service, AKS, a VNet), the agents inside VMs, and your application code carrying the Application Insights SDK. These do not write to a store directly; they hand telemetry to the collection layer, where platform metrics/logs arrive for free and diagnostic settings plus data collection rules decide which richer categories get routed and where. That layer is the fork in the river.
From the fork the data splits into the two reservoirs at the heart of Azure Monitor. Numeric pre-aggregated samples flow into the metrics time-series database — small, fast, ~93-day retention, free. Rich event records and all correlated Application Insights request/dependency/exception/trace telemetry flow into the Log Analytics workspace — KQL, billed per GB, retention you choose. An optional arrow peels off to a storage account for cheap archive. On the right, the consumption layer reads both: the Metrics explorer and dashboards chart the numeric store, the Logs blade and workbooks query the workspace, and alert rules sit on either — fast metric alerts or scheduled KQL log alerts — firing into action groups. The numbered badges mark the four places beginners go wrong: forgetting the diagnostic setting, over-collecting into the paid store, searching the wrong reservoir, and choosing the wrong alert type.
Real-world scenario
Northwind Retail runs a modest Azure stack: one App Service web app (shop-web), an Azure SQL database, an Azure Firewall fronting a hub VNet, and a couple of VMs for a legacy batch job. When they first set up monitoring, a well-meaning engineer opened diagnostic settings on every resource, ticked every log category and AllMetrics, pointed them all at a brand-new Log Analytics workspace, and left retention at the default. It “worked” — dashboards filled up, queries returned data — and everyone moved on.
Two things surfaced a month later. First, the bill. The workspace had ingested far more than expected, dominated by verbose firewall logs and AzureActivity plus SQL diagnostics at full chat — low tens of thousands of rupees a month for data nobody queried. The fix was not to turn monitoring off but to collect with intent: keep Http5xx, app latency and SQL DTU as metrics (free), keep the security-relevant firewall and SQL-audit categories in logs but drop the chatty informational ones, and send the bulk firewall archive to a storage account instead of the paid workspace. Ingestion dropped by more than half.
Second, an incident taught them the two-store model the hard way. The site started returning intermittent 500s during a flash sale. The on-call engineer opened Metrics, saw Http5xx climbing and SQL DTU at 100%, and correctly concluded the database was the constraint — but “DTU is pinned” did not say why. The answer was in the other reservoir: a KQL query over requests joined to dependencies showed one endpoint issuing a slow, unindexed query thousands of times, and exceptions showed the resulting timeouts. Metrics told them where it hurt in seconds; logs told them what to fix in minutes. They added the missing index, the DTU metric fell, and the alert cleared.
The lesson Northwind wrote into their runbook is the thesis of this article: lead with metrics to localise fast and for free, then cross into logs/traces for the detail — and only pay to collect the logs you will actually query.
Advantages and disadvantages
The two-store design is a deliberate trade-off, and seeing both columns helps you use each store for what it is good at rather than fighting it.
| Metrics store | Logs store (Log Analytics) | |
|---|---|---|
| Strength | Instant charts, near-real-time alerts, free | Full detail, correlation, powerful KQL queries |
| Strength | Tiny footprint; fleet-wide multi-resource views | One language across resource logs + app traces |
| Weakness | No per-event context; aggregates only | Costs money per GB; not instant |
| Weakness | Fixed ~93-day retention; coarse time grain | You must collect deliberately or overspend |
| Best for | “Is it healthy? How much? Alert me fast.” | “What exactly happened to this request?” |
| Reach for it when | Dashboards, SLO health, threshold alerts | Debugging, audits, root-cause, ad-hoc analysis |
When does each matter most? Metrics win for steady-state operations — the always-on health dashboard, the autoscale trigger, the “wake me if 5xx > N” alert. They are free and fast, so use them liberally as your first line. Logs win the moment you need to explain a number — every investigation, every “why,” every audit. The skill is not picking one forever; it is starting in metrics and crossing into logs at exactly the point where “how much” turns into “why.” Teams that overspend usually do so by treating logs as their first line instead of their second.
Hands-on lab
A ten-minute, low-cost tour that makes the two stores concrete. You need an Azure subscription, Cloud Shell, and any existing App Service (or create a free F1 one). Everything here is metrics-first (free) plus a tiny, controllable bit of logs.
1. Read a free platform metric. No setup needed — the data already exists:
APP_ID=$(az webapp show -n shop-web -g rg-shop --query id -o tsv)
az monitor metrics list --resource "$APP_ID" \
  --metric Requests --interval PT1M --aggregation Total -o table
You should see one row per minute with request counts. This is the metrics reservoir, and you paid nothing.
2. See what else the resource emits. Confirm metrics carry no per-request detail:
az monitor metrics list-definitions --resource "$APP_ID" \
  --query "[].name.value" -o tsv | sort
Note the list is all aggregate numbers — no URLs, no exceptions. That gap is what logs fill.
3. Create a Log Analytics workspace (the logs store). Small and cheap; you will delete it at the end:
az group create -n rg-obs-lab -l centralindia
az monitor log-analytics workspace create -g rg-obs-lab -n law-lab
WS_ID=$(az monitor log-analytics workspace show -g rg-obs-lab -n law-lab --query id -o tsv)
4. Route ONE resource’s logs into it with a diagnostic setting. Pick a low-volume resource so the lab stays cheap (here, the App Service itself):
az monitor diagnostic-settings create --name to-lab-law \
  --resource "$APP_ID" --workspace "$WS_ID" \
  --logs '[{"category":"AppServiceHTTPLogs","enabled":true}]'
5. Generate a little traffic, then query the logs store. Hit the app URL a few times in a browser, wait a couple of minutes for ingestion, then run a KQL query:
az monitor log-analytics query --workspace "$WS_ID" \
  --analytics-query "AppServiceHTTPLogs | take 10 | project TimeGenerated, CsMethod, CsUriStem, ScStatus, TimeTaken" \
  -o table
You should see individual HTTP requests with method, path, status and duration — the per-event detail metrics could not give you. You have now read from both reservoirs.
6. Teardown — delete everything so there is no ongoing cost:
az monitor diagnostic-settings delete --name to-lab-law --resource "$APP_ID"
az group delete -n rg-obs-lab --yes --no-wait
What you proved: metrics are free, instant and numeric; logs require a destination (the workspace) and a route (the diagnostic setting), cost per GB, and carry the detail. That round trip is the entire mental model in five commands.
Common mistakes & troubleshooting
The failures here are almost never “Azure Monitor is broken” — they are “I read the wrong store” or “I never turned collection on.” Match your symptom to the row.
| # | Symptom | Root cause | How to confirm | Fix |
|---|---|---|---|---|
| 1 | “There are no logs for this resource” | No diagnostic setting routing its categories anywhere | az monitor diagnostic-settings list --resource <id> returns empty |
Create a diagnostic setting to a workspace (see above) |
| 2 | Metrics explorer shows numbers but “no log detail” | Looking in the metrics store for per-event data | You are in Metrics, not the Logs blade | Switch to Logs/KQL or Application Insights |
| 3 | App Insights “Failures” view is empty | App not instrumented (no SDK / auto-instrument off) | No rows in requests/exceptions tables |
Enable App Insights SDK or codeless attach |
| 4 | Surprise Log Analytics bill | Over-collection: verbose categories ingested at full volume | Usage | summarize sum(Quantity) by DataType (top tables) |
Trim categories; archive bulk to storage; cap retention |
| 5 | Log query returns nothing for “just now” | Ingestion latency; data not queryable yet | Same query for ago(15m) returns rows |
Allow seconds–minutes; do not expect instant |
| 6 | Old data missing in Metrics | Beyond the ~93-day metric retention window | Time range older than ~93 days | Export to logs/storage before you need history |
| 7 | Metric alert “never fires” but logs show errors | Alert sits on a metric that does not capture the condition | Check which metric/dimension the rule uses | Use the right metric, or a log-search alert on the table |
| 8 | Two teams see different data for one app | Telemetry split across multiple workspaces | Resources point diagnostic settings at different workspaces | Consolidate to a shared workspace (or a clear design) |
The single most common one is #1: someone expects resource logs that were never collected. Resource logs do not exist until a diagnostic setting creates them — there is no retroactive history. The second most common is the cost surprise in #4; the Usage table is your friend for finding which DataType is eating the budget.
Best practices
- Lead with metrics, finish with logs. Use free, fast metrics for health and alerting; cross into logs/traces only when you need the “why.” It is faster and cheaper.
- Collect logs with intent. Every diagnostic-setting category you enable into a workspace is paid per GB. Turn on what you will query; leave the rest off or send it to a storage account.
- Centralise on a small number of workspaces. One (or a few) well-chosen Log Analytics workspaces beats a sprawl — correlation and queries get far easier. Avoid one-workspace-per-resource by accident.
- Use a workspace-based Application Insights resource. It puts app telemetry in the same KQL world as your resource logs, so you can join across them.
- Right-size retention per data type. Keep the included 30 days for most tables; extend only the few you genuinely need long, and archive bulk/compliance data to cheaper storage.
- Prefer metric alerts when a metric captures the condition. They are near-real-time and cheaper than scheduled log-search alerts; reserve log alerts for conditions only a query can express.
- Define collection in Bicep/Terraform, not by clicking. Diagnostic settings and workspaces are infrastructure; make them reproducible and reviewable.
- Watch the
Usagetable. A weekly glance at ingestion byDataTypecatches a runaway log before it becomes a bill. - Name and tag observability resources clearly (
law-prod,appi-shop-web) so the next person knows what feeds what. - Document which signal answers which question in your runbook, so on-call opens the right store at 2 a.m.
Security notes
Observability data is sensitive, and the controls are mostly about access and destination.
- Treat logs as confidential. Request URLs, headers, exception messages and audit events can contain personal data, tokens or internal structure. A Log Analytics workspace is a security boundary — scope access to it with Azure RBAC (e.g. Log Analytics Reader vs Contributor), and prefer resource-context access so app teams see only their own resources’ data.
- Avoid logging secrets. The fastest way to leak a credential is to log it. Keep secrets in Key Vault (see Azure Key Vault: Secrets, Keys and Certificates Done Right) and scrub them from telemetry; do not let exception payloads dump connection strings.
- Use managed identity for ingestion where possible. Application Insights now supports Entra-authenticated (managed-identity) ingestion instead of a bare instrumentation key, removing a long-lived secret from your app config.
- Mind data residency. A workspace lives in a region; route logs to a workspace in a compliant region, and use storage-account destinations with the right redundancy for archives.
- Protect the audit trail. The Activity log (control-plane “who did what”) is your forensic record. Export it to a workspace or immutable storage so it survives even if a resource is deleted.
- Lock down action groups. Alert action groups can call webhooks, run automation and email people — review who can edit them, since they are an execution path.
Cost & sizing
The cost model is the practical payoff of the two-store map: metrics are essentially free, logs are the line item. Here is what actually drives the bill and how to keep it sane.
| Cost driver | Store | How you are billed | How to control it |
|---|---|---|---|
| Platform metrics | Metrics DB | Free | Use freely; no action needed |
| Custom metrics | Metrics DB | Small charge beyond a free allotment | Avoid high-cardinality custom metrics |
| Log ingestion | Log Analytics | Per GB ingested (dominant cost) | Collect only needed categories; filter at source |
| Log retention | Log Analytics | First 30 days free, then per GB-month | Shorten retention; archive cold data to storage |
| Application Insights | Log Analytics | Per GB (same model) + optional sampling | Enable sampling; instrument what matters |
| Archive to storage | Storage account | Cheap per-GB blob | Send bulk/compliance logs here, not to logs |
| Log-search alerts | Alerting | Per rule evaluation | Use metric alerts where they suffice |
Right-sizing levers, cheapest-first:
| Lever | What it saves | Trade-off |
|---|---|---|
| Keep numeric health as metrics | Avoids paying to log what a free metric already shows | None for steady-state monitoring |
| Trim diagnostic categories | Cuts ingestion at the source | Less verbose detail if you later need it |
| Enable App Insights sampling | Reduces ingested telemetry volume | Some individual traces dropped (aggregates stay) |
| Shorten retention per table | Lowers GB-month retention cost | Shorter look-back window |
| Archive to storage, not logs | Blob is far cheaper than workspace GB | Archived data isn’t KQL-queryable live |
| Commitment tiers (at scale) | Lower effective per-GB rate at high volume | Only worth it past a daily-ingestion threshold |
Free-tier anchors worth knowing as a beginner: platform metrics are free, a Log Analytics workspace includes the first 30 days of retention in the Analytics tier, and Application Insights bills on the same per-GB logs model (so sampling is your main volume control). The rough INR intuition: a small app on free platform metrics and a couple of gigabytes a month of logs sits in the low hundreds of rupees; the way that becomes thousands is always the same — somebody turned on verbose logs for everything. If you are also wiring up budgets to catch this, Azure Cost Management for Beginners: Budgets, Alerts and Cost Analysis in Your First 30 Days shows you how.
Interview & exam questions
Q1. What are the two stores behind Azure Monitor and what does each hold? A specialised metrics time-series database for pre-aggregated numeric data, and a Log Analytics workspace for rich, queryable event and trace records. Metrics are free, fast and numeric; logs are billed per GB and carry detail. (AZ-104 / AZ-204 observability.)
Q2. How does a metric differ from a log? A metric is a small, pre-aggregated number at a time grain with optional dimensions, stored for instant charting and near-real-time alerting. A log is a structured event record with full context, queried with KQL. Metrics tell you how much; logs tell you what exactly happened.
Q3. Where are Application Insights traces stored, and how do you query them?
In a Log Analytics workspace (workspace-based App Insights), queried with KQL across tables like requests, dependencies, exceptions and traces, correlated by operation_Id. A “trace” is application telemetry in the logs store, not a separate database.
Q4. A teammate says “there are no logs for our firewall.” What is the most likely cause? No diagnostic setting has been created to route the firewall’s log categories to a workspace, so they were never collected. Resource logs do not exist retroactively — create the diagnostic setting going forward.
Q5. What does a diagnostic setting do? It routes a resource’s resource logs and optionally its metrics — chosen by category — to one or more destinations: a Log Analytics workspace (for KQL), a storage account (for cheap archive), or an event hub (for streaming to a SIEM).
Q6. Why might a Log Analytics bill be unexpectedly high?
Over-collection: verbose log categories ingested at full volume. Log Analytics bills per GB ingested (plus retention beyond 30 days). Use the Usage table to find the top DataType and trim categories or shorten retention.
Q7. When should you use a metric alert vs. a log-search alert? Use a metric alert when a metric already captures the condition — it is near-real-time and cheaper. Use a log-search alert when only a KQL query can express the condition (e.g. a specific exception pattern across tables); it runs on a schedule and is billed per evaluation.
Q8. How long are platform metrics retained by default? About 93 days. For longer history you must export — e.g. route metrics into a Log Analytics workspace or a storage account before the window passes.
Q9. What are the three destinations a diagnostic setting can target, and when do you pick each? Log Analytics (query/alert/dashboard with KQL), storage account (cheap long-term/compliance archive), event hub (stream to third-party/SIEM). Pick by what you need to do with the data.
Q10. What is the difference between platform metrics and custom metrics? Platform metrics are emitted automatically by the resource for free. Custom metrics are sent by your app or an agent (App Insights, OpenTelemetry, Azure Monitor Agent) and carry a small charge beyond a free allotment.
Q11. Your CPU metric shows a spike but not why. What do you do next?
Cross from the metrics store into the logs/traces store: query requests/dependencies/exceptions (or resource logs) for the same time window to find the operation responsible. Metrics localise; logs explain.
Q12. What is the Activity log and where does it live? It is the control-plane record of “who did what” to Azure resources (create/delete/modify), retained for 90 days for free and exportable to a workspace or storage for longer retention and KQL access. It is distinct from resource logs (data-plane).
Quick check
- You need to chart request count over the last hour, instantly and for free. Which store?
- A resource’s rich logs are not appearing in your workspace. What did you most likely forget to create?
- Where is Application Insights
requests/exceptionsdata physically stored? - Which store is billed per GB ingested?
- Roughly how long are platform metrics retained by default?
Answers
- The metrics time-series store (via the Metrics explorer) — pre-aggregated, instant, free.
- A diagnostic setting routing the resource’s log categories to the Log Analytics workspace. Without it, those logs are never collected.
- In a Log Analytics workspace (workspace-based Application Insights), queried with KQL.
- The Log Analytics (logs) store — per GB ingested, plus retention beyond the included 30 days.
- About 93 days.
Glossary
- Azure Monitor — Azure’s umbrella observability platform spanning metrics, logs, traces, alerts and dashboards over two underlying stores.
- Metric — A pre-aggregated numeric sample for one measurement on a resource, at a time grain, with optional dimensions; stored in the metrics time-series database.
- Log — A structured event record stored as a row in a Log Analytics workspace and queried with KQL.
- Trace — Correlated application telemetry (requests, dependencies, exceptions, custom traces) produced by Application Insights; stored in the logs reservoir.
- Log Analytics workspace — The columnar, schema-on-read analytics store (Kusto engine) that holds logs and Application Insights data; billed per GB.
- KQL (Kusto Query Language) — The query language for Log Analytics and Azure Data Explorer; one language for resource logs and app traces.
- Application Insights — The application-performance-monitoring feature of Azure Monitor; collects app telemetry via SDK or auto-instrumentation into a workspace.
- Diagnostic setting — Configuration on a resource that routes named log/metric categories to Log Analytics, a storage account, or an event hub.
- Platform metrics — Numeric telemetry emitted automatically and freely by every Azure resource.
- Resource logs — A resource’s detailed logs, collected only when a diagnostic setting routes them somewhere.
- Azure Monitor Agent — The agent that collects OS performance counters, events and syslog from VMs into a workspace.
- Activity log — The control-plane record of operations on Azure resources (“who did what”), retained 90 days for free.
- Action group — A reusable set of notification/automation targets (email, SMS, webhook, runbook) that an alert fires into.
- Time grain — The fixed interval (commonly one minute) at which metric samples are aggregated.
- Operation ID — The correlation identifier that ties all telemetry from one logical operation together in Application Insights.
Next steps
- Go hands-on with KQL, workbooks and instrumentation in Azure Monitor and Application Insights: Full-Stack Observability.
- See these signals read during a live incident in Troubleshooting Azure App Service: 502/503 Errors, Cold Starts & Restart Loops.
- Understand the storage destination for log archives in Azure Storage Account Fundamentals: Blobs, Files, Queues and Tables.
- Put guardrails on the logs bill with Azure Cost Management for Beginners: Budgets, Alerts and Cost Analysis in Your First 30 Days.
- Keep telemetry secrets out of logs with Azure Key Vault: Secrets, Keys and Certificates Done Right.