You deployed a virtual machine, or an App Service, or a SQL database, and it is humming along. Then one Tuesday the CPU pins at 100%, the disk fills, or the app stops responding — and the first you hear about it is a customer email three hours later. Nobody was watching, because watching a dashboard by hand is not a plan. The fix is an alert: a small rule that watches one number on one resource and, the moment that number crosses a line you drew, reaches out to you by email, text message, or a push to your phone. In Azure that rule is a metric alert, and the thing it reaches out through is an action group. This article gets you from “nothing is watching” to “my phone buzzes when CPU is too high” — properly, the way you’d set it up at work.
We will build the simplest useful alerting setup that exists and still covers the real moving parts: one action group that fans a single notification out to email, SMS and the Azure mobile app push, and one metric alert rule that fires when a VM’s CPU stays above 80% for five minutes. You will do the whole thing three ways — clicking through the Azure portal (so you understand every field), running it with the az CLI (so you can repeat it in seconds), and declaring it as Bicep (so it lives in source control and deploys identically every time). Every step tells you what to type, what you should see back, and how to prove it actually works by forcing a real notification.
By the end you will not just have a working alert — you will understand why an alert has two halves (the rule that detects, the action group that notifies), what an alert processing rule and a signal and an alert state are, what each notification channel costs and how fast it arrives, and the handful of mistakes (a wrong scope, an unverified phone, a fired rule with no action group attached) that make a brand-new alert silently do nothing. This is Azure’s most fundamental operational safety net. Set it up once here and you will copy the pattern onto every resource you ever run.
What problem this solves
Cloud resources fail quietly. A VM does not phone you when its CPU saturates; a managed disk does not announce that it is 95% full; an App Service does not text you when its HTTP queue backs up. The telemetry exists — Azure Monitor collects platform metrics from nearly every resource automatically, for free, with no agent — but a metric sitting in a chart helps no one at 2 a.m. The gap between “the data is being collected” and “a human finds out in time to act” is exactly what alerting closes.
What breaks without it: you find out about incidents from your users instead of your monitoring — late, after the damage (a full disk that corrupted writes, a saturated VM that dropped requests). Teams without alerts compensate by staring at a dashboard, which does not scale and does not cover nights and weekends. The first real sign of operational maturity on any cloud is not a fancy dashboard; it is a working alert that pages a human before the customer notices.
Who hits this: everyone running anything in production, but hardest on small teams and solo operators with no NOC watching screens, and on cost-sensitive workloads where one misbehaving resource is an emergency. The fix is cheap and fast — platform metrics cost nothing, a rule costs a few rupees a month, email and push are free. An afternoon of setup buys you nights of sleep.
To frame the whole field before we build, here is what each piece of the alerting machine is and the one job it does:
| Piece | What it is | Its one job | Who/what triggers it |
|---|---|---|---|
| Metric | A number Azure samples over time (e.g. Percentage CPU) |
Describe resource health | The resource emits it automatically |
| Metric alert rule | A rule: this metric, on this scope, crossing this threshold | Detect the bad condition | The metric crossing the line |
| Alert | The record created when a rule fires | Represent one firing | The rule evaluating to true |
| Action group | A named bundle of notifications + actions | Notify and/or act | An alert that references it |
| Notification | Email / SMS / push / voice to a person | Reach a human | The action group running |
| Action | An automated response (webhook, Function, Logic App) | Do something programmatic | The action group running |
Learning objectives
By the end of this article you can:
- Explain the two halves of an Azure alert — the metric alert rule that detects and the action group that notifies — and why they are separate, reusable objects.
- Create an action group with email, SMS and Azure-mobile-app push receivers in the portal, with
az, and as Bicep. - Create a metric alert rule on a VM’s
Percentage CPUwith a sensible threshold, aggregation, evaluation window and severity. - Read and set every important field on the rule: signal, aggregation type, operator, threshold, aggregation granularity, evaluation frequency, severity and auto-mitigate.
- Choose between static and dynamic thresholds and know when each fits a beginner’s workload.
- Force a real test notification so you can prove email, SMS and push all arrive before you rely on them.
- Avoid the classic first-timer failures: wrong scope, unverified SMS number, rule created without an action group, and a too-twitchy threshold that floods you.
- Tear the whole thing down cleanly so a learning exercise leaves no cost behind.
Prerequisites & where this fits
You need an Azure subscription (the free tier is fine — everything here fits inside it), and a resource to watch. We use a virtual machine because its Percentage CPU metric is the easiest to force, but the exact same pattern works on App Service, SQL, Storage and almost everything else. You should be able to open Azure Cloud Shell (the in-browser terminal at shell.azure.com) or have the az CLI installed locally and signed in with az login. No prior monitoring knowledge is assumed; if you have ever read a CPU chart in the portal, you are ready.
This sits at the very start of the Observability & Operations track — it is the first thing you set up after you deploy anything. It pairs naturally with deployment basics like Deploy Your First Azure VM: Portal, CLI and Step by Step (you need a resource before you can alert on it) and is the foundation under the broader Azure Monitor and Application Insights: Full-Stack Observability deep dive, which goes further into logs, dashboards and KQL once you have the alerting basics here. The same action-group object you build here is reused by Set Up Azure Budgets: Threshold Alerts to Email, Action Groups, and Automation for cost alerts — proof that action groups are a build-once, reuse-everywhere primitive.
Here is where alerting fits among the Azure Monitor signal types, so you know what kind of alert you are building and what the others are for:
| Alert type | Watches | Latency | Cost shape | Use it for |
|---|---|---|---|---|
| Metric alert (this article) | A platform/custom metric vs a threshold | Near real-time (~1 min) | Per rule + per time-series | CPU, memory, disk, latency, throughput |
| Log search alert | A KQL query over log data | Minutes (query interval) | Per rule + query cost | Anything in logs: errors, traces, joins |
| Activity log alert | Control-plane events | Near real-time | Free | Resource created/deleted, service health |
| Resource health alert | Azure’s own health signal for the resource | Near real-time | Free | “Azure says this resource is degraded” |
Metric alerts are the right starting point because they are cheap, fast, and need no logging set up first — the metric is already there.
Core concepts
Five ideas make every later step obvious.
An alert has two halves, and they are deliberately separate. Half one is the alert rule — the detector. It says “watch Percentage CPU on this VM; if the 5-minute average goes over 80%, you have a condition.” Half two is the action group — the responder. It says “when something tells me to fire, email these people, text this number, push to this phone.” The rule does not contain the notification details, and the action group does not contain the threshold. They are separate so you can reuse one action group across dozens of rules (build your on-call contact list once) and so you can change who gets notified without touching any rule. A rule with no action group attached will detect a problem and tell absolutely no one — this is the single most common beginner mistake.
A metric alert evaluates a time-series, not an instant. It does not fire because CPU touched 80% for one second. You choose an aggregation (average, max, min, total, count) and a window (e.g. 5 minutes), and the rule fires when the aggregate over that window crosses your threshold. “Average CPU over 5 minutes > 80%” is far more stable than “CPU > 80% right now,” which would fire on every transient spike and train you to ignore alerts. Picking the aggregation and window is most of the art of a good alert.
A signal is just the specific metric the rule watches. When the portal asks you to “select a signal,” it means “which metric?” — for a VM, Percentage CPU, Available Memory Bytes, Network In Total, OS Disk IOPS Consumed Percentage, and so on. The available signals depend on the resource type. Picking the signal is step one of building any metric alert.
An alert has a lifecycle: it fires, then it resolves. When the condition becomes true the alert moves to Fired; Azure can auto-mitigate it — move it back to Resolved — once the metric drops under the threshold for a while. That is why you don’t get a fresh alert every minute the CPU stays high: one alert covers the whole episode.
Severity is a number from 0 to 4, and it is yours to assign. Sev 0 is Critical, Sev 4 is Verbose — Azure does not decide importance; you label each rule. It drives nothing technical by default, but it lets you filter, route and prioritise, and alert processing rules can act on it (e.g. suppress non-critical alerts during maintenance). Set it deliberately.
The vocabulary in one table
Pin down every moving part before the build. The glossary repeats these for lookup; this is the mental model side by side:
| Term | One-line definition | Where you set it | Why it matters |
|---|---|---|---|
| Metric | A number sampled over time | Emitted by the resource | The raw signal you alert on |
| Signal | The specific metric a rule watches | Alert rule → Condition | Wrong signal = watching the wrong thing |
| Scope | The resource(s) the rule applies to | Alert rule → Scope | Wrong scope = silent or noisy alert |
| Aggregation | How samples combine (avg/max/min/total/count) | Condition | Avg vs Max changes when it fires |
| Aggregation granularity | The window the aggregation covers | Condition | Short = twitchy; long = slow to fire |
| Evaluation frequency | How often the rule is checked | Condition | How fast you find out |
| Threshold | The line the metric must cross | Condition | The trigger value |
| Operator | Greater/less than, etc. | Condition | Direction of the trigger |
| Severity | 0 (Critical) – 4 (Verbose) | Alert rule → Details | Prioritisation and routing |
| Auto-mitigate | Auto-resolve when condition clears | Alert rule → Details | One alert per episode, not per minute |
| Action group | Bundle of notifications + actions | Standalone object | The thing that actually notifies you |
| Receiver | One destination in an action group | Action group | Email/SMS/push/voice/webhook target |
How a metric alert is built, field by field
When you create a metric alert rule — in any of the three tools — you are filling in the same handful of fields. Understand them once and the portal, CLI and Bicep all become the same form in different clothes. Here is every field that matters, what it does, the sane default for a first alert, and the gotcha:
| Field | What it controls | Beginner-sane value | Gotcha / limit |
|---|---|---|---|
| Scope | Which resource(s) the rule watches | The single VM you created | A metric alert’s scope must be resources of one type; pick the VM, not the resource group, to start |
| Signal | Which metric | Percentage CPU |
Available signals depend on resource type |
| Aggregation type | avg / max / min / total / count | Average |
Maximum fires on any spike — usually too noisy for CPU |
| Operator | Greater than, Less than, etc. |
Greater than |
For “available memory” you’d use Less than |
| Threshold value | The number to cross | 80 (percent) |
Too low = constant noise; too high = misses real trouble |
| Aggregation granularity (period) | Window each evaluation aggregates | 5 minutes |
Must be ≥ the metric’s native grain (1 min for CPU) |
| Frequency of evaluation | How often the rule runs | 1 minute |
Lower frequency = cheaper but slower to fire |
| Threshold type | Static vs dynamic | Static to start |
Dynamic needs history to learn a baseline |
| Severity | 0–4 importance label | 2 (Warning) for an 80% CPU rule |
Reserve Sev 0/1 for true pages |
| Auto-mitigate | Auto-resolve when clear | Enabled |
Disable only if you want manual close |
| Action group(s) | Who/what gets notified | Your new action group | Forgetting this = a rule that notifies no one |
| Alert rule name | Identifier | alert-vm-cpu-high |
Make it describe the condition |
Three of these decide whether your alert is useful or noisy: threshold type, aggregation, and severity.
Static vs dynamic thresholds
A static threshold is a fixed number you choose (“fire over 80%”) — predictable and the right choice for your first alert and for metrics with a clear meaning (CPU percent, disk percent, queue length). A dynamic threshold asks Azure Monitor to learn the normal pattern of the metric from history and fire when the value departs from that band — useful when “normal” varies by time of day. Dynamic needs history to train, so start static and graduate later.
| Aspect | Static threshold | Dynamic threshold |
|---|---|---|
| You provide | An exact number (e.g. 80) | A sensitivity (Low/Medium/High) |
| Best for | Metrics with a clear “bad” value | Metrics whose normal varies over time |
| Needs history | No | Yes (learns a baseline) |
| Predictability | Total — you know the line | Adapts; can shift as it learns |
| First-alert choice | Yes, start here | Later, once you know the workload |
Aggregation type and window — why “average over 5 minutes”
The aggregation type decides which number over the window you compare to the threshold. Average smooths spikes — a CPU that hits 100% for two seconds inside a 5-minute window averages out and does not fire, which is what you want for “is this VM genuinely overloaded?” Maximum fires if any sample crossed the line — right for latency SLAs, far too jumpy for CPU. The window trades sensitivity for stability: 1 minute reacts fast but flaps; 15 minutes is steady but slow. Five minutes is the conventional starting point.
| Aggregation | Fires when… | Good for | Bad for |
|---|---|---|---|
| Average | The mean over the window crosses | CPU, memory % — sustained load | Catching brief spikes |
| Maximum | Any sample in the window crosses | Latency SLAs, peak detection | CPU (far too noisy) |
| Minimum | The lowest sample crosses | “Available memory never dropped below X” | Most “too high” alerts |
| Total | The sum over the window crosses | Counts: requests, messages, bytes | Percentages (sum is meaningless) |
| Count | The number of samples crosses | Sample-presence checks | Value-based thresholds |
Severity — what the five levels mean
Severity is a label you assign and then use for filtering, routing and suppression. There is no built-in escalation tied to it by default; the discipline is yours. A reasonable convention:
| Severity | Name | Use it for | Typical channel |
|---|---|---|---|
| Sev 0 | Critical | Customer-facing outage, data loss risk | SMS + push + voice (wake someone) |
| Sev 1 | Error | Serious degradation, imminent breach | SMS + push |
| Sev 2 | Warning | Worth attention soon (80% CPU) | Email + push |
| Sev 3 | Informational | FYI, no action needed yet | |
| Sev 4 | Verbose | Diagnostic noise, dashboards only | Often no notification |
Inside an action group: receivers and limits
An action group is just a named list of receivers (people-facing notifications) and actions (machine-facing automation). One alert can reference up to a handful of action groups; one action group can be referenced by many alerts. This is the object you invest in once — your on-call email, your SMS number, your phone’s push registration — and then attach everywhere.
Here is every receiver/action type an action group supports, with the real per-action-group limits so you do not design something Azure will reject:
| Receiver / action | What it does | Per-action-group limit | Notes |
|---|---|---|---|
| Sends an email to an address | Up to 1,000 email actions | Free; arrives in seconds; no verification needed | |
| SMS | Texts a phone (country code + number) | Up to 10 SMS actions | Charged per message; rate-limited (see below) |
| Azure app push | Push to the Azure mobile app | Up to 10 push actions | Free; needs the app + your Azure account signed in |
| Voice | Phone call with a spoken message | Up to 10 voice actions | Charged; best reserved for Sev 0 |
| Webhook | HTTP POST to a URL | Up to 10 webhook actions | For ChatOps, custom endpoints |
| Azure Function | Invokes a Function | Up to 10 function actions | Run code in response |
| Logic App | Triggers a Logic App | Up to 10 logic app actions | Low-code workflows (tickets, Teams) |
| Automation Runbook | Runs an Azure Automation runbook | Up to 10 runbook actions | Auto-remediation (restart, scale) |
| ITSM | Creates a ticket in a connected ITSM tool | Up to 10 ITSM actions | ServiceNow etc. via connector |
| Event Hub | Streams the alert to an Event Hub | Up to 10 | Fan-out to external systems |
| Secure webhook | Webhook with Entra ID auth | Up to 10 | Authenticated endpoints |
For notifications specifically, the practical differences — speed, cost, and what the recipient needs — decide which channel you put on which severity:
| Channel | Typical arrival | Cost | Recipient needs | Best for |
|---|---|---|---|---|
| Seconds | Free | An inbox | Everything; the default | |
| Azure app push | Seconds | Free | Azure mobile app, signed in | A free “buzz my phone” |
| SMS | Seconds–minutes | Per message (small) | A phone with the right country code | Sev 0/1 escalation |
| Voice | ~1 minute | Per call (higher) | A phone that answers | True wake-me pages |
There are rate limits that protect you from a notification storm, and you should know them because hitting one means messages get dropped, not queued forever:
| Channel | Rate limit (per action group) | What happens when exceeded |
|---|---|---|
| SMS | No more than 1 SMS every ~5 minutes per phone number | Excess SMS suppressed; an email is sent noting the rate limit |
| Voice | No more than 1 voice call every ~5 minutes per number | Excess calls suppressed |
| No more than ~100 emails in an hour to one address | Excess suppressed with a notice | |
| Push | Generous; effectively not a concern for one alert | — |
The lesson: never put a flapping, high-frequency rule on SMS — you will hit the rate limit, real messages will be dropped, and you will get an email about it instead. Tune the rule to be stable first.
Architecture at a glance
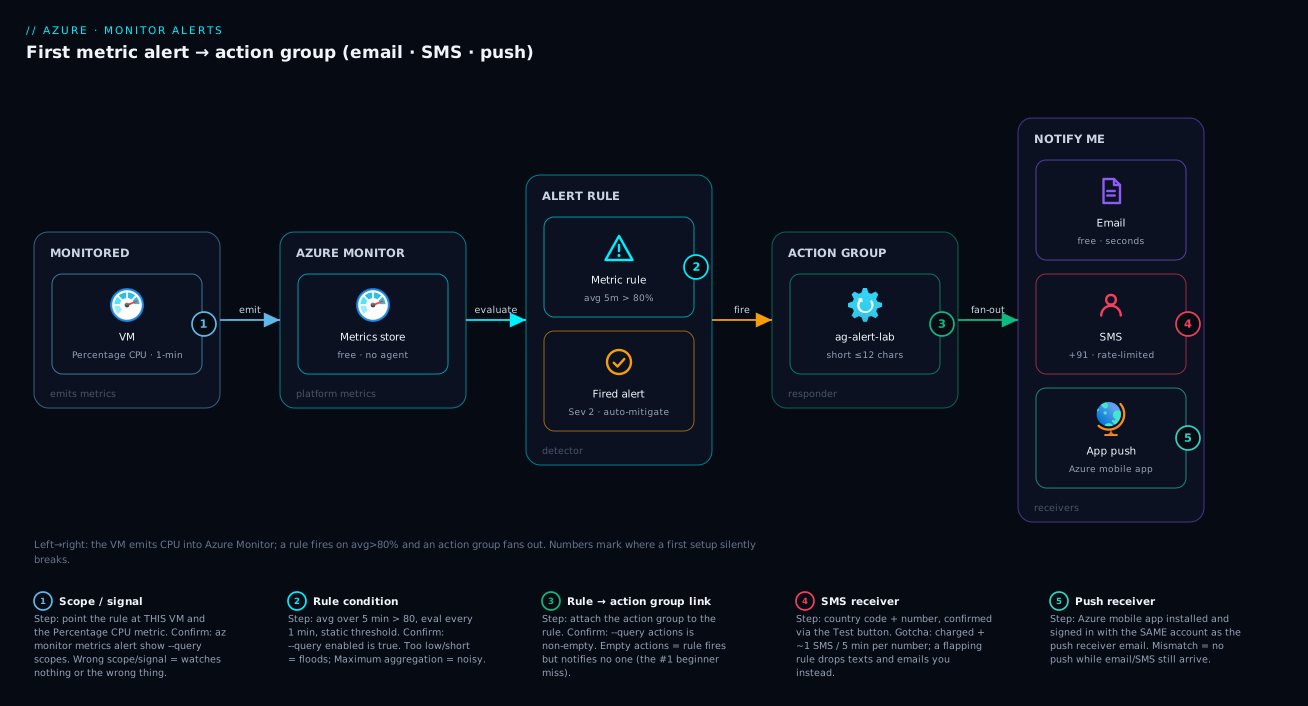
Walk the path of a single alert from metric to your pocket. On the left, your monitored resource — the VM — continuously emits platform metrics into Azure Monitor; Percentage CPU is sampled roughly once a minute, automatically, with no agent. In the middle, your metric alert rule wakes up on its evaluation frequency (every minute), takes the last 5 minutes of Percentage CPU, computes the average, and compares it to your threshold of 80. While the average stays under 80 the rule is quiet and the alert state is Resolved. The instant the 5-minute average crosses 80 the rule fires: Azure creates an alert record (state Fired, severity Sev 2) and looks at the rule’s attached action group.
On the right, the action group fans that single firing out to every receiver it holds — an email lands in your inbox in seconds, an SMS hits your phone, and a push notification buzzes the Azure mobile app — all carrying the same payload: which resource, which metric, the value that breached, and a deep link back to the alert. When CPU later falls back under 80 and stays there, auto-mitigate flips the alert to Resolved and (if configured) sends a resolved notification, so you know it is over without watching. The numbered badges below mark the three places a beginner setup most often silently breaks: the rule’s scope/signal, the link between rule and action group, and the receivers’ own verification/limits.
Real-world scenario
Northwind Logistics runs a single B2s virtual machine that hosts an internal dispatch portal — about 40 warehouse staff depend on it during the day shift. There is no operations team; Priya, a developer, keeps it running on the side. For months the only monitoring was Priya occasionally glancing at the CPU chart. Then, during a peak season week, the VM’s CPU saturated every afternoon as report exports piled up; the portal crawled, dispatchers complained, and Priya only learned about it from an angry message on the warehouse group chat — typically an hour after it started.
Priya spent one afternoon doing exactly what this article describes. She created an action group named ag-dispatch-oncall with three receivers: her email, her phone as an SMS receiver (country code +91), and Azure-app push on her phone. She added one metric alert: alert-vm-cpu-high on the VM’s Percentage CPU, average over 5 minutes, greater than 80, Sev 2, auto-mitigate on, attached to the action group. She set the severity to Sev 2 (Warning) deliberately — this was “look soon,” not “wake me at 3 a.m.” — so she routed it to email and push, and kept SMS for a second, stricter rule at 95% that was worth a text.
The very next afternoon her phone buzzed at 14:32: push and email, “Percentage CPU average over 5 minutes is 86% on vm-dispatch-01.” She was looking at the VM within two minutes, saw the export job hammering it, and rescheduled the heavy reports to run after the day shift. The portal never went down again that week. A month later the same alert caught a genuinely stuck process pinning a core overnight — at 95% the SMS rule texted her, she restarted the service from her phone’s Cloud Shell, done in five minutes. The lesson Priya took away was not “monitoring is hard” but the opposite: two rules and one action group, built in an afternoon, converted every future incident from “a customer tells me, late” into “my phone tells me, early.” She has since copied the same action group onto her SQL database and storage account — the same ag-dispatch-oncall object, reused, exactly as action groups are meant to be.
Advantages and disadvantages
Metric alerts plus action groups are the right first tool, but they have edges. The trade-offs:
| Advantages | Disadvantages |
|---|---|
| Near real-time (~1 minute) detection | Only watches metrics — not log content, joins, or text in errors |
| Platform metrics are free and need no agent | A single metric rarely tells the whole story (you may need several) |
| Cheap: a few rupees per rule per month | SMS and voice cost per message/call and have rate limits |
| Action groups are build-once, reuse-everywhere | Static thresholds need tuning; too tight floods you, too loose misses |
| Auto-mitigate gives one alert per episode | Auto-mitigate timing can lag a genuinely resolved condition |
| Works identically in portal, CLI and Bicep | Multi-resource scoping has rules (one resource type per metric rule) |
| Severity + processing rules enable routing/suppression | No built-in escalation chains without extra setup (use processing rules / ITSM) |
When each matters: for a beginner watching one VM, the advantages dominate completely — set up the alert and move on. The disadvantages start to bite as you scale: when you have dozens of resources you will want log search alerts for richer conditions, alert processing rules to suppress during maintenance, and possibly an ITSM or PagerDuty integration for proper on-call escalation. None of that changes the foundation you build here; it layers on top of the same action groups.
Hands-on lab
This is the centerpiece. You will build a working CPU alert end to end, three ways, and prove it fires. Do the portal path first to see every field, then the az CLI path to learn the repeatable version, then the Bicep path for the source-controlled version. Each path is independent — you can run all three, or pick one — but if you run more than one, use different names (suffix -cli, -bicep) so they don’t collide. Teardown is at the end.
Prerequisites for the lab
| Need | How to get it | Check it |
|---|---|---|
| An Azure subscription | Free tier is fine | az account show |
| A resource group | We create one below | — |
| A VM to alert on | We create a tiny B1s/B2s Linux VM | az vm show |
Cloud Shell or local az |
shell.azure.com or install az |
az version |
| The Azure mobile app (for push) | Install from your phone’s app store, sign in | App shows your subscriptions |
Cost note: a B1s VM is one of the cheapest and is eligible for the free-tier 750 hours/month. Stop or delete it at the end. The alert rule itself is a few rupees a month; email and push are free.
Step 0 — Set up shell variables and a resource group
Open Cloud Shell (Bash) and set names you’ll reuse. Using variables keeps every later command copy-pasteable.
# Pick a region close to you and unique-ish names
LOCATION=centralindia
RG=rg-alert-lab
VM=vm-alert-lab
ADMIN=azureuser

# Create the resource group
az group create --name "$RG" --location "$LOCATION"
Expected output: a JSON block with "provisioningState": "Succeeded" and your resource group’s id. If you see AuthorizationFailed, your account lacks rights on the subscription — switch with az account set --subscription <id>.
Step 1 — Create a tiny VM to alert on
# A B1s Ubuntu VM — cheapest tier, free-tier eligible. SSH key auto-generated.
az vm create \
  --resource-group "$RG" \
  --name "$VM" \
  --image Ubuntu2204 \
  --size Standard_B1s \
  --admin-username "$ADMIN" \
  --generate-ssh-keys \
  --public-ip-sku Standard
Expected output: JSON ending in "provisioningState": "Succeeded", including "powerState": "VM running" and a publicIpAddress. This takes 1–2 minutes. Capture the VM’s resource ID — you’ll need it for the rule:
VM_ID=$(az vm show --resource-group "$RG" --name "$VM" --query id -o tsv)
echo "$VM_ID"
You should see a long ID like /subscriptions/.../resourceGroups/rg-alert-lab/providers/Microsoft.Compute/virtualMachines/vm-alert-lab.
Step 2 — Create the action group (PORTAL)
- In the Azure portal, search Monitor and open it, then choose Alerts in the left menu, then Action groups, then + Create.
- Basics tab: pick your Subscription and the Resource group
rg-alert-lab. Set Region to Global (action groups are global by default). Enter Action group nameag-alert-laband Display nameAlertLab(the short name shown in SMS/email — max 12 characters). - Notifications tab: add three rows.
- Row 1 — Notification type = Email/SMS message/Push/Voice. Name it
notify-me. In the panel, tick Email, enter your address. Tick SMS, choose your Country code (e.g.91for India) and enter your number. Tick Azure app Push Notification and enter the email of the Azure account signed in on the mobile app. Click OK.
- Row 1 — Notification type = Email/SMS message/Push/Voice. Name it
- Actions tab: leave empty for now (no automation in this lab).
- Tags tab (optional): add
env=lab. - Review + create, then Create.
Expected result: the action group ag-alert-lab appears under Monitor → Alerts → Action groups. Within a minute you should receive a confirmation email (“You have been added to an Azure Monitor action group”) and a confirmation SMS — this is Azure proving the channels work. If the SMS never arrives, the number/country code is wrong — fix it before relying on it.
Step 3 — Create the metric alert rule (PORTAL)
- Monitor → Alerts → + Create → Alert rule.
- Scope: click Select scope, find and tick your VM
vm-alert-lab, Apply. - Condition: click Add condition (or See all signals). Search the signal Percentage CPU and select it. A chart appears.
- In the condition pane set:
- Threshold = Static
- Aggregation type = Average
- Operator = Greater than
- Threshold value =
80 - Aggregation granularity (Period) =
5 minutes - Frequency of evaluation =
1 minute - Click Done.
- Actions: click Select action groups, tick
ag-alert-lab, Select. (This is the step that, if skipped, leaves your rule notifying no one.) - Details: set Severity =
2 - Warning, Alert rule name =alert-vm-cpu-high, Resource group for the rule =rg-alert-lab. Leave Enable upon creation ticked and Automatically resolve alerts (auto-mitigate) ticked. - Review + create → Create.
Expected result: alert-vm-cpu-high appears under Monitor → Alerts → Alert rules with state Enabled. It will sit quietly (CPU is near 0% on an idle VM) until you force load in Step 6.
Step 4 — Create the action group (az CLI)
If you prefer the repeatable path (or want a second action group), do it in one command. Replace the email and phone with yours.
az monitor action-group create \
  --resource-group "$RG" \
  --name ag-alert-lab-cli \
  --short-name AlertLabCLI \
  --action email notify-me you@example.com \
  --action sms notify-sms 91 9876543210 \
  --action azureapppush notify-push you@example.com
Expected output: JSON for the new action group with your three receivers listed under emailReceivers, smsReceivers and azureAppPushReceivers, and "provisioningState": "Succeeded". You’ll again get a confirmation email/SMS. Note: the short name is max 12 chars; a longer one is rejected. Capture the action group ID:
AG_ID=$(az monitor action-group show --resource-group "$RG" --name ag-alert-lab-cli --query id -o tsv)
echo "$AG_ID"
Step 5 — Create the metric alert rule (az CLI)
az monitor metrics alert create \
  --name alert-vm-cpu-high-cli \
  --resource-group "$RG" \
  --scopes "$VM_ID" \
  --condition "avg Percentage CPU > 80" \
  --window-size 5m \
  --evaluation-frequency 1m \
  --severity 2 \
  --description "VM CPU average over 5 minutes exceeded 80%" \
  --action "$AG_ID"
Expected output: JSON describing the rule, including "enabled": true, the criteria with your Percentage CPU condition, and the action group under actions. The --condition string packs aggregation (avg), metric (Percentage CPU), operator (>) and threshold (80) into one expression — the CLI’s compact form of the portal’s condition pane. Verify it landed:
az monitor metrics alert show --name alert-vm-cpu-high-cli --resource-group "$RG" \
  --query "{name:name, enabled:enabled, severity:severity, scopes:scopes}" -o json
Step 6 — Force the alert to fire and PROVE it works
An idle VM will never cross 80%. Drive its CPU to 100% with a stress loop so the rule actually fires and your channels actually deliver. SSH in (the public IP was in Step 1’s output, or fetch it):
IP=$(az vm show -d --resource-group "$RG" --name "$VM" --query publicIps -o tsv)
ssh ${ADMIN}@${IP}
On the VM, install and run a CPU stressor for 10 minutes (B1s has 1 vCPU, so one worker pins it):
# On the VM
sudo apt-get update -y && sudo apt-get install -y stress-ng
stress-ng --cpu 1 --timeout 600s --metrics-brief
Expected timeline:
- Within ~1–2 minutes the VM’s CPU chart in the portal climbs to ~100%.
- After the 5-minute average crosses 80% (so ~3–6 minutes of sustained load), the rule fires: the alert appears under Monitor → Alerts with state Fired, Sev 2.
- Your email, SMS and push all arrive, naming the resource, the metric, and the breaching value.
- Stop the stressor (
Ctrl-Cor let it time out). After CPU falls back under 80% for a few minutes, auto-mitigate flips the alert to Resolved.
This is the whole point of the lab — you have now seen the notification arrive, not just configured it. An alert you have never watched fire is an alert you do not actually trust.
No-VM shortcut: if you don’t want to stress a VM, you can still prove the action group end-to-end with a portal test. On the action group, click Test (or Test action group), pick a sample alert type, and Azure sends a real notification through every receiver — email, SMS and push — without any rule firing. Use this whenever you add a new receiver.
Step 7 — The Bicep version (source-controlled, repeatable)
For the version that lives in git and deploys identically every time, declare both objects in one file. Save as alert.bicep:
@description('Resource ID of the VM to monitor')
param vmResourceId string

@description('Email address to notify')
param notifyEmail string

@description('SMS country code, e.g. 91 for India')
param smsCountryCode string = '91'

@description('SMS phone number (no country code)')
param smsPhoneNumber string

param location string = 'global'

// 1) The action group: email + SMS + Azure app push
resource ag 'Microsoft.Insights/actionGroups@2023-01-01' = {
  name: 'ag-alert-lab-bicep'
  location: location
  properties: {
    groupShortName: 'AlertLabBcp'   // max 12 characters
    enabled: true
    emailReceivers: [
      {
        name: 'notify-me'
        emailAddress: notifyEmail
        useCommonAlertSchema: true
      }
    ]
    smsReceivers: [
      {
        name: 'notify-sms'
        countryCode: smsCountryCode
        phoneNumber: smsPhoneNumber
      }
    ]
    azureAppPushReceivers: [
      {
        name: 'notify-push'
        emailAddress: notifyEmail
      }
    ]
  }
}

// 2) The metric alert rule: avg Percentage CPU > 80 over 5 min
resource cpuAlert 'Microsoft.Insights/metricAlerts@2018-03-01' = {
  name: 'alert-vm-cpu-high-bicep'
  location: 'global'              // metric alerts are global
  properties: {
    description: 'VM CPU average over 5 minutes exceeded 80%'
    severity: 2
    enabled: true
    scopes: [ vmResourceId ]
    evaluationFrequency: 'PT1M'   // every 1 minute
    windowSize: 'PT5M'            // 5-minute window
    autoMitigate: true
    criteria: {
      'odata.type': 'Microsoft.Azure.Monitor.SingleResourceMultipleMetricCriteria'
      allOf: [
        {
          name: 'HighCPU'
          metricName: 'Percentage CPU'
          metricNamespace: 'Microsoft.Compute/virtualMachines'
          operator: 'GreaterThan'
          threshold: 80
          timeAggregation: 'Average'
          criterionType: 'StaticThresholdCriterion'
        }
      ]
    }
    actions: [
      {
        actionGroupId: ag.id
      }
    ]
  }
}
Deploy it (passing the VM ID from Step 1 and your contact details):
az deployment group create \
  --resource-group "$RG" \
  --template-file alert.bicep \
  --parameters vmResourceId="$VM_ID" notifyEmail="you@example.com" smsPhoneNumber="9876543210"
Expected output: "provisioningState": "Succeeded" and both resources (ag-alert-lab-bicep, alert-vm-cpu-high-bicep) in the outputs. Because Bicep is idempotent, re-running the same deployment changes nothing — the single biggest reason to define alerts as code rather than clicking.
Step 8 — Validate everything is wired correctly
Before you trust it, confirm the rule is enabled, scoped right, and actually points at an action group:
# List all metric alert rules in the RG and show key fields
az monitor metrics alert list --resource-group "$RG" \
  --query "[].{name:name, enabled:enabled, sev:severity, actions:actions[].actionGroupId}" -o table

# Confirm the action group has all three receivers
az monitor action-group show --resource-group "$RG" --name ag-alert-lab-cli \
  --query "{email:emailReceivers[].emailAddress, sms:smsReceivers[].phoneNumber, push:azureAppPushReceivers[].name}" -o json
Expected: each rule shows enabled: True, a non-empty actions column (the action group ID), and the action group lists your email, SMS and push receivers. An empty actions column is the silent-failure red flag — fix it immediately.
Step 9 — Teardown (do this to avoid cost)
The VM is the only thing that costs more than rupees. Delete the whole resource group to remove the VM, disk, IP, action groups and alert rules in one shot:
az group delete --name "$RG" --yes --no-wait
Expected output: the command returns immediately (--no-wait); deletion completes in the background in a few minutes. Confirm later with az group exists --name "$RG" (returns false when gone). If you only want to pause cost but keep the setup, deallocate the VM instead (az vm deallocate -g "$RG" -n "$VM") — a deallocated VM stops compute charges (you still pay for the disk).
Common mistakes & troubleshooting
The differentiator. Here are the failures that make a freshly-built alert do nothing — or do too much — with the exact way to confirm and fix each.
| # | Symptom | Root cause | How to confirm | Fix |
|---|---|---|---|---|
| 1 | Rule exists, condition clearly true, but nobody is notified | No action group attached to the rule | az monitor metrics alert show -n <rule> -g <rg> --query actions is empty [] |
Attach the action group (portal: Actions → Select action groups; CLI: --add-action-groups) |
| 2 | Email arrives but SMS never does | Wrong country code or number, or the number never confirmed | No confirmation SMS was received when the receiver was added | Re-enter country code + number; use the action group Test to re-verify |
| 3 | No push notification | Azure mobile app not installed, or signed in as a different account than the push receiver’s email | Open the app — is your subscription listed and the email matching? | Install the app, sign in with the same account email used in the push receiver |
| 4 | Alert never fires even under obvious load | Wrong scope (rule points at the wrong resource) or wrong signal | --query scopes shows a different resource ID than your VM |
Recreate with the correct --scopes/portal scope; verify the signal is Percentage CPU |
| 5 | Alert fires constantly / floods you | Threshold too low, window too short, or aggregation Maximum |
Look at the metric chart — is normal load near your threshold? | Raise threshold, lengthen window to 5–15 min, switch to Average |
| 6 | SMS stops mid-incident, you get an email about a rate limit | Hit the ~1 SMS / 5 min per number limit on a flapping rule | The notice email says “rate limited” | Stabilise the rule (longer window/auto-mitigate); reserve SMS for stable Sev 0/1 rules |
| 7 | “Metric not found / no data” when picking the signal | The resource doesn’t emit that metric, or VM is deallocated (no guest data) | Metric chart shows “no data”; VM power state | Start the VM; pick a metric the resource type actually emits |
| 8 | Rule created but shows Disabled | Enable upon creation was unticked, or rule later disabled |
--query enabled returns false |
az monitor metrics alert update -n <rule> -g <rg> --enabled true |
| 9 | Duplicate alerts for one episode | Auto-mitigate off, or two overlapping rules on the same metric | Two rules listed for the same signal/scope | Enable auto-mitigate; delete the duplicate rule |
| 10 | Action group Test works but real alerts don’t | The rule and action group are in different subscriptions, or the rule’s action ID is stale | Compare subscription IDs; re-check actions[].actionGroupId |
Recreate the action reference so the IDs match |
| 11 | Resolved notification never arrives | “Resolved” notifications not enabled, or auto-mitigate disabled | Check action group/rule resolved-notification setting | Enable resolved notifications on the action group; enable auto-mitigate on the rule |
| 12 | New email receiver gets nothing | Email went to spam, or the receiver was added but not saved | Search spam for “Azure Monitor”; confirm the receiver is saved | Allowlist the Azure Monitor sender; re-save the receiver and Test |
A focused decision aid for the most common case — “my alert isn’t notifying me”:
| If you see… | It’s probably… | Do this |
|---|---|---|
| Rule fired in portal, no email/SMS/push | No action group, or receivers unverified | Check actions is non-empty; run action group Test |
| Rule never fired despite load | Wrong scope/signal, or VM deallocated | Verify scopes and the metric; ensure the resource is running |
| Email yes, SMS no | Bad number/country code | Re-enter and re-confirm the SMS receiver |
| Push no, others yes | App not signed in to the right account | Match the app’s account to the push receiver email |
| Too many alerts | Threshold/window/aggregation too aggressive | Raise threshold, widen window, use Average, enable auto-mitigate |
Best practices
Crisp, production-grade rules for alerting that you can apply from your very first rule:
- Always attach an action group. A rule with no action group is a tree falling in an empty forest. Make it the step you never skip.
- Build action groups once, reuse them everywhere. Maintain a small set (e.g.
ag-oncall-critical,ag-team-email) and attach them across resources rather than re-typing contacts per rule. - Match the channel to the severity. Email/push for Sev 2–3; reserve SMS and voice for Sev 0–1 that genuinely warrant waking someone. This also keeps you clear of SMS rate limits.
- Start static, average, 5-minute window. It is the stable default for percentage metrics. Move to dynamic thresholds only once you understand a workload’s daily shape.
- Test every receiver when you add it. Use the action group Test button so you never discover a typo’d phone number during a real incident.
- Enable auto-mitigate. One alert per episode, not one per minute — and it tells you when the condition clears.
- Name rules for the condition.
alert-vm-cpu-highbeatsAlert 1. Future-you scanning a list at 2 a.m. will thank you. - Define alerts as code (Bicep). Idempotent, reviewable, and identical across dev/test/prod. Clicking is fine to learn; code is how you keep them.
- Avoid noisy thresholds. An alert that cries wolf trains everyone to ignore it. Tune until it fires only on real conditions.
- Set severity deliberately on every rule. It is the hook for filtering, routing and maintenance-window suppression later.
- Use alert processing rules for maintenance. Suppress notifications during a planned window rather than disabling rules and forgetting to re-enable them.
- Watch your first few alerts fire for real. Confidence comes from seeing the notification land, not from the rule existing.
Security notes
Alerting is low-risk, but a few things still matter for least privilege and data hygiene:
- Least privilege via RBAC. Creating and managing alerts and action groups is governed by the Monitoring Contributor role (or a custom role with
Microsoft.Insights/*). Grant that, not Owner, to people who only need to manage monitoring. Reading alerts needs only Monitoring Reader. - Action groups can carry secrets. Webhook URLs, ITSM credentials and secure-webhook configs in an action group are sensitive — anyone with write access to the action group can see or change where alerts go. Scope action-group permissions accordingly and prefer secure webhooks (Entra ID auth) over plain webhooks for anything authenticated.
- Mind what’s in the notification. Alert payloads include the resource name, metric and value. Avoid putting sensitive identifiers in custom alert descriptions that fan out by SMS/email to broad distribution lists.
- Use managed identity for automation actions. When an action group triggers a Function, Logic App or runbook that remediates (restart, scale), have that automation authenticate with a managed identity scoped to exactly the resources it touches — never an embedded credential. See Managed Identities Demystified: System vs User-Assigned and When to Use Each.
- Protect the on-call contact list. Phone numbers and emails in action groups are personal data; treat the action group as you would any contact list and restrict who can read it.
Cost & sizing
Alerting is one of the cheapest things you’ll run, but the line items differ by piece:
| Item | What you pay | Rough cost | Free allowance |
|---|---|---|---|
| Platform metrics | Nothing to collect | Free | All standard metrics |
| Metric alert rule | Per rule, per monitored time-series, per month | A few ₹ / ~US$0.10 per rule-series per month | First few metric time-series often free |
| Email notifications | Free | ₹0 | Unlimited (within rate limits) |
| Azure app push | Free | ₹0 | Unlimited (sensible) |
| SMS notifications | Per message, varies by country | A few ₹ / a few US¢ per SMS | A small number of free SMS/emails per month |
| Voice notifications | Per call, higher than SMS | Higher per-call rate | Limited free allowance |
| Webhook/Function/Logic App actions | Free to fire; you pay the target’s own cost | Action itself free | — |
How to right-size: for a beginner watching a handful of resources, total alerting cost is typically under ₹100 / ~US$1 a month — dominated by the per-rule charge, with notifications essentially free if you stick to email and push. The thing that actually moves the bill is SMS/voice volume on a noisy rule, which is both a cost problem and a rate-limit problem — another reason to tune thresholds and reserve texts for true criticals. The VM in this lab costs far more than the alert; deallocate or delete it when done. There is no charge for having an action group — only for the SMS/voice messages it sends.
Interview & exam questions
Common questions on Azure Monitor alerting, with model answers. These map to AZ-104 (Azure Administrator) and AZ-900 (Azure Fundamentals).
-
What are the two parts of an Azure Monitor alert, and why are they separate? The alert rule (the detector — signal, scope, condition) and the action group (the responder — notifications and actions). They’re separate so one action group can be reused by many rules, and you can change who’s notified without editing rules.
-
What is a “signal” in a metric alert? The specific metric the rule watches, such as
Percentage CPUorAvailable Memory Bytes. Available signals depend on the resource type. -
Static vs dynamic threshold — when do you use each? Static is a fixed number you choose; use it for metrics with a clear bad value (CPU %, disk %). Dynamic learns the metric’s normal pattern from history and fires on departures; use it when “normal” varies by time of day and no single number fits.
-
Why use Average aggregation over a 5-minute window instead of an instantaneous value? To avoid firing on transient spikes. Averaging over a window measures sustained load, which is what “overloaded” really means, and prevents alert fatigue from momentary blips.
-
What does auto-mitigate do? It automatically moves a fired alert back to Resolved once the condition clears for a period, so you get one alert per episode (and a resolved notification) rather than a new alert every evaluation.
-
What notification channels can an action group use, and which are free? Email, SMS, Azure mobile app push, and voice for people; webhooks, Functions, Logic Apps, runbooks, ITSM and Event Hubs for automation. Email and push are free; SMS and voice are charged per message/call.
-
You created a metric alert but no one is notified when it fires. What’s the most likely cause? No action group is attached to the rule. The rule detects the condition but has nothing to notify through. Attach an action group.
-
What is alert severity and what does Sev 0 mean? A label from 0 to 4 you assign to a rule for prioritisation/routing. Sev 0 is Critical; Sev 4 is Verbose. It doesn’t change technical behaviour by default but drives filtering and processing rules.
-
What are SMS rate limits and why do they matter? Azure limits SMS to roughly one message per ~5 minutes per number per action group; excess messages are dropped (you get an email instead). It matters because a flapping rule on SMS will silently lose real notifications — so reserve SMS for stable, critical rules.
-
Which RBAC role lets someone create and manage alerts without full control of the subscription? Monitoring Contributor (covers
Microsoft.Insights/*). Monitoring Reader is enough to just view alerts. -
How is a metric alert different from a log search alert? A metric alert compares a numeric metric to a threshold in near real-time and needs no logging set up. A log search alert runs a KQL query over log data on an interval — richer (joins, text, custom logic) but slower and needs a Log Analytics workspace with data.
-
Why define alerts as Bicep instead of clicking them in the portal? They become idempotent, version-controlled and reviewable, and deploy identically across environments — re-running the template changes nothing, eliminating click-drift between dev, test and prod.
Quick check
- An alert rule’s condition is clearly true, but you receive no email, SMS or push. What is the first thing to check?
- You want an alert to fire only on sustained high CPU, not momentary spikes. Which aggregation type and roughly what window do you choose?
- True or false: SMS notifications through an action group are free and have no rate limit.
- You add a new phone number to an action group. How do you prove it works without waiting for a real incident?
- Name the two separate objects you must create (and connect) to get notified when a VM’s CPU is too high.
Answers
- Whether an action group is attached to the rule. A rule with an empty
actionslist detects the condition but notifies no one — confirm withaz monitor metrics alert show -n <rule> -g <rg> --query actionsand attach the action group if it’s empty. - Average aggregation over about a 5-minute window (5–15 min is reasonable). Average smooths transient spikes so the rule fires only on genuinely sustained load.
- False. SMS is charged per message and is rate-limited to roughly one message per ~5 minutes per number per action group; excess messages are dropped and you get an email noting the limit. (Email and push, by contrast, are free.)
- Use the action group’s Test button (Monitor → Alerts → Action groups → your group → Test): Azure sends a real notification through every receiver — email, SMS and push — with no rule firing.
- A metric alert rule (the detector — signal, scope, threshold) and an action group (the responder — email/SMS/push receivers), with the action group attached to the rule.
Glossary
- Azure Monitor — the platform service that collects metrics and logs from Azure resources and powers alerts, dashboards and workbooks.
- Metric — a numeric value sampled over time (e.g.
Percentage CPU), emitted automatically by most resources at no cost. - Platform metric — a metric Azure collects from a resource automatically, with no agent or configuration.
- Metric alert rule — a rule that watches a metric on a scope and fires when an aggregate crosses a threshold over a window.
- Signal — the specific metric a rule watches; the available signals depend on the resource type.
- Scope — the resource(s) an alert rule applies to.
- Aggregation type — how samples in the window combine: Average, Maximum, Minimum, Total or Count.
- Aggregation granularity (period) — the length of the time window each evaluation aggregates over (e.g. 5 minutes).
- Evaluation frequency — how often the rule is checked (e.g. every 1 minute).
- Threshold — the value the metric must cross to trigger the rule.
- Static threshold — a fixed number you choose as the trigger.
- Dynamic threshold — a threshold Azure Monitor learns from the metric’s history and adapts over time.
- Severity — a label from 0 (Critical) to 4 (Verbose) you assign to a rule for prioritisation and routing.
- Alert — the record created when a rule’s condition becomes true; has states Fired and Resolved.
- Auto-mitigate — automatically resolves a fired alert once the condition clears, giving one alert per episode.
- Action group — a named bundle of receivers (notifications) and actions (automation) that an alert references.
- Receiver — one destination inside an action group (email, SMS, push, voice, webhook, etc.).
- Azure app push — a free notification to the Azure mobile app, signed in with your Azure account.
- Alert processing rule — a rule that modifies alert behaviour (e.g. suppress notifications during a maintenance window).
Next steps
You can now detect a bad metric and get a notification in your pocket. Build outward from here:
- Next: Azure Monitor and Application Insights: Full-Stack Observability — go beyond metrics into logs, KQL, dashboards and application-level alerting.
- Related: Set Up Azure Budgets: Threshold Alerts to Email, Action Groups, and Automation — reuse this same action group to get alerted on spend, not just performance.
- Related: Troubleshooting Azure App Service: 502/503 Errors, Cold Starts & Restart Loops — what to do once an alert tells you an app is unhealthy.
- Related: Deploy Your First Azure VM: Portal, CLI and Step by Step — the resource you alerted on, built from scratch.
- Related: Managed Identities Demystified: System vs User-Assigned and When to Use Each — so any auto-remediation an action group triggers authenticates safely.