Open the Azure portal, click Monitor, and you are offered two doors: Metrics and Logs. They look like they do the same job — both answer “how is my stuff doing?” — so most people pick one at random, wire everything into it, and get surprised. Either the dashboards are instant but can never answer “which user hit that error,” or every question is answerable but the monthly bill quietly climbs past the compute it is supposed to be watching. The two doors are not interchangeable: they are two data stores with completely different shapes, speeds, costs and retention rules, and Azure Monitor expects you to send the right signal to the right one.
This article is the mental model that stops the guesswork. A metric is a number sampled on a clock — CPU percent every minute — kept in a fast, nearly-free time-series database that throws away the detail. A log is a timestamped record with full context — this request, from this IP, returned this status in this many milliseconds — kept in a Log Analytics workspace you query with KQL (Kusto Query Language), rich and searchable but billed per gigabyte ingested. Knowing which question each store answers, and roughly what each costs, is the whole skill. Get it right and your “is it on fire?” dashboards refresh in under a second while your “why did it catch fire?” investigations have every breadcrumb.
By the end you will look at any signal — a CPU reading, an HTTP 500, a sign-in event, a custom “order placed” counter — and say in one breath which store it belongs in, what it costs to keep, and how long to keep it. You will stop paying log prices for data a metric could hold, and stop trying to squeeze a “which customer?” answer out of a store that only kept the average. We keep it concrete: real Azure terms, free-tier numbers, KQL, and az plus Bicep for what you actually create.
What problem this solves
Azure Monitor is not one database — it is a front door over (at least) two, and the portal blurs them. The same alert rules blade alerts on a metric or a log query; the same workbooks chart both. A beginner concludes they are one thing with two names, wires every signal into whichever they clicked first, and hits one of two failure modes.
Failure mode one: everything in metrics. Metrics are cheap and instant, so it is tempting to make them the home for everything. But a metric is only a number plus a few labels. When the incident review asks “which API route threw the 500s, and what was in the request?”, the metric tells you that 500s spiked at 14:03 — not which route, which user, or the exception. You sampled a count; the context is gone. The team flies blind during the one moment monitoring is meant to pay for itself.
Failure mode two: everything in logs. A workspace holds anything, so the other instinct is to fire-hose every signal — verbose app logs, every diagnostic, full traces — into one workspace at full fidelity for years. This works: every question is answerable. It just costs money you did not budget. Log Analytics bills roughly per GB ingested (~₹230–₹250 / US$2.76 per GB, after a small free grant), plus retention. A chatty app in DEBUG can push tens of GB a day; times 365 days and the observability bill exceeds the workload it watches. People discover this at quarter-end, not day one.
Who hits this: essentially everyone on Azure, because every resource emits telemetry by default and nothing is stored long-term until you decide where it goes. Picking the store is not an optimisation for later — it is the first decision, and it sets both how fast dashboards feel and how big the monitoring bill gets.
Learning objectives
By the end of this article you can:
- Explain what the metrics store and a Log Analytics workspace are, and how their data is shaped.
- Decide, for any signal, which store it belongs in — on speed, cost and retention.
- Read the cost model of both: why metrics are effectively free and logs bill per GB, and what drives the bill.
- Read the retention rules: default and maximum for platform metrics versus a workspace, and what “archive” changes.
- Write a basic KQL query, and read a metric chart with the right aggregation.
- Use diagnostic settings to route telemetry to a workspace, storage, or both — with
azand Bicep. - Avoid the two classic traps (everything-in-metrics, everything-in-logs) and apply production-grade routing rules.
- Map these concepts to where they appear in AZ-104 and AZ-204 exam questions.
Prerequisites & where this fits
You should have an Azure subscription and know how to find a resource in the portal and open its Monitoring section. It helps to know that every resource automatically emits some telemetry, and that the CPU/requests charts on a resource’s Overview blade are metrics. No KQL or scripting background is assumed; we build the queries from scratch.
This sits at the front of the Observability track — the “where does my telemetry live?” decision everything else builds on. For the application-side view — distributed traces, dependency maps, exceptions tied to requests — see Azure Monitor & Application Insights for observability; App Insights writes into a workspace, so this article’s cost and retention rules apply to it too. When telemetry says a web app is broken, the playbook is Troubleshooting Azure App Service: 502/503, cold starts & restart loops. And because log bills are a real cost line, budgeting connects to Set up Cost Management budgets with email and action-group alerts.
A quick map of the moving parts to frame the later sections:
| Piece | What it is | You interact with it via |
|---|---|---|
| Azure Monitor | The umbrella service / front door over all telemetry | Portal “Monitor”, az monitor … |
| Metrics store | A time-series DB of numeric samples | Metrics explorer, metric alerts |
| Log Analytics workspace | A queryable log store you create and own | Logs blade, KQL, az monitor log-analytics |
| Diagnostic settings | The router that sends a resource’s telemetry to a destination | Per-resource, az monitor diagnostic-settings |
| KQL | The query language for logs | Logs blade, workbooks, log alerts |
| Data Collection Rule (DCR) | The newer pipeline config for agent/custom log ingestion | az monitor data-collection rule |
Core concepts
Four mental models make every later decision obvious.
A metric is a number on a clock; a log is a sentence with a timestamp. A metric is a single numeric value sampled at a fixed interval (typically every minute), carrying only a few dimensions (labels like InstanceId). “CPU was 73% at 14:03.” A log (a log entry / record) is a structured row with full context — timestamp, resource, and every field the source emits: URL, user, status, duration, exception. “At 14:03:07, /api/checkout from 203.0.113.9 returned 500 in 812 ms with NullReferenceException.” The metric is tiny and fixed-shape; the log is bigger and free-shape — and that difference cascades into everything else.
They live in two databases tuned for opposite jobs. The metrics store is a time-series database built to “plot this number over time, fast” — pre-aggregated, near-instant even over weeks. The Log Analytics workspace is an indexed log store built to “find and slice the records matching this filter” — search billions of rows, join tables, compute over text. You cannot ask the metrics store “show the rows where user = X” (it never stored rows); you can ask the workspace “average this per minute,” but you paid to store every row.
Cost follows shape. A metric is a tiny fixed number, so platform metrics are free to collect and view, and metric alerts cost a few rupees per time-series per month. A log is an arbitrary-size record, so Log Analytics bills by the gigabyte you ingest (plus retention beyond the free window). The cost question is really a volume question — control the bill by controlling what you log and for how long.
Retention follows purpose. Metrics are for trends and live health, so platform metrics keep a rolling 93 days — nobody needs last March’s per-minute CPU. Logs are for investigation and audit, so a workspace lets you choose retention per table from days up to years, with a cheaper archive tier for “keep for compliance but rarely query.” Tune retention to the question.
The two stores side by side
Pin the contrast down before the deep sections — keep this open as you read:
| Aspect | Metrics store | Log Analytics workspace |
|---|---|---|
| Data shape | One number + a few dimensions, per timestamp | Full structured record, many columns |
| Best question | “How is this number trending?” | “Which records match this filter, and why?” |
| Sampling | Pre-aggregated, ~1-minute granularity | Every event as it happens (raw) |
| Query language | Aggregations in Metrics explorer (no KQL) | KQL |
| Speed | Sub-second, even over weeks | Fast, but scales with data scanned |
| Cost to collect | Platform metrics: free | Per GB ingested (~₹230–₹250 / GB) |
| Default retention | 93 days (rolling) | 30 days free, then per-table choice |
| Max retention | 93 days (platform) | Up to ~12 years (interactive + archive) |
| Alert latency | Near real-time (~1 min) | Minutes (query runs on a schedule) |
| You create it? | No — always on per resource | Yes — you create the workspace |
| Cardinality limits | Low — keep dimensions small | High — millions of distinct values fine |
The instinct to build: if the answer is a line on a graph, it is probably a metric; if the answer is a list of things that happened, it is probably a log.
What lives in the metrics store
The metrics store is on by default for every resource — you never create it and cannot turn it off. Deploy a VM, App Service or storage account and Azure samples its platform metrics, chartable in Metrics explorer at no cost. Two families: platform metrics (emitted automatically, free to collect and view) and custom metrics (numbers you publish from your app or the agent, free up to a quota then a small per-sample charge).
The defining property of a metric is aggregation. The store keeps a number per time grain, and when you chart it you choose how to aggregate: average, count, sum, min, max. Picking the wrong one is the most common metrics mistake — the chart happily shows a misleading line. “Average CPU” smooths over the one pegged instance; “Max CPU” reveals it. “Average request count” is meaningless — use Sum or Count.
| Aggregation | What it shows | Use it for | Trap |
|---|---|---|---|
| Avg | Mean across the grain/instances | CPU %, memory %, latency | Hides a single hot instance |
| Sum (Total) | Added up across the grain | Request count, bytes, messages | Meaningless for a percentage |
| Count | Number of samples reported | “Did it report at all?” / event counts | Not the same as Sum |
| Min | Lowest value | Spotting drops to zero (availability) | Misses spikes |
| Max | Highest value | Peak CPU, peak latency, saturation | Noisy; one outlier dominates |
Dimensions are the metric’s only way to slice. App Service Http5xx may carry an Instance dimension to split per worker. But dimensions are low-cardinality by design — a metric splits by “which of 3 instances” or “which status-code class,” not “which of 2 million users.” Each combination is its own stored time-series, which the platform caps (Azure custom metrics cap at 50 dimensions per metric). Slicing by thousands of distinct values is a log question.
Charting a platform metric needs no setup; from the CLI:
# Average CPU of a VM, 5-minute grain (add --start-time/--end-time for a window)
az monitor metrics list \
  --resource "/subscriptions/<sub>/resourceGroups/rg-app/providers/Microsoft.Compute/virtualMachines/vm-web01" \
  --metric "Percentage CPU" \
  --aggregation Average \
  --interval PT5M
Metrics are also the fastest path to an alert — the value is already there, no query runs. A metric alert evaluates a near-real-time stream and fires within ~1 minute:
# Alert when average CPU exceeds 80% for 5 minutes
az monitor metrics alert create \
  --name "vm-web01-cpu-high" \
  --resource-group rg-app \
  --scopes "/subscriptions/<sub>/resourceGroups/rg-app/providers/Microsoft.Compute/virtualMachines/vm-web01" \
  --condition "avg Percentage CPU > 80" \
  --window-size 5m \
  --evaluation-frequency 1m \
  --description "VM CPU sustained above 80%"
Takeaway: the metrics store is the home for anything you would draw as a trend line and alert on quickly — CPU, memory, request rate, latency, queue depth, availability — and 93 days of it costs essentially nothing.
What lives in a Log Analytics workspace
A Log Analytics workspace is a thing you create and own — a regional container with its own ID, pricing tier and retention — where every signal needing detail goes. Unlike the metrics store, nothing flows in automatically — you point sources at it:
| Source | What it sends | How it gets there |
|---|---|---|
| Resource diagnostic logs | Per-resource events (App Service HTTPLogs, Key Vault AuditEvent) |
Diagnostic settings |
| Platform metrics (copied) | The same numbers, as AzureMetrics rows |
Diagnostic settings (optional) |
| Activity log | Subscription control-plane events (who did what) | Diagnostic setting on the subscription |
| VM / agent logs | Syslog, Windows events, perf counters, custom text | Azure Monitor Agent + DCR |
| Application Insights | App traces, requests, dependencies, exceptions | Connection string in the app |
| Custom logs | Your own structured records | Logs Ingestion API + DCR |
Everything in a workspace is a table with typed columns, queried with KQL — a table piped through filters and aggregations. The day-one grammar is tiny:
// App Service: HTTP 5xx in the last hour, by URL, newest first
AppServiceHTTPLogs
| where TimeGenerated > ago(1h)
| where ScStatus >= 500
| project TimeGenerated, CsHost, CsUriStem, ScStatus, TimeTaken
| order by TimeGenerated desc
That answers what the metrics store cannot: not just “5xx spiked” but which URLs, when, how slow. To turn detail into a trend, you aggregate:
// Count 5xx per minute, per route — a "metric" computed from logs
AppServiceHTTPLogs
| where TimeGenerated > ago(1h) and ScStatus >= 500
| summarize errors = count() by bin(TimeGenerated, 1m), CsUriStem
| order by TimeGenerated asc
The key insight: a workspace can reconstruct a metric, but a metric can never reconstruct a log. Logs are the superset of detail; the price is per-GB ingestion and retention.
Retention and archive
A workspace gives the first 30 days interactive free on every table. Beyond that you choose, per table, how long to keep data interactively (instantly queryable) and how long in cheaper archive (via a search job or restore). This per-table control is the main cost lever.
| Tier | What it means | Cost shape | Query speed | Typical use |
|---|---|---|---|---|
| Interactive (free window) | First 30 days, instantly queryable | Included with ingestion | Instant | All recent operational data |
| Interactive (extended) | 31 days → up to 730 days, instant | Per-GB-per-month | Instant | Dashboards, recent investigations |
| Archive | Up to ~12 years total, cold | Much cheaper per-GB-month | Search job / restore (slower) | Compliance, security, audit |
| Search job / restore | Pull archived data back to query | Per-GB scanned/restored | Minutes to set up | Occasional deep-history lookups |
# Keep HTTP logs interactive for 90 days, archived to 2 years total
az monitor log-analytics workspace table update \
  --resource-group rg-monitoring \
  --workspace-name law-prod \
  --name AppServiceHTTPLogs \
  --retention-time 90 \
  --total-retention-time 730
Rule of thumb: short interactive retention for noisy operational logs (they age out in days), long archive for security and audit logs (rarely read, but must exist when audit asks).
Routing: diagnostic settings decide where telemetry goes
The piece that connects everything is the diagnostic setting — the per-resource router sending a resource’s logs and/or metrics to chosen destinations. Until you create one, a resource’s diagnostic logs are not stored anywhere (platform metrics still flow free into the metrics store; the rich logs are dropped). The most common gap: people assume App Service request logs or Key Vault audit events are “just there,” then find nothing during an incident.
A diagnostic setting picks categories (log groups, plus whether to include metrics) and destinations — three, for three needs:
| Destination | What it’s for | Cost driver | Query / use |
|---|---|---|---|
| Log Analytics workspace | Investigate, correlate, alert with KQL | Per-GB ingestion + retention | KQL, workbooks, log alerts |
| Storage account | Cheap long-term raw archive | Storage GB (very cheap) | Download/parse later; not queryable live |
| Event Hub | Stream out to a SIEM or third party | Event Hub throughput units | Splunk, Datadog, custom pipelines |
For most teams the answer is Log Analytics for what you actively query, plus a storage account for cheap raw retention of high-volume audit-only categories. Sending verbose logs only to storage keeps the audit trail without paying log-query prices.
# Route App Service logs + metrics to a workspace, and archive raw to storage
az monitor diagnostic-settings create \
  --name "to-law-and-archive" \
  --resource "/subscriptions/<sub>/resourceGroups/rg-app/providers/Microsoft.Web/sites/app-shop-prod" \
  --workspace "/subscriptions/<sub>/resourceGroups/rg-monitoring/providers/Microsoft.OperationalInsights/workspaces/law-prod" \
  --storage-account "/subscriptions/<sub>/resourceGroups/rg-monitoring/providers/Microsoft.Storage/storageAccounts/stdiagarchive" \
  --logs    '[{"category":"AppServiceHTTPLogs","enabled":true}]' \
  --metrics '[{"category":"AllMetrics","enabled":true}]'
The Bicep equivalent — how you should actually ship this, so every resource gets a consistent setting:
resource diag 'Microsoft.Insights/diagnosticSettings@2021-05-01-preview' = {
  name: 'to-law-and-archive'
  scope: appService          // the resource being monitored
  properties: {
    workspaceId: workspaceId
    storageAccountId: archiveStorageId
    logs: [
      { category: 'AppServiceHTTPLogs', enabled: true }
      { category: 'AppServiceConsoleLogs', enabled: true }
    ]
    metrics: [
      { category: 'AllMetrics', enabled: true }   // also copy metrics into the workspace
    ]
  }
}
Note the AllMetrics line: it copies platform metrics into the workspace as AzureMetrics rows — useful to join a metric to logs in one query, but those rows are now billable log ingestion whereas the same numbers in the metrics store are free. Only copy when you need the correlation.
A simple decision model
The routing rule, distilled. For any signal, walk these top to bottom and stop at the first “yes”:
- A number I want to trend and alert on fast? → Metrics (free, sub-second, ~1-min alerts).
- Need to filter/slice by high-cardinality detail (user, URL, ID)? → Logs (only logs keep per-record context).
- A security / audit event I must retain for compliance? → Logs with long retention/archive.
- High-volume raw data I rarely query but must keep cheaply? → Storage via a diagnostic setting (cheapest GB, not live-queryable).
- Need to stream it to a SIEM / third party? → Event Hub (Splunk/Datadog/etc.).
- A trend now but I might want the detail later? → Both — metric live, logs at short retention.
The same idea as worked examples, because concrete beats abstract:
| Signal | Right store | Reason |
|---|---|---|
| VM CPU / memory % | Metrics | Pure trend, alert fast, free |
| Request count / latency p95 | Metrics | Trend + alert; detail not needed live |
| Which URL returned 500 and to whom | Logs | Needs per-request context |
| Entra ID sign-in events | Logs | Audit; slice by user/IP; retain |
| Key Vault “secret accessed by X” | Logs | Security audit; high cardinality |
| Storage account transaction count | Metrics | Trend; free |
| Custom “orders placed” counter | Metrics (custom) or Logs | Metric if just a number to trend; logs if you need order detail |
| Full app exception with stack trace | Logs (App Insights) | Detail tied to a request |
| Activity log (who deployed what) | Logs (+ optional storage archive) | Audit; query + cheap retention |
Architecture at a glance
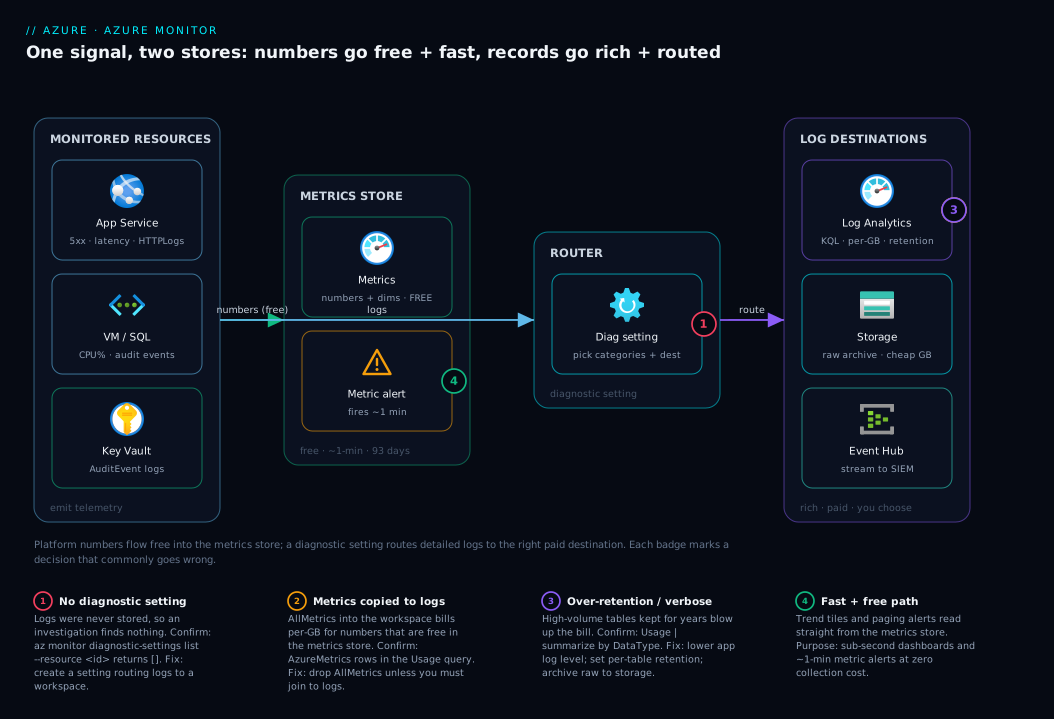
Trace one signal’s journey. A request hits your App Service, and two things happen in parallel. First, the platform samples numbers — request count, response time, HTTP 5xx — and drops them free into the metrics store; your CPU dashboard reads straight from there in well under a second, and a metric alert on that stream fires within a minute if 5xx climbs. Second, if you created a diagnostic setting, the rich per-request records — URL, status, duration, client — flow as logs into your Log Analytics workspace, landing in AppServiceHTTPLogs for KQL to slice. The diagnostic setting is the fork: it routes categories to the workspace (queryable, per-GB), a storage account (cheap raw archive), or an Event Hub (SIEM).
So the picture is a left-to-right split: resources emit two kinds of signal; numbers go up the free/fast path into the metrics store for dashboards and alerts; records go down the rich/paid path, where the diagnostic setting routes them by whether you need to query, cheaply keep, or export them. The badges mark the three decisions that most often go wrong: forgetting the diagnostic setting (logs vanish), copying metrics into logs (paying twice), and over-retaining a high-volume table.
Real-world scenario
Northwind Retail runs a mid-size e-commerce platform on Azure: an App Service web tier, an Azure SQL database, a Key Vault, and a few VMs. Setting up monitoring, a well-meaning engineer enabled everything to logs — every diagnostic category on every resource, AllMetrics copied into the workspace, App Insights in verbose mode, a blanket 730-day retention “to be safe.” Dashboards worked. Investigations worked. Nobody looked at the bill for two months.
The first quarterly review surfaced it: the Log Analytics line was ₹1.4 lakh / month (~US$1,680) and climbing — more than the App Service plan and SQL database combined. A KQL query against the workspace’s usage table found the culprits:
// Which tables are eating the ingestion budget? (last 30 days)
Usage
| where TimeGenerated > ago(30d)
| where IsBillable == true
| summarize GB = sum(Quantity) / 1000 by DataType
| order by GB desc
The results were lopsided. Verbose App Insights traces and AppServiceConsoleLogs (the app logged every cache hit at INFO) were over 70% of ingestion. The copied AzureMetrics rows — already free in the metrics store — added several GB a day for nothing. And the 730-day retention meant paying to keep DEBUG noise from six months ago.
The fix took an afternoon and was pure routing, not new tooling. They (1) dialled the log level from INFO to WARNING, cutting console-log volume ~85%; (2) removed the AllMetrics-to-workspace copy, sending CPU/latency/5xx back to the free metrics store and rebuilding dashboards on metrics (also faster); (3) set retention per table — 30 days interactive for operational logs, 2 years archive for Key Vault AuditEvent and SQL audit; and (4) routed the highest-volume raw category to a storage account. The next month’s bill landed at ₹19,000 / month (~US$228) — a ~86% reduction — with no loss of any signal they used. The lesson on the wall: every signal has a right home; the bill is just the sum of signals in the wrong one.
Advantages and disadvantages
Neither store is “better” — they are specialists.
| Metrics store | Log Analytics workspace | |
|---|---|---|
| Pro | Free for platform metrics | Answers any “which / why” question |
| Pro | Sub-second charts over weeks | Full per-record context retained |
| Pro | Fastest alerts (~1 min) | Powerful slicing, joins, KQL |
| Pro | Zero setup — always on | Flexible retention (days → 12 yrs) |
| Con | No detail — only numbers + labels | Bills per GB ingested |
| Con | Low cardinality only | Cost grows with verbosity & retention |
| Con | Fixed 93-day retention (platform) | Needs deliberate routing & tuning |
| Con | Can’t reconstruct lost context | Slower alerts (scheduled queries) |
When metrics matter most: anything operational and continuous — the health wall, “is it up and fast?” dashboards, page-the-on-call alerts. You want speed, free, and don’t need per-request detail to know CPU is pegged. Lead with metrics for everything that is fundamentally a trend line.
When logs matter most: the moment a human asks “why” or “which,” or the answer is a list of events not a number — incident investigation, security audit, compliance retention, debugging one user’s broken request, any high-cardinality slice. Logs are where the truth lives when the trend line is not enough — keep them, but deliberately.
Hands-on lab
This walk-through creates a workspace, charts a free metric, routes a resource’s logs in, runs your first KQL, and checks ingestion — all free-tier-friendly. You need an App Service or any resource emitting diagnostic logs; Azure App Service plans & tiers, Free to Isolated covers spinning one up.
Step 1 — Create a Log Analytics workspace. The first 30 days and a small daily volume are free.
az monitor log-analytics workspace create \
  --resource-group rg-monitoring \
  --workspace-name law-lab \
  --location centralindia \
  --retention-time 30
# Expected: JSON with provisioningState "Succeeded" and a customerId (workspace GUID)
Step 2 — Read a free platform metric (no setup). Chart any resource’s CPU or request count from the CLI:
az monitor metrics list \
  --resource "<your-app-service-resource-id>" \
  --metric "Http5xx" \
  --aggregation Total \
  --interval PT1M
# Expected: a timeseries with a "total" per minute. This cost you nothing.
Step 3 — Route the resource’s logs into the workspace. Create a diagnostic setting so rich logs start landing:
WORKSPACE_ID=$(az monitor log-analytics workspace show \
  --resource-group rg-monitoring --workspace-name law-lab --query id -o tsv)

az monitor diagnostic-settings create \
  --name "to-law-lab" \
  --resource "<your-app-service-resource-id>" \
  --workspace "$WORKSPACE_ID" \
  --logs '[{"category":"AppServiceHTTPLogs","enabled":true}]'
# Expected: JSON confirming the setting. Allow a few minutes for first rows to flow.
Step 4 — Generate traffic, then run your first KQL. Hit the app a few times, wait ~5 minutes, then open Monitor → Logs, scope to the workspace, and run:
AppServiceHTTPLogs
| where TimeGenerated > ago(30m)
| summarize requests = count() by bin(TimeGenerated, 5m), ScStatus
| order by TimeGenerated asc
You see rows grouped by status code and 5-minute bucket — the same shape as a metric, but now you also have CsUriStem, CIp and TimeTaken to slice by, which the metric never had.
Step 5 — Check ingestion. Make the cost lever visible:
Usage
| where TimeGenerated > ago(1d) and IsBillable == true
| summarize GB = sum(Quantity) / 1000 by DataType
Step 6 — Tear down to avoid charges. Delete the diagnostic setting and workspace.
az monitor diagnostic-settings delete --name "to-law-lab" --resource "<your-app-service-resource-id>"
az monitor log-analytics workspace delete \
  --resource-group rg-monitoring --workspace-name law-lab --yes
You have now used both stores — a free metric for the trend, a workspace query for the detail — and seen the ingestion meter behind the log bill.
Common mistakes & troubleshooting
The failures here are rarely “it’s broken” — they are “wrong store” or “never sent anywhere.” Symptom → cause → confirm → fix:
| # | Symptom | Root cause | How to confirm | Fix |
|---|---|---|---|---|
| 1 | “We can’t tell which route/user caused the spike” | Only a metric was kept; detail never stored | The signal exists in Metrics explorer but has no per-request fields | Add a diagnostic setting → logs; investigate in KQL next time |
| 2 | App Service / Key Vault logs are empty when you go looking | No diagnostic setting was ever created | az monitor diagnostic-settings list --resource <id> returns [] |
Create a diagnostic setting to a workspace |
| 3 | Log Analytics bill is shockingly high | Verbose logs and/or copied metrics ingested at full volume | Run the Usage query; one or two DataTypes dominate |
Lower app log level; stop copying AllMetrics to logs; archive raw to storage |
| 4 | Metric chart looks flat/wrong | Wrong aggregation (e.g. Avg on a count) | Switch the aggregation in Metrics explorer | Use Sum/Count for counts, Max for saturation |
| 5 | “Split by user” on a metric returns nothing useful | Metric dimensions are low-cardinality; user isn’t one | Metric has no high-cardinality dimension | Slice in logs (summarize by user/URL) instead |
| 6 | Log alert fires minutes late | Log alerts run on a schedule, not real-time | Alert rule shows an evaluation frequency (e.g. 5 min) | Use a metric alert for fast paging |
| 7 | Old data you needed is gone | Retention shorter than the question | Check the table’s retentionInDays |
Extend interactive retention or set archive |
| 8 | KQL query times out or is slow/expensive | Scanning huge time range / no filter | Query lacks an early where TimeGenerated > ago(...) |
Filter by time first; reduce columns with project |
| 9 | Two workspaces, data split across them | Resources pointed at different workspaces | Diagnostic settings reference different workspace IDs | Consolidate to one workspace (or query across with workspace()) |
| 10 | Metrics missing for a brand-new resource | Metrics take a few minutes to begin reporting | Resource is minutes old | Wait; platform metrics backfill shortly after creation |
The meta-fix for almost all of these is the decision model above — route on purpose and most never happens.
Best practices
- Trend in metrics, investigate in logs. Live dashboards and fast alerts on the metrics store; reach for logs when a human asks “why” or “which.”
- Always create diagnostic settings for resources whose logs you’ll ever want — App Service, Key Vault, SQL, Activity log. No setting, no logs stored.
- Do not copy metrics into logs by default. Leave
AllMetricsout of the workspace unless you need to join to log data — else you pay log prices for free numbers. - Set retention per table, not per workspace. Short interactive for noisy operational logs; long archive only for security/audit tables you must keep.
- Tune your app’s log level. INFO/DEBUG in production is the most common ingestion blow-out; default to WARNING, raise when debugging.
- Use one workspace per environment (or a small, deliberate number) so queries and alerts see all the data.
- Pick the right aggregation — Sum/Count for counts, Avg for utilisation, Max for saturation. Re-check before trusting a chart.
- Prefer metric alerts for paging (near-real-time); reserve log alerts for what only a query can express.
- Route high-volume, rarely-queried raw data to a storage account, not the workspace — same audit value, a fraction of the cost.
- Watch the
Usagetable monthly so an ingestion regression is caught in days, not at quarter-end. - Tag and budget monitoring resources so the log bill is visible; pair with a budget alert.
Security notes
Telemetry is sensitive — it often holds IPs, user IDs, request paths and sometimes payload fragments — so the stores need the care of any data store.
- Least privilege on the workspace. A workspace is governed by Azure RBAC. Give Log Analytics Reader to query, Log Analytics Contributor only to those who manage settings. Resource-context RBAC lets a user see only the logs of resources they already access — prefer it over workspace-wide read for large orgs.
- Audit logs belong in logs, with long retention. Entra ID sign-ins, Key Vault
AuditEvent, Activity log, SQL audit — send to a workspace and retain long enough for investigations and compliance. These are the tables to archive for years. - Encryption and residency. Workspace data is encrypted at rest with Microsoft-managed keys by default; bring customer-managed keys (CMK) if policy requires. A workspace is regional — create it where residency rules demand.
- Do not log secrets. The cheapest way to avoid leaking a secret is never to write it; scrub tokens, connection strings and PII before they reach a log. Keep secrets in Azure Key Vault: secrets, keys & certificates, not in logs.
- Lock down export paths. If you stream to an Event Hub for a SIEM, secure that hub and its consumers like any egress — an export is a copy of your telemetry leaving the boundary.
Cost & sizing
The metrics store is the easy half: platform metrics are free to collect and view. You pay only small amounts for custom metrics beyond the quota and a few rupees per metric-alert time-series. Budget effectively zero here.
Log Analytics is where the money is, driven by two things: GB ingested and retention.
| Cost driver | Rough rate (PAYG, may vary by region) | What controls it |
|---|---|---|
| Ingestion (Analytics tier) | ~₹230–₹250 / ~US$2.76 per GB | How much you log; app log level; which categories |
| Free ingestion grant | First few GB/day free (varies) | Built in; covers tiny workloads |
| Interactive retention | First 31 days free, then per-GB-month | Per-table retention setting |
| Archive retention | A fraction of interactive per-GB-month | Per-table total-retention setting |
| Search job / restore | Per-GB scanned/restored | Only when you query archived data |
| Commitment tiers | Discount at fixed daily GB (e.g. 100 GB/day) | Use when steady-state volume is high |
Two sizing levers matter most. Control volume at the source: dropping a chatty app from INFO to WARNING routinely cuts ingestion by the majority — the highest-ROI change you can make. Control retention per table: keep operational noise at the free 30-day window, reserve long/archive for the few audit tables that justify it. If steady-state ingestion is large and predictable (tens of GB/day), move to a commitment tier for a per-GB discount.
A worked feel: a tidy App Service + SQL + Key Vault estate, logging at WARNING with sensible retention, ingests a low single-digit GB/day and lands around ₹3,000–₹8,000 / month (~US$36–96). The same estate at DEBUG with 2-year blanket retention can be 5–15× that for no extra insight — the bill is a function of the two levers, not the workload’s size. For free-tier learning, the 30-day window and daily grant mean a hobby project often costs nothing; just delete the workspace when done.
Interview & exam questions
These come up in AZ-104 and AZ-204 monitoring sections.
1. What is the core difference between Azure Monitor metrics and logs? Metrics are numeric values sampled at intervals (≈1 min) with low-cardinality dimensions, in a fast, free time-series store. Logs are full structured records in a workspace, queried with KQL and billed per GB. Metrics are for trends/alerts; logs for investigation/audit.
2. Where do platform metrics come from, and what do they cost? Emitted automatically by every Azure resource into the metrics store — no config — and free to collect and view. You pay only for custom metrics beyond a quota and a small amount per metric-alert time-series.
3. A resource’s diagnostic logs are missing when you go to investigate. Why? Almost certainly no diagnostic setting was created. Platform metrics flow automatically, but diagnostic logs are only stored once a setting routes them somewhere.
4. What language do you use to query a Log Analytics workspace?
KQL (Kusto Query Language) — pipeline syntax: a table, then | where, | summarize, | project, | order by. Metrics are charted with aggregations in Metrics explorer, not KQL.
5. Why might a Log Analytics bill be unexpectedly high, and how do you find out?
Too much ingested data or over-long retention. Query the Usage table grouped by DataType to see which tables dominate; common culprits are verbose app logs and AllMetrics copied into the workspace.
6. When should you use a metric alert versus a log (scheduled query) alert? A metric alert for fast, near-real-time paging (~1 min) on numeric thresholds. A log alert when the condition can only be expressed as a KQL query; it runs on a schedule (minutes), so it is inherently slower.
7. What are the default and maximum retention for platform metrics versus a workspace? Platform metrics retain a rolling 93 days (not configurable). A workspace gives 30 days free, then per-table interactive up to ~730 days and archive up to ~12 years total.
8. How do you route one resource’s telemetry to two destinations? Create a diagnostic setting listing both — e.g. a workspace (queryable logs) and a storage account (cheap raw archive). One setting can target multiple destinations.
9. Why can’t a metric answer “which user hit the error”? Metrics store only a number plus low-cardinality dimensions; per-record fields like user ID are never kept. That needs the per-event detail only logs retain.
10. You need CPU correlated with application errors in one query. What do you do, and what’s the catch?
Copy platform metrics into the workspace (AllMetrics) so they land as AzureMetrics rows you can join in KQL. The catch: those rows are now billable log ingestion, whereas the same metrics are free in the metrics store — only do it when you need the join.
11. What’s the cheapest place to keep high-volume audit logs you rarely query? A storage account destination (cheapest GB), or the workspace’s archive tier for occasional KQL via a search job. Both avoid paying interactive log prices for data you seldom read.
12. How does Application Insights relate to this? It stores its telemetry (requests, dependencies, exceptions, traces) in a Log Analytics workspace, so the same per-GB ingestion and retention rules apply. It is the application-level lens over the workspace.
Quick check
- You want a CPU% tile that refreshes instantly and costs nothing. Which store?
- An incident review asks which URL returned the 500s. Which store can answer, and why?
- A resource’s diagnostic logs are empty. Most likely cause?
- Your Log Analytics bill jumped. Which KQL table tells you what’s driving it?
- Why does copying
AllMetricsinto a workspace add cost, when the same metrics are free elsewhere?
Answers
- Metrics — free, sub-second to chart, and CPU% is a pure trend line.
- Logs (Log Analytics) — only logs keep per-request fields like
CsUriStem; a metric stored just the count. - No diagnostic setting was created — metrics flow automatically, but logs are only stored once a setting routes them.
- The
Usagetable —summarize sum(Quantity) by DataTypeshows which tables dominate. - Copied metrics become
AzureMetricslog rows billed per GB, whereas the originals are free in the metrics store.
Glossary
- Azure Monitor — The umbrella service that collects, stores, queries and alerts on all Azure telemetry; the front door over both stores.
- Metric — A numeric value sampled at a fixed interval with a few low-cardinality dimensions; in the metrics store.
- Metrics store — The built-in, always-on time-series DB for metrics; free for platform metrics, ~1-min granularity, 93-day retention.
- Platform metric — A metric emitted automatically by a resource (CPU, requests), free.
- Custom metric — A numeric metric you publish from your app or agent; free up to a quota.
- Log Analytics workspace — A regional, queryable log store you create; structured records, billed per GB ingested.
- Log entry — A timestamped, multi-column record with full context (URL, user, status, duration), in a workspace.
- KQL (Kusto Query Language) — The pipeline query language for Log Analytics:
table | where | summarize | project. - Diagnostic setting — Per-resource router sending logs and/or metrics to a workspace, storage account, and/or Event Hub.
- Aggregation — How a metric is summarised over a time grain: Avg, Sum, Count, Min, Max.
- Ingestion — Data flowing into a workspace; the main Log Analytics cost driver.
- Archive tier — Cheaper, cold workspace storage for rarely-queried data, via search job/restore.
- Data Collection Rule (DCR) — The newer pipeline config defining what the Azure Monitor Agent collects and where it sends it.
- Metric alert / log alert — Alerts on a metric stream (near-real-time) or a scheduled KQL query (minutes).
Next steps
- Go deeper on the application lens — traces, dependencies, exceptions — in Azure Monitor & Application Insights for observability.
- Practise diagnosing real failures with Troubleshooting Azure App Service: 502/503, cold starts & restart loops.
- Keep the log bill in check by wiring Cost Management budgets with email and action-group alerts.
- Make monitoring costs visible per team with a tagging strategy for cost allocation.
- Keep secrets out of logs with Azure Key Vault: secrets, keys & certificates.