Every other lesson in this course treats Argo CD as the thing that does the work: it renders manifests, diffs desired against live, and applies the difference. This lesson turns the telescope around and points it at Argo CD itself. Because here is the uncomfortable truth about a GitOps control plane running on automated sync: when it degrades, nobody clicks a button and sees an error. There is no human in the loop to notice that syncs are taking four minutes instead of four seconds, or that a third of the fleet quietly slipped to OutOfSync twenty minutes ago. The deploys just… stop landing. The only way you find out on a good day is a confused developer asking why their merged PR isn’t live; on a bad day it’s an incident.
Observability is how you replace “a developer noticed” with “a dashboard showed it and an alert fired.” The good news is that Argo CD is excellent at being observed — every component ships a Prometheus /metrics endpoint out of the box, and the metrics it exposes are genuinely rich: a histogram of reconcile latency, a counter of syncs by outcome, per-app sync/health state, Kubernetes API call volume, cluster cache age, controller work-queue depth. This lesson is about turning that firehose into three things you can act on: dashboards that show the state of the platform at a glance, SLOs that define “healthy” as a number instead of a vibe, and alerts that fire on the leading indicator rather than the post-mortem.
We target Argo CD 2.13+ / 3.x on Kubernetes 1.29+, and we use the Prometheus Operator (kube-prometheus-stack) as the reference stack because its ServiceMonitor CRD is the industry default — with a per-cloud table for the managed Prometheus/Grafana services on AKS, EKS, and GKE, since that edge genuinely differs. Every metric name in this lesson is real; every PromQL query is schema-correct. Where you see query output, it is representative sample data chosen to teach the shape of the result, not a claim that it was scraped from a live cluster.
Why this matters
Argo CD sits on the critical path of every deployment. Push a commit, and the repo-server has to fetch it and render manifests, the application-controller has to diff and apply, and the target cluster has to converge. If any link in that chain is slow or broken, the symptom a developer sees — “my change isn’t live” — is many minutes and one abstraction layer removed from the cause. Observability collapses that gap: instead of guessing whether the problem is Git, the repo-server, the controller, or the cluster, you look at four numbers and know.
The failure modes that make Argo CD worth instrumenting are almost all silent ones. This is the mental model to carry through the lesson — a control plane fails quietly, and the metric is the only witness:
| Silent failure | What the developer sees | The metric that catches it early |
|---|---|---|
| Controller overloaded, reconcile latency climbing | “My merge took 8 minutes to deploy” | argocd_app_reconcile p95 rising |
| Repo-server slow on a big monorepo | Intermittent slow syncs, no error | argocd_git_request_duration_seconds p95 |
App stuck OutOfSync after a bad manifest |
“It says it deployed but it didn’t” | argocd_app_info{sync_status="OutOfSync"} for > 15m |
| Sync silently failing on a hook | Old version still running | argocd_app_sync_total{phase="Failed"} increasing |
| Hitting the target cluster’s API rate limit | Reconciles slow across the whole fleet | argocd_app_k8s_request_total{response_code="429"} |
| Cluster cache gone stale / disconnected | Diffs wrong, apps flap | argocd_cluster_connection_status == 0 |
| Controller work-queue backing up | Everything lags, no single app is “broken” | workqueue_depth{name="app_reconciliation_queue"} |
Notice the pattern: none of these throws a red banner in the UI you’d catch by luck. Each is a number that drifts in the wrong direction for minutes before anyone feels it. The single most important of them is reconcile latency — argocd_app_reconcile, a histogram of how long the controller takes to complete one compare-desired-vs-live loop for an application. It is the leading indicator: when the controller starts to struggle (too many apps, a slow cluster, a repo-server bottleneck), reconcile p95 climbs first, while syncs still mostly succeed. By the time syncs visibly fail, you’re already late. Watching reconcile p95 is watching Argo CD’s pulse.
There’s a second reason this lesson exists as its own topic: Argo CD’s own health is a prerequisite for every guardrail you built elsewhere. Your notifications only page you if the controller is alive to evaluate triggers. Your scaling and sharding decisions are only defensible if you have the work-queue and latency numbers that justify them. And your HA and disaster-recovery posture is only real if you can see a component fall over. Metrics are the connective tissue.
The metrics endpoints: one /metrics port per component
Argo CD is not one process — it’s a handful of cooperating components, and each exposes its own Prometheus /metrics endpoint on its own port. You scrape them separately, and each tells you about a different part of the pipeline. If you learn nothing else structural from this lesson, learn this table — it’s the map for everything that follows:
| Component | Deployment/StatefulSet | Metrics port | Metrics Service (default install) | What its metrics tell you |
|---|---|---|---|---|
| application-controller | argocd-application-controller (StatefulSet) |
8082 | argocd-application-controller-metrics |
The richest source: reconcile latency, syncs by outcome, app sync/health, k8s API volume, cluster cache, work-queue |
| repo-server | argocd-repo-server (Deployment) |
8084 | argocd-repo-server (port named metrics) |
Git fetch volume and latency, manifest-generation pressure, pending requests |
| api-server | argocd-server (Deployment) |
8083 | argocd-server-metrics |
gRPC/HTTP request rates and codes for the API/UI, Redis calls |
| applicationset-controller | argocd-applicationset-controller |
8080 | argocd-applicationset-controller |
Generator reconcile counts/errors, apps owned/generated |
| notifications-controller | argocd-notifications-controller |
9001 | argocd-notifications-controller-metrics |
Trigger evaluations and delivery successes/failures |
Two things trip people up here. First, the application-controller runs as a StatefulSet, and its metrics come out of a separate Service (argocd-application-controller-metrics) rather than the controller pod’s main port — you scrape the metrics Service, not the controller directly. Second, the repo-server’s Service carries two ports — the gRPC service port (8081) that the controller talks to, and a metrics port (8084) — so your scrape config must name the metrics port explicitly or you’ll scrape the wrong one and get nothing useful.
The endpoints speak the standard Prometheus text exposition format. A raw scrape of the controller looks like this (representative sample — the shape is what matters):
# From inside the cluster, port-forward the controller metrics service and curl it
kubectl -n argocd port-forward svc/argocd-application-controller-metrics 8082:8082 &
curl -s http://localhost:8082/metrics | grep '^argocd_app_info'
# representative output
argocd_app_info{name="checkout",namespace="argocd",project="tenants",repo="https://github.com/acme/app-config",dest_server="https://kubernetes.default.svc",dest_namespace="checkout",health_status="Healthy",sync_status="Synced",operation="",autosync_enabled="true"} 1
argocd_app_info{name="inventory",namespace="argocd",project="tenants",repo="https://github.com/acme/app-config",dest_server="https://kubernetes.default.svc",dest_namespace="inventory",health_status="Degraded",sync_status="OutOfSync",operation="Sync",autosync_enabled="true"} 1
That single metric already teaches the most important correctness lesson in the whole topic, which the badges on the diagram below call out: health and sync status are not separate metrics — they are labels on argocd_app_info, whose value is always 1. More on that in a moment; first, the pipeline as a whole.
Read the diagram left to right. Each Argo CD component (left) exposes a /metrics port; a ServiceMonitor tells Prometheus which Service and port to scrape; PromQL over the time-series database drives Grafana dashboards and PrometheusRule alerts; and SLOs turn the raw numbers into an error budget that pages on-call. The badges mark the six things that most often bite: the reconcile histogram as the vital sign (1), status living in labels not gauges (2), the ServiceMonitor selector label that silently drops your targets (3), cardinality as the cost you pay for careless labels (4), alerting on the leading indicator (5), and the SLO/error-budget that converts “feels slow” into a decision to scale (6).
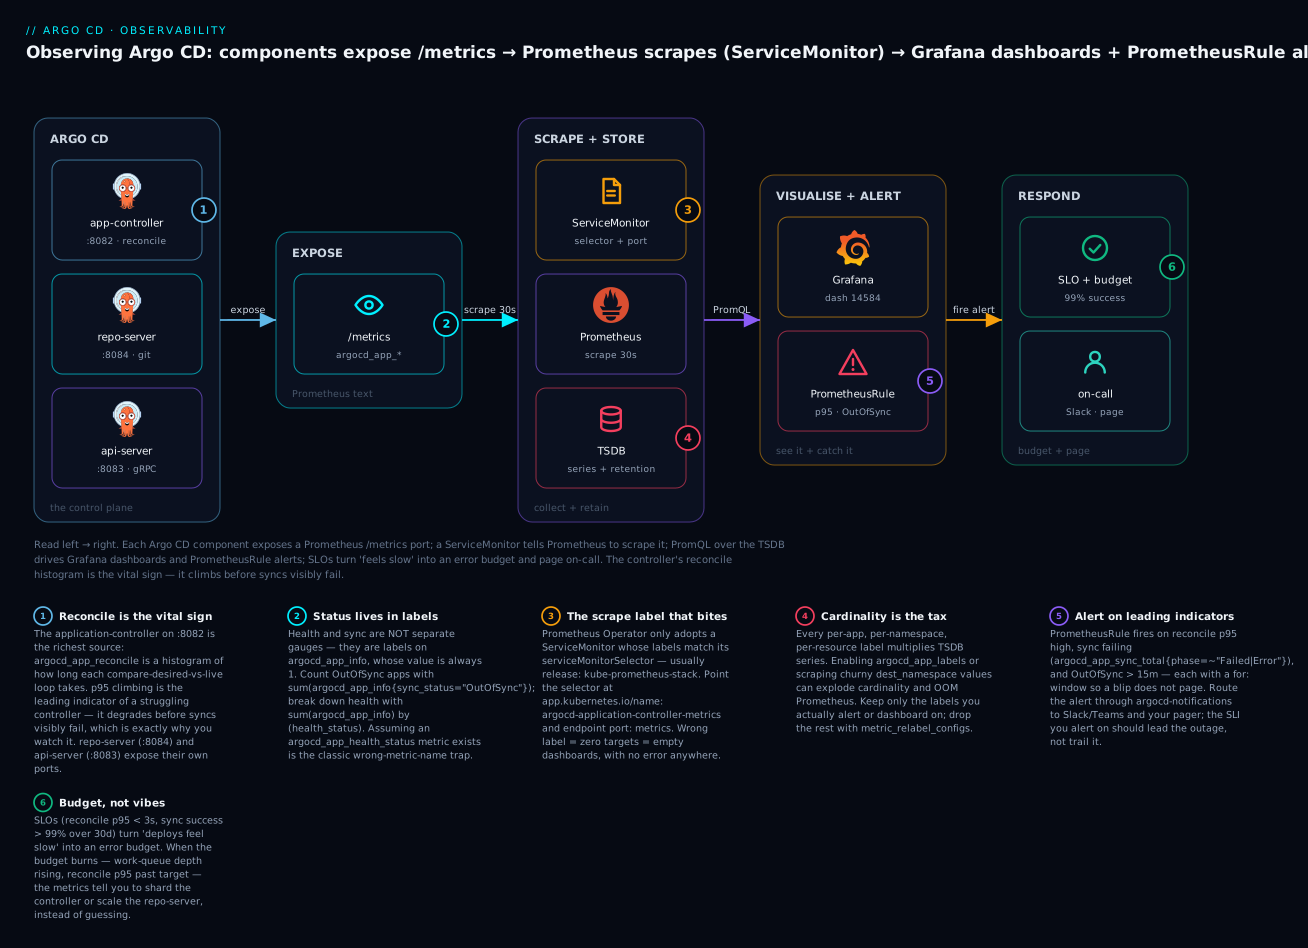
This pipeline is almost entirely cloud-neutral — the metric names, the PromQL, the dashboards, and the alerts are identical whether Argo CD runs on AKS, EKS, GKE, or a laptop kind cluster. The one genuine cloud edge is which Prometheus and Grafana you scrape into and view from — self-managed kube-prometheus-stack, or the managed offering on each cloud — and we cover that edge explicitly in the scraping section.
The metrics that matter, component by component
You could dashboard every series Argo CD emits and drown. The skill is knowing the fifteen-odd metrics that carry real signal. We’ll go component by component, richest first.
application-controller (:8082) — the vital signs
This is the component you instrument first and most. It owns the reconcile loop, so it knows how long reconciliation takes, how many syncs succeeded or failed, what state every app is in, and how hard it’s leaning on the target clusters’ APIs.
| Metric | Type | Key labels | What it tells you |
|---|---|---|---|
argocd_app_info |
gauge (=1) | name, project, dest_server, health_status, sync_status, autosync_enabled |
The roster: one series per app carrying its current sync and health status as labels. Count/group these for fleet state |
argocd_app_reconcile |
histogram | namespace, dest_server |
The vital sign. Seconds per reconcile loop. Use _bucket for histogram_quantile (p50/p95/p99), _count for reconcile rate |
argocd_app_sync_total |
counter | name, project, dest_server, phase |
Cumulative sync operations by outcome (phase: Succeeded, Failed, Error, Running). The basis of sync success rate |
argocd_app_k8s_request_total |
counter | server, response_code, verb, resource_kind, resource_namespace |
Kubernetes API calls the controller makes while reconciling. Spot throttling (response_code="429") and chatty resources |
argocd_kubectl_exec_total |
counter | command |
Count of kubectl executions (server-side apply, hooks). Rising = apply pressure |
argocd_kubectl_exec_pending |
gauge | command |
Pending kubectl executions right now — a live saturation signal for the apply path |
argocd_cluster_info |
gauge | server, k8s_version |
One series per managed cluster; join key for the cluster metrics below |
argocd_cluster_connection_status |
gauge | server, k8s_version |
1 = connected, 0 = failed. A 0 means the controller can’t talk to that cluster — diffs and syncs there are dead |
argocd_cluster_cache_age_seconds |
gauge | server |
Age of the controller’s cached view of a cluster. If it climbs unbounded, the watch/cache is unhealthy |
argocd_cluster_api_resource_objects |
gauge | server |
Number of objects the controller caches for a cluster. A capacity/memory signal that scales with fleet size |
argocd_cluster_events_total |
counter | server |
Rate of Kubernetes resource events processed. A busy or flapping cluster shows up here |
argocd_redis_request_total |
counter | initiator, failed |
Redis calls from the controller; failed="true" rising means the cache layer is unhappy |
Plus the standard client-go work-queue metrics, which are not Argo-specific but are indispensable for the controller:
| Metric | Type | Key label | What it tells you |
|---|---|---|---|
workqueue_depth |
gauge | name (app_reconciliation_queue, app_operation_processing_queue) |
Items waiting to be processed. A depth that grows and does not drain is the clearest “the controller is behind” signal |
workqueue_adds_total |
counter | name |
How fast work is arriving |
workqueue_queue_duration_seconds |
histogram | name |
How long items wait before processing — latency before work even starts |
workqueue_work_duration_seconds |
histogram | name |
How long processing each item takes |
workqueue_depth (operation queue) |
gauge | name="app_operation_processing_queue" |
Backlog specifically of sync operations, distinct from the reconcile queue |
The histogram deserves a word because half the mistakes in this topic come from misusing it. A Prometheus histogram is really three metric families sharing a base name:
| Series | Meaning | You use it for |
|---|---|---|
argocd_app_reconcile_bucket{le="..."} |
Cumulative count of observations ≤ le seconds |
histogram_quantile() to get p50/p95/p99 |
argocd_app_reconcile_count |
Total number of reconciles observed | rate() → reconciles per second (and “is the controller reconciling at all?”) |
argocd_app_reconcile_sum |
Sum of all reconcile durations | sum/count → mean reconcile time |
The default reconcile buckets top out around 16 seconds (the boundaries are roughly 0.25, 0.5, 1, 2, 4, 8, 16). That ceiling matters: if real reconciles routinely exceed 16s, they all pile into the +Inf bucket and histogram_quantile can no longer tell 17s from 90s — your p99 flatlines at a meaningless number. That’s the “missing histogram buckets” gotcha in the troubleshooting table, and the fix is to widen the buckets (where your distribution allows it) or, better, to fix why reconciles are that slow.
repo-server (:8084) — Git and manifest generation
The repo-server clones repositories and renders manifests (plain YAML, Kustomize, Helm template, plugins). When syncs are slow but the controller looks fine, the repo-server is the usual suspect — especially with a big monorepo.
| Metric | Type | Key labels | What it tells you |
|---|---|---|---|
argocd_git_request_total |
counter | repo, request_type (ls-remote, fetch) |
Git operation volume per repo. A spike in fetch on one repo = churn or cache misses |
argocd_git_request_duration_seconds |
histogram | repo, request_type |
Manifest-generation pressure’s leading edge. p95 of fetch climbing = slow Git or a heavy repo; feeds sync latency |
argocd_repo_pending_request_total |
gauge | repo |
Requests queued at the repo-server right now. Sustained > 0 means the repo-server is a bottleneck — scale replicas |
argocd_redis_request_total |
counter | initiator, failed |
Repo-server ↔ Redis cache calls; failures here mean rendered manifests aren’t caching |
A correctness note the brief demands honesty on: Argo CD does not expose a single “manifest generation took N seconds” histogram with a clean dedicated name. You infer manifest-generation cost from argocd_git_request_duration_seconds (the fetch/clone portion) combined with the end-to-end argocd_app_reconcile on the controller, and from argocd_repo_pending_request_total as the saturation signal. Don’t go looking for argocd_repo_manifest_generation_seconds — it isn’t there.
api-server (:8083) — the front door
The api-server serves the UI and the argocd CLI. Its metrics are mostly the standard gRPC server metrics plus Redis calls. You watch it to answer “is the API healthy and fast for users and CI?”
| Metric | Type | Key labels | What it tells you |
|---|---|---|---|
grpc_server_handled_total |
counter | grpc_service, grpc_method, grpc_code |
API call volume and errors. grpc_code!="OK" rising = failing API calls (auth, RBAC, upstream) |
grpc_server_started_total |
counter | grpc_service, grpc_method |
In-flight vs completed calls; pair with handled to spot hung requests |
argocd_redis_request_total |
counter | initiator, failed |
The api-server’s Redis dependency; failures degrade the UI/CLI |
go_goroutines, process_resident_memory_bytes |
gauge | (per target) | Standard Go/process health for the api-server pod |
applicationset-controller (:8080) — generator health
If you drive your fleet with ApplicationSets, this controller’s health decides whether new Application objects even get created. It’s built on controller-runtime, so it always exposes those metrics; recent Argo CD versions add Argo-specific ones too.
| Metric | Type | Key labels | What it tells you |
|---|---|---|---|
controller_runtime_reconcile_total |
counter | controller, result |
ApplicationSet reconciles by result (success/error/requeue) — the base health signal |
controller_runtime_reconcile_errors_total |
counter | controller |
Generation is erroring — new/updated apps aren’t being produced |
controller_runtime_reconcile_time_seconds |
histogram | controller |
How long generation takes (matters for big matrix generators) |
argocd_appset_info |
gauge | name, namespace |
One series per ApplicationSet (recent versions) |
argocd_appset_owned_applications |
gauge | name |
How many Applications each ApplicationSet currently owns — watch for unexpected fan-out |
argocd_appset_reconcile |
histogram | name |
ApplicationSet reconcile latency (recent versions) |
The argocd_appset_* metrics arrived in newer releases; on 2.13+/3.x they’re present, but if you’re on an older build, lean on the always-present controller_runtime_* set.
notifications-controller (:9001) — did the page actually send?
The notifications controller evaluates triggers and delivers to Slack/Teams/webhooks. Its metrics answer the question every on-call cares about: did my alert actually get delivered, or did it silently fail? This ties directly to the notifications lesson.
| Metric | Type | Key labels | What it tells you |
|---|---|---|---|
argocd_notifications_trigger_eval_total |
counter | name, triggered |
How often each trigger evaluated and whether it fired (triggered="true") |
argocd_notifications_deliveries_total |
counter | trigger, service, succeeded |
Deliveries by channel and outcome. succeeded="false" rising = your alerts aren’t reaching anyone |
A succeeded="false" climbing on argocd_notifications_deliveries_total is a genuinely scary metric — it means the system you rely on to tell you about problems is itself broken. Alert on it.
Scraping: ServiceMonitor, PodMonitor, and the label that bites
Exposing metrics does nothing until something scrapes them. In a Prometheus Operator world (kube-prometheus-stack, which is what most teams run), you don’t edit prometheus.yml — you create a ServiceMonitor custom resource, and the operator turns it into scrape config. Here’s the controller’s, with the two fields people get wrong flagged inline:
apiVersion: monitoring.coreos.com/v1
kind: ServiceMonitor
metadata:
  name: argocd-application-controller
  namespace: argocd
  labels:
    release: kube-prometheus-stack   # <-- MUST match Prometheus's serviceMonitorSelector
spec:
  selector:
    matchLabels:
      app.kubernetes.io/name: argocd-application-controller-metrics  # <-- the metrics Service's label
  endpoints:
    - port: metrics            # <-- the NAMED port on the Service, not a number
      interval: 30s
      path: /metrics
Two labels, two different jobs, and mixing them up is the number-one reason “I applied a ServiceMonitor and got no data”:
- The
metadata.labelson the ServiceMonitor must match the Prometheus resource’sserviceMonitorSelector. kube-prometheus-stack ships withserviceMonitorSelector: { matchLabels: { release: kube-prometheus-stack } }by default. No matching label, and Prometheus never even reads your ServiceMonitor — no error, no target, just silence. - The
spec.selector.matchLabelsmust match the labels on the metrics Service, andendpoints.portmust be the named port (metrics), not8082.
You need one per component you care about. The repo-server and api-server ServiceMonitors follow the same shape:
apiVersion: monitoring.coreos.com/v1
kind: ServiceMonitor
metadata:
  name: argocd-repo-server
  namespace: argocd
  labels:
    release: kube-prometheus-stack
spec:
  selector:
    matchLabels:
      app.kubernetes.io/name: argocd-repo-server
  endpoints:
    - port: metrics
      interval: 30s
---
apiVersion: monitoring.coreos.com/v1
kind: ServiceMonitor
metadata:
  name: argocd-server
  namespace: argocd
  labels:
    release: kube-prometheus-stack
spec:
  selector:
    matchLabels:
      app.kubernetes.io/name: argocd-server-metrics
  endpoints:
    - port: metrics
      interval: 30s
If you’re not running the Prometheus Operator, you have two other options. A PodMonitor works the same way but selects pods directly (useful when there’s no metrics Service). And with a vanilla Prometheus, you fall back to scrape annotations on the Service plus a generic kubernetes_sd_configs job — Argo CD doesn’t add these by default, so you patch them on:
# Alternative: annotations for annotation-based scrape config (non-Operator Prometheus)
metadata:
  annotations:
    prometheus.io/scrape: "true"
    prometheus.io/port: "8082"
    prometheus.io/path: "/metrics"
| Approach | CRD / mechanism | When to use it |
|---|---|---|
| ServiceMonitor | monitoring.coreos.com/v1 |
You run the Prometheus Operator / kube-prometheus-stack. The default choice |
| PodMonitor | monitoring.coreos.com/v1 |
Operator present but no metrics Service, or you want per-pod scraping |
| Scrape annotations | prometheus.io/* annotations + SD job |
Plain Prometheus without the Operator |
The cloud edge: managed Prometheus and Grafana per cloud
Everything above assumes you run Prometheus yourself. Each cloud also offers a managed metrics-and-dashboards stack, and this is the one place the observability story is genuinely cloud-specific — the scrape-config CRD and the identity used to authenticate differ:
| Concern | AKS (Azure) | EKS (AWS) | GKE (Google Cloud) |
|---|---|---|---|
| Managed metrics store | Azure Monitor managed service for Prometheus | Amazon Managed Service for Prometheus (AMP) | Google Cloud Managed Service for Prometheus (GMP) |
| Managed dashboards | Azure Managed Grafana | Amazon Managed Grafana (AMG) | Cloud Monitoring / Managed Grafana |
| Scrape-config mechanism | ama-metrics config + Pod/ServiceMonitor CRDs (azmonitoring.coreos.com) |
ADOT collector or Prometheus agent → remote_write to AMP |
PodMonitoring / ClusterPodMonitoring CRD (monitoring.googleapis.com) |
| Identity for scrape/remote-write | Microsoft Entra Workload ID / managed identity | IRSA or EKS Pod Identity + SigV4 signing | Workload Identity |
| Self-managed alternative | kube-prometheus-stack (identical to on-prem) | kube-prometheus-stack | kube-prometheus-stack |
The important reassurance: the metric names, PromQL, dashboards, and alert rules in this lesson are byte-for-byte identical across all three — only the plumbing that gets Argo CD’s /metrics into the store changes. Where the scrape CRD differs, here are the paired forms for the same target (the application-controller):
# AKS — Azure Monitor managed Prometheus uses its own CRD group
apiVersion: azmonitoring.coreos.com/v1
kind: ServiceMonitor
metadata:
  name: argocd-application-controller
  namespace: argocd
spec:
  selector:
    matchLabels:
      app.kubernetes.io/name: argocd-application-controller-metrics
  endpoints:
    - port: metrics
      interval: 30s
# GKE — Managed Service for Prometheus uses PodMonitoring
apiVersion: monitoring.googleapis.com/v1
kind: PodMonitoring
metadata:
  name: argocd-application-controller
  namespace: argocd
spec:
  selector:
    matchLabels:
      app.kubernetes.io/name: argocd-application-controller
  endpoints:
    - port: 8082
      interval: 30s
# EKS — Amazon Managed Prometheus: a Prometheus agent (or ADOT) scrapes and remote_writes.
# The scrape job is standard Prometheus SD; AMP is the remote_write target with SigV4 auth.
# remote_write:
#   - url: https://aps-workspaces.<region>.amazonaws.com/workspaces/<ws-id>/api/v1/remote_write
#     sigv4:
#       region: <region>
If you want the same experience on all three clouds and the least surprise, run kube-prometheus-stack yourself — it’s the cloud-neutral path, and the rest of this lesson works verbatim on top of it.
The dashboards that matter
A good Argo CD dashboard answers five questions in five seconds: Is the fleet in sync? Is the controller keeping up? Are syncs succeeding? Is any app stuck? Are the components healthy? Here are the panels that earn their place, each with the real metric and the exact PromQL. This is the reference table to keep open while you build:
| Panel | Question it answers | PromQL |
|---|---|---|
| Apps by sync status | Is the fleet in sync? | sum(argocd_app_info) by (sync_status) |
| Apps by health | Is anything unhealthy? | sum(argocd_app_info) by (health_status) |
| OutOfSync count | How many apps are drifted right now? | sum(argocd_app_info{sync_status="OutOfSync"}) |
| Reconcile latency p50/p95/p99 | Is the controller keeping up? (the vital sign) | histogram_quantile(0.95, sum(rate(argocd_app_reconcile_bucket[5m])) by (le)) |
| Reconcile rate | Is the controller reconciling at all? | sum(rate(argocd_app_reconcile_count[5m])) |
| Sync activity by outcome | Are syncs happening and succeeding? | sum(rate(argocd_app_sync_total[5m])) by (phase) |
| Sync failure rate | What fraction of syncs fail? | sum(rate(argocd_app_sync_total{phase=~"Failed|Error"}[5m])) / sum(rate(argocd_app_sync_total[5m])) |
| Repo-server Git latency p95 | Is manifest generation slow? | histogram_quantile(0.95, sum(rate(argocd_git_request_duration_seconds_bucket{request_type="fetch"}[5m])) by (le, repo)) |
| Repo-server pending requests | Is the repo-server a bottleneck? | sum(argocd_repo_pending_request_total) by (repo) |
| k8s API requests by code | Are we being throttled? | sum(rate(argocd_app_k8s_request_total[5m])) by (response_code) |
| Cluster cache age | Is any cluster’s cache stale? | max(argocd_cluster_cache_age_seconds) by (server) |
| Cluster connectivity | Is every cluster reachable? | min(argocd_cluster_connection_status) by (server) |
| Controller work-queue depth | Is the controller falling behind? | sum(workqueue_depth{name=~"app.*"}) by (name) |
| Memory per component | Is anything leaking / near limit? | process_resident_memory_bytes{job=~"argocd-.*"} |
| CPU per component | Which component is hot? | sum(rate(process_cpu_seconds_total{job=~"argocd-.*"}[5m])) by (job) |
Two of these queries carry the correctness lessons worth repeating. OutOfSync count uses sum(argocd_app_info{sync_status="OutOfSync"}) — because argocd_app_info has value 1 per app, summing it counts the matching apps. There is no argocd_app_outofsync_total and no argocd_app_health_status gauge; the state is in the label. And the reconcile latency panel reads argocd_app_reconcile_bucket (the histogram’s bucket series), never the bare argocd_app_reconcile — feeding histogram_quantile anything but a _bucket series is a silent no-op that returns NaN.
The official dashboards, and their IDs
You don’t have to build all fifteen panels by hand. The Argo CD project ships a reference dashboard in its own repository, and there’s a widely-used community import on grafana.com:
| Source | How to get it | Notes |
|---|---|---|
| Argo CD project dashboard | examples/dashboard.json in the argoproj/argo-cd repo |
The canonical reference; import the raw JSON in Grafana → Dashboards → Import |
| grafana.com community | Dashboard ID 14584 (“Argo CD”) | Import by ID; the most commonly deployed community dashboard |
| kube-prometheus-stack extras | Bundled via the grafana.dashboards values or a sidecar |
Handy if you already run the stack; add the Argo CD JSON as a ConfigMap the Grafana sidecar picks up |
Import is the same regardless of source: in Grafana, Dashboards → New → Import, paste the ID 14584 (or the raw JSON), and pick your Prometheus datasource. If the panels come up empty afterwards, it’s almost always the datasource or a label mismatch — covered in troubleshooting.
A dashboard panel, as JSON
Dashboards are JSON, and sometimes you provision them as code (a ConfigMap the Grafana sidecar loads) rather than clicking Import. Here’s a single, schema-correct Grafana timeseries panel for the reconcile-latency p50/p95/p99 — the one panel to put top-left on any Argo CD dashboard:
{
  "type": "timeseries",
  "title": "Reconcile latency (p50 / p95 / p99)",
  "datasource": { "type": "prometheus", "uid": "${DS_PROMETHEUS}" },
  "fieldConfig": { "defaults": { "unit": "s" } },
  "gridPos": { "h": 8, "w": 12, "x": 0, "y": 0 },
  "targets": [
    { "refId": "A", "legendFormat": "p50",
      "expr": "histogram_quantile(0.50, sum(rate(argocd_app_reconcile_bucket[5m])) by (le))" },
    { "refId": "B", "legendFormat": "p95",
      "expr": "histogram_quantile(0.95, sum(rate(argocd_app_reconcile_bucket[5m])) by (le))" },
    { "refId": "C", "legendFormat": "p99",
      "expr": "histogram_quantile(0.99, sum(rate(argocd_app_reconcile_bucket[5m])) by (le))" }
  ]
}
The ${DS_PROMETHEUS} templated datasource is what makes a provisioned dashboard portable across clusters; the unit: "s" makes Grafana render the y-axis in seconds/ms rather than a bare number.
SLOs and error budgets for Argo CD
Dashboards tell you what’s happening; SLOs tell you whether you should care. A Service Level Objective is a target on a Service Level Indicator (a measurable ratio or latency), plus an error budget — the amount of “bad” you’ll tolerate before you stop shipping features and go fix reliability. For a deploy control plane, three SLIs cover the ground:
| SLI | What it measures | Metric basis | Why it’s the right signal |
|---|---|---|---|
| Reconcile latency | How fast the controller closes the loop | argocd_app_reconcile_bucket (p95/p99) |
Leading indicator; degrades before syncs fail |
| Sync success rate | Fraction of syncs that succeed | argocd_app_sync_total by phase |
Directly measures “do deploys land?” |
| Sync freshness | How long apps stay OutOfSync |
argocd_app_info{sync_status="OutOfSync"} duration |
Catches “stuck” apps a success-rate SLI misses |
A workable starting set of targets — tune the numbers to your fleet, but start here:
| SLO | Target | Measurement window | Error budget |
|---|---|---|---|
| Reconcile latency | p95 argocd_app_reconcile < 3s |
30 days rolling | 5% of time may exceed |
| Reconcile latency (tail) | p99 argocd_app_reconcile < 8s |
30 days rolling | 1% of time may exceed |
| Sync success rate | > 99% of syncs succeed | 30 days rolling | 1% may fail = the budget |
| Sync freshness | 95% of apps OutOfSync < 5 min |
30 days rolling | 5% may exceed |
The sync-success SLI is a clean ratio you can compute directly:
# 30-day sync success rate (a number between 0 and 1)
sum(increase(argocd_app_sync_total{phase="Succeeded"}[30d]))
/
sum(increase(argocd_app_sync_total[30d]))
And the error budget is just 1 − SLO. With a 99% target, your budget is 1% of syncs. If you did 4,000 syncs this month, you can “afford” 40 failures; the burn rate — how fast you’re consuming that 40 — is what tells you whether to keep shipping or to stop and shard the controller:
# Error-budget burn: failed syncs this month vs the 1% budget of total syncs
sum(increase(argocd_app_sync_total{phase=~"Failed|Error"}[30d]))
/
(0.01 * sum(increase(argocd_app_sync_total[30d])))
A value > 1 means you’ve blown the budget; 0.5 means you’re halfway through it with the month not over. This is the number that turns “Argo CD feels a bit flaky lately” into “we’re at 1.4× our error budget, freeze features and fix the repo-server.”
One honesty note that matters for SLO design: Argo CD does not expose a wall-clock “sync duration” histogram. argocd_app_sync_total is a counter of outcomes, not a timer. So you cannot write a true “95% of syncs complete in < N seconds” SLI from a built-in metric — that’s why the latency SLO above is built on argocd_app_reconcile (which is a histogram) and the freshness SLO on how long apps sit OutOfSync. If you genuinely need end-to-end sync-duration percentiles, you derive them from traces (next section) or by recording the operation start/finish times yourself. Don’t invent argocd_app_sync_duration_seconds — it isn’t there, and a dashboard built on a non-existent metric is worse than none.
Alerting with PrometheusRule
Alerts are SLIs with a for: clause and a pager attached. The art is alerting on leading indicators with enough for: window that a blip doesn’t wake anyone, but not so much that you find out too late. Here’s a PrometheusRule with the alerts that matter for Argo CD — this is the manifest to adapt:
apiVersion: monitoring.coreos.com/v1
kind: PrometheusRule
metadata:
  name: argocd-alerts
  namespace: argocd
  labels:
    release: kube-prometheus-stack     # same selector rule as ServiceMonitor
spec:
  groups:
    - name: argocd.rules
      rules:
        - alert: ArgoCDSyncFailing
          expr: |
            sum(increase(argocd_app_sync_total{phase=~"Failed|Error"}[10m]))
              by (name, dest_server) > 0
          for: 15m
          labels: { severity: warning }
          annotations:
            summary: "Argo CD app {{ $labels.name }} sync failing"
            description: "Syncs for {{ $labels.name }} on {{ $labels.dest_server }} have failed repeatedly for 15m."

        - alert: ArgoCDReconcileLatencyHigh
          expr: |
            histogram_quantile(0.95,
              sum(rate(argocd_app_reconcile_bucket[5m])) by (le)) > 3
          for: 10m
          labels: { severity: warning }
          annotations:
            summary: "Argo CD reconcile p95 above 3s"
            description: "Controller reconcile p95 has exceeded the 3s SLO for 10m — check work-queue depth and repo-server."

        - alert: ArgoCDAppOutOfSync
          expr: |
            sum(argocd_app_info{sync_status="OutOfSync"})
              by (name, dest_server) > 0
          for: 15m
          labels: { severity: warning }
          annotations:
            summary: "Argo CD app {{ $labels.name }} OutOfSync > 15m"
            description: "{{ $labels.name }} has been OutOfSync for 15m — a sync is stuck or failing."
Those are the three the lab asks for. In production you’d add a handful more; the full alert set worth shipping:
| Alert | Expression (core) | for: |
Severity | Fires when |
|---|---|---|---|---|
ArgoCDSyncFailing |
increase(argocd_app_sync_total{phase=~"Failed|Error"}[10m]) > 0 |
15m | warning | An app keeps failing to sync |
ArgoCDReconcileLatencyHigh |
histogram_quantile(0.95, ... argocd_app_reconcile_bucket ...) > 3 |
10m | warning | Controller p95 past SLO → consider sharding |
ArgoCDAppOutOfSync |
argocd_app_info{sync_status="OutOfSync"} > 0 |
15m | warning | An app is stuck drifted |
ArgoCDAppDegraded |
argocd_app_info{health_status=~"Degraded|Missing"} > 0 |
15m | warning | An app is unhealthy, not just drifted |
ArgoCDControllerNotReconciling |
sum(rate(argocd_app_reconcile_count[5m])) == 0 |
10m | critical | Controller has stopped reconciling entirely |
ArgoCDClusterDisconnected |
argocd_cluster_connection_status == 0 |
5m | critical | A managed cluster is unreachable |
ArgoCDComponentDown |
up{job=~"argocd-.*"} == 0 |
5m | critical | A component’s scrape target is down |
ArgoCDK8sThrottled |
rate(argocd_app_k8s_request_total{response_code="429"}[5m]) > 1 |
10m | warning | Target-cluster API is throttling the controller |
ArgoCDWorkqueueBacklog |
workqueue_depth{name="app_reconciliation_queue"} > 50 |
10m | warning | Reconcile queue not draining → behind |
ArgoCDRepoServerPending |
argocd_repo_pending_request_total > 0 |
15m | warning | Repo-server saturated → scale replicas |
ArgoCDNotificationsFailing |
increase(argocd_notifications_deliveries_total{succeeded="false"}[15m]) > 0 |
15m | critical | Your alerting path itself is broken |
Two design points do the heavy lifting. The for: clause is what separates a signal from noise: ArgoCDAppOutOfSync firing instantly would page on every routine sync (an app is briefly OutOfSync between a Git change and its sync); for: 15m means “still drifted a quarter-hour later,” which is a real problem. And the ArgoCDControllerNotReconciling alert on rate(argocd_app_reconcile_count[5m]) == 0 is subtle but vital — it’s the “the vital sign flatlined” alarm. A controller that’s slow trips the latency alert; a controller that’s dead stops emitting reconciles at all, and only this alert catches that.
These PrometheusRule alerts route through Alertmanager to your pager. To also surface them in Slack/Teams tied to specific apps, wire Argo CD’s own notifications controller — the two are complementary: Alertmanager for platform-health pages, argocd-notifications for per-app deploy events.
Capacity signals: when the metrics tell you to scale or shard
The best reason to instrument Argo CD is that the metrics make scaling decisions evidence-based instead of superstitious. Instead of “the controller feels slow, let’s throw CPU at it,” you read the specific signals that map to specific scaling and sharding actions:
| Signal | Metric | Threshold to act | What it means → action |
|---|---|---|---|
| Reconcile latency climbing | argocd_app_reconcile p95 |
Past your SLO (e.g. > 3s) and rising | Controller can’t keep up → shard the application-controller across replicas |
| Work-queue not draining | workqueue_depth{name="app_reconciliation_queue"} |
Sustained > 50 and growing | More work arriving than processed → shard, or raise --status-processors / --operation-processors |
| Target API throttling | argocd_app_k8s_request_total{response_code="429"} |
Any sustained rate | Controller hammering a cluster’s API → shard by cluster, tune resync, reduce chatty resources |
| Repo-server saturated | argocd_repo_pending_request_total |
Sustained > 0 | Manifest generation is the bottleneck → add repo-server replicas |
| Slow Git / heavy monorepo | argocd_git_request_duration_seconds p95 |
Growing on one repo |
A monorepo is expensive to render → repo-server replicas, caching, or split the repo |
| Cluster cache bloat | argocd_cluster_api_resource_objects |
Growing unbounded | Watch cache growing with fleet → more controller memory or shard |
| Controller memory | process_resident_memory_bytes{job="argocd-application-controller-metrics"} |
Approaching the pod limit | Cache + fleet outgrew the pod → raise limits or shard |
The through-line: work-queue depth and reconcile latency together are the shard signal. If the queue drains and latency is flat, one controller is fine no matter how many apps you have. If the queue climbs and p95 rises together, you’ve outgrown a single controller and it’s time to shard. The metrics turn that from a judgment call into a threshold. A slow repo-server, by contrast, shows up as pending requests and Git-latency p95 without a controller work-queue backlog — a different signal pointing at a different fix (more repo-server replicas), which is exactly why you scrape both.
Logs and traces (brief)
Metrics tell you that something is wrong and roughly where; logs tell you what, and traces tell you why it was slow. Two things to know, briefly.
Structured logs. All Argo CD components can emit JSON logs — set --logformat json (or the ARGOCD_LOG_FORMAT=json env, or the argocd-cmd-params-cm key) so a log pipeline (Loki, ELK, Cloud Logging) can parse fields instead of regexing text. The fields you’ll grep most:
| Log field | Meaning | Useful for |
|---|---|---|
level |
info / warn / error |
Filtering to real problems |
application |
The app being reconciled | Correlating a log line to a specific app’s OutOfSync |
sync_id / operation |
The sync operation | Following one sync end-to-end |
msg |
The human message | The actual error text (ComparisonError, rpc error…) |
dest_server |
Target cluster | Which cluster the action touched |
Set the level with --loglevel (info default; debug when chasing a gnarly sync). The pairing to internalize: a metric like ArgoCDSyncFailing tells you app X is failing to sync; you then pivot to the controller and repo-server logs filtered to application=X to read the actual ComparisonError or rpc error: code = Unauthenticated.
Distributed tracing (optional). Argo CD can emit OpenTelemetry traces — start components with --otlp-address <collector>:4317 (and related --otlp-* flags) to export spans to an OTLP collector (Tempo, Jaeger, or a cloud tracing backend). This is how you answer “why was this one reconcile slow?” — a trace breaks a reconcile into its spans (repo-server manifest generation, cluster API calls, diff) so you can see which stage ate the time, something a latency histogram alone can’t tell you. It’s genuinely optional: most teams run metrics + logs and reach for tracing only when a latency mystery resists the dashboards.
Hands-on lab
You’ll stand up Argo CD observability at the config level: a ServiceMonitor scraping the application-controller, the official Grafana dashboard imported, three PrometheusRule alerts, and a PromQL cheat-panel for reconcile latency. This lab writes real, apply-ready manifests and shows the representative shape of the results — no live-cluster run is claimed here. If you do have a cluster with kube-prometheus-stack and Argo CD installed, every manifest below applies cleanly.
Prereqs (if you’re following on a real cluster): Argo CD 2.13+/3.x installed in namespace
argocd, and kube-prometheus-stack installed (its Prometheus, by default, adopts ServiceMonitors labelledrelease: kube-prometheus-stack). On a laptop this is a free localkind/minikubecluster — nothing here bills. On AKS/EKS/GKE, using the managed Prometheus/Grafana instead may incur ⚠️ ingestion/query charges; the self-managed stack is free.
Step 1 — Scrape the controller. Write and apply the ServiceMonitor:
cat <<'YAML' | kubectl apply -f -
apiVersion: monitoring.coreos.com/v1
kind: ServiceMonitor
metadata:
  name: argocd-application-controller
  namespace: argocd
  labels:
    release: kube-prometheus-stack
spec:
  selector:
    matchLabels:
      app.kubernetes.io/name: argocd-application-controller-metrics
  endpoints:
    - port: metrics
      interval: 30s
      path: /metrics
YAML
# servicemonitor.monitoring.coreos.com/argocd-application-controller created
What just happened: You told the Prometheus Operator to scrape the controller’s metrics Service every 30s. The release: kube-prometheus-stack label is what makes Prometheus actually adopt it.
Step 2 — Confirm the target came up. In the Prometheus UI (Status → Targets) you should see the target UP. From the CLI, a quick sanity check of the raw endpoint:
kubectl -n argocd port-forward svc/argocd-application-controller-metrics 8082:8082 &
curl -s http://localhost:8082/metrics | grep -E '^argocd_app_(reconcile_count|sync_total)' | head
# representative output
argocd_app_reconcile_count{dest_server="https://kubernetes.default.svc",namespace="argocd"} 9751
argocd_app_sync_total{dest_server="https://kubernetes.default.svc",name="checkout",namespace="argocd",phase="Succeeded",project="tenants"} 214
argocd_app_sync_total{dest_server="https://kubernetes.default.svc",name="checkout",namespace="argocd",phase="Failed",project="tenants"} 3
What just happened: The controller is emitting the metrics we’ll build on — reconcile counts and per-app sync outcomes. If curl returns nothing, the port-forward or port name is wrong; if Prometheus shows no target, re-check the release: label (Step 1).
Step 3 — Import the Grafana dashboard. In Grafana: Dashboards → New → Import, enter ID 14584, and select your Prometheus datasource. (Provisioning as code? Drop examples/dashboard.json from the argoproj/argo-cd repo into a ConfigMap the Grafana sidecar loads.)
What just happened: You now have the fleet-wide Argo CD dashboard — sync status, reconcile latency, sync activity — without hand-building a single panel.
Step 4 — Add the three alerts. Apply the PrometheusRule:
cat <<'YAML' | kubectl apply -f -
apiVersion: monitoring.coreos.com/v1
kind: PrometheusRule
metadata:
  name: argocd-alerts
  namespace: argocd
  labels:
    release: kube-prometheus-stack
spec:
  groups:
    - name: argocd.rules
      rules:
        - alert: ArgoCDSyncFailing
          expr: sum(increase(argocd_app_sync_total{phase=~"Failed|Error"}[10m])) by (name, dest_server) > 0
          for: 15m
          labels: { severity: warning }
          annotations:
            summary: "Argo CD app {{ $labels.name }} sync failing"
        - alert: ArgoCDReconcileLatencyHigh
          expr: histogram_quantile(0.95, sum(rate(argocd_app_reconcile_bucket[5m])) by (le)) > 3
          for: 10m
          labels: { severity: warning }
          annotations:
            summary: "Argo CD reconcile p95 above 3s"
        - alert: ArgoCDAppOutOfSync
          expr: sum(argocd_app_info{sync_status="OutOfSync"}) by (name, dest_server) > 0
          for: 15m
          labels: { severity: warning }
          annotations:
            summary: "Argo CD app {{ $labels.name }} OutOfSync > 15m"
YAML
# prometheusrule.monitoring.coreos.com/argocd-alerts created
What just happened: Prometheus loaded three rules. In Status → Rules they show as inactive (healthy), pending (condition true, inside the for: window), or firing. Because of the for: clauses, a single failed sync or a brief OutOfSync won’t page — the condition has to persist.
Step 5 — The reconcile-latency cheat panel. Run these in the Prometheus Graph tab (or add them as a Grafana panel). This is the query you’ll reach for most:
# p50 / p95 / p99 reconcile latency, fleet-wide
histogram_quantile(0.50, sum(rate(argocd_app_reconcile_bucket[5m])) by (le))
histogram_quantile(0.95, sum(rate(argocd_app_reconcile_bucket[5m])) by (le))
histogram_quantile(0.99, sum(rate(argocd_app_reconcile_bucket[5m])) by (le))
Representative instant-vector results on a healthy small fleet:
| Query | Value (seconds) | Reading |
|---|---|---|
| p50 reconcile | 0.31 |
Half of reconciles finish in ~300ms — healthy |
| p95 reconcile | 1.84 |
95% under ~1.8s — comfortably inside a 3s SLO |
| p99 reconcile | 4.90 |
Tail under 5s — watch it, but fine |
What just happened: You measured Argo CD’s pulse. p95 at 1.84s against a 3s SLO means the controller has headroom. If these climbed toward and past 3s while work-queue depth rose, the capacity table above says: shard the controller.
Step 6 — Verify the OutOfSync and sync-rate queries. Two more you’ll use daily:
sum(argocd_app_info{sync_status="OutOfSync"})              # how many apps are drifted now
sum(rate(argocd_app_sync_total{phase="Failed"}[5m]))       # failed syncs per second
Representative: the first returns 1 (one app drifted), the second 0 (no failures right now). Together they’re the “is anything wrong this minute” pair.
Teardown. Remove exactly what you added:
kubectl -n argocd delete servicemonitor argocd-application-controller
kubectl -n argocd delete prometheusrule argocd-alerts
# stop the background port-forward
kill %1 2>/dev/null
# In Grafana, delete the imported dashboard from its ⚙ settings if you don't want to keep it.
What just happened: The ServiceMonitor and PrometheusRule are gone, so Prometheus stops scraping the controller and drops the three rules on its next config reload. You changed observability config only — no Argo CD app, project, or workload was touched, so there’s nothing else to clean up.
Common mistakes and troubleshooting
Every failure here is “the data isn’t there” or “the alert didn’t behave,” and almost all of them trace back to a label, a port name, or a metric name. Keep this table close:
| Symptom | Likely cause | Fix |
|---|---|---|
| No target in Prometheus, dashboards empty | ServiceMonitor’s metadata.labels don’t match Prometheus’s serviceMonitorSelector (usually release: kube-prometheus-stack) |
Add the matching label; verify with kubectl get prometheus -o yaml | grep -A3 serviceMonitorSelector |
| Target exists but scrape fails / empty | Wrong endpoints.port — used 8082 or a wrong name instead of the Service’s named metrics port |
Name the port (port: metrics); confirm the Service’s port name with kubectl -n argocd get svc argocd-application-controller-metrics -o yaml |
PromQL returns NaN / nothing for a metric |
Wrong metric name — e.g. argocd_app_health_status (doesn’t exist) or metric renamed across versions |
Health/sync are labels on argocd_app_info; verify names against your version’s /metrics output, not memory |
histogram_quantile returns nothing |
Fed the bare argocd_app_reconcile instead of argocd_app_reconcile_bucket |
Always use the _bucket series inside histogram_quantile(..., by (le)) |
| Reconcile p95/p99 flatlines at a fixed value | Latencies exceed the top histogram bucket (~16s), so everything piles into +Inf |
Fix the slowness, or widen the reconcile buckets so the tail is measurable |
| Reconcile latency high and rising | Too many apps per controller, slow target API, or repo-server bottleneck | Check work-queue depth + repo-server pending; shard the controller (see scaling lesson) |
argocd_app_k8s_request_total{response_code="429"} climbing |
Controller is being rate-limited by a target cluster’s API server | Shard by cluster, reduce chatty/ignored resources, tune resync interval |
| Repo-server slow, syncs lag with no controller backlog | Heavy monorepo — manifest generation is the bottleneck | Add repo-server replicas + caching; consider splitting the repo (scaling lesson) |
| Dashboard imported but every panel “No data” | Wrong datasource selected, or the dashboard’s label selectors don’t match your job/label scheme |
Set the correct Prometheus datasource; align job/namespace label filters to your relabeling |
| Alert never fires despite a real problem | PromQL wrong, or for: window longer than the condition lasts |
Test the expr in Prometheus Graph first; shorten for: if the condition is genuinely transient |
| Alert flaps / pages constantly | for: too short (e.g. paging on every routine OutOfSync) |
Add/lengthen for:; scope the expr with by (name, dest_server) so one app doesn’t page for all |
| Prometheus OOMs / TSDB huge after adding Argo CD | Cardinality explosion — argocd_app_labels enabled, or high-churn dest_namespace/per-resource labels |
Drop unused labels via metric_relabel_configs; don’t enable app labels unless you query them |
| Controller work-queue depth grows and never drains | Controller is behind — more work arriving than processed | Raise --status-processors/--operation-processors, or shard the controller |
Three gotchas cost the most hours, so they get extra words.
1. The invisible ServiceMonitor. This is the Argo CD observability rite of passage. You write a perfect ServiceMonitor, apply it, and… nothing. No target, no error, no log line. The reason is that the Prometheus Operator only reads ServiceMonitors whose labels match the Prometheus resource’s serviceMonitorSelector, and kube-prometheus-stack defaults that to release: <helm-release-name> (commonly kube-prometheus-stack). Your ServiceMonitor without that exact label is invisible — it might as well not exist. Always check the selector on your Prometheus (kubectl get prometheus -A -o yaml) and label your ServiceMonitors to match. This is the failure the diagram’s badge 3 is warning you about.
2. The metric that isn’t there. The single most common wrong-query is assuming a argocd_app_health_status gauge exists (it doesn’t) or that sync status is its own metric (it isn’t). Health and sync are labels on argocd_app_info, whose value is always 1. So you count by filtering the label: sum(argocd_app_info{sync_status="OutOfSync"}), sum(argocd_app_info) by (health_status). Metric names also drift across major versions — the golden rule is to curl the actual /metrics endpoint of your version and grep for the name before you build a panel on it, rather than trusting a blog post (or your memory) that might describe a different release.
3. Cardinality is a bill you pay later. Argo CD’s metrics are mostly low-cardinality by default, but two things blow that up: enabling argocd_app_labels (which turns every Kubernetes label on every Application into Prometheus labels), and metrics like argocd_app_k8s_request_total that carry resource_kind × resource_namespace × verb × response_code. On a big fleet those multiply into millions of series and OOM Prometheus. The defense is metric_relabel_configs to drop labels you never query, and not enabling app labels unless a dashboard actually needs them. Cardinality problems don’t show up in the demo — they show up three weeks later when the TSDB fills the disk.
Cheat-sheet
Bookmark this. Key metrics per component, the PromQL you reach for, and the SLO targets to start from.
Metrics by component (port → the ones that matter):
| Component | Port | Metrics to watch |
|---|---|---|
| application-controller | 8082 | argocd_app_reconcile (histogram), argocd_app_sync_total, argocd_app_info, argocd_app_k8s_request_total, argocd_cluster_connection_status, workqueue_depth |
| repo-server | 8084 | argocd_git_request_duration_seconds, argocd_git_request_total, argocd_repo_pending_request_total |
| api-server | 8083 | grpc_server_handled_total, argocd_redis_request_total |
| applicationset-controller | 8080 | controller_runtime_reconcile_total, controller_runtime_reconcile_errors_total, argocd_appset_owned_applications |
| notifications-controller | 9001 | argocd_notifications_deliveries_total, argocd_notifications_trigger_eval_total |
PromQL you’ll paste again and again:
| Goal | PromQL |
|---|---|
| Reconcile p95 | histogram_quantile(0.95, sum(rate(argocd_app_reconcile_bucket[5m])) by (le)) |
| Reconcile rate (alive?) | sum(rate(argocd_app_reconcile_count[5m])) |
| Sync success rate | sum(rate(argocd_app_sync_total{phase="Succeeded"}[5m])) / sum(rate(argocd_app_sync_total[5m])) |
| Sync failure rate | sum(rate(argocd_app_sync_total{phase=~"Failed|Error"}[5m])) / sum(rate(argocd_app_sync_total[5m])) |
| OutOfSync count | sum(argocd_app_info{sync_status="OutOfSync"}) |
| Apps by health | sum(argocd_app_info) by (health_status) |
| k8s throttling | sum(rate(argocd_app_k8s_request_total{response_code="429"}[5m])) |
| Repo-server Git p95 | histogram_quantile(0.95, sum(rate(argocd_git_request_duration_seconds_bucket[5m])) by (le, repo)) |
| Work-queue depth | sum(workqueue_depth{name=~"app.*"}) by (name) |
| Cluster reachable? | min(argocd_cluster_connection_status) by (server) |
| Component up? | up{job=~"argocd-.*"} |
| Error-budget burn (30d) | sum(increase(argocd_app_sync_total{phase=~"Failed|Error"}[30d])) / (0.01 * sum(increase(argocd_app_sync_total[30d]))) |
SLO starting targets:
| SLO | Target | Window |
|---|---|---|
| Reconcile p95 | < 3s | 30d |
| Reconcile p99 | < 8s | 30d |
| Sync success rate | > 99% | 30d |
| Sync freshness (OutOfSync) | 95% < 5 min | 30d |
Config knobs:
| Setting | Where | Effect |
|---|---|---|
--logformat json |
component args / argocd-cmd-params-cm |
Structured logs for parsing |
--loglevel debug |
component args | Verbose logs when chasing a sync issue |
--otlp-address <host>:4317 |
component args | Export OpenTelemetry traces |
metric_relabel_configs |
Prometheus scrape config | Drop high-cardinality labels before ingest |
serviceMonitorSelector |
Prometheus CR | Which ServiceMonitor labels get adopted |
Interview and exam questions
Q: Why observe Argo CD itself when it’s already reporting app health in the UI?
A: Because on automated sync there’s no human clicking through the UI — degradations are silent. If reconcile latency climbs or a third of the fleet drifts OutOfSync, the only symptom is deploys not landing, discovered late by a confused developer. Metrics + alerts replace “someone noticed” with “a dashboard showed it and an alert fired,” and they catch leading indicators (reconcile p95) before syncs visibly fail.
Q: Which metric is the single best leading indicator of a struggling controller, and why?
A: argocd_app_reconcile — the histogram of reconcile-loop duration. It’s a leading indicator because latency climbs first, while syncs still mostly succeed; by the time syncs fail you’re already late. Watch its p95 (histogram_quantile(0.95, sum(rate(argocd_app_reconcile_bucket[5m])) by (le))) against an SLO like 3s.
Q: How do you count how many applications are OutOfSync? What’s the trap?
A: sum(argocd_app_info{sync_status="OutOfSync"}). The trap is assuming there’s a dedicated argocd_app_health_status or sync-status metric — there isn’t. Health and sync are labels on argocd_app_info, whose value is always 1, so summing the filtered series counts the apps.
Q: You applied a ServiceMonitor and Prometheus shows no target. Walk through the diagnosis.
A: First check the ServiceMonitor’s metadata.labels against the Prometheus CR’s serviceMonitorSelector — kube-prometheus-stack defaults to release: kube-prometheus-stack; without that label Prometheus never reads it. Then check spec.selector.matchLabels matches the metrics Service’s labels, and that endpoints.port names the Service’s metrics port (not a number). Those three — selector label, service label, port name — are the usual culprits.
Q: Which ports do the application-controller, repo-server, and api-server expose metrics on?
A: application-controller on 8082 (via the argocd-application-controller-metrics Service), repo-server on 8084 (a named metrics port alongside its 8081 gRPC port), api-server on 8083 (via argocd-server-metrics). ApplicationSet controller is 8080, notifications 9001.
Q: Define a sensible SLO set for Argo CD and the error budget for the availability one.
A: Reconcile p95 < 3s and p99 < 8s (latency); sync success rate > 99% over 30 days (availability); 95% of apps OutOfSync < 5 min (freshness). The error budget for the 99% availability SLO is 1% of syncs — if you ran 4,000 syncs this month you can absorb 40 failures before the budget is spent; burn rate past 1× means freeze features and fix reliability.
Q: Why can’t you write a true “95% of syncs finish in under N seconds” SLI from Argo CD’s built-in metrics?
A: Because argocd_app_sync_total is a counter of outcomes by phase, not a timer — there’s no built-in sync-duration histogram. You approximate latency with argocd_app_reconcile (which is a histogram) and freshness with how long apps stay OutOfSync, or you derive true sync duration from OpenTelemetry traces. Inventing argocd_app_sync_duration_seconds would be building on a metric that doesn’t exist.
Q: The controller’s argocd_app_k8s_request_total{response_code="429"} is climbing. What’s happening and what do you do?
A: The controller is being rate-limited by a target cluster’s API server — too many Kubernetes API calls during reconciliation. Fleet-wide reconciles slow down. Remedies: shard the controller by cluster so load spreads, reduce chatty resources (or ignore fields that churn), and tune the resync interval. It’s a capacity signal that points at sharding, not at adding CPU.
Q: How do metrics tell you to scale the repo-server versus shard the controller?
A: They’re different signals. A controller problem shows as reconcile p95 rising with work-queue depth (workqueue_depth{name="app_reconciliation_queue"}) climbing — shard the controller. A repo-server problem shows as argocd_repo_pending_request_total > 0 and argocd_git_request_duration_seconds p95 rising without a controller work-queue backlog — add repo-server replicas. Scraping both is what lets you tell them apart.
Q: What is a cardinality explosion in this context, and how do you prevent it?
A: It’s when per-app/per-resource labels multiply into millions of TSDB series and OOM Prometheus. Enabling argocd_app_labels (every K8s label becomes a Prometheus label) and high-cardinality metrics like argocd_app_k8s_request_total (resource_kind × resource_namespace × verb) are the usual causes. Prevent it with metric_relabel_configs to drop labels you never query, and by not enabling app labels unless a dashboard needs them.
Q: What’s the difference between the ArgoCDReconcileLatencyHigh and ArgoCDControllerNotReconciling alerts?
A: The first fires on histogram_quantile(0.95, ... argocd_app_reconcile_bucket ...) > 3 — the controller is slow. The second fires on sum(rate(argocd_app_reconcile_count[5m])) == 0 — the controller has stopped reconciling entirely (the vital sign flatlined). A slow controller still emits reconciles; a dead one emits none, and only the second alert catches that, which is why you want both.
Q: How do metrics, logs, and traces divide the work when a sync fails?
A: Metrics tell you that it’s failing and roughly where (ArgoCDSyncFailing on app X). Logs tell you what — pivot to controller/repo-server JSON logs filtered to application=X to read the actual ComparisonError or rpc error: code = Unauthenticated. Traces (optional, via OpenTelemetry) tell you why it was slow by breaking a reconcile into spans (manifest generation vs cluster API vs diff). Three layers, three questions.
Key takeaways
- Argo CD is a control plane that fails silently. On
automatedsync, degradations show up as deploys not landing, discovered late. Metrics + alerts are how you catch reconcile latency, sync failures, and stuck apps before a developer does. - Each component exposes its own
/metricsport — application-controller 8082 (the richest), repo-server 8084, api-server 8083, applicationset-controller 8080, notifications 9001. Scrape them separately, one ServiceMonitor each. - Reconcile latency (
argocd_app_reconcile) is the vital sign — the leading indicator that climbs before syncs visibly fail. Watch its p95 withhistogram_quantileover the_bucketseries, never the bare metric. - Sync and health status are labels on
argocd_app_info, not standalone metrics. Count OutOfSync apps withsum(argocd_app_info{sync_status="OutOfSync"}). There is noargocd_app_health_status— assuming there is is the classic wrong-metric-name trap. - The ServiceMonitor
release:label is the number-one gotcha. Prometheus only adopts ServiceMonitors matching itsserviceMonitorSelector; the wrong label means zero targets and empty dashboards with no error anywhere. - SLOs turn “feels slow” into a decision. Reconcile p95 < 3s, sync success > 99% over 30d, an error budget of
1 − SLO, and a burn-rate query that tells you when to stop shipping and shard. - Metrics make scaling evidence-based. Work-queue depth + reconcile p95 rising together = shard the controller;
argocd_repo_pending_request_total > 0+ Git p95 rising = scale the repo-server. Different signals, different fixes. - Mind cardinality, and verify metric names against your version. Don’t enable
argocd_app_labelsunless you query them, drop unused labels withmetric_relabel_configs, and alwayscurlyour own/metricsbefore building a panel — names drift across releases.