There is a moment every GitOps platform reaches. For a year, one Argo CD install has hummed along — a handful of clusters, a few dozen apps, everything green within seconds of a push. Then the fleet grows. The third region comes online, the app count crosses a thousand, and one morning the UI feels sluggish, a commit takes ten minutes to land, and kubectl -n argocd get pods shows the argocd-application-controller-0 pod with a fresh OOMKilled in its restart column. Nothing is broken, exactly. Argo CD is simply doing more work than one of each process can do.
This lesson is the one you reach for at that moment. It is not about installing Argo CD or writing Application manifests — you can already do that. It is about the four levers that turn a single-instance control plane into one that comfortably drives 1,000+ applications across dozens of clusters: sharding the application-controller so no single controller has to watch every cluster, tuning and scaling the repo-server so manifest rendering keeps up, fixing the specific pain of a monorepo so one commit does not stampede a thousand apps, and sizing Redis, the API server, and reconciliation so nothing else becomes the new bottleneck.
Two promises up front. First, the scaling mechanics are cloud-neutral — sharding, parallelism limits, and caching behave byte-for-byte identically on AKS, EKS, GKE, or a laptop cluster, because they are properties of Argo CD’s own processes, not the cloud. Only two genuine edges differ per cloud (how the target clusters throttle the extra API load you generate, and which managed Redis you might reach for), and where those appear we cover all three clouds in one table each. Second — because scaling decisions are worthless without a signal — every knob in this lesson is tied to the metric that tells you to turn it. You should leave able to say not just “shard the controller” but “shard the controller when argocd_app_reconcile p90 crosses your budget.”
This lesson leans hard on the component model. If the words repo-server, application-controller, and reconcile loop are not yet second nature, read Argo CD Architecture: API Server, Repo Server, Application Controller, Redis & Dex first — everything below is that architecture under load.
Why this matters
Argo CD scales well, but it does not scale automatically. Out of the box you get one application-controller pod, one repo-server, one Redis, and a single API server. That topology is deliberately simple and it is correct for a small platform. It is also a set of single points of saturation, and the failure mode when you outgrow it is not a crash — it is a slow, confusing degradation where the system stays green but stops being timely. Deploys that used to feel instant start lagging; drift that self-heal used to fix in seconds lingers for minutes; the UI spins. The danger is that “GitOps feels slow” gets blamed on Git, or the network, or bad luck, when the real answer is that a specific Argo CD process has hit a specific, nameable limit.
The reason this is worth a whole lesson is that the four bottlenecks have four completely different fixes, and reaching for the wrong one makes things worse. Reconcile latency and repo-server CPU look similar from the UI — both present as “syncs are slow” — but one is fixed by sharding the controller and the other by scaling the repo-server, and if you shard a controller that was never the problem you have added cost and API load to your target clusters for nothing. Worse, some instincts actively backfire: shrinking timeout.reconciliation to make syncs “feel faster” multiplies load on the repo-server and gets your Git host to rate-limit you; putting a naïve HorizontalPodAutoscaler on the controller StatefulSet silently breaks sharding. The whole skill here is diagnosis before action — read the right metric, name the saturated component, turn the one correct knob.
The mental model to anchor everything: Argo CD’s work is a function of two independent numbers — how many clusters you watch, and how many manifests you render — and each number is handled by a different process. The application-controller’s load scales with clusters and live objects (it holds an in-memory cache of every resource in every cluster it owns, and diffs them on every reconcile). The repo-server’s load scales with apps, chart size, and commit frequency (it clones repos and runs helm template/kustomize build). Sharding addresses the first number; parallelism and replicas address the second. Keep those two axes separate in your head and every symptom in this lesson sorts itself into the right bin.
Where Argo CD hits its limits: reading the symptoms
Before any knob, learn the symptoms — because at scale you will diagnose from a dashboard and a describe, not a hunch. Each classic symptom points at one saturated resource and one metric that proves it.
| Symptom you observe | What is saturating | The metric that confirms it | The lever |
|---|---|---|---|
| Commits take minutes to reconcile; self-heal is slow | Application-controller can’t keep up with its app/cluster load | argocd_app_reconcile (duration histogram) p90/p99 climbing |
Shard the controller |
| Syncs queue up; operations lag behind status | Controller processing queues backed up | workqueue_depth{name="app_reconciliation_queue"} rising |
More status/operation processors, or shard |
| Repo-server pods pinned at CPU limit | Manifest generation is the bottleneck | Repo-server CPU near limit; argocd_repo_pending_request_total > 0 sustained |
Raise --parallelismlimit and/or add repo-server replicas |
argocd-repo-server pods OOMKilled |
A big chart/monorepo render exceeds memory | Container memory hits limit at render time | Raise repo-server memory; cap concurrency; split the repo |
argocd-application-controller-0 OOMKilled |
One shard holds too many clusters/objects in cache | argocd_cluster_api_resource_objects summed on that shard is huge |
Add shards; rebalance; raise controller memory |
| One commit refreshes all apps in a monorepo | Every app re-renders on any change to the shared repo | Repo-server request spike correlated with a single push | manifest-generate-paths annotation + webhook |
Git host returns 403/429 secondary rate limit |
Too many clones/fetches at once (tight poll or fan-out) | argocd_git_request_total spikes on the reconcile tick |
Webhooks + reconciliation jitter; fewer forced renders |
Target cluster returns 429 Too Many Requests |
Too many shards/QPS hammering one cluster’s API | Client-side throttling warnings in controller logs | Fewer shards per cluster; lower client QPS/parallelism |
| UI slow, panels stale or errored | Redis cache down, cold, or undersized | argocd_redis_request_duration_seconds elevated; cache-miss errors |
Redis HA; size memory; check expirations |
Three of these deserve emphasis because they are the ones that get misdiagnosed most often:
- “Slow syncs” is two different bugs. If the controller is the bottleneck,
argocd_app_reconcileduration climbs — the loop itself is taking longer per app. If the repo-server is the bottleneck, the reconcile is waiting on a manifest render, and you’ll seeargocd_repo_pending_request_totalsit above zero while repo-server CPU pegs. Same UI symptom, opposite fix. Always split them by looking at which process is busy. - OOMKills tell you which axis blew up. A repo-server OOM is a rendering memory problem — one chart or one monorepo tree is too big to template within the limit. A controller OOM is a cluster-cache memory problem — one shard is watching too many objects. Read the pod name and you already know which half of the system to touch.
- Rate limits (
429/403) come in two flavours. From your Git host, they mean you’re cloning/fetching too often — a polling/fan-out problem. From a target cluster’s API server, they mean your controllers are issuing too many list/watch/apply calls — a sharding/QPS problem. The number is the same; the culprit and cure are not.
Here is the whole scaled control plane as one picture. Read it left to right: a monorepo (with per-app path scoping and a webhook) feeds a horizontally-scaled repo-server tier that renders in parallel and caches into Redis; a sharded set of application-controllers each own a slice of the fleet and reconcile their clusters. The two red marks are the two bottlenecks this lesson exists to remove — the repo-server render tier (usually the first thing to saturate) and the controller’s reconcile latency.
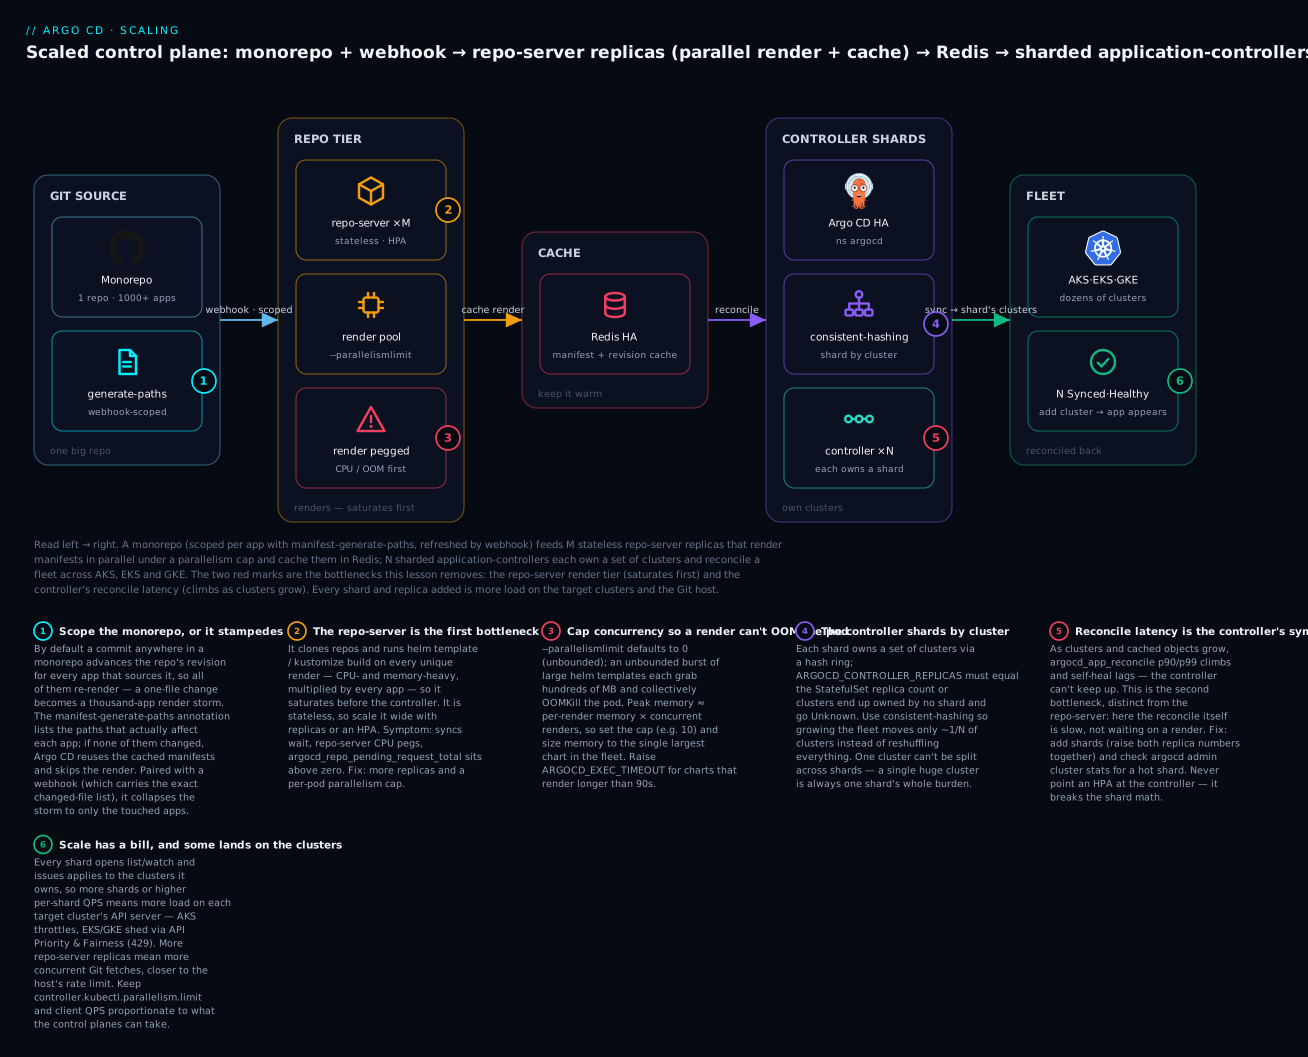
The numbered badges mark the decisions: scope the monorepo so a commit only refreshes the apps it touches (1); the repo-server is the first bottleneck and scales horizontally under a parallelism cap (2, 3); the controller shards by cluster with a stable hashing algorithm (4); reconcile latency is the controller’s own symptom (5); and every shard and replica you add is more load on the target clusters and the Git host — the cost of scale (6).
Application-controller sharding: dividing the fleet by cluster
The application-controller is the process that reconciles. It holds, in memory, a live cache of every resource in every cluster it manages, and on each reconcile it diffs desired against that cache. That design is why it is fast — and why it is the piece that runs out of memory and CPU first as you add clusters. The fix is sharding: run several controller replicas and give each one a disjoint subset of clusters to own.
The single most important fact about controller sharding, and the one that surprises people: Argo CD shards by cluster, not by application. A shard owns a set of destination clusters; every Application targeting a cluster is reconciled by whichever shard owns that cluster. This has a hard consequence — one cluster’s entire load lives on exactly one shard and cannot be split. If a single cluster is enormous (tens of thousands of objects, hundreds of apps), sharding does not help that cluster; only splitting the cluster, or scaling that one shard’s resources, does. Sharding balances many clusters across replicas; it cannot subdivide one.
The mechanism: replicas plus a matching env var
The controller is a StatefulSet, and sharding is turned on by two settings that must agree:
spec.replicason theargocd-application-controllerStatefulSet — the number of shard pods (-0,-1,-2, …).- The env var
ARGOCD_CONTROLLER_REPLICAS— the total shard count each pod uses to compute which clusters it owns.
If those two numbers disagree, sharding breaks in a nasty, quiet way: some clusters end up owned by no shard (their apps stop reconciling and go Unknown) or the arithmetic double-assigns. They must always match. This is the number-one sharding incident, and it is worth a rule: never change one without the other.
apiVersion: apps/v1
kind: StatefulSet
metadata:
  name: argocd-application-controller
  namespace: argocd
spec:
  replicas: 3                              # 3 shard pods: -0, -1, -2
  template:
    spec:
      containers:
        - name: argocd-application-controller
          env:
            - name: ARGOCD_CONTROLLER_REPLICAS
              value: "3"                    # MUST equal spec.replicas above
            - name: ARGOCD_CONTROLLER_SHARDING_ALGORITHM
              value: "consistent-hashing"   # legacy | round-robin | consistent-hashing
The same two settings can be driven from the argocd-cmd-params-cm ConfigMap instead of raw env, which is the cleaner path if you install via the official manifests or Helm chart (the chart wires controller.replicas into the StatefulSet and the env for you, keeping them in lockstep):
apiVersion: v1
kind: ConfigMap
metadata:
  name: argocd-cmd-params-cm
  namespace: argocd
data:
  # Total controller shard count. The Helm chart also sets spec.replicas to match.
  controller.replicas: "3"
  # How clusters are distributed across the shards.
  controller.sharding.algorithm: consistent-hashing
The install lesson Installing Argo CD: Helm, Manifests, HA & First Login shows where these settings live in an HA install. Here we go deeper on how the distribution actually works and how to size it.
The sharding algorithm: legacy vs round-robin vs consistent-hashing
The ARGOCD_CONTROLLER_SHARDING_ALGORITHM (or controller.sharding.algorithm) setting picks how clusters map to shards. The three real algorithms behave very differently under the operation that matters most — adding or removing a shard:
| Algorithm | How it assigns a cluster to a shard | Balance quality | What happens when you change replica count | Use when |
|---|---|---|---|---|
legacy (default) |
Index-based modulo: hash(cluster) % replicas |
Can be uneven; a few big clusters can land together | Reshuffles almost everything — nearly every cluster moves shard | Small, static fleets; the historical default |
round-robin |
Deterministic even spread across shards by order | More even object count than legacy | Also reshuffles broadly on replica change | You want flatter distribution and rarely change replica count |
consistent-hashing |
Hash ring: each cluster maps to a ring position | Even, and stable | Only ~1/N of clusters move when you add/remove a shard | Fleets that grow/shrink; the modern recommended choice |
The reason consistent-hashing is the right default for a growing platform is entirely about the transition. With legacy or round-robin, bumping from 3 to 4 shards re-maps most clusters to a different controller — which means most shards drop their in-memory caches and rebuild them from scratch simultaneously, producing a reconcile-latency spike and a wave of API load on every cluster at once, exactly when you were trying to reduce load. Consistent hashing moves only the clusters that strictly must move (roughly 1/newN of them), so scaling out is smooth instead of a self-inflicted thundering herd. On Argo CD 2.13+/3.x it is stable and safe; prefer it unless you have a specific reason not to.
There is also a newer, more automatic option worth knowing about: dynamic cluster distribution, enabled with ARGOCD_ENABLE_DYNAMIC_CLUSTER_DISTRIBUTION=true. Instead of a fixed hash, shards claim clusters via a heartbeat lease (ARGOCD_CONTROLLER_HEARTBEAT_TIME), so a dead shard’s clusters get re-claimed by living shards automatically and the controller can run as a Deployment. It is powerful for self-healing shard failures, but as of the 2.13+/3.x line it is beta and changes the controller’s deployment shape — treat it as opt-in for teams that have outgrown static sharding and can absorb a less-settled feature, not as the default. Static consistent-hashing covers the vast majority of fleets.
Sizing shards: how many, and the imbalance trap
The question “how many shards?” has no single number, because shard load is driven by objects cached, not clusters counted. A shard owning ten tiny clusters may be lighter than a shard owning one huge one. Size by object count and memory, using these signals:
| Signal | Where to read it | What it tells you |
|---|---|---|
| Objects per cluster | argocd_cluster_api_resource_objects{server=...} |
The real memory driver — sum per shard, not cluster count |
| Controller memory headroom | Pod memory vs limit; OOMKill events | Whether a shard is at its ceiling |
| Reconcile duration | argocd_app_reconcile p90 per shard |
Whether a shard is CPU/throughput-bound |
| Per-shard distribution | argocd admin cluster shards / stats |
Which shard owns what — the imbalance check |
A workable starting heuristic for a mixed fleet: aim for each shard to cache well under ~1M resource objects and keep memory below ~70% of its limit at steady state, then let the metrics move you. Add a shard when a shard’s reconcile p90 or memory trends toward the ceiling; you are trading more pods (and more target-cluster API load) for lower per-shard load.
The imbalance problem is the sharp edge. Two things cause it. First, the legacy algorithm’s modulo can happen to co-locate several heavy clusters on one shard — switching to consistent-hashing or round-robin usually flattens it. Second, and unfixable by any algorithm: one genuinely huge cluster. Because a cluster can’t be split across shards, a single cluster with 300 apps and 800k objects will always be one shard’s entire burden no matter how many shards you add. The tells and the responses:
| Imbalance cause | Symptom | Fix |
|---|---|---|
legacy modulo clumping |
One shard has 3× the objects of the others | Switch to consistent-hashing (or round-robin) and let it rebalance |
| One oversized cluster | One shard is hot regardless of shard count | Scale that shard’s CPU/memory; or split the cluster; sharding can’t help |
| Replica/env mismatch | Some clusters owned by no shard; apps Unknown |
Make ARGOCD_CONTROLLER_REPLICAS equal spec.replicas |
| Uneven cluster sizes | Even cluster count per shard, uneven load | Size by objects (argocd_cluster_api_resource_objects), not cluster count |
Inspect the actual distribution with the admin CLI — this is your ground truth for whether sharding is working:
# Per-shard cluster and resource counts — the imbalance check
argocd admin cluster stats
# SERVER                             SHARD   CONNECTION   NAMESPACES   APPS   RESOURCES
# https://prod-aks-01.example.com    0       Successful   42           118    214530
# https://prod-eks-01.example.com    0       Successful   38           96     198004
# https://prod-gke-01.example.com    1       Successful   40           104    221190
# https://prod-eks-02.example.com    2       Successful   51           140    402118   <- hot shard

# Which shard owns which cluster
argocd admin cluster shards
# (representative) lists each cluster Secret and its assigned shard index
(Output above is representative of the command’s shape, not a live run.) A healthy stats shows RESOURCES roughly balanced across the SHARD column; a hot shard like shard 2 above is your signal to add a shard (if it’s clumping) or accept it (if it’s one big cluster) and give that shard more memory.
Controller concurrency knobs (the other half of controller scaling)
Sharding spreads clusters; a set of processor and parallelism limits control how much work each shard does concurrently. These live in argocd-cmd-params-cm (equivalently, controller flags):
| cmd-params-cm key | Controller flag | Default | What it bounds |
|---|---|---|---|
controller.status.processors |
--status-processors |
20 |
Concurrent app status refreshes (diff/health) |
controller.operation.processors |
--operation-processors |
10 |
Concurrent sync operations (applies) |
controller.kubectl.parallelism.limit |
--kubectl-parallelism-limit |
20 |
Concurrent kubectl apply/exec calls per shard |
controller.self.heal.timeout.seconds |
--self-heal-timeout |
5 |
Debounce before self-heal re-syncs after drift |
controller.repo.server.timeout.seconds |
--repo-server-timeout-seconds |
60 |
How long a reconcile waits on the repo-server render |
On a busy shard, raising controller.status.processors and controller.operation.processors lets it work more apps at once — but every extra concurrent apply is more load on the target cluster’s API server, so raise them alongside watching for 429s (see the cost-of-scale section). The default 20/10 is tuned for a small install; large shards commonly run these higher, in proportion to the target clusters’ API capacity.
Repo-server tuning: the bottleneck you hit first
Here is the counter-intuitive truth of scaling Argo CD: the repo-server usually saturates before the controller. The controller diffs against an in-memory cache — cheap per app. The repo-server, on every unique render, clones (or re-fetches) a repo and runs helm template/kustomize build — expensive, CPU- and memory-heavy, and multiplied by every app. When “syncs are slow” and CPU is the story, look here first.
The repo-server has one enormous advantage the controller lacks: it is stateless. It holds no per-cluster ownership, so you scale it the boring way — add replicas. Requests fan out across them, and you can even put a HorizontalPodAutoscaler on it (something you must not do to the controller).
The four repo-server levers
| Lever | Where to set it | Effect | Watch |
|---|---|---|---|
| Replicas | argocd-repo-server Deployment spec.replicas (or HPA) |
Linear more concurrent renders; stateless, so trivially horizontal | Repo-server CPU; argocd_repo_pending_request_total |
| Parallelism cap | reposerver.parallelism.limit / --parallelismlimit |
Bounds concurrent renders per pod so a burst can’t OOM it | Memory at render time; pending requests |
| Repo cache TTL | reposerver.repo.cache.expiration / --repo-cache-expiration (default 24h) |
How long rendered manifests stay cached in Redis | Cache hit rate; staleness after tuning |
| Revision cache TTL | reposerver.revision.cache.expiration / --revision-cache-expiration (default 3m) |
How long a branch→SHA resolution is cached | Git ls-remote volume |
The subtle one is --parallelismlimit. It defaults to 0 (unlimited), which sounds generous but is a footgun on a big monorepo: an unbounded burst of concurrent helm template runs on a large chart can each grab hundreds of MB and collectively OOM the pod. Setting a limit — say 8 or 10 per pod — caps peak memory and smooths throughput (a queue that completes beats a pod that dies mid-render). You then scale width with replicas. Concurrency-per-pod × replicas is your total render throughput; tune both.
apiVersion: v1
kind: ConfigMap
metadata:
  name: argocd-cmd-params-cm
  namespace: argocd
data:
  reposerver.parallelism.limit: "10"          # max concurrent manifest generations per pod
  reposerver.repo.cache.expiration: "24h"     # rendered-manifest cache lifetime in Redis
  reposerver.revision.cache.expiration: "3m"  # branch/tag -> commit SHA cache lifetime
Repo-server caching, and why it is your best throughput lever
Rendering the same input twice is pure waste, and the repo-server avoids it by caching rendered manifests in Redis keyed by repo + revision + path + parameters. The expensive helm template/kustomize build runs once per unique input; every reconcile after that is a cache read. Two consequences at scale: keep the cache warm (a longer --repo-cache-expiration means fewer re-renders, at the cost of Redis memory), and understand that a --hard-refresh deliberately busts this cache — so do not script hard-refreshes across a whole fleet unless you want a synchronized re-render storm.
| Cache | Keyed by | TTL flag / default | Scaling implication |
|---|---|---|---|
| Rendered manifests | repo + revision + path + params | --repo-cache-expiration / 24h |
Longer TTL = fewer renders, more Redis memory |
| Git revision (ref→SHA) | repo + ref | --revision-cache-expiration / 3m |
Longer TTL = fewer ls-remote calls to Git |
| Local repo clones | repo (on the pod’s disk) | n/a (working copies) | Bigger repos need more ephemeral disk per pod |
| General Redis cache | component-wide | --default-cache-expiration / 24h |
The umbrella TTL for cache entries |
Memory, big charts, and a dedicated repo-server per heavy repo
Memory is where the repo-server bites. helm template on a chart with large subcharts or thousands of rendered objects, or a kustomize build over a deep overlay tree, can spike to hundreds of MB per concurrent render. Peak memory ≈ (per-render memory) × (concurrent renders), which is exactly why the parallelism cap and the memory limit must be set together. Two more knobs matter for heavy repos:
ARGOCD_EXEC_TIMEOUT(env, default90s) — the timeout for a single tool execution. A genuinely large chart can render for longer than 90s and fail with a timeout that looks like a hang; raise this env on the repo-server for known-heavy repos.- A dedicated repo-server for one giant repo. Argo CD lets you attach an extra repo-server (via config-management-plugin or a separate deployment fronted by its own service) so that one pathological monorepo’s renders don’t starve everyone else. This isolates blast radius: the big repo’s CPU/memory pressure stays on its own pods.
# Representative repo-server resources for a large monorepo install.
# Numbers are guidance to size FROM, not universal truths — measure your renders.
resources:
  requests:
    cpu: "1"
    memory: 2Gi
  limits:
    cpu: "2"
    memory: 4Gi        # a single big helm template can need most of this
env:
  - name: ARGOCD_EXEC_TIMEOUT
    value: "180s"       # big charts render longer than the 90s default
The rule of thumb: repo-server memory is driven by your single largest render, not your average one. Size the limit to survive the worst chart in the fleet times your per-pod parallelism, or cap parallelism low enough that it can’t.
Monorepo performance: stopping the render stampede
Now the specific pain the brief for this lesson exists to solve. A monorepo — one Git repository holding the config for hundreds or thousands of apps — is wonderful for humans (one place to grep, atomic cross-cutting changes) and brutal for a naïve Argo CD. The reason is mechanical: by default, when anything in the repo changes, every Application sourcing that repo is a candidate to refresh, because Argo CD’s cache key includes the repo’s resolved revision. Change one app’s values.yaml, push, and the revision advances for all apps pointing at that repo — so all of them re-render. One trivial commit becomes a thousand-app render stampede that pegs the repo-server and floods your Git host.
There are five mitigations, in rough order of impact:
| Mitigation | What it does | Impact | Effort |
|---|---|---|---|
manifest-generate-paths annotation |
Skips re-render for apps whose tracked paths didn’t change | Huge — the single biggest win | Low (one annotation) |
| Webhooks instead of polling | Push-triggered refresh with the exact changed-file list | High — enables the annotation’s precision, cuts poll load | Medium (Git config) |
| Reconciliation jitter | Spreads the periodic full refresh so it isn’t a synchronized burst | Medium — smooths the poll tick | Low (one setting) |
| Shard the monorepo into paths / split repos | Fewer apps per repo → smaller stampede radius | High but structural | High (repo surgery) |
ARGOCD_GIT_ATTEMPTS_COUNT |
Retries transient Git failures under load | Reliability, not throughput | Low (one env) |
The big one: manifest-generate-paths
The argocd.argoproj.io/manifest-generate-paths annotation is the mitigation that changes everything, so understand it precisely. You annotate each Application with the repo paths whose contents actually affect its manifests. When a new revision arrives, Argo CD compares the files that changed between the cached commit and the new one against each app’s tracked paths — and if none of an app’s tracked paths changed, it reuses the cached manifests and does not re-render at all. The thousand-app stampede collapses to “only the handful of apps whose paths were actually touched re-render.”
apiVersion: argoproj.io/v1alpha1
kind: Application
metadata:
  name: checkout
  namespace: argocd
  annotations:
    # Only re-render this app when files under these paths change.
    # A leading '/' is repo-root-relative; '.' means the app's own source path.
    argocd.argoproj.io/manifest-generate-paths: /apps/checkout;/libs/common
spec:
  project: tenants
  source:
    repoURL: https://github.com/acme/monorepo.git
    targetRevision: main
    path: apps/checkout
  destination:
    server: https://kubernetes.default.svc
    namespace: checkout
  syncPolicy:
    automated:
      prune: true
      selfHeal: true
The value syntax is worth memorising:
| Value | Meaning |
|---|---|
. |
The app’s own spec.source.path (relative) — the most common value |
/apps/checkout |
Absolute from the repo root |
../shared |
Relative to source.path, walking up the tree |
/apps/checkout;/libs/common |
Multiple paths, semicolon-separated (an app plus its shared library) |
Two caveats that keep you out of trouble. First, it works on the changed-file diff between commits, so it needs the repo-server to see that diff — it shines with webhook-driven refreshes (which carry the exact changed set) and is why the annotation and webhooks are a pair, not alternatives. Second, a known subtlety: because Argo CD short-circuits on the tracked paths, an app may report the revision of its path’s last relevant commit rather than the repo’s absolute HEAD SHA — expected behaviour, not drift, but surprising the first time you see two apps in the same repo showing different synced SHAs.
Webhooks: stop polling a monorepo
Polling a monorepo is the load model you least want: every timeout.reconciliation tick (default 3 minutes), every app re-checks the repo, which means a flood of ls-remote calls and, without the annotation, re-renders — all on the same tick, all at once. A webhook inverts this: the Git provider POSTs to /api/webhook on push, Argo CD refreshes immediately with the changed-file list, and the 3-minute poll drops to a safety net. For a monorepo this is close to mandatory — it is what makes manifest-generate-paths precise and what stops the synchronized poll storm.
# Point your Git provider's webhook at the Argo CD API server:
#   URL:          https://argocd.example.com/api/webhook
#   Content-Type: application/json
#   Secret:       (matches webhook.<provider>.secret in argocd-secret)
# GitHub:  Settings -> Webhooks -> Add webhook -> "Just the push event"
# GitLab:  Settings -> Webhooks -> Push events
# The shared secret is validated against argocd-secret; a mismatch = ignored delivery.
Smoothing the poll: reconciliation jitter and Git retries
Even with webhooks, the periodic reconcile still fires as a backstop — and if all apps share one repo, they all tick together. timeout.reconciliation.jitter spreads that tick across a window so the repo-server sees a smooth trickle instead of a spike. And ARGOCD_GIT_ATTEMPTS_COUNT makes Git operations resilient to the transient failures that a busy Git host throws under fan-out load.
apiVersion: v1
kind: ConfigMap
metadata:
  name: argocd-cm
  namespace: argocd
data:
  timeout.reconciliation: 180s          # the periodic backstop poll (default 3m)
  timeout.reconciliation.jitter: 60s    # spread reconciles across a 60s window, not one burst
# On the repo-server (env): retry Git ops so a flaky/rate-limited host degrades gracefully.
env:
  - name: ARGOCD_GIT_ATTEMPTS_COUNT
    value: "5"                          # retry transient git failures under load
When to split the monorepo
The structural mitigation is to stop having one giant repo. Splitting a monorepo into a few path-scoped repos (or true polyrepos) shrinks every stampede’s radius and lets you point a dedicated repo-server at the heaviest one. The trade-off is the classic monorepo/polyrepo one — atomic cross-cutting changes and single-place grep versus hard isolation and smaller blast radius:
| Approach | Stampede radius | Cross-cutting change | Repo-server isolation | Best when |
|---|---|---|---|---|
One monorepo + manifest-generate-paths |
Small (per annotation) | Atomic, one PR | Shared | Most teams — the annotation makes it viable |
| Monorepo, dedicated repo-server | Small | Atomic | Isolated for the big repo | One repo dominates render load |
| Split into a few path repos | Smaller | Multi-PR | Per-repo possible | Clear ownership boundaries exist |
| Full polyrepo | Smallest (per repo) | Many PRs | Fully isolated | Org chart demands hard RBAC per team |
The pragmatic sequence: annotation first, webhook second, jitter third — and only reach for repo surgery if those three don’t tame it. Most monorepos become perfectly well-behaved with the first two.
Redis, the API server, and Dex under load
Sharding the controller and scaling the repo-server can just move the bottleneck. Two shared dependencies must scale with them.
Redis: keep the cache available
Every component leans on Redis — the repo-server writes rendered manifests there, the controller caches cluster state, the API server caches responses. At scale, Redis being unavailable (not lost — it’s only a cache, so there’s no data to lose) degrades all of them at once: cold cache means re-renders and re-lists, which lands as slow, stale UI and laggy reconciles. The production answer is argocd-redis-ha — Redis with Sentinel across three replicas — so the cache stays continuously available even through a pod loss. Size its memory to hold your rendered-manifest working set; a bigger fleet with longer cache TTLs needs more Redis memory, and eviction under pressure shows up as a rising cache-miss rate and more repo-server work.
The Redis mechanism is cloud-neutral, but if you’d rather not run Redis yourself, the managed alternative differs per cloud — this is a genuine cloud edge:
| Cloud | Managed Redis option | Note |
|---|---|---|
| Azure / AKS | Azure Cache for Redis | Point Argo CD at the external endpoint; ⚠️ the cache tier bills hourly |
| AWS / EKS | Amazon ElastiCache for Redis | External endpoint + auth token in argocd-redis-secret; ⚠️ node hours bill |
| Google / GKE | Memorystore for Redis | Private-service-access endpoint; ⚠️ instance bills hourly |
Most installs simply run the bundled argocd-redis-ha and never touch a managed service; reach for managed Redis only if you already operate one and want Argo CD to share it. The full HA story — Redis Sentinel topology, disaster recovery, and what “safe to lose” really means — is the subject of Argo CD High Availability & Disaster Recovery: Backup & Restore.
API server and Dex
The argocd-server (API/UI) is stateless and scales with plain replicas or an HPA. It rarely bottlenecks on reconcile load — remember it isn’t in the reconcile path — but it does feel UI users, CLI/CI automation, and webhook deliveries. A busy platform with heavy CI-driven argocd app calls and a firehose of webhooks wants 2–3+ replicas behind its load balancer. One real detail: set ARGOCD_API_SERVER_REPLICAS to the replica count so the server can divide its internal client-side rate limiter correctly across pods.
argocd-dex-server handles only the SSO login path. It is almost never a throughput bottleneck — logins are infrequent relative to reconciles — so a single replica is usually fine; run two for availability if SSO outages would block your operators. Don’t over-invest here.
| Component | Scales by | Bottlenecks on | Typical at scale |
|---|---|---|---|
argocd-server (API/UI) |
Replicas / HPA (stateless) | UI + CLI/CI calls + webhook volume | 2–3+ replicas; set ARGOCD_API_SERVER_REPLICAS |
argocd-dex-server |
Replicas (stateless) | SSO login rate (low) | 1–2 replicas; rarely the problem |
argocd-applicationset-controller |
Replicas w/ leader election | Generator volume (many ApplicationSets) |
2 for availability; leader does the work |
Reconciliation tuning and HPA per component
The poll interval is a safety net, not a throughput dial
The single most misused knob at scale is timeout.reconciliation (default 180s). The instinct — “syncs feel slow, lower the poll” — is exactly wrong: a tight poll makes every app re-check Git far more often, multiplying repo-server renders and Git ls-remote calls until your Git host rate-limits you (403/429), and it still isn’t instant. The correct model: webhooks for latency, poll for safety, jitter for smoothness. A push is near-instant via webhook; the 3-minute poll catches the rare missed webhook; jitter spreads the poll so a shared-repo fleet doesn’t tick in unison.
| Setting | Where | Default | Right use |
|---|---|---|---|
timeout.reconciliation |
argocd-cm |
180s |
Leave near default; it’s the backstop, not the accelerator |
timeout.reconciliation.jitter |
argocd-cm |
0s |
Set to spread the periodic tick (e.g. 60s) on big fleets |
Git webhook → /api/webhook |
Git provider + argocd-secret |
— | The real latency fix; near-instant on push |
HPA: yes for stateless, never naïvely for the controller
Autoscaling Argo CD has one hard rule that flows straight from the architecture: HPA the stateless components; do not put a naïve HPA on the application-controller. The controller’s shard math depends on ARGOCD_CONTROLLER_REPLICAS matching the pod count — an HPA that changes spec.replicas without updating that env produces exactly the “clusters owned by no shard” outage from earlier. So:
| Component | Safe to HPA? | Why |
|---|---|---|
argocd-repo-server |
Yes | Stateless; more pods = more render throughput, no ownership to break |
argocd-server |
Yes | Stateless; scales with UI/API/webhook load |
argocd-applicationset-controller |
Cautiously | Leader-elected; extra replicas add availability, not throughput |
argocd-application-controller |
No (not naïvely) | Sharding needs ARGOCD_CONTROLLER_REPLICAS to match spec.replicas — an HPA breaks that. Shard manually, or use dynamic distribution |
A representative HPA for the repo-server — the component that most benefits from elastic scaling because render load is bursty:
apiVersion: autoscaling/v2
kind: HorizontalPodAutoscaler
metadata:
  name: argocd-repo-server
  namespace: argocd
spec:
  scaleTargetRef:
    apiVersion: apps/v1
    kind: Deployment
    name: argocd-repo-server
  minReplicas: 2
  maxReplicas: 10
  metrics:
    - type: Resource
      resource:
        name: cpu
        target:
          type: Utilization
          averageUtilization: 70    # render load is CPU-bound; scale on it
Representative resource requests/limits
Right-sizing requests/limits stops noisy-neighbour eviction and gives the scheduler room. These are guidance to size from, deliberately labelled as such — measure your own fleet:
| Component | Requests (cpu / mem) | Limits (cpu / mem) | Driver |
|---|---|---|---|
| application-controller (per shard) | 1 / 2Gi |
2 / 4Gi+ |
Objects cached per shard |
| repo-server (per replica) | 1 / 1Gi |
2 / 2–4Gi |
Largest single render × parallelism |
| argocd-server | 0.25 / 256Mi |
0.5 / 512Mi |
UI/API/webhook volume |
| redis (HA member) | 0.2 / 256Mi |
0.5 / 1Gi+ |
Cached working set size |
| applicationset-controller | 0.25 / 256Mi |
0.5 / 512Mi |
Generator volume |
The numbers: symptom → knob, and what to watch
This is the table the lesson is built around. Every scaling decision is “a metric crossed a line, so turn this knob.” Memorise the shape and scaling stops being guesswork.
| Symptom / trigger | Metric to watch | Knob to turn | Direction |
|---|---|---|---|
| Reconcile latency climbing | argocd_app_reconcile p90/p99 |
Controller shards (ARGOCD_CONTROLLER_REPLICAS + StatefulSet replicas) |
Add shards |
| Syncs/operations queuing | workqueue_depth{name="app_reconciliation_queue"} |
controller.status.processors / controller.operation.processors |
Raise |
| Controller shard OOMKilled | argocd_cluster_api_resource_objects per shard; pod memory |
Add shards + raise controller memory | Add / raise |
| Shard imbalance | argocd admin cluster stats RESOURCES column |
Sharding algorithm → consistent-hashing |
Change algorithm |
| Repo-server CPU pegged | Repo-server CPU; argocd_repo_pending_request_total |
--parallelismlimit + repo-server replicas/HPA |
Raise / add |
| Repo-server OOMKilled | Repo-server memory at render time | Repo-server memory limit; cap --parallelismlimit; ARGOCD_EXEC_TIMEOUT |
Raise mem / cap concurrency |
| Monorepo re-rendering everything | Repo-server request spike per commit | manifest-generate-paths + webhook |
Add annotation |
Git host 403/429 |
argocd_git_request_total spikes |
Webhooks + timeout.reconciliation.jitter + ARGOCD_GIT_ATTEMPTS_COUNT |
Add / spread / retry |
Target cluster 429 |
Client-throttle warnings in controller logs | controller.kubectl.parallelism.limit + client QPS; fewer shards/cluster |
Lower |
| UI slow / stale | argocd_redis_request_duration_seconds; cache misses |
Redis HA; Redis memory; cache TTLs | Scale Redis |
| Commit latency (not load) | Time from push to refresh | Webhook to /api/webhook |
Add webhook |
The Prometheus metrics themselves are covered end-to-end — dashboards, alerts, recording rules — in Argo CD Observability: Metrics, Prometheus & Grafana. Here the point is narrower and vital: do not scale without a metric. Adding shards because “it feels slow” without checking whether the repo-server was actually the bottleneck is how you spend money and add target-cluster API load while fixing nothing.
Rough starting topology by fleet size
Numbers people always want first — but hold them loosely. Real load is driven by objects cached (controller) and render cost × commit rate (repo-server), not by app count alone, so treat these as starting points to size from and then let the metrics move you, never guarantees. A fleet of 500 tiny apps on 3 clusters is lighter than 100 fat apps on 30 clusters.
| Fleet size (apps / clusters) | Controller shards | Repo-server | Redis | API server | Notes |
|---|---|---|---|---|---|
| Small (< 100 / 1–5) | 1 | 1–2 | single (HA optional) | 1–2 | Defaults are usually fine; add a webhook |
| Medium (100–500 / 5–15) | 1–2 | 2–3 | Redis HA | 2 | Cap --parallelismlimit; consistent-hashing |
| Large (500–1,500 / 15–40) | 3–5 | 3–6 (HPA) | Redis HA, sized up | 2–3 | Shard by objects; jitter the poll; webhooks mandatory |
| Very large (1,500+ / 40+) | 5+ (or dynamic distribution) | 6+ (HPA) | Redis HA, generous memory | 3+ | Dedicated repo-server per heavy repo; watch target-cluster 429s |
The progression to read out of that table: you shard the controller as clusters/objects grow, and you widen the repo-server as apps and commit rate grow — the two axes from the very start of this lesson, now with rough dials attached. Redis and the API server follow along so they never become the new bottleneck.
The cost of scale
Every knob has a bill, and some of the bill lands on systems that aren’t Argo CD:
| Scaling action | The cost it incurs |
|---|---|
| More controller shards | More list/watch + apply connections to every target cluster — more API-server load per cluster |
| Higher controller QPS / processors | More concurrent calls to target clusters — closer to their 429 throttle |
| More repo-server replicas | More concurrent Git clones/fetches — closer to your Git host’s rate limit |
| Longer cache TTLs | More Redis memory; potential staleness window after a change |
| Redis HA / managed Redis | Extra pods or a billed managed instance |
| HPA everywhere | Elastic cost; churn if thresholds are jumpy |
The one people forget: sharding pushes load onto your clusters. Each shard opens and maintains watches to the clusters it owns; more shards watching a cluster (or higher per-shard QPS) means more work for that cluster’s control plane. On managed control planes this manifests differently per cloud — a real edge:
| Cloud | Target control-plane behaviour under heavy Argo CD load | Mitigation |
|---|---|---|
| Azure / AKS | API server throttles; the free tier has the least headroom, the Standard/Premium tiers (with Uptime SLA) more | Use a paid control-plane tier for large clusters; cap controller QPS/parallelism |
| AWS / EKS | API Priority & Fairness sheds excess; heavy list/watch from many shards can hit 429 |
Tune APF/flow-schedules if needed; reduce shards watching one cluster |
| Google / GKE | Control plane auto-scales but APF and project quotas still apply; very large clusters get bigger control planes | Let GKE scale the control plane; keep per-shard QPS modest |
The universal client-side lever is controller.kubectl.parallelism.limit (and the controller’s Kubernetes client QPS/burst) — lower it if a target cluster starts throttling. The trade is throughput for politeness: fewer simultaneous applies means slower syncs but a happier cluster API.
Hands-on lab: scale a busy Argo CD
This lab is config-level. It shows the exact manifests and commands to take a single-instance Argo CD to a sharded, tuned, monorepo-friendly one, with representative output where it clarifies. It does not require — and does not claim — a live thousand-app fleet; treat the outputs as labelled examples of each command’s shape. Everything is reversible (teardown at the end). ⚠️ On real clusters, extra controller shards and repo-server replicas consume real CPU/memory (and, on managed clusters, add API load) — apply to production behind change control.
Step 1 — Baseline: see what you have and where it hurts.
# Current controller shard count and repo-server replicas
kubectl -n argocd get statefulset argocd-application-controller -o jsonpath='{.spec.replicas}{"\n"}'
kubectl -n argocd get deploy argocd-repo-server -o jsonpath='{.spec.replicas}{"\n"}'
# Per-shard distribution — the ground truth for controller load
argocd admin cluster stats
# SERVER                             SHARD   NAMESPACES   APPS   RESOURCES
# https://prod-aks-01.example.com    0       42           118    214530
# https://prod-eks-01.example.com    0       38           96     198004
# https://prod-eks-02.example.com    0       51           140    402118   <- one shard, everything
What just happened: a single-shard install puts every cluster on shard 0. The RESOURCES total on that one shard is your memory driver — if it’s trending toward the pod’s limit (or you’ve seen an OOMKill), that is the signal to shard. (Output is representative.)
Step 2 — Shard the application-controller to 3 replicas with consistent-hashing. Apply both the replica count and the matching env, plus the algorithm:
# patch-controller-sharding.yaml — apply the two-that-must-match plus the algorithm
apiVersion: apps/v1
kind: StatefulSet
metadata:
  name: argocd-application-controller
  namespace: argocd
spec:
  replicas: 3                                # 3 shards: -0, -1, -2
  template:
    spec:
      containers:
        - name: argocd-application-controller
          env:
            - name: ARGOCD_CONTROLLER_REPLICAS
              value: "3"                      # MUST equal spec.replicas
            - name: ARGOCD_CONTROLLER_SHARDING_ALGORITHM
              value: "consistent-hashing"     # stable rebalancing as the fleet grows
kubectl -n argocd patch statefulset argocd-application-controller \
  --patch-file patch-controller-sharding.yaml
# statefulset.apps/argocd-application-controller patched
kubectl -n argocd rollout status statefulset/argocd-application-controller
# Waiting for 3 pods to be ready...
# statefulset rolling update complete 3 pods at revision ...
What just happened: you now have three controller pods, each owning roughly a third of the clusters via the hash ring. Because ARGOCD_CONTROLLER_REPLICAS matches spec.replicas, every cluster is owned by exactly one shard — no gaps. Had they mismatched, some clusters would go Unknown.
Step 3 — Confirm the fleet is balanced across shards.
argocd admin cluster stats
# SERVER                             SHARD   NAMESPACES   APPS   RESOURCES
# https://prod-aks-01.example.com    0       42           118    214530
# https://prod-eks-01.example.com    1       38           96     198004
# https://prod-eks-02.example.com    2       51           140    402118
# https://prod-gke-01.example.com    0       40           104    221190
What just happened: clusters are now spread across shards 0/1/2. prod-eks-02 is still the heaviest single cluster — and it always will be, because one cluster can’t be split — but it now shares a controller with fewer neighbours. If it alone still OOMs its shard, the fix is more memory on the controller, not more shards. (Representative.)
Step 4 — Scale and tune the repo-server. Bump replicas and cap per-pod parallelism:
kubectl -n argocd scale deploy/argocd-repo-server --replicas=3
# deployment.apps/argocd-repo-server scaled
# cmd-params: cap concurrent renders per pod and keep the render cache warm
apiVersion: v1
kind: ConfigMap
metadata:
  name: argocd-cmd-params-cm
  namespace: argocd
data:
  reposerver.parallelism.limit: "10"
  reposerver.repo.cache.expiration: "24h"
  reposerver.revision.cache.expiration: "3m"
kubectl -n argocd apply -f cmd-params.yaml
kubectl -n argocd rollout restart deploy/argocd-repo-server   # picks up cmd-params
What just happened: render throughput is now 3 pods × up to 10 concurrent renders each, with a cap so a burst on a big chart can’t OOM any single pod. Because the repo-server is stateless, this is just “more pods” — no ownership to coordinate.
Step 5 — Tame the monorepo: annotate an app with manifest-generate-paths.
kubectl -n argocd annotate application checkout \
  argocd.argoproj.io/manifest-generate-paths="/apps/checkout;/libs/common" --overwrite
# application.argoproj.io/checkout annotated
What just happened: checkout will now re-render only when files under /apps/checkout or /libs/common change — not when some unrelated app in the same monorepo is edited. Roll this out across the monorepo’s apps and a one-file commit stops stampeding a thousand renders.
Step 6 — Set a webhook and smooth the poll. Configure the Git provider to POST to /api/webhook, then add jitter as a backstop:
# argocd-cm: keep the poll as a safety net, spread it so a shared-repo fleet
# doesn't reconcile in unison
apiVersion: v1
kind: ConfigMap
metadata:
  name: argocd-cm
  namespace: argocd
data:
  timeout.reconciliation: 180s
  timeout.reconciliation.jitter: 60s
kubectl -n argocd apply -f argocd-cm.yaml
# In the Git provider: add a webhook to https://argocd.example.com/api/webhook
# (push events, JSON, shared secret matching argocd-secret) — near-instant refresh on push.
What just happened: pushes now refresh near-instantly via webhook, manifest-generate-paths makes that refresh surgical (only touched apps render), and the periodic poll — spread over a 60s window — is a smooth backstop rather than a synchronized burst.
Step 7 — Add an HPA to the repo-server (safe; stateless).
kubectl -n argocd apply -f repo-server-hpa.yaml   # the autoscaling/v2 HPA shown earlier
kubectl -n argocd get hpa argocd-repo-server
# NAME                 REFERENCE                       TARGETS   MINPODS  MAXPODS  REPLICAS
# argocd-repo-server   Deployment/argocd-repo-server   35%/70%   2        10       3
What just happened: render load is bursty, so the repo-server now scales itself between 2 and 10 pods on CPU. Note we did not HPA the controller — its shard math must stay in lockstep with ARGOCD_CONTROLLER_REPLICAS, which an HPA would silently break.
Step 8 — Verify the whole thing.
kubectl -n argocd get pods -l app.kubernetes.io/name=argocd-application-controller
# argocd-application-controller-0   1/1   Running
# argocd-application-controller-1   1/1   Running
# argocd-application-controller-2   1/1   Running
argocd admin cluster stats           # balanced RESOURCES across SHARD 0/1/2
kubectl -n argocd get deploy argocd-repo-server -o jsonpath='{.status.readyReplicas}{"\n"}'   # 3+
What just happened: three controller shards, a scaled+capped repo-server behind an HPA, a monorepo that only re-renders touched apps, and webhook-driven latency with a jittered safety net. That is a control plane sized for 1,000+ apps across dozens of clusters.
Teardown / revert. To return to a single-instance install:
# Controller back to 1 shard (keep the two numbers in sync!)
kubectl -n argocd patch statefulset argocd-application-controller --type merge \
  -p '{"spec":{"replicas":1,"template":{"spec":{"containers":[{"name":"argocd-application-controller","env":[{"name":"ARGOCD_CONTROLLER_REPLICAS","value":"1"}]}]}}}}'
kubectl -n argocd scale deploy/argocd-repo-server --replicas=1
kubectl -n argocd delete hpa argocd-repo-server
kubectl -n argocd annotate application checkout argocd.argoproj.io/manifest-generate-paths-   # remove annotation
# Optionally revert argocd-cm / argocd-cmd-params-cm to their prior values and restart the affected pods.
If you spun up a throwaway cluster for this, delete it (kind delete cluster / minikube delete) so nothing is left running.
Common mistakes and troubleshooting
The symptom table earlier is your index; this section adds cause and fix for the mistakes people actually make at scale, then prose on the three nastiest.
| Symptom | Cause | Fix |
|---|---|---|
| Reconcile latency high; commits lag | Controller overloaded — too many clusters/objects per shard | Shard the controller: raise ARGOCD_CONTROLLER_REPLICAS and StatefulSet spec.replicas together |
| One shard hot, others idle | legacy modulo clumping, or one oversized cluster |
Switch to consistent-hashing; if it’s one huge cluster, sharding can’t help — scale that shard or split the cluster |
| Repo-server CPU pegged, syncs wait | Manifest generation is the bottleneck | Raise reposerver.parallelism.limit and add repo-server replicas (stateless) |
| Monorepo re-renders every app on any commit | No path scoping — repo revision advances for all apps | Add argocd.argoproj.io/manifest-generate-paths per app + a Git webhook |
argocd-repo-server OOMKilled |
One big chart/monorepo render exceeds memory × parallelism | Raise memory limit; cap --parallelismlimit; raise ARGOCD_EXEC_TIMEOUT; dedicated repo-server for the big repo |
| UI slow, panels stale, cache-miss errors | Redis down/cold/undersized | Run argocd-redis-ha; size Redis memory; check --repo-cache-expiration isn’t too short |
Git host 403/429 secondary rate limit |
Polling/fan-out floods the Git host | Webhooks + timeout.reconciliation.jitter; raise ARGOCD_GIT_ATTEMPTS_COUNT for resilience |
Some clusters Unknown; apps not reconciling |
ARGOCD_CONTROLLER_REPLICAS ≠ StatefulSet spec.replicas → clusters owned by no shard |
Make the two numbers equal; restart the controller pods |
Target cluster returns 429; controller logs throttling |
Too many shards/QPS hammering one cluster’s API | Lower controller.kubectl.parallelism.limit and client QPS; fewer shards watching that cluster |
| Apps show old manifests after tuning cache | Rendered-manifest cache still warm from before | argocd app get <app> --hard-refresh (targeted — don’t fleet-wide it) |
| Controller scaled by an HPA, sharding broke | HPA changed spec.replicas without updating the env |
Remove the HPA; shard manually, or adopt dynamic cluster distribution |
Three gotchas cost the most hours:
1. The replica/env mismatch that silently strands clusters. This is the sharding incident. You bump the StatefulSet to 4 replicas to relieve load, forget that ARGOCD_CONTROLLER_REPLICAS still says 3, and now the shard arithmetic disagrees with reality: some clusters are computed as owned by a shard index that no longer maps cleanly, and their apps drift to Unknown because no running shard is reconciling them. Nothing errors loudly — the apps just quietly stop updating. The fix is trivial once you know it (make the two numbers equal and restart), and the prevention is a rule: treat spec.replicas and ARGOCD_CONTROLLER_REPLICAS as a single setting that must always be changed together — which is exactly why installing via the Helm chart (which binds them) is safer than hand-patching, and why you never point an HPA at the controller.
2. Scaling the wrong tier because two bottlenecks share a symptom. “Syncs are slow” is produced by both an overloaded controller and an overloaded repo-server, and they have opposite fixes. The trap is to reflexively add controller shards. If the real bottleneck was the repo-server, you’ve now added controller pods (and their watch load on every cluster) while the reconciles still sit waiting on a saturated render tier — you spent money and added target-cluster API pressure and fixed nothing. Always split the diagnosis first: is argocd_app_reconcile duration climbing (controller), or is argocd_repo_pending_request_total sitting above zero with repo-server CPU pegged (repo-server)? The metric tells you which knob; the UI symptom alone does not.
3. Fighting monorepo load with a tighter poll. The seductive-but-wrong reaction to a slow monorepo is to shrink timeout.reconciliation so apps “notice changes faster.” It does the opposite of helping: a tighter poll makes every app re-check the shared repo more often, multiplying ls-remote calls and (without path scoping) re-renders, until the Git host rate-limits you and the repo-server melts — and it still isn’t instant, because a poll never is. The monorepo answer is structural, not temporal: manifest-generate-paths so only touched apps render, a webhook so refresh is push-driven and precise, and jitter so the backstop poll doesn’t fire in unison. Latency is a trigger problem, solved by webhooks; it is never solved by hammering the poll.
Cheat-sheet
The knobs, keys, and commands you’ll reach for when Argo CD is under load.
Controller sharding (StatefulSet argocd-application-controller):
| Setting (env / cmd-params-cm) | Default | What it does |
|---|---|---|
ARGOCD_CONTROLLER_REPLICAS / controller.replicas |
1 |
Total shard count — must equal StatefulSet spec.replicas |
ARGOCD_CONTROLLER_SHARDING_ALGORITHM / controller.sharding.algorithm |
legacy |
legacy / round-robin / consistent-hashing |
ARGOCD_ENABLE_DYNAMIC_CLUSTER_DISTRIBUTION |
false |
Heartbeat-based shard claiming (beta) |
controller.status.processors (--status-processors) |
20 |
Concurrent status refreshes per shard |
controller.operation.processors (--operation-processors) |
10 |
Concurrent sync operations per shard |
controller.kubectl.parallelism.limit (--kubectl-parallelism-limit) |
20 |
Concurrent applies per shard (target-cluster load) |
Repo-server (Deployment argocd-repo-server):
| Setting | Default | What it does |
|---|---|---|
reposerver.parallelism.limit (--parallelismlimit) |
0 (unbounded) |
Max concurrent manifest renders per pod — set it |
reposerver.repo.cache.expiration (--repo-cache-expiration) |
24h |
Rendered-manifest cache TTL in Redis |
reposerver.revision.cache.expiration (--revision-cache-expiration) |
3m |
ref→SHA cache TTL |
ARGOCD_EXEC_TIMEOUT (env) |
90s |
Timeout for one helm/kustomize/plugin run |
ARGOCD_GIT_ATTEMPTS_COUNT (env) |
small | Git operation retry attempts under load |
spec.replicas / HPA |
1 |
Horizontal scale — stateless, HPA-safe |
Reconciliation & monorepo:
| Setting | Default | What it does |
|---|---|---|
timeout.reconciliation (argocd-cm) |
180s |
Backstop poll — leave near default |
timeout.reconciliation.jitter (argocd-cm) |
0s |
Spread the poll tick across a window |
argocd.argoproj.io/manifest-generate-paths (annotation) |
— | Re-render only when tracked paths change |
Webhook → /api/webhook |
— | Near-instant, changed-file-aware refresh |
Commands:
| Command | What it does |
|---|---|
argocd admin cluster stats |
Per-shard cluster/app/resource counts (imbalance check) |
argocd admin cluster shards |
Which shard owns which cluster |
kubectl -n argocd get statefulset argocd-application-controller |
See controller shard count |
kubectl -n argocd scale deploy/argocd-repo-server --replicas=N |
Scale render tier |
argocd app get <app> --hard-refresh |
Bust the manifest cache for one app |
kubectl -n argocd get cm argocd-cmd-params-cm -o yaml |
Read the tuning ConfigMap |
The five scaling rules in one breath: shard the controller by cluster (with consistent-hashing, keeping the two replica numbers equal); scale the repo-server wide (it’s the first bottleneck and it’s stateless — HPA it); scope the monorepo with manifest-generate-paths + webhooks; keep Redis HA and sized; and never scale without the metric that justifies it.
Interview and exam questions
Q: Does Argo CD’s application-controller shard by application or by cluster? Why does the distinction matter?
A: By cluster — each shard owns a set of destination clusters and reconciles every Application targeting them. It matters because one cluster’s entire load lives on exactly one shard and cannot be split: sharding balances many clusters across replicas but cannot subdivide a single huge cluster. If one cluster is the problem, you scale that shard’s resources or split the cluster, not add shards.
Q: You bump the controller StatefulSet from 3 to 5 replicas and some apps go Unknown. What happened?
A: You didn’t update ARGOCD_CONTROLLER_REPLICAS to match spec.replicas. The shard arithmetic uses that env for the total shard count, so with a mismatch some clusters are owned by no running shard and stop reconciling. Set both to 5 and restart the controller pods. This is why an HPA must never drive the controller.
Q: Compare the legacy and consistent-hashing sharding algorithms. When does the difference bite?
A: legacy assigns clusters by index modulo replica count; consistent-hashing maps them onto a hash ring. The difference bites when you change the replica count: legacy reshuffles almost every cluster (mass cache-rebuild + API-load spike across all clusters at once), while consistent-hashing moves only ~1/N of clusters. For a fleet that grows, use consistent-hashing so scaling out is smooth, not a self-inflicted thundering herd.
Q: Under load, which saturates first — the controller or the repo-server — and why?
A: Usually the repo-server. The controller diffs against a warm in-memory cache (cheap per app), but the repo-server clones repos and runs helm template/kustomize build on every unique render — CPU- and memory-heavy, multiplied by every app. “Slow syncs + repo-server CPU pegged + argocd_repo_pending_request_total > 0” is the repo-server; “argocd_app_reconcile duration climbing” is the controller.
Q: What does --parallelismlimit do on the repo-server, and why is its default risky on a big monorepo?
A: It caps concurrent manifest generations per pod. The default is 0 (unlimited), so a burst of concurrent large helm template runs can each grab hundreds of MB and collectively OOM the pod. Set a limit (e.g. 10) to bound peak memory and smooth throughput, then scale width with replicas.
Q: Explain manifest-generate-paths and why it’s the key monorepo optimization.
A: It’s a per-Application annotation listing the repo paths whose contents affect that app’s manifests. On a new revision, Argo CD compares the changed files against each app’s tracked paths and reuses cached manifests (no re-render) if none of that app’s paths changed. In a monorepo, this collapses a one-file-commit stampede of a thousand re-renders down to only the handful of touched apps. It pairs with webhooks, which supply the exact changed-file list.
Q: A single commit to a monorepo makes every app refresh. Two teammates propose fixes: lower timeout.reconciliation, or add manifest-generate-paths + a webhook. Which is right?
A: The annotation + webhook. Lowering the poll makes it worse — every app re-checks the shared repo more often, multiplying ls-remote and re-renders until the Git host rate-limits you, and it’s still not instant. manifest-generate-paths makes refreshes surgical (only touched apps render) and the webhook makes them push-driven and precise. Latency is a trigger problem solved by webhooks, not a poll-interval problem.
Q: Which Argo CD components can you safely put an HPA on, and which not?
A: Safe: argocd-repo-server and argocd-server (both stateless — more pods, no ownership to break); the ApplicationSet controller cautiously (leader-elected, so replicas add availability, not throughput). Not the argocd-application-controller: its sharding depends on ARGOCD_CONTROLLER_REPLICAS matching spec.replicas, and an HPA changing replicas without the env strands clusters. Shard it manually, or use dynamic cluster distribution.
Q: How do you check whether your controller shards are balanced, and what does imbalance look like?
A: argocd admin cluster stats shows per-shard cluster/app/resource counts; argocd admin cluster shards shows which shard owns which cluster. Imbalance is one shard with far more RESOURCES than the others — caused either by legacy modulo clumping (fix: switch to consistent-hashing) or by one genuinely huge cluster (unfixable by sharding — scale that shard or split the cluster).
Q: If Redis is undersized or down at scale, what breaks, and do you lose data?
A: No data loss — Redis is only a cache; desired state is in Git and live state is in the clusters. What breaks is performance: a cold or evicting cache forces re-renders and re-lists, landing as slow, stale UI and laggy reconciles, with cache-miss errors in logs. Run argocd-redis-ha and size its memory to the rendered-manifest working set to keep the cache continuously available.
Q: What is the “cost of scale” on your target clusters, and how do you control it?
A: Each controller shard opens and maintains list/watch connections (and issues applies) to the clusters it owns, so more shards or higher per-shard QPS/processors mean more load on every target cluster’s API server — which manifests as 429 Too Many Requests (AKS throttling, EKS/GKE API Priority & Fairness shedding). Control it with controller.kubectl.parallelism.limit and the client QPS/burst — lower them to trade sync throughput for a happier cluster API.
Q (scenario): p90 of argocd_app_reconcile has doubled over a month as you added clusters, and one controller pod OOMKills nightly. Walk through your response.
A: The rising reconcile p90 plus a single-pod OOM says one shard is overloaded on cached objects. Check argocd admin cluster stats for the RESOURCES distribution. If it’s clumped, switch to consistent-hashing and/or add a shard (raising both spec.replicas and ARGOCD_CONTROLLER_REPLICAS) to spread clusters. If one cluster alone dominates its shard, sharding won’t help — raise that controller’s memory limit or split the cluster. Then confirm the rebalance in stats and watch p90 recede.
Key takeaways
- Scaling Argo CD is diagnosis before action. Four bottlenecks (controller reconcile, repo-server render, monorepo stampede, Redis) share overlapping symptoms but have opposite fixes — always read the metric that names the saturated component before turning a knob.
- The controller shards by cluster, not app. Set
ARGOCD_CONTROLLER_REPLICASand the StatefulSetspec.replicasto the same number (a mismatch strands clusters asUnknown), and preferconsistent-hashingso growing the fleet moves only ~1/N of clusters instead of reshuffling everything. - One cluster can’t be split across shards. Sharding balances many clusters; a single huge cluster is always one shard’s whole burden — scale that shard or split the cluster.
- The repo-server usually saturates first, and it’s the easy one. It’s stateless: scale it wide with replicas or an HPA, cap per-pod concurrency with
--parallelismlimitso a big render can’t OOM it, and keep its render cache warm. Its memory is driven by your largest render, not your average. manifest-generate-paths+ webhooks is the monorepo fix. The annotation re-renders only apps whose tracked paths changed; the webhook makes refresh push-driven and precise. Together they turn a one-commit thousand-app stampede into a handful of renders. Never fight monorepo load with a tighter poll.- HPA the stateless components; never naïvely the controller. repo-server and server autoscale safely; the controller’s shard math must stay in lockstep with its replica env, which an HPA breaks.
- The poll is a safety net, not a throughput dial. Webhooks for latency,
timeout.reconciliationfor backstop, jitter for smoothness — shrinking the poll just rate-limits your Git host. - Every knob has a bill, and some lands on your clusters. More shards and higher QPS mean more API load on every target cluster (
429s on AKS/EKS/GKE); keepcontroller.kubectl.parallelism.limitand client QPS proportionate to what those control planes can take.