A canary deploy is only as good as the thing deciding whether the canary is healthy. In most shops that “thing” is a human: someone pushes a new version to 10% of traffic, opens Grafana, squints at an error-rate panel for ten minutes, and either clicks promote or clicks rollback. That works right up until it doesn’t — the deploy goes out at 2 a.m., or the reviewer gets pulled into a meeting, or the panel they’re watching is the wrong one. The whole promise of progressive delivery is that a bad version should never reach 100% of users. A human with a dashboard is a fragile way to keep that promise.
This lesson is about removing the human from the promotion decision — not the human judgement (you still write the rules), but the human staring. You will teach the canary to query its own vital signs, evaluate them against a threshold you defined in Git, and act: promote when the numbers are good, automatically abort and revert to stable when they are not. Argo Rollouts calls this analysis, and it is the single feature that turns “canary” from a traffic trick into a real safety system.
We assume you already know the Rollout resource and the canary/blue-green strategies from Argo Rollouts: Canary & Blue-Green, and that you have Prometheus scraping your workloads (if not, Observability: Metrics with Prometheus & Grafana gets you there). Everything here targets Argo Rollouts 1.7+ on Kubernetes 1.29+. There is no live cluster behind this page, so every command output below is labelled representative — the shapes, states, and field names are exactly what a real run produces; only the hashes and timestamps will differ on yours.
Why this matters
The core problem is a mismatch of speed. A deployment can go from “10% of traffic” to “100% of traffic” in the time it takes to click a button, but knowing whether that 10% is healthy takes minutes of observation and a clear definition of “healthy.” When the two are done by the same tired person under deadline pressure, you get one of two failure modes: you promote too fast (and ship the outage), or you promote too slow (and every deploy becomes an afternoon of babysitting). Neither scales past a handful of services.
Metric-driven promotion fixes the mismatch by writing the definition of “healthy” down, once, as code, and letting the controller enforce it on every rollout forever. The definition lives in an AnalysisTemplate — a small CRD that says “query this metric, this often, and the new version passes only if the number clears this bar.” The Rollout references the template at a specific point in the canary, and the controller creates an AnalysisRun that does the watching for you. If the numbers hold, the rollout proceeds. If they don’t, the rollout aborts itself and shifts all traffic back to the stable version — no page, no click, no Grafana.
The mental model to hold for the rest of this lesson is a control loop, not a pipeline: observe → decide → act, repeated on an interval. Observe the metric. Decide against the condition. Act by continuing or aborting. That loop is what an AnalysisRun is.
| Human-gated promotion | Metric-gated promotion (analysis) | |
|---|---|---|
| Who decides | A person watching a dashboard | The Rollout controller evaluating an AnalysisRun |
| Definition of “healthy” | In someone’s head, varies by reviewer | In Git, one AnalysisTemplate, identical every time |
| Reaction time | Minutes; depends who’s awake | Seconds after the measurement interval |
| At 2 a.m. | Nobody watching → bad version promotes | Same rules run; bad version auto-aborts |
| Rollback | Manual: notice, decide, kubectl/click |
Automatic: analysis Failed → abort → revert to stable |
| Scales to N services | No — one dashboard per person | Yes — one template per SLO, reused everywhere |
| Auditability | Chat message “looked fine to me” | An AnalysisRun object with every measurement recorded |
The right way to read that table: analysis does not replace your judgement, it encodes it. You still decide that 95% success rate is the line. You just stop being the sensor and the switch.
The idea: a canary that watches its own vitals
Picture the canary as a patient in an ICU and the AnalysisRun as the monitor wired to it. The monitor takes a reading every so often (the interval), compares each reading to an alarm threshold (the successCondition / failureCondition), and tolerates a set number of bad readings before it pulls the alarm (the failureLimit). While the readings are good, the surgery continues — traffic keeps shifting to the new version. The instant too many readings go bad, the alarm fires and the controller rolls the patient back to the last known-good state — the stable ReplicaSet.
Three properties make this trustworthy rather than a gimmick:
- It is periodic, not a single snapshot. A one-off check right after a deploy catches nothing — the JVM hasn’t warmed up, caches are cold, the first request always looks weird. Analysis measures
counttimes atinterval, so a transient blip doesn’t fail the run and a slow-burning regression doesn’t slip through. - It tolerates noise deliberately. Real metrics are jittery.
failureLimitlets you say “three bad readings out of ten is noise; the fourth is a signal,” so the gate is neither hair-trigger nor asleep. - The failure action is automatic and safe. Because the stable ReplicaSet is still running (a canary never deletes stable until it’s fully promoted), reverting is instant: scale stable back to full weight, scale the canary to zero. There is nothing to rebuild.
Read the loop left to right below. The Rollout is mid-canary; the controller spawns an AnalysisRun; the run queries Prometheus on an interval; each result is checked against the successCondition; if the condition holds the step promotes, and if failures pile past the limit the Rollout aborts and traffic snaps back to stable. Every numbered badge is a decision point or a failure mode — the places where this either saves you or, misconfigured, bites you.
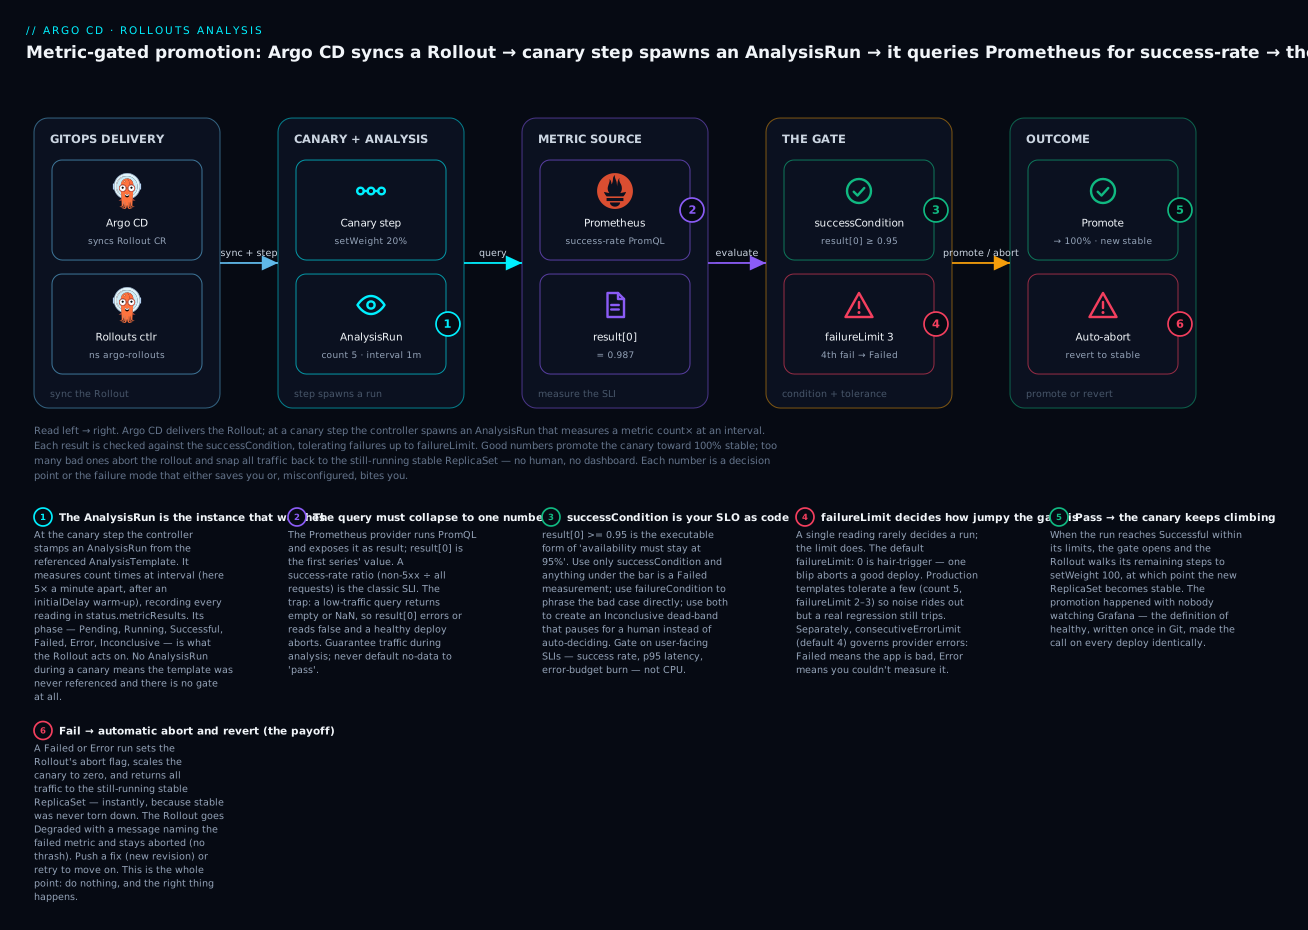
The two nodes worth tattooing on your brain are the amber gate and the red outcome. The gate (badges 3-4) is where your SLO becomes an executable expression — result[0] >= 0.95 — with a tolerance (failureLimit) that decides how jumpy it is. The red outcome (badge 6) is the payoff of the entire feature: when analysis fails, you do nothing and the right thing happens. That is the difference between “we have canaries” and “we are actually protected by them.”
AnalysisTemplate and ClusterAnalysisTemplate, field by field
Analysis is defined by two nearly identical CRDs. An AnalysisTemplate is namespaced — it lives next to the Rollout that uses it. A ClusterAnalysisTemplate is cluster-scoped — define your organisation’s standard SLO checks once and reference them from Rollouts in any namespace. The spec schema is identical between the two; only the scope and how you reference them differ.
Here is a complete, schema-correct AnalysisTemplate with every commonly used field present. Read it once, then we’ll dissect the metric block.
apiVersion: argoproj.io/v1alpha1
kind: AnalysisTemplate
metadata:
  name: success-rate
  namespace: demo
spec:
  args:
  - name: service-name                     # required at use-time (no default)
  - name: prometheus-address               # has a default, can be overridden
    value: http://prometheus-operated.monitoring.svc.cluster.local:9090
  metrics:
  - name: success-rate                     # identifier for this measurement
    interval: 30s                          # measure every 30s...
    count: 5                               # ...five times, then finish
    initialDelay: 60s                      # wait 60s before the first measurement
    successCondition: result[0] >= 0.95    # pass when success rate >= 95%
    failureLimit: 3                        # tolerate 3 bad readings; the 4th fails the run
    consecutiveErrorLimit: 4               # 4 provider errors in a row = Error (default)
    provider:
      prometheus:
        address: "{{args.prometheus-address}}"
        timeout: 20                        # seconds to wait for the query
        query: |
          sum(rate(
            http_requests_total{app="{{args.service-name}}", code!~"5.."}[2m]
          ))
          /
          sum(rate(
            http_requests_total{app="{{args.service-name}}"}[2m]
          ))
The metric fields, exactly
Every field under spec.metrics[] is confirmed against the Argo Rollouts Metric type. These are the knobs that decide how jumpy, how patient, and how strict your gate is.
| Field | Type | Default | What it controls |
|---|---|---|---|
name |
string | — (required) | Identifier for the measurement; shows up in the AnalysisRun status |
interval |
duration | once | How often to take a measurement (30s, 2m, 1h). Omit it and the metric runs a single time |
count |
int/string | — | How many measurements to take. With interval, the run finishes after count measurements. 0 = run continuously (used for background analysis) |
initialDelay |
duration | 0 |
Wait this long after the run starts before the first measurement — the warm-up window |
successCondition |
expr | — | Expression that, when true, marks the measurement Successful |
failureCondition |
expr | — | Expression that, when true, marks the measurement Failed |
failureLimit |
int/string | 0 |
Max Failed measurements tolerated before the metric (and run) is Failed |
inconclusiveLimit |
int/string | 0 |
Max Inconclusive measurements tolerated before the run is Inconclusive |
consecutiveErrorLimit |
int/string | 4 |
Max consecutive provider errors (e.g. Prometheus unreachable) before the run Errors |
consecutiveSuccessLimit |
int/string | 0 |
Require N consecutive successes to pass early (Argo Rollouts 1.8+); 0 disables |
provider |
object | — (required) | Exactly one metric source: prometheus, datadog, web, job, etc. |
Two subtleties beginners miss. First, failureLimit counts total failed measurements across the run, while consecutiveErrorLimit counts consecutive provider errors — a failed measurement (your app is genuinely returning 500s) and an errored measurement (Prometheus timed out) are different things with different budgets. Second, count: 0 is not “measure zero times” — it means “measure forever,” which is exactly what you want for a background analysis that should run for the whole duration of the canary.
Namespaced vs cluster-scoped
AnalysisTemplate |
ClusterAnalysisTemplate |
|
|---|---|---|
| Scope | One namespace | Whole cluster |
| Referenced by | templateName (same namespace) |
templateName + clusterScope: true |
| Good for | App-specific checks (this service’s own metric) | Org-wide SLO standards reused everywhere |
| Ownership | App team, lives in the app’s GitOps path | Platform team, lives in the platform repo |
spec schema |
Identical | Identical |
A healthy pattern for a platform team: publish ClusterAnalysisTemplates named success-rate, latency-p95, and error-budget that encode the house SLOs, and have every app Rollout reference them with clusterScope: true, passing only the app-specific args (the service name, the namespace). One definition of “healthy,” enforced fleet-wide, owned by the people who own the SLOs.
Arguments: parameterising a template
spec.args turns a template into a reusable function. Each arg is either declared with no value (the caller must supply it), given a default value, or sourced from a Secret with valueFrom.secretKeyRef — the right place for an API token so it never appears in the manifest.
spec:
  args:
  - name: service-name                     # caller must provide this
  - name: prometheus-address
    value: http://prometheus-operated.monitoring.svc:9090   # default
  - name: api-token
    valueFrom:
      secretKeyRef:
        name: datadog-creds
        key: api-token                     # secret, never inline
Inside metrics[], reference an arg anywhere a string is expected with the double-brace syntax: {{args.service-name}}. The controller substitutes the value before sending the query. Miss a required arg at use-time and the AnalysisRun never starts — you’ll see it in the Rollout events, covered in troubleshooting.
| Arg declaration | Where the value comes from | Use it for |
|---|---|---|
- name: x (no value) |
Caller must pass it in the Rollout’s analysis.args |
Per-app values: service name, namespace |
- name: x + value: |
The default in the template | Shared defaults: Prometheus address |
- name: x + valueFrom.secretKeyRef |
A Kubernetes Secret | Credentials: API keys, tokens |
The metric providers
A provider is the source the analysis queries. Argo Rollouts ships twelve built-in providers, and you pick exactly one per metric. There is deliberately no generic “Kubernetes” provider — when people ask for one they mean the job provider, which runs an arbitrary Kubernetes Job as the check (run any container, any script, any in-cluster probe, and let its exit code be the verdict). For anything truly custom there is the plugin provider, which loads a metric plugin you supply. Everything else is a specific observability backend.
Provider (provider.<key>) |
Category | Reach for it when… |
|---|---|---|
prometheus |
Time-series | You self-host Prometheus (or a Prometheus-compatible store); the default for most teams |
datadog |
SaaS APM/metrics | Datadog is your system of record; apiVersion: v2 for Metrics Query |
newRelic |
SaaS APM | You run New Relic; query is NRQL |
cloudWatch |
Cloud-native (AWS) | Your signals are already in CloudWatch on EKS |
wavefront |
SaaS time-series | You use Wavefront (Tanzu Observability) |
graphite |
Time-series | Legacy Graphite is your metric store |
influxdb |
Time-series | Metrics live in InfluxDB; query is Flux |
skywalking |
APM (open source) | Apache SkyWalking traces your services |
kayenta |
Automated canary | You already run Spinnaker’s Kayenta for ACA (advanced statistical scoring) |
web |
HTTP endpoint | You want to hit any REST endpoint and parse JSON (a gate service, a custom SLO API) |
job |
Kubernetes Job | You want to run a check — an integration test, a smoke test, a load probe — not query a metric |
plugin |
Custom | None of the above fit; you ship a Go metric plugin |
Prometheus — the one you’ll use most
The Prometheus provider runs a PromQL query and exposes the outcome to your condition as result. For an instant query returning a vector, result is an array of the scalar values, and result[0] is the first (usually only) series’ value. The whole art is writing a query that collapses to a single meaningful number — a ratio, a quantile, a rate.
provider:
  prometheus:
    address: http://prometheus-operated.monitoring.svc.cluster.local:9090
    timeout: 20                  # seconds; a slow query shouldn't hang the run
    insecure: false              # set true only to skip TLS verification (dev)
    query: |
      sum(rate(
        http_requests_total{app="checkout", code!~"5.."}[2m]
      ))
      /
      sum(rate(
        http_requests_total{app="checkout"}[2m]
      ))
| Field | Meaning |
|---|---|
address |
Prometheus server URL (in-cluster Service DNS or external) |
query |
The PromQL; templated with {{args.*}} |
timeout |
Seconds to wait for the query before erroring |
insecure |
Skip TLS verification (dev only) |
headers |
Extra HTTP headers (e.g. X-Scope-OrgID for a Thanos/Mimir tenant) |
rangeQuery |
start/end/step for a range query instead of an instant query |
authentication |
sigv4 (AWS SigV4) or oauth2 (tokenUrl, clientId, clientSecret, scopes) |
The result shape is the number-one source of broken conditions, so be precise:
| Query returns | result is |
Reference it as | Watch out |
|---|---|---|---|
| One series (instant vector) | [value] |
result[0] |
The normal, intended case |
| Multiple series | [v0, v1, …] |
result[0], result[1] |
You probably meant one number — collapse with sum(...) |
| A scalar | the scalar | result |
Some functions (scalar()) return this |
| Nothing matched | [] (empty) |
result[0] errors |
The no-data trap → Error measurement |
A bare instant vector gives you result[0] as a float; multiple series give you result[0], result[1], …; and a query that matches nothing gives an empty result, where result[0] is an error — the dreaded no-data trap we handle below.
Web — hit any HTTP endpoint
When your source of truth is a REST API (a home-grown gate service, a third-party SLO tool), the web provider fetches a URL and evaluates a jsonPath from the response.
provider:
  web:
    url: https://gate.example.com/api/v1/canary?svc={{args.service-name}}
    method: GET                  # or POST/PUT with a body
    timeoutSeconds: 20
    headers:
    - key: Authorization
      value: "Bearer {{args.api-token}}"
    jsonPath: "{$.approved}"     # pull one field out of the JSON response
# successCondition: "result == true"
web field |
Meaning |
|---|---|
url |
Endpoint to hit (templated with {{args.*}}) |
method |
GET, POST, or PUT |
body |
Request body for POST/PUT |
headers[] |
key/value HTTP headers — where auth tokens go |
jsonPath |
JSONPath extracting one value from the response into result |
timeoutSeconds |
Per-request timeout |
Job — run a check instead of querying one
The job provider runs a Kubernetes Job. The measurement is Successful if the Job completes with exit code 0 and Failed otherwise — no successCondition needed. This is your escape hatch for anything you can script: integration tests, synthetic transactions, a load-test-then-check.
provider:
  job:
    metadata:
      labels:
        role: canary-check
    spec:
      backoffLimit: 1
      template:
        spec:
          containers:
          - name: test
            image: ghcr.io/acme/canary-tests:1.4.0
            command: ["pytest", "-q", "--target", "{{args.service-name}}"]
          restartPolicy: Never
job provider |
Meaning |
|---|---|
metadata |
labels/annotations stamped onto the created Job |
spec |
A standard Kubernetes Job spec (backoffLimit, template, containers) |
| Success | Job completes with exit code 0 → measurement Successful |
| Failure | Job fails or exits non-zero → measurement Failed |
Because the verdict is just an exit code, the job provider is how you run any Kubernetes-native check — the closest thing to the “Kubernetes provider” people expect, and far more flexible.
Cloud-managed metric backends — where the multi-cloud edge appears
The analysis mechanics are entirely cloud-neutral: the same AnalysisTemplate, successCondition, and abort behaviour run identically on AKS, EKS, and GKE. The one place a cloud edge appears is which metric store you query and how the Rollouts controller authenticates to it. If you run a plain in-cluster Prometheus, there is no cloud edge at all — skip this table. The moment you point analysis at a managed metric service, each cloud authenticates its own way, and you grant that identity to the argo-rollouts controller ServiceAccount (namespace argo-rollouts), because the controller is the process making the query.
| Cloud | Managed metric backend | Provider to use | How the controller authenticates | Permission to grant |
|---|---|---|---|---|
| AKS (Azure) | Azure Monitor managed Prometheus | prometheus with authentication.oauth2 |
Microsoft Entra Workload Identity federated to the argo-rollouts SA; client-credentials to the query endpoint (scope https://prometheus.monitor.azure.com/.default) |
Monitoring Data Reader on the workspace |
| AKS (Azure) | Azure Monitor metrics (non-Prometheus) | web against the Azure Monitor REST API |
Entra Workload Identity → bearer token in a header | Monitoring Reader on the resource |
| EKS (AWS) | Amazon Managed Prometheus (AMP) | prometheus with authentication.sigv4 (region, roleArn) |
IRSA or EKS Pod Identity on the argo-rollouts SA assumes a role; SigV4-signs the query |
aps:QueryMetrics, aps:GetSeries on the workspace |
| EKS (AWS) | CloudWatch | cloudWatch |
IRSA or EKS Pod Identity on the argo-rollouts SA |
cloudwatch:GetMetricData |
| GKE (GCP) | Google Cloud Managed Service for Prometheus | prometheus against the in-cluster GMP frontend proxy |
Workload Identity: the argo-rollouts KSA bound to a GSA; the frontend adds Google auth |
roles/monitoring.viewer |
| GKE (GCP) | Cloud Monitoring (non-Prometheus) | web against the Cloud Monitoring API |
Workload Identity → OAuth token | roles/monitoring.viewer |
Two paired examples make the difference concrete. On EKS with Amazon Managed Prometheus, SigV4 signing is the whole story — no address-embedded credentials:
# EKS + Amazon Managed Prometheus
provider:
  prometheus:
    address: https://aps-workspaces.us-east-1.amazonaws.com/workspaces/ws-abc123/
    authentication:
      sigv4:
        region: us-east-1
        roleArn: arn:aws:iam::111122223333:role/argo-rollouts-amp-query
    query: |
      sum(rate(http_requests_total{app="checkout",code!~"5.."}[2m]))
      / sum(rate(http_requests_total{app="checkout"}[2m]))
On AKS with Azure Monitor managed Prometheus, OAuth2 client-credentials against the query endpoint, with the client secret pulled from a Kubernetes Secret via an arg:
# AKS + Azure Monitor managed Prometheus
provider:
  prometheus:
    address: https://my-workspace.eastus.prometheus.monitor.azure.com
    authentication:
      oauth2:
        tokenUrl: https://login.microsoftonline.com/<tenant-id>/oauth2/v2.0/token
        clientId: "{{args.entra-client-id}}"
        clientSecret: "{{args.entra-client-secret}}"
        scopes:
        - https://prometheus.monitor.azure.com/.default
    query: |
      sum(rate(http_requests_total{app="checkout",code!~"5.."}[2m]))
      / sum(rate(http_requests_total{app="checkout"}[2m]))
On GKE, the cleanest path avoids auth in the template entirely: deploy the Managed Service for Prometheus frontend in-cluster (it runs under Workload Identity and adds Google credentials for you), and point the analysis at it like any ordinary Prometheus — address: http://frontend.gmp-system.svc:9090. The cloud edge collapses back into a plain Prometheus query.
For deeper coverage of registering these identities — IRSA vs EKS Pod Identity, Entra Workload Identity, GKE Workload Identity — the per-cloud lessons on running Argo CD on each platform go field by field; here the only new fact is that the Rollouts controller SA is the identity that needs the read permission, not Argo CD’s.
Writing the success and failure conditions
The condition is where your SLO becomes executable. Conditions are expressions in expr evaluated against result. The rules that decide a measurement’s phase are simple but easy to get backwards:
| You specify | Expression true | Expression false |
|---|---|---|
Only successCondition |
measurement Successful | measurement Failed |
Only failureCondition |
measurement Failed | measurement Successful |
| Both | (success true →) Successful; else (failure true →) Failed; else Inconclusive |
So successCondition: result[0] >= 0.95 alone means “anything under 95% is a failure.” If you’d rather express the bad case directly — often clearer for error budgets — use failureCondition: result[0] > 0.05 (“more than 5% errors is a failure”). Using both creates a deliberate dead-band in the middle that is neither pass nor fail — an Inconclusive zone that pauses the rollout for a human instead of promoting or aborting. That’s the tool for “I’m not confident enough to auto-decide in this range.”
The condition language gives you a small, reliable toolkit — learn these five pieces and you can express almost any gate:
| Expression piece | Example | What it does |
|---|---|---|
| Index | result[0] |
The first series’ scalar value |
| Comparison | result[0] >= 0.95 |
Threshold test → bool |
| Boolean combine | result[0] < 0.05 && result[1] > 100 |
Gate on multiple signals at once |
| Length guard | len(result) > 0 |
“Did the query return any data?” |
| Default fallback | default(result, 0) |
Substitute a value when the result is missing (choose the fail-safe fallback) |
| Named field | result.successRate |
Pull a field from a JSON/NRQL result (web, newRelic) |
The limit fields decide how jumpy the gate is
A single measurement almost never decides a run — the limits do. Each phase has its own budget:
| Limit | Counts | Run outcome when exceeded | Default |
|---|---|---|---|
failureLimit |
Total Failed measurements | Run Failed → Rollout aborts | 0 |
inconclusiveLimit |
Total Inconclusive measurements | Run Inconclusive → Rollout pauses | 0 |
consecutiveErrorLimit |
Consecutive provider errors | Run Error → Rollout aborts | 4 |
consecutiveSuccessLimit |
Consecutive successes (1.8+) | Run Successful early (short-circuit pass) | 0 (off) |
The interaction to internalise: with the defaults (failureLimit: 0), the very first failed measurement fails the whole run. That is far too jumpy for real metrics — one slow scrape and your good deploy aborts. Production templates almost always raise failureLimit to tolerate a few blips over a count of several measurements. A common, sane shape is count: 5, interval: 1m, failureLimit: 2 — “measure five times a minute apart; abort only if three of them are bad.”
Timing: count, interval, initialDelay
| Field | Question it answers | Typical value |
|---|---|---|
initialDelay |
How long to let the new version warm up before judging it? | 30s–5m |
interval |
How often to re-measure? | 30s–5m (match your metric’s scrape/aggregation) |
count |
How many measurements before deciding? | 3–10 (inline); 0 = forever (background) |
initialDelay is the field people forget and then blame the tool. A brand-new pod has cold caches, an unwarmed JVM, and near-zero traffic; measured immediately, its “success rate” is noise. Give it a warm-up. And interval should never be shorter than your metric’s freshness — if Prometheus aggregates over a 2-minute window and scrapes every 30s, an interval: 10s just re-reads the same stale number four times.
The no-data trap — the failure mode that fools everyone
Here is the gotcha that costs teams a weekend. Your successCondition: result[0] >= 0.95 looks airtight. Then a canary goes out during a quiet hour, receives almost no traffic, and your success-rate query — a ratio with near-zero denominator — returns empty or NaN. Now result[0] either throws (an Error measurement, eating your consecutiveErrorLimit) or is NaN (the comparison is false, a Failed measurement). Either way a perfectly healthy deploy gets aborted because there wasn’t enough traffic to judge it — or, if you “fixed” it the wrong way with a permissive default, a genuinely broken deploy sails through because no-data was treated as pass.
There is no free lunch here; you choose a risk posture:
- Guarantee traffic during analysis. Run a small load generator against the canary so the query always has data. This is the most robust and the approach the lab uses.
- Guard the expression with a default. Providers like Datadog support
default(result, 0)to substitute a value when the result is missing. Choosing the fallback is the risk decision:default(result[0], 0)treats no-data as failure (fail-safe, may abort good deploys in quiet windows);default(result[0], 1)treats it as success (fail-open, dangerous — a broken build with no traffic promotes). - Widen the window or raise
failureLimit. A longer rate window and more tolerance ride out brief data gaps instead of reacting to them.
The instinct to reach for default(..., 1) “so my quiet-hour deploys stop failing” is exactly how a real outage promotes itself. Prefer guaranteeing traffic. If you must default, default to the fail-safe value and accept the occasional false abort.
AnalysisRun: the instance
An AnalysisTemplate is a class; an AnalysisRun is the object instantiated from it when analysis actually runs. The controller creates it, records every measurement in its status, and drives it to a terminal phase. You rarely write one by hand — you read them to understand what a rollout decided and why.
There are two levels of “phase,” and confusing them is a common source of muddled debugging. Each individual measurement gets a phase; the accumulated measurements, weighed against the limits, decide the run’s phase. First, the per-measurement phases:
| Measurement phase | Set when | Counts toward |
|---|---|---|
Successful |
successCondition true (or failureCondition false) |
consecutiveSuccessLimit |
Failed |
failureCondition true (or successCondition false) |
failureLimit |
Inconclusive |
Both conditions set, neither matched | inconclusiveLimit |
Error |
The provider call itself failed (timeout, unreachable, auth) | consecutiveErrorLimit |
And then the run’s overall status.phase, which is what the Rollout actually reacts to:
status.phase |
Meaning | Effect on the Rollout |
|---|---|---|
Pending |
Created, first measurement not yet taken (e.g. in initialDelay) |
Rollout waits |
Running |
Actively measuring | Rollout proceeds/paused per strategy |
Successful |
Passed the conditions within limits | Rollout continues / promotes |
Failed |
failureLimit exceeded (or failureCondition decisive) |
Rollout aborts → revert to stable |
Error |
consecutiveErrorLimit of provider errors |
Rollout aborts → revert to stable |
Inconclusive |
inconclusiveLimit exceeded |
Rollout pauses for human decision |
Terminated |
Externally stopped (rollout aborted/retried) | Run halts |
The distinction that matters operationally: Failed and Error both abort, but they mean opposite things. Failed = “your app is genuinely bad” (the metric cleared the failure bar). Error = “I couldn’t measure your app” (Prometheus was down, the query timed out, credentials expired). Chasing a code bug when the real problem was an unreachable Prometheus is a classic wasted afternoon — always read the run’s message to see which it was.
AnalysisRuns are named after the Rollout, the ReplicaSet’s pod-template-hash, and a counter (e.g. rollouts-demo-687d76d795-2). Inspect them with standard kubectl:
# List the runs for a namespace
kubectl -n demo get analysisrun
# NAME                          STATUS      AGE
# rollouts-demo-687d76d795-2    Running     45s

# The full story: every measurement, its value, its phase
kubectl -n demo get analysisrun rollouts-demo-687d76d795-2 -o yaml
The status.metricResults[].measurements[] array is the receipt — each entry has a phase, a value (the actual number the query returned), and timestamps. When someone asks “why did the deploy roll back?”, that array is the answer, and it’s in the cluster, not in anyone’s memory.
Wiring analysis into a Rollout
A template that no Rollout references never runs. There are four placements, and choosing the right one is a real design decision. The table first, then each in code.
| Placement | Field | When it runs | On failure | Use it for |
|---|---|---|---|---|
| Inline (per-step) | strategy.canary.steps[].analysis |
At that exact step, blocks until it finishes | Abort → revert to stable | A gate between weight increases: “prove 20% is healthy before going to 50%” |
| Background | strategy.canary.analysis |
Throughout the rollout, in parallel with steps | Abort at any point | Continuous guard for the whole canary duration |
| Pre-promotion (BG) | strategy.blueGreen.prePromotionAnalysis |
After preview is up, before traffic cutover | Cancel promotion; active stays on stable | Smoke-test the green stack before sending users to it |
| Post-promotion (BG) | strategy.blueGreen.postPromotionAnalysis |
After traffic cutover to green | Roll back to blue | Confirm the live cutover is healthy, revert if not |
Inline: a gate between canary steps
The most common shape. analysis is a step, so the rollout stops at it and won’t advance until the run reaches Successful.
apiVersion: argoproj.io/v1alpha1
kind: Rollout
metadata:
  name: rollouts-demo
  namespace: demo
spec:
  replicas: 5
  revisionHistoryLimit: 3
  selector:
    matchLabels:
      app: rollouts-demo
  template:
    metadata:
      labels:
        app: rollouts-demo
    spec:
      containers:
      - name: rollouts-demo
        image: argoproj/rollouts-demo:blue
        ports:
        - name: http
          containerPort: 8080
        resources:
          requests: { cpu: 5m, memory: 32Mi }
  strategy:
    canary:
      steps:
      - setWeight: 20
      - pause: { duration: 30s }
      - analysis:                      # <-- the gate
          templates:
          - templateName: success-rate
          args:
          - name: service-name
            value: rollouts-demo
      - setWeight: 50
      - pause: { duration: 30s }
      - setWeight: 80
      - pause: { duration: 30s }
Background: watch the whole rollout
strategy.canary.analysis starts a run that lives for the entire rollout and can abort it at any step, not just at a gate. Pair it with a template using count: 0 (continuous). startingStep delays the watch until a given step index, so you don’t judge the version before any traffic reaches it.
  strategy:
    canary:
      analysis:
        templates:
        - templateName: success-rate
        args:
        - name: service-name
          value: rollouts-demo
        startingStep: 2               # don't start analysing until step index 2
      steps:
      - setWeight: 20
      - pause: { duration: 1m }
      - setWeight: 50                  # from here, background analysis is watching
      - pause: { duration: 1m }
      - setWeight: 80
      - pause: { duration: 1m }
Inline and background are complementary, not exclusive: inline gates make discrete promotion decisions (“is 20% healthy enough to earn 50%?”), while background analysis is a continuous safety net that catches a regression that only shows up at higher weight. Many production Rollouts use both.
Inline (steps[].analysis) |
Background (canary.analysis) |
|
|---|---|---|
| Blocks a step? | Yes — the rollout waits at that step until it passes | No — runs in parallel with the steps |
Typical count |
Finite (3–10) so the step can advance |
0 (continuous, runs the whole rollout) |
| Can abort at | That step only | Any point during the rollout |
startingStep |
n/a | Delays when the watch begins |
| Best for | A hard gate between weight increases | A continuous safety net for the full canary |
Blue-green: pre- and post-promotion
For blue-green, the two hooks bracket the cutover. prePromotionAnalysis runs against the preview Service before flipping traffic; postPromotionAnalysis runs against the active Service after the flip and can roll the cutover back.
  strategy:
    blueGreen:
      activeService: rollouts-demo-active
      previewService: rollouts-demo-preview
      autoPromotionEnabled: false
      prePromotionAnalysis:            # gate BEFORE traffic cutover
        templates:
        - templateName: smoke-tests
        args:
        - name: service-name
          value: rollouts-demo-preview.demo.svc.cluster.local
      postPromotionAnalysis:           # verify AFTER cutover; revert if bad
        templates:
        - templateName: success-rate
        args:
        - name: service-name
          value: rollouts-demo-active.demo.svc.cluster.local
Passing args at use-time, including the canary’s own hash
Notice the args under each analysis reference — that’s where the caller fills in the template’s declared arguments. Beyond static values, valueFrom can inject dynamic facts about the rollout itself, which is how you scope a query to only the new pods:
| Arg source | Syntax | Gives you |
|---|---|---|
| Static value | value: rollouts-demo |
A literal |
| Canary pod hash | valueFrom: { podTemplateHashValue: Latest } |
The new ReplicaSet’s rollouts-pod-template-hash |
| Stable pod hash | valueFrom: { podTemplateHashValue: Stable } |
The stable ReplicaSet’s hash |
| A field on the Rollout | valueFrom: { fieldRef: { fieldPath: metadata.labels['region'] } } |
Any label/field, e.g. region for a per-region query |
        args:
        - name: service-name
          value: rollouts-demo
        - name: canary-hash
          valueFrom:
            podTemplateHashValue: Latest     # measure ONLY the new pods
Then your PromQL filters on that hash — ...{rollouts_pod_template_hash="{{args.canary-hash}}"}... — so the success rate reflects the canary alone, not a blend of canary and stable that hides the regression. (This assumes your metrics carry the pod-template-hash as a label, e.g. via kube-state-metrics or pod relabeling; without traffic routing that splits canary and stable, scoping the query is the only way to isolate the new version’s health.)
Automatic rollback: the payoff
Everything so far exists to make one sentence true: when analysis fails, you do nothing and traffic returns to the last good version. Here is exactly what the controller does the moment an inline or background AnalysisRun reaches Failed (or Error):
- It sets the Rollout’s
status.abort: trueand stampsstatus.abortedAt. - It scales the stable ReplicaSet back to full and the canary to zero — traffic snaps back to the known-good version, immediately, because stable was never torn down.
- The Rollout’s phase becomes
Degradedwith a message naming the metric that failed. - It stays aborted. It does not thrash — it won’t retry the bad revision on its own.
To move forward from an aborted rollout you have two levers. Push a new image (a fix), and the new revision clears the abort and starts a fresh canary. Or, if you believe the abort was a fluke (a flaky metric, a transient Prometheus outage), retry the same revision:
# Re-run the aborted rollout from step 0 (same revision)
kubectl argo rollouts retry rollout rollouts-demo -n demo

# Manually abort a rollout yourself (e.g. you spotted trouble first)
kubectl argo rollouts abort rollouts-demo -n demo

# Manually promote past the current step / to full
kubectl argo rollouts promote rollouts-demo -n demo
The metric that matters — tie the gate to an SLO
A rollback system is only as trustworthy as the metric it watches. Gate on user-facing SLIs, not on infrastructure vanity metrics. CPU being high doesn’t mean users are unhappy; a rising 5xx rate does. The three that belong in almost every gate:
| SLI | What it protects | PromQL shape | Condition |
|---|---|---|---|
| Success rate | Availability — are requests succeeding? | sum(rate(reqs{code!~"5.."}[w])) / sum(rate(reqs[w])) |
result[0] >= 0.99 |
| p95/p99 latency | Speed — is it fast enough? | histogram_quantile(0.95, sum(rate(bucket[w])) by (le)) |
result[0] <= 0.3 (seconds) |
| Error budget burn | The SLO itself — burning too fast? | error-rate ÷ (1 − SLO target) over a window | failureCondition: result[0] > 14.4 (fast burn) |
The error-budget framing is the SRE-grade version: instead of a static “95% is fine,” you gate on how fast the new version is spending this month’s allowed downtime. A fast-burn condition (e.g. burn rate > 14.4× over an hour, the multiwindow-multiburn convention) aborts a version that would exhaust the budget in hours, even if its instantaneous success rate still looks “okay-ish.” If your org runs formal SLOs, gate the canary on burn rate and the promotion decision and the reliability target become the same number.
Best practices
Analysis is powerful enough to hurt you if you deploy it aggressively on day one. The path that works:
| Practice | Why | How |
|---|---|---|
| Start observe-only | Learn what your metric does during a real rollout before it can abort anything | Set a generous failureLimit (or a permissive condition) so the run reports but rarely fails; watch a few deploys, then tighten |
| Warm up before judging | Cold pods produce noise metrics | Always set initialDelay (≥ 30s, often more) |
| Match interval to metric freshness | Sampling faster than the data updates just re-reads stale numbers | interval ≥ scrape/aggregation window |
| Tolerate blips | Real metrics jitter; failureLimit: 0 is hair-trigger |
count several measurements, failureLimit 2–3 |
| Avoid flaky metrics | A gate on a noisy signal aborts good deploys and erodes trust | Prefer smooth rate/ratio SLIs; widen rate windows; don’t gate on raw single-request latency |
| Guarantee traffic | The no-data trap aborts quiet-hour deploys | Run a load generator against the canary during analysis |
| Scope to the canary | A blended canary+stable metric hides the regression | Pass podTemplateHashValue: Latest and filter the query, or measure a canary-only Service |
| Gate on SLIs, not vanity | Users feel errors and latency, not CPU | Success rate, latency percentile, error-budget burn |
| Use ClusterAnalysisTemplates for standards | One definition of “healthy” beats fifty copies | Platform-owned ClusterAnalysisTemplates, apps pass only args |
| Page on Failed, not just abort | The rollback is silent by design; someone should still know | Wire an alert on AnalysisRun Failed (see notifications) |
The last one deserves a pointer: the auto-abort is deliberately quiet — that’s the feature — but a version that rolled itself back is still a signal a human should see. Route it with Argo CD Notifications: Slack, Teams & Webhooks so a failed analysis posts to the channel that owns the service. And if your canary uses real traffic shifting (not just replica-weighting) to route that 20%, the mechanics are in Rollouts Traffic Management: Istio, NGINX, ALB & Gateway API — analysis and traffic routing are the two halves of a real canary.
Hands-on lab
You’ll build a metric-gated canary end to end on a free local cluster, then watch a healthy version promote and a bad version auto-abort and revert to stable. Everything runs on kind — no cloud, no bill. The two rollout outcomes are shown as representative output (this page has no live cluster), but every manifest is real and applies cleanly, and the states/fields are exactly what you’ll see.
⚠️ Nothing in this lab bills. It is entirely local (kind + in-cluster Prometheus). The cloud-managed-Prometheus variants from the providers section would incur cost (AMP query units, Azure Monitor ingestion) — don’t point this lab at them.
Step 1 — Cluster, controller, and the kubectl plugin
# A throwaway local cluster
kind create cluster --name analysis-lab

# Install the Argo Rollouts controller
kubectl create namespace argo-rollouts
kubectl apply -n argo-rollouts \
  -f https://github.com/argoproj/argo-rollouts/releases/latest/download/install.yaml

# Install the kubectl plugin (macOS/Linux via krew, or grab the binary)
kubectl krew install argo-rollouts
kubectl argo rollouts version
# kubectl-argo-rollouts: v1.7.x
What just happened: you have the controller that reconciles Rollout and AnalysisRun objects, plus the kubectl argo rollouts plugin that renders them far more readably than raw kubectl get.
Step 2 — A minimal Prometheus
Install a small Prometheus (the community chart is fine; kube-prometheus-stack works too). The only requirement is that it scrapes our demo app’s /metrics.
helm repo add prometheus-community https://prometheus-community.github.io/helm-charts
helm install prom prometheus-community/prometheus \
  --namespace monitoring --create-namespace
# Its in-cluster address will be:
#   http://prom-prometheus-server.monitoring.svc.cluster.local
What just happened: you now have a metric store the AnalysisRun can query. In a real cluster this is your existing Prometheus; here it’s a throwaway.
Step 3 — The AnalysisTemplate
Save and apply the success-rate template. Note the guarded, canary-tolerant settings: a warm-up, five measurements, and room for two blips.
# analysis-template.yaml
apiVersion: argoproj.io/v1alpha1
kind: AnalysisTemplate
metadata:
  name: success-rate
  namespace: demo
spec:
  args:
  - name: service-name
  - name: prometheus-address
    value: http://prom-prometheus-server.monitoring.svc.cluster.local
  metrics:
  - name: success-rate
    interval: 20s
    count: 5
    initialDelay: 30s
    successCondition: result[0] >= 0.95
    failureLimit: 2
    provider:
      prometheus:
        address: "{{args.prometheus-address}}"
        timeout: 15
        query: |
          sum(rate(
            http_requests_total{app="{{args.service-name}}", code!~"5.."}[1m]
          ))
          /
          sum(rate(
            http_requests_total{app="{{args.service-name}}"}[1m]
          ))
kubectl create namespace demo
kubectl apply -f analysis-template.yaml
What just happened: the definition of “healthy” for this service now lives in the cluster (and, in real life, in Git). It measures success rate every 20s, five times, after a 30s warm-up, and fails only if three of five readings drop below 95%.
Step 4 — The Rollout that references it, plus traffic
# rollout.yaml
apiVersion: argoproj.io/v1alpha1
kind: Rollout
metadata:
  name: rollouts-demo
  namespace: demo
spec:
  replicas: 5
  revisionHistoryLimit: 3
  selector:
    matchLabels:
      app: rollouts-demo
  template:
    metadata:
      labels:
        app: rollouts-demo
      annotations:
        prometheus.io/scrape: "true"     # let the community Prometheus scrape it
        prometheus.io/port: "8080"
    spec:
      containers:
      - name: rollouts-demo
        image: argoproj/rollouts-demo:blue
        ports:
        - name: http
          containerPort: 8080
        resources:
          requests: { cpu: 5m, memory: 32Mi }
  strategy:
    canary:
      steps:
      - setWeight: 20
      - pause: { duration: 20s }
      - analysis:
          templates:
          - templateName: success-rate
          args:
          - name: service-name
            value: rollouts-demo
      - setWeight: 60
      - pause: { duration: 20s }
      - setWeight: 100
---
apiVersion: v1
kind: Service
metadata:
  name: rollouts-demo
  namespace: demo
spec:
  selector:
    app: rollouts-demo
  ports:
  - port: 80
    targetPort: 8080
kubectl apply -f rollout.yaml
# Generate steady traffic so the query always has data (dodges the no-data trap):
kubectl -n demo run loadgen --image=busybox --restart=Never -- \
  /bin/sh -c 'while true; do wget -q -O- http://rollouts-demo/ >/dev/null 2>&1; done'
What just happened: the initial revision comes up as stable, the Service gives the loadgen something to hit, and steady traffic keeps the success-rate query populated. The gate sits at step 3. (The PromQL here assumes your app exports http_requests_total{app,code}; adapt the metric name in the template to whatever your workload actually exposes — the mechanism is identical regardless of the metric’s name.)
Step 5 — A healthy update (analysis passes → promotes)
Trigger a canary by changing the image to another good build, then watch:
kubectl argo rollouts set image rollouts-demo \
  rollouts-demo=argoproj/rollouts-demo:green -n demo

kubectl argo rollouts get rollout rollouts-demo -n demo --watch
Representative output while the gate is evaluating, then after it passes:
Name:            rollouts-demo
Namespace:       demo
Status:          ॥ Paused
Message:         CanaryPauseStep
Strategy:        Canary
  Step:          3/6
  SetWeight:     20
  ActualWeight:  20
Images:          argoproj/rollouts-demo:blue (stable)
                 argoproj/rollouts-demo:green (canary)

NAME                                        KIND         STATUS        AGE  INFO
⟳ rollouts-demo                             Rollout      ॥ Paused      6m
├──# revision:2
│  ├──⧉ rollouts-demo-687d76d795            ReplicaSet   ✔ Healthy     40s  canary
│  │  └──□ rollouts-demo-687d76d795-abc     Pod          ✔ Running     40s  ready:1/1
│  └──α rollouts-demo-687d76d795-2          AnalysisRun  ◌ Running     20s  ✔ 2
└──# revision:1
   └──⧉ rollouts-demo-6cf78c96b5            ReplicaSet   ✔ Healthy     6m   stable
The AnalysisRun line (α) shows ◌ Running ✔ 2 — two successful measurements so far. Once it reaches five successes, the run flips to ✔ Successful, the gate opens, and the rollout walks the remaining steps to setWeight: 100, at which point revision 2 becomes stable:
Status:          ✔ Healthy
  Step:          6/6
  SetWeight:     100
Images:          argoproj/rollouts-demo:green (stable)
   └──α rollouts-demo-687d76d795-2          AnalysisRun  ✔ Successful  3m   ✔ 5
What just happened: nobody watched Grafana. The canary measured itself five times, cleared 95% every time, and promoted on its own.
Step 6 — A bad update (analysis Failed → auto-abort → revert to stable)
Now ship a “bad” version — one that returns 5xx. The rollouts-demo app has a built-in error slider in its web UI you can crank up to make the new pods return errors; in your own service this is simply a build with a regression. We change the image tag to trigger a fresh canary revision, then drive its error rate up. The success-rate query collapses below 0.95, three of five readings fail, and the run fails.
# New tag = new revision = new canary; the ':red' tag is just a distinct build to roll out
kubectl argo rollouts set image rollouts-demo \
  rollouts-demo=argoproj/rollouts-demo:red -n demo
# ...then raise the error rate on the canary pods (demo UI slider, or deploy a genuinely bad build)

kubectl argo rollouts get rollout rollouts-demo -n demo --watch
Representative output as the gate fails:
Name:            rollouts-demo
Status:          ✖ Degraded
Message:         RolloutAborted: Rollout aborted update to revision 3: metric "success-rate" assessed Failed: failed (3) > failureLimit (2)
Strategy:        Canary
  Step:          3/6
  ActualWeight:  0
Images:          argoproj/rollouts-demo:green (stable)
                 argoproj/rollouts-demo:red   (canary, scaled down)

NAME                                        KIND         STATUS        AGE  INFO
⟳ rollouts-demo                             Rollout      ✖ Degraded    9m
├──# revision:3
│  ├──⧉ rollouts-demo-7c9fbb6d84            ReplicaSet   •             30s  canary
│  └──α rollouts-demo-7c9fbb6d84-3          AnalysisRun  ✖ Failed      25s  ✖ 3
└──# revision:2
   └──⧉ rollouts-demo-6b5c8d7f9c            ReplicaSet   ✔ Healthy     6m   stable
Inspect the run to see the receipt:
kubectl -n demo get analysisrun rollouts-demo-7c9fbb6d84-3 \
  -o jsonpath='{.status.phase} {.status.metricResults[0].failed}{"\n"}'
# Failed 3

kubectl -n demo describe analysisrun rollouts-demo-7c9fbb6d84-3 | grep -A2 Message
# Message: metric "success-rate" assessed Failed:
#          failed (3) > failureLimit (2)
What just happened — the payoff: three of five measurements came back under 95%, the run hit Failed, and the controller aborted the rollout and scaled the bad canary to zero — traffic is entirely back on the green stable version. ActualWeight: 0, revision 3 canary scaled down, revision 2 still Healthy and serving. No human touched it. To move on you’d set image to a fix (new revision) or retry if you thought the metric lied.
Step 7 — Teardown
kubectl -n demo delete pod loadgen --ignore-not-found
kind delete cluster --name analysis-lab
# One command removes the cluster, the controller, Prometheus, and everything above.
Common mistakes and troubleshooting
| Symptom | Likely cause | Fix |
|---|---|---|
AnalysisRun stuck Inconclusive / always inconclusive |
No data (quiet hours), still in initialDelay, or you set both conditions and results land in the dead-band |
Guarantee traffic (load gen); confirm the query returns data in Prometheus directly; widen the band or set only successCondition |
| Good deploy aborts immediately | failureLimit: 0 (default) is hair-trigger; one blip fails the run |
Raise failureLimit (2–3) over a count of several; add initialDelay for warm-up |
successCondition never true even when app is fine |
Wrong result shape — query returns a vector of many series, or you compared result (array) instead of result[0] (scalar) |
Run the query in Prometheus; collapse it to one series with sum(...); index with result[0] |
Run phase Error, message “connection refused”/timeout |
provider.prometheus.address wrong, Prometheus unreachable from the argo-rollouts namespace, or timeout too low |
Fix the in-cluster DNS address; test with a debug pod wget; raise timeout |
Scrape flaps → run Error and aborts |
Transient provider errors eating consecutiveErrorLimit (default 4) |
Stabilise scraping; raise consecutiveErrorLimit if flaps are expected; distinguish Error (can’t measure) from Failed (bad app) |
| Bad version promotes anyway (no rollback) | The Rollout never references the template — analysis block missing or misplaced |
Add steps[].analysis (inline) or canary.analysis (background); kubectl get analysisrun should show a run during the canary |
{{args.service-name}} appears literally in the query |
Arg not templated: missing at use-time, or a typo in the arg name | Pass every declared arg in the Rollout’s analysis.args; names must match exactly |
| Run measures a blend, regression hidden | Query matches both canary and stable pods | Scope with podTemplateHashValue: Latest + a hash label filter, or measure a canary-only Service |
| Analysis reads the same stale number repeatedly | interval shorter than the metric’s aggregation/scrape window |
Set interval ≥ the rate window / scrape interval |
Cloud query returns 403/Unauthenticated |
The argo-rollouts controller SA lacks read permission on the managed metric store |
Grant IRSA/Pod Identity (AWS), Entra Workload Identity (Azure), or GKE Workload Identity to the controller SA with the reader role |
| Background analysis “confusingly never gates a step” | Background runs alongside steps; it doesn’t block a step like inline does | Use inline steps[].analysis when you want a hard gate between weights; background is a parallel safety net |
Three gotchas cost the most hours:
1. Confusing Failed with Error. Both abort, so people treat them the same and go hunting for an application bug — when half the time the app was fine and Prometheus was the problem. Failed means the metric cleared the failure bar (real regression). Error means the controller couldn’t get a measurement (unreachable provider, timeout, bad auth). Always read status.metricResults[].phase and the message. If it’s Error, fix your observability plumbing, not your code.
2. The no-data trap, again. It is the single most common reason a healthy deploy aborts. A ratio query with no traffic returns empty/NaN, which becomes Error or Failed, and your good canary rolls back at 3 a.m. The instinct to “just default no-data to pass” (default(result[0], 1)) is worse than the disease — now a broken build with no traffic promotes itself. Guarantee traffic during analysis; if you must default, default to fail-safe and raise your tolerance.
3. Forgetting the reference. The most anticlimactic failure: you wrote a beautiful AnalysisTemplate, watched it apply cleanly, and shipped a bad version that promoted straight to 100% — because the Rollout never mentioned the template. An AnalysisTemplate on its own does nothing. Prove the wiring on every new Rollout: during a canary, kubectl -n <ns> get analysisrun must show a run. No run, no gate, no protection.
Cheat-sheet
AnalysisTemplate metric fields
| Field | What it does |
|---|---|
metrics[].name |
Identifier for the measurement |
interval |
How often to measure (30s, 2m) |
count |
How many measurements (0 = continuous, for background) |
initialDelay |
Warm-up before the first measurement |
successCondition |
Expr true → measurement Successful |
failureCondition |
Expr true → measurement Failed |
failureLimit |
Failed measurements tolerated (default 0) |
inconclusiveLimit |
Inconclusive measurements tolerated (default 0) |
consecutiveErrorLimit |
Consecutive provider errors tolerated (default 4) |
consecutiveSuccessLimit |
Consecutive successes to pass early (1.8+) |
args[] |
Declared inputs; value, valueFrom.secretKeyRef, or caller-supplied |
provider |
The metric source (one of twelve) |
Metric providers (pick one per metric)
| Key | Source | Key | Source |
|---|---|---|---|
prometheus |
PromQL query | cloudWatch |
AWS CloudWatch |
datadog |
Datadog query | wavefront |
Wavefront |
newRelic |
NRQL | graphite |
Graphite |
web |
HTTP + jsonPath | influxdb |
Flux |
job |
Kubernetes Job (exit 0 = pass) | skywalking |
SkyWalking |
kayenta |
Spinnaker Kayenta ACA | plugin |
Custom Go plugin |
PromQL patterns for gates (collapse to one number, use result[0])
| Signal | Query |
|---|---|
| Success rate | sum(rate(http_requests_total{app="X",code!~"5.."}[2m])) / sum(rate(http_requests_total{app="X"}[2m])) |
| Error rate | sum(rate(http_requests_total{app="X",code=~"5.."}[2m])) / sum(rate(http_requests_total{app="X"}[2m])) |
| p95 latency (s) | histogram_quantile(0.95, sum(rate(http_request_duration_seconds_bucket{app="X"}[5m])) by (le)) |
| Saturation | avg(rate(container_cpu_usage_seconds_total{pod=~"X-.*"}[5m])) |
kubectl argo rollouts commands
| Command | What it does |
|---|---|
get rollout <n> --watch |
Live tree of the rollout + its AnalysisRuns |
status <n> |
Wait for / print the rollout status |
promote <n> |
Advance past the current step (or --full to skip all) |
abort <n> |
Manually abort → revert to stable |
retry rollout <n> |
Re-run an aborted rollout from step 0 |
set image <n> c=img |
Trigger a new canary |
kubectl get analysisrun |
List the run instances |
kubectl describe analysisrun <n> |
Every measurement, value, and the failure message |
Interview and exam questions
Q: What is the difference between an AnalysisTemplate and an AnalysisRun?
A: The AnalysisTemplate (or ClusterAnalysisTemplate) is the reusable definition — which metric to query, how often, and the pass/fail condition. The AnalysisRun is the instance the controller creates when analysis actually runs during a rollout; it records every measurement and drives to a terminal phase (Successful, Failed, Error, Inconclusive). Template is the class; run is the object.
Q: A canary’s inline analysis reaches Failed. Walk through what happens next.
A: The controller sets status.abort: true on the Rollout, scales the stable ReplicaSet back to full and the canary to zero (traffic returns to the known-good version instantly, because stable was never removed), and marks the Rollout Degraded with a message naming the failed metric. It stays aborted — no auto-retry. You move forward by pushing a fixed image (new revision) or kubectl argo rollouts retry rollout (same revision).
Q: Explain failureLimit vs consecutiveErrorLimit. Why are they separate?
A: failureLimit budgets Failed measurements — the app genuinely missed the SLO (query returned a bad number). consecutiveErrorLimit budgets consecutive provider Errors — the controller couldn’t get a measurement at all (Prometheus unreachable, timeout, bad auth). They’re separate because “my app is bad” and “I can’t measure my app” are different problems: one is your code, the other is your observability plumbing, and you want different tolerances for each.
Q: Your success-rate condition is result[0] >= 0.95. A deploy during a quiet hour aborts even though the app is fine. Why, and how do you fix it?
A: The no-data trap. With almost no traffic, the ratio query returns empty or NaN; result[0] then errors (an Error measurement) or the comparison is false (a Failed measurement), so a healthy deploy aborts. Fix by guaranteeing traffic during analysis (a load generator against the canary), widening the rate window, or guarding with a fail-safe default — never default no-data to “pass,” which would let a broken low-traffic build promote.
Q: When would you use background analysis over inline (per-step) analysis?
A: Inline analysis is a hard gate at a specific step — the rollout blocks until it passes, good for “prove 20% is healthy before earning 50%.” Background analysis (strategy.canary.analysis, usually count: 0) runs continuously for the whole rollout and can abort at any point, catching a regression that only appears at higher weight. They’re complementary; many Rollouts use inline gates plus a background safety net.
Q: How do you make an analysis measure only the new (canary) pods rather than a blend of canary and stable?
A: Pass the canary’s pod-template-hash as an arg with valueFrom.podTemplateHashValue: Latest, then filter the PromQL on that hash label (rollouts_pod_template_hash="{{args.canary-hash}}"). Alternatively, when using traffic routing, point the query at a canary-only Service. A blended metric dilutes the canary’s errors with stable’s health and can hide the regression.
Q: What does count: 0 mean in a metric, and where is it appropriate?
A: count: 0 means measure continuously (not zero times). It’s used for background analysis, which should keep watching for the entire duration of the rollout rather than finishing after a fixed number of measurements. Inline gates, by contrast, use a finite count so the run completes and the step advances.
Q: Which metric providers exist, and how do you run a check that isn’t a metric query at all?
A: Twelve built-ins: prometheus, datadog, newRelic, cloudWatch, wavefront, graphite, influxdb, skywalking, kayenta, web, job, and plugin. There is no generic “Kubernetes” provider — to run a check (integration test, smoke test, synthetic probe) you use the job provider, which runs a Kubernetes Job and treats exit code 0 as success. For anything custom, plugin loads a metric plugin you supply.
Q (multi-cloud): You point analysis at Amazon Managed Prometheus on EKS and every run is Error with 403. What’s wrong?
A: The identity making the query — the argo-rollouts controller ServiceAccount — lacks permission on the AMP workspace. AMP requires SigV4-signed requests; configure provider.prometheus.authentication.sigv4 with the region and a role ARN, and give the controller SA that role via IRSA or EKS Pod Identity with aps:QueryMetrics. The equivalent on AKS is Entra Workload Identity + oauth2 to the Azure Monitor endpoint; on GKE, Workload Identity to the managed-Prometheus frontend.
Q: How do you introduce analysis to a nervous team without risking aborts on day one?
A: Start observe-only: a permissive condition or a high failureLimit so the AnalysisRun records measurements but rarely fails. Watch several real rollouts to learn how the metric behaves (warm-up noise, quiet-hour data gaps), then tighten the condition and lower the tolerance once you trust it. It turns analysis into a monitoring dashboard first and a gate second.
Q: You set both successCondition and failureCondition. What happens when a measurement satisfies neither?
A: It’s Inconclusive. If inconclusiveLimit is exceeded, the run is Inconclusive and the Rollout pauses for a human decision rather than promoting or aborting. Using both conditions deliberately creates a dead-band — a “not confident enough to auto-decide” zone — which is exactly when you want a person in the loop instead of an automatic promote or rollback.
Q: Why gate on error-budget burn rate instead of a static success-rate threshold? A: A static “95%” is disconnected from your reliability target. Burn rate expresses how fast the new version is spending the month’s allowed error budget; a fast-burn condition aborts a version that would exhaust the budget in hours even if its instantaneous success rate looks marginally acceptable. It makes the promotion decision and the SLO the same number, which is the SRE-grade way to gate.
Key takeaways
- Analysis removes the human from the staring, not the judgement. You still define “healthy” as a condition in Git; the controller becomes the sensor and the switch, on every rollout, forever.
- The loop is observe → decide → act: an
AnalysisRunmeasures a metriccounttimes atinterval, checks each result againstsuccessCondition/failureCondition, and tolerates noise up tofailureLimitbefore it decides. FailedandErrorboth abort but mean opposite things — a genuinely bad app vs. an unmeasurable one. Read the run’s phase and message before you debug the wrong layer.- The payoff is automatic and safe: a failed run sets
abort, scales the canary to zero, and returns all traffic to the still-running stable ReplicaSet — no page, no click, no rebuild. - Wire it deliberately: inline
steps[].analysisis a hard gate between weights; backgroundcanary.analysisis a continuous safety net; blue-green usesprePromotionAnalysis/postPromotionAnalysis. An unreferenced template does nothing. - Beware the no-data trap: low-traffic ratio queries return empty/NaN and abort good deploys. Guarantee traffic, and never default no-data to “pass.”
- Gate on user-facing SLIs — success rate, latency percentile, error-budget burn — not on CPU or other vanity metrics, and scope the query to the canary so its errors aren’t diluted by stable.
- The mechanics are cloud-neutral; only the metric-store auth is a cloud edge. Grant the
argo-rolloutscontroller SA read access via IRSA/Pod Identity (EKS), Entra Workload Identity (AKS), or GKE Workload Identity — the same template runs on all three.