Open the Argo CD UI for any application and you see two badges side by side: one says something like Synced or OutOfSync, the other says Healthy, Progressing, or Degraded. Almost every beginner reads them as one blurry signal — “green good, yellow bad” — and that single misconception is the root of more wasted Argo CD debugging than anything else in the tool.
They are two completely independent questions. One is about Git. The other is about your workload. You can be Synced and Degraded (Argo CD deployed exactly what you asked, and your app is crash-looping). You can be OutOfSync and Healthy (the app is running fine, but someone hand-edited the cluster). Reading one as if it were the other sends you debugging the wrong half of the system every time.
This lesson pulls those two axes apart and keeps them apart. Once you can look at any app and instantly say “sync is the diff against Git, health is whether the resources work,” the rest of Argo CD — and every troubleshooting lesson after this one — falls into place. It is the single most important conceptual distinction in the whole tool, so we go slowly and prove every claim on a real cluster in the lab.
Why this matters
Argo CD is a reconciliation engine. It takes a desired state you wrote in Git, looks at the live state in a Kubernetes cluster, and works to make them equal. To do that job it has to continuously answer one obvious question: are they equal right now? That question — and only that question — is what the sync status reports. Synced means the live cluster matches what Git says; OutOfSync means it doesn’t. Nothing more.
But “the cluster matches Git” is not the same as “the application works.” Git can contain a manifest that references an image tag that doesn’t exist. Argo CD will faithfully apply it — cluster now matches Git, so it reports Synced — and the pods will sit in ImagePullBackOff forever. To catch that, Argo CD asks a second, separate question: are the live resources actually healthy? That is the health status, and it is computed by inspecting each resource’s own live state, not by comparing anything to Git.
Here is where the confusion costs real hours. A beginner sees a red or yellow badge, assumes “Argo CD is broken,” and starts poking at repository credentials and sync policies — when the actual problem is a typo in their own image tag that has nothing to do with Argo CD. Or the reverse: they see Synced in big green letters, declare victory, and never notice the app has been Degraded the whole time. The fix in both cases is to read the two axes separately, which is exactly what everything below teaches.
Two axes. Say it out loud before every debugging session: sync = does live match Git? · health = do the live resources work? If you can name which axis is red before you touch anything, you have already cut the problem in half.
Two axes, not one: the mental model
Picture a 2×2 grid. Along one axis runs sync status — a comparison between the desired state rendered from Git and the observed state in the cluster. Along the other axis runs health status — an assessment of whether the live resources are functioning. They are orthogonal: knowing the value of one tells you nothing about the value of the other. Every one of the four corners is a real, common situation you will meet, and each one demands a different response from you.
The first table to burn into memory is simply the contrast between the two axes:
| Sync status | Health status | |
|---|---|---|
| The question it answers | Does the live cluster match the desired state in Git? | Are the live resources actually working? |
| What it compares | Rendered manifests (Git) vs live objects (cluster) | Each resource’s own live .status against a per-kind rule |
| Possible values | Synced, OutOfSync, Unknown |
Healthy, Progressing, Degraded, Suspended, Missing, Unknown |
| Changes when… | You commit to Git, or someone edits the live cluster | Pods crash, images fail to pull, load balancers get an address |
| Who “fixes” a bad value | Sync the app (or self-heal) to re-apply Git | Fix your workload — image, config, readiness, resources |
| Argo CD’s job here | Detect the diff and, if told to, close it | Report the resource’s condition; it does not fix your app |
The crucial reading of that last row: when health is bad, Argo CD is usually working perfectly. Its job on the health axis is to report, honestly, that your resources are unhappy. It will not rewrite your Deployment to make it healthy — that’s your code, your config, your problem. On the sync axis it can act (re-applying Git), but on the health axis it is a thermometer, not a doctor.
Now the four combinations — the teaching payload of the entire lesson:
| Sync | Health | What it means | Where the fix lives |
|---|---|---|---|
| Synced | Healthy | Live matches Git and every resource works. The goal state. | Nowhere — ship it |
| Synced | Degraded | Argo CD applied exactly what Git says, but the app is failing (crash loop, bad image, failing probe). | Your manifest or image, not Argo CD |
| OutOfSync | Healthy | The app runs fine but live differs from Git — drift (a kubectl edit) or a commit not yet synced. |
Sync the app, or revert the drift |
| OutOfSync | Progressing | A sync is in flight: new manifests applied, pods rolling, not settled yet. | Usually nothing — wait for it to converge |
Read the second row again, because it is the one that saves careers: Synced + Degraded means the problem is yours, not Argo CD’s. Argo CD did precisely what you told it — made the cluster match Git. If the result is a broken app, the bug is in what you committed, and the answer is in kubectl logs, not in your repo credentials.
Here is the whole model as one picture. Read it left to right: Git (desired) and the cluster (live) are the two operands; the application-controller compares them to emit the sync verdict and, separately, runs per-kind health checks on the live resources to emit the health verdict; both roll up into the single Application status where the four combinations live.
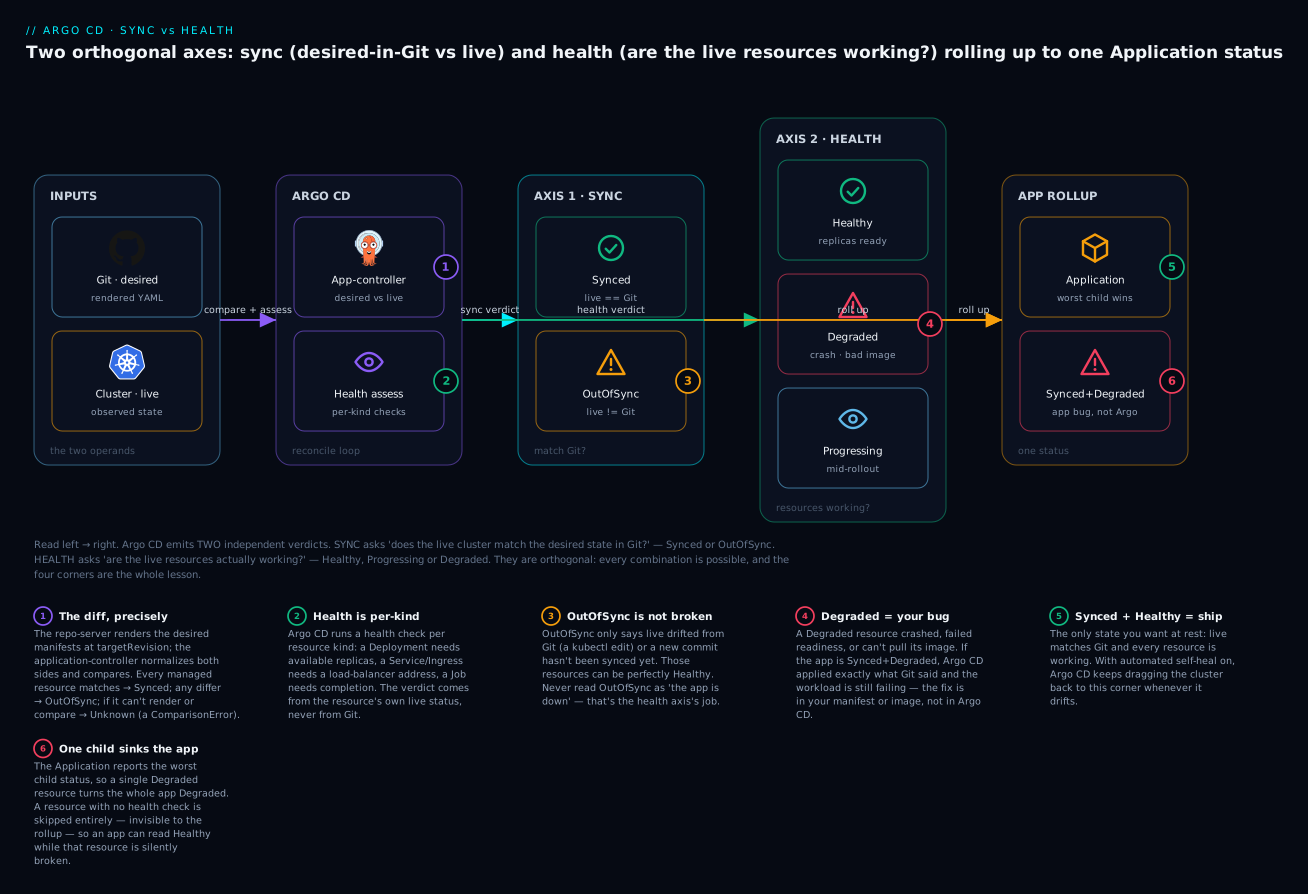
The badges mark the ideas worth tattooing on your brain: the diff is desired-vs-live (1); health is a per-kind assessment of the live resource (2); OutOfSync is drift, not failure (3); Degraded is your app’s bug (4); Synced+Healthy is the only rest state you want (5); and one bad child drags the whole app’s rollup down while a resource with no health check is invisible to it (6). If you understand only this diagram from the lesson, you already read Argo CD better than most people who have run it for a year.
This mental model builds directly on the GitOps principles of a declarative desired state that Argo CD continuously pulls and reconciles, and on the Argo CD architecture where the repo-server renders manifests and the application-controller runs the reconcile loop. If those two ideas are fuzzy, skim them first — the two axes are just the two outputs of that loop.
Sync status: does live match Git?
Sync status is the simpler axis, so we start here. It has exactly three values:
| Sync status | Meaning | Typical trigger |
|---|---|---|
Synced |
The rendered desired state equals the live state for every managed resource. | A sync just completed; nothing has drifted since. |
OutOfSync |
At least one managed resource differs between Git and live. | A new commit not yet synced; a kubectl edit; a resource missing live. |
Unknown |
Argo CD could not run the comparison at all. | A ComparisonError — repo unreachable, chart won’t render, bad path. |
How the diff is actually computed
OutOfSync is not a vague feeling — it is the result of a precise, repeatable pipeline. Understanding the steps tells you exactly where to look when the diff surprises you.
| Stage | What happens | Component |
|---|---|---|
| 1. Render desired | Argo CD renders your source at targetRevision — helm template, kustomize build, or read plain YAML — into a flat set of Kubernetes manifests. |
repo-server |
| 2. Fetch live | It reads the current live objects for those resources from its cluster cache. | application-controller |
| 3. Normalize both sides | Server-defaulted fields, formatting quirks, and anything under ignoreDifferences are neutralized so they don’t show as spurious diffs. |
application-controller |
| 4. Compare | Field by field, normalized desired vs normalized live. | application-controller |
| 5. Verdict | All managed resources equal → Synced; any differ → OutOfSync; couldn’t render/compare → Unknown. |
application-controller |
Two things follow immediately. First, the diff is computed against rendered manifests, not your raw Git files. If you use Helm or Kustomize, Argo CD compares the output of the template engine to the cluster — so a values change that alters the rendered output flips you to OutOfSync, while a comment in a chart does not. Second, the comparison is between the desired state and the live state, so it catches drift in both directions: a change you pushed to Git that hasn’t synced yet, and a change someone made to the live cluster that isn’t in Git.
You can see the exact diff without changing anything:
# Show precisely which fields differ between Git and live (no changes made)
argocd app diff my-app
# (representative output)
===== apps/Deployment my-app/web ======
23c23
<     image: registry.example.com/web:1.4.2   # desired (Git)
---
>     image: registry.example.com/web:1.4.1   # live (cluster)
That is the whole meaning of OutOfSync made concrete: one field, two values, Git on top, cluster below.
Normalization: why “identical” YAML can still be OutOfSync (and vice versa)
Kubernetes rewrites objects the moment you submit them. It adds defaults (imagePullPolicy, terminationGracePeriodSeconds), stamps metadata (creationTimestamp, resourceVersion, uid), and controllers mutate specs (an HPA rewrites replicas, a webhook injects a sidecar, a CA injects a bundle). If Argo CD compared raw, it would scream OutOfSync over fields you never wrote. Normalization is the step that strips this noise so the diff reflects your intent.
| Normalization source | What it neutralizes | Who controls it |
|---|---|---|
| Built-in / known-type | System metadata, status, server defaults, quantity formats (1 vs 1000m) |
Argo CD, automatically |
ignoreDifferences |
Fields you explicitly declare Argo CD should not diff (e.g. HPA-owned replicas) |
You, per app or resource |
| Managed-fields / SSA | With server-side apply, only fields Argo CD “owns” are compared | You, via ServerSideApply=true |
When the diff surprises you, it is nearly always a normalization gap: a controller keeps rewriting a field Argo CD isn’t told to ignore, so the app is perpetually OutOfSync no matter how many times you sync. The fix is a scoped ignoreDifferences for that exact field — covered in depth in a later lesson on diffing and drift; for now, just recognize the pattern: sync succeeds, then instantly flips back to OutOfSync = a controller is mutating a field you need to ignore.
Unknown sync status and ComparisonError
If Argo CD cannot even render or reach your source — the repo is down, the revision doesn’t exist, the Helm chart has a template error, the path is wrong — it can’t compute a diff, so the sync status is Unknown and the app carries a ComparisonError condition with the reason:
argocd app get my-app
# (representative output)
Sync Status:   Unknown
Conditions:    ComparisonError: rpc error: code = Unknown desc = failed to
               generate manifests: helm template . failed: <chart error>
Unknown on the sync axis is never “the app is broken” — it is “Argo CD couldn’t do the comparison.” Read the ComparisonError message; it points at the repo, the revision, or the render, essentially never at your running pods.
Health status: are the resources actually working?
Now the second axis. Health status has six values, and each is computed by looking at the resource’s own live state — never at Git.
| Health status | Meaning | Classic example |
|---|---|---|
Healthy |
The resource is up and doing its job. | A Deployment with all replicas available. |
Progressing |
Not there yet, but still converging — give it time. | A rollout mid-update; a Service waiting on its LB address. |
Degraded |
It failed or gave up. Something is wrong. | CrashLoopBackOff, ImagePullBackOff, ProgressDeadlineExceeded. |
Suspended |
Intentionally paused; not an error. | A CronJob with suspend: true; a paused Argo Rollout. |
Missing |
Declared in Git but not present in the live cluster. | A resource created moments ago, or one that failed to apply. |
Unknown |
Argo CD ran a health check but couldn’t determine a result. | A custom Lua health check that errored. |
Health is computed by per-resource-kind checks
The key insight: health is not one algorithm — it is a different check per resource kind. “Healthy” means something specific to each kind, and Argo CD ships built-in checks (native Go for core workloads, bundled Lua scripts for many popular CRDs) that encode exactly what “working” means for that kind.
| Kind | What “Healthy” requires | What flips it to Degraded / Progressing |
|---|---|---|
| Deployment | availableReplicas meets the desired count and observedGeneration is current |
ProgressDeadlineExceeded condition → Degraded; still rolling → Progressing |
| StatefulSet | readyReplicas == desired, update rollout complete |
Pods not ready → Progressing; stuck past readiness → stays Progressing |
| DaemonSet | numberAvailable == desiredNumberScheduled |
Pods pending on nodes → Progressing |
| ReplicaSet | Available replicas met, no ReplicaFailure |
ReplicaFailure condition → Degraded |
| Pod | Phase Running with ready containers (or Succeeded) |
CrashLoopBackOff / ImagePullBackOff → Degraded; Pending → Progressing |
Service (LoadBalancer) |
.status.loadBalancer.ingress[] has an IP/hostname |
No address assigned yet → Progressing |
| Ingress | .status.loadBalancer.ingress[] populated by the controller |
Controller hasn’t assigned an address → Progressing |
| PersistentVolumeClaim | Phase Bound |
Pending → Progressing; Lost → Degraded |
| Job | Complete condition is true |
Failed condition → Degraded; still running → Progressing |
| HorizontalPodAutoscaler | AbleToScale / ScalingActive conditions true |
Can’t fetch metrics → Degraded |
| CronJob | Scheduling normally | spec.suspend: true → Suspended |
Argo Rollout (argoproj.io) |
Rollout fully promoted and available | Paused at a step → Suspended; analysis failing → Degraded |
Two rows in that table earn special attention because they are the most common source of “why is my sync stuck?”: Service and Ingress of load-balancer type report Healthy only once the cloud has assigned an external address. Until then they are Progressing — which is completely normal for the first minute or two after creation, and is a genuine cloud edge we cover below.
The progressing deadline: when Progressing becomes Degraded
Progressing should be temporary. What stops it from being temporary forever is the workload’s own deadline. A Deployment has spec.progressDeadlineSeconds (default 600s). If it can’t make progress within that window — pods never become ready because the image is bad or the probe never passes — Kubernetes sets the Deployment’s Progressing condition to reason ProgressDeadlineExceeded, and Argo CD’s Deployment health check reads that and reports Degraded.
So the lifecycle of a bad rollout is: Progressing (pods trying to come up) → after progressDeadlineSeconds → Degraded (Kubernetes gave up). This matters for sync ordering: Argo CD’s sync waves apply resources in numbered groups and wait for each wave to become Healthy before starting the next. A resource stuck Progressing past its deadline flips to Degraded and stalls the sync — which is exactly the behavior you want (don’t run the migration Job if the database never came up). Sync waves and hooks get their own later lesson; the takeaway here is that health directly gates how a sync proceeds, so a health problem can masquerade as a “stuck sync.”
Missing and Suspended: the two states beginners misread
Missing is not the same as Degraded. Missing means a resource is declared in Git but does not exist live — Argo CD expected to find it and didn’t. You see it in the seconds after adding a new resource (before it’s created), or when a resource failed to apply, or when it’s queued in a later sync wave that hasn’t run yet. It is often transient; if it persists, something is blocking creation (RBAC, a failed admission webhook, a namespace that doesn’t exist).
Suspended is not an error at all — it is Argo CD correctly reporting that you intentionally paused something. A CronJob with spec.suspend: true and a deliberately paused Argo Rollout both report Suspended. Newcomers see the non-green badge and panic; the right reaction is “yes, I paused that on purpose.”
The app-level rollup: from many resources to one status
An Application usually manages many resources — a Deployment, a Service, an Ingress, a ConfigMap, maybe a Job. Yet the app shows a single sync status and a single health status. How do dozens of resource statuses collapse into one? Two different rollup rules, one per axis.
Sync rollup is simple: if every managed resource is Synced, the app is Synced; if any is OutOfSync, the app is OutOfSync. One drifted ConfigMap makes the whole app OutOfSync.
Health rollup is “worst status wins.” Argo CD ranks the health states from best to worst and reports the worst one present among the resources:
| Rank | Health status | So if the app shows this… |
|---|---|---|
| 1 (best) | Healthy |
…every assessed resource is Healthy |
| 2 | Suspended |
…nothing worse than a paused resource |
| 3 | Progressing |
…at least one resource is still converging |
| 4 | Missing |
…at least one declared resource isn’t live |
| 5 | Degraded |
…at least one resource has failed |
| 6 (worst) | Unknown |
…a health check ran and couldn’t decide |
This is why one bad child sinks the whole app: a single Degraded pod turns the Application Degraded even if forty other resources are perfectly Healthy. When an app shows Degraded, the app-level badge doesn’t tell you which resource — you have to open the resource tree (next section) to find the one dragging it down.
The most dangerous rollup subtlety: a resource with no health check is skipped entirely. If Argo CD has no way to assess a kind (no built-in check, no Lua script), it returns no health opinion for that resource and excludes it from the rollup — it is not counted as Healthy, Degraded, or anything. The app can therefore read Healthy while a critical custom resource is completely broken, because that resource is simply invisible to the health calculation. This is not a bug; it’s the reason the next section exists.
Reconnecting to the four combinations: the rollup is exactly what produces them. Synced + Degraded means all resources match Git (sync rollup all-Synced) but one is failing (health rollup worst-wins landed on Degraded). OutOfSync + Healthy means everything’s working (health all-Healthy) but one resource drifted from Git (sync rollup any-OutOfSync). The two rollups run independently — which is the orthogonality, made mechanical.
Custom health checks: teaching Argo CD about your CRDs
Argo CD knows how to assess a Deployment because someone wrote that check into it. For your CustomResourceDefinition — a Widget, a Database, a vendor operator’s CRD — Argo CD has no idea what “working” means unless you tell it. Out of the box such a resource has no health opinion, so (per the rollup rule above) it’s invisible: the app can report Healthy while your Widget is on fire.
The fix is a custom health check: a small Lua script, configured in the argocd-cm ConfigMap, that reads the resource’s live .status and returns a verdict. Argo CD runs it exactly like a built-in check.
The configuration key follows a strict shape:
Key in argocd-cm data |
Meaning |
|---|---|
resource.customizations.health.<group>_<kind> |
The Lua health check for one CRD. Group and kind are joined by an underscore. |
Example: resource.customizations.health.demo.kloudvin.io_Widget |
Health check for Widget in API group demo.kloudvin.io |
Example: resource.customizations.health.argoproj.io_Rollout |
(This one is already built in — shown for the pattern) |
The Lua script receives the live object as obj and must return a table with a status string and a message:
| Lua field | Allowed / expected values |
|---|---|
hs.status |
"Healthy", "Progressing", "Degraded", "Suspended" |
hs.message |
Any human-readable string shown in argocd app get and the UI |
Here is a complete, real example for a Widget CRD whose controller writes .status.phase:
# argocd-cm ConfigMap (namespace argocd) — health check for a custom resource
apiVersion: v1
kind: ConfigMap
metadata:
  name: argocd-cm
  namespace: argocd
  labels:
    app.kubernetes.io/name: argocd-cm
    app.kubernetes.io/part-of: argocd
data:
  resource.customizations.health.demo.kloudvin.io_Widget: |
    hs = {}
    if obj.status ~= nil and obj.status.phase ~= nil then
      if obj.status.phase == "Ready" then
        hs.status = "Healthy"
        hs.message = "Widget is ready"
        return hs
      end
      if obj.status.phase == "Failed" then
        hs.status = "Degraded"
        hs.message = "Widget failed: " .. (obj.status.reason or "unknown")
        return hs
      end
    end
    hs.status = "Progressing"
    hs.message = "Waiting for widget to become ready"
    return hs
Read the logic top to bottom, because it mirrors how every health check thinks: check for a definitive good state (Ready → Healthy), check for a definitive bad state (Failed → Degraded), and if neither, assume it’s still on its way (Progressing). Never default to Healthy when you can’t tell — default to Progressing, so an unfinished or stuck resource shows honestly instead of falsely green.
A few things that keep this correct in practice:
- The
objtree can be nil at any level. Always guard (obj.status ~= nil and obj.status.phase ~= nil) before indexing, or the script errors and the resource goesUnknown— which is worse than Progressing becauseUnknownis the worst rollup rank. - Argo CD already bundles checks for many popular CRDs (cert-manager, Argo Rollouts, and more) in its
resource_customizationsdirectory, so you only write Lua for kinds it doesn’t already cover. Check before you write. - After editing
argocd-cm, Argo CD picks up the change on the next reconcile; a hard refresh (argocd app get <app> --hard-refresh) forces re-evaluation immediately.
We wire exactly this up, end to end, in the lab — including deliberately breaking the Lua to see the Unknown state.
Reading it all: argocd app get, the resource tree & UI colours
Everything above surfaces in one command. argocd app get prints a header (the app-level rollup) followed by the resource tree — every managed resource with its own per-resource SYNC and HEALTH columns. This is where you go from “the app is Degraded” to “this pod is the reason.”
# The single most useful diagnostic command in Argo CD
argocd app get my-app
# (representative output)
Name:               argocd/my-app
Project:            default
Server:             https://kubernetes.default.svc
Namespace:          demo
Source:
- Repo:             https://github.com/acme/demo.git
  Target:           main
  Path:             manifests
Sync Policy:        Automated
Sync Status:        Synced to main (a1b2c3d)
Health Status:      Degraded

GROUP  KIND        NAMESPACE  NAME      STATUS   HEALTH      MESSAGE
       Service     demo       web       Synced   Healthy     service/web created
apps   Deployment  demo       web       Synced   Degraded    Deployment "web" exceeded its progress deadline
       Pod         demo       web-xyz   Synced   Degraded    Back-off pulling image "web:does-not-exist"
Read it as a drill-down. The header says the app is Synced / Degraded. The tree tells you why: the Service is fine, but the Deployment hit ProgressDeadlineExceeded and the Pod can’t pull its image, so the worst-child rollup landed on Degraded — and the MESSAGE column hands you the exact cause. Yet the whole app is Synced: Git and live match perfectly. This is the Synced + Degraded corner, and the tree proves the fix is your image tag, not Argo CD.
The header fields worth knowing:
| Field | What it tells you |
|---|---|
Sync Status |
The app-level sync rollup, plus the revision synced (Synced to main (a1b2c3d)) |
Health Status |
The app-level health rollup (worst-child-wins) |
Conditions |
Errors like ComparisonError, SyncError — read these first when something’s Unknown |
Per-resource STATUS |
That resource’s own sync status |
Per-resource HEALTH |
That resource’s own health status (blank if Argo CD has no check for the kind) |
Per-resource MESSAGE |
The human-readable reason — usually names the exact problem |
The UI encodes the same two axes as two separate icons, and knowing the colours lets you triage a whole app grid at a glance:
| Status | Axis | UI colour / icon (approx.) |
|---|---|---|
Synced |
sync | Green check |
OutOfSync |
sync | Yellow/amber circle with arrows |
Unknown |
sync | Grey / faded |
Healthy |
health | Green heart |
Progressing |
health | Blue spinner / circle |
Degraded |
health | Red (broken) heart |
Suspended |
health | Grey pause |
Missing |
health | Orange / grey outline |
Unknown |
health | Grey question mark |
Two icons, two axes — always. If the green check (sync) is present but the heart is red (health), that’s Synced+Degraded on sight.
The one genuine cloud edge: Service/Ingress health depends on your cloud’s load balancer
Sync and health computation are otherwise cloud-neutral — the diff and the health rules are identical whether the target is AKS, EKS, or GKE. There is exactly one place a cloud edge leaks into the health axis, and it’s worth covering across all three: a LoadBalancer Service or an Ingress is only Healthy once the cloud has assigned it an external address, and who assigns that address — and how long it takes — differs per cloud.
| Resource | “Healthy” requires | AKS provides it via | EKS provides it via | GKE provides it via |
|---|---|---|---|---|
Service type LoadBalancer |
.status.loadBalancer.ingress[] populated |
Azure cloud-controller-manager → Azure Standard Load Balancer + public IP | in-tree CCM or AWS Load Balancer Controller → NLB | GKE cloud-controller → Google Cloud Network LB |
Ingress |
Controller writes the LB address into .status |
AGIC → Application Gateway, or ingress-nginx → Azure LB | AWS Load Balancer Controller → ALB | GKE Ingress controller → external HTTP(S) LB (GCLB) |
The practical consequence is identical on all three clouds: right after a sync, a load-balancer-backed Service or Ingress sits at Progressing for a few seconds to a couple of minutes while the cloud provisions the address. That is not a bug and not a sync failure — it’s the health check honestly reporting “no address yet.” What differs per cloud is the failure case: if it never resolves, the cause is a missing or misconfigured controller or its cloud identity — AGIC/ingress-nginx and Azure Workload Identity on AKS, the AWS Load Balancer Controller and its IRSA/Pod Identity on EKS, or the GKE Ingress controller and its IAM on GKE. Those install details live in the dedicated AKS/EKS/GKE lessons; here, just recognize the pattern: a Service or Ingress stuck Progressing long after a sync is a cloud load-balancer problem, not an Argo CD problem.
Hands-on lab
Time to watch both axes move independently on a real cluster. This lab assumes a working Argo CD on a local kind/minikube cluster (nothing here bills) and the small demo app from Your First Application. Every step shows the command, a representative result, and a one-line “what just happened.” We deliberately create each state — Synced/Healthy, then OutOfSync, then Degraded, then a CRD’s blind spot — and finish with teardown.
These outputs are representative shapes, not a transcript from your exact cluster — revisions, pod suffixes, and timings will differ. The states and commands are what matter.
Step 0 — Start from a known-good app. Point an Application at a simple manifest directory (a Deployment + Service) and sync it.
# Create and sync a minimal app (adjust repo/path to your own)
argocd app create demo \
  --repo https://github.com/acme/argocd-demo.git \
  --path manifests --dest-server https://kubernetes.default.svc \
  --dest-namespace demo --sync-policy manual
argocd app sync demo
argocd app get demo
# (representative)
Sync Status:    Synced to main (a1b2c3d)
Health Status:  Healthy
What just happened: the baseline. Live matches Git (Synced) and the Deployment’s replicas are available (Healthy). This is the corner you want at rest.
Step 1 — Create drift: OutOfSync while staying Healthy. Hand-edit the live cluster, bypassing Git entirely.
# Change a live label directly — the app keeps running fine
kubectl -n demo label deployment web team=rogue --overwrite
argocd app get demo
# (representative)
Sync Status:    OutOfSync from main (a1b2c3d)
Health Status:  Healthy

GROUP  KIND        NAMESPACE  NAME  STATUS      HEALTH
apps   Deployment  demo       web   OutOfSync   Healthy
What just happened: you changed live state that Git doesn’t know about, so the diff is non-empty → OutOfSync. But the pods are still running perfectly → Healthy. This is the OutOfSync + Healthy corner: drift, not failure. Run argocd app diff demo to see the exact label that differs. Re-sync (argocd app sync demo) to erase the drift and return to Synced.
Step 2 — Ship a broken image: Synced but Progressing → Degraded. Now push a bad change through Git (the GitOps way) and watch health fail while sync succeeds.
# In your Git repo: set the Deployment image to a tag that doesn't exist,
# e.g. image: web:does-not-exist  — commit and push, then:
argocd app sync demo
argocd app get demo
# (representative, moments after sync)
Sync Status:    Synced to main (e5f6g7h)
Health Status:  Progressing

# (representative, after progressDeadlineSeconds ~10 min, or immediately once pods back off)
Sync Status:    Synced to main (e5f6g7h)
Health Status:  Degraded

GROUP  KIND        NAMESPACE  NAME     STATUS   HEALTH      MESSAGE
apps   Deployment  demo       web      Synced   Degraded    exceeded its progress deadline
       Pod         demo       web-...  Synced   Degraded    Back-off pulling image "web:does-not-exist"
What just happened: Argo CD applied exactly what you committed, so Sync = Synced. But the new pods can’t pull the image, so they sit Progressing, then hit the progress deadline and flip to Degraded. This is the career-saving Synced + Degraded corner: Argo CD did its job; the bug is in what you committed. The MESSAGE column names it. Fix the tag in Git, commit, sync — back to Synced/Healthy.
Step 3 — A CRD with no health check: the invisible resource, then a Lua check. Add a custom resource Argo CD doesn’t understand and watch it contribute nothing to health, then teach Argo CD to assess it.
# Add to your Git repo: a tiny CRD (status subresource enabled) + one instance
apiVersion: apiextensions.k8s.io/v1
kind: CustomResourceDefinition
metadata:
  name: widgets.demo.kloudvin.io
spec:
  group: demo.kloudvin.io
  names: { kind: Widget, listKind: WidgetList, plural: widgets, singular: widget }
  scope: Namespaced
  versions:
    - name: v1
      served: true
      storage: true
      subresources: { status: {} }
      schema:
        openAPIV3Schema:
          type: object
          properties:
            spec:   { type: object, properties: { size: { type: string } } }
            status: { type: object, properties: { phase: { type: string }, reason: { type: string } } }
---
apiVersion: demo.kloudvin.io/v1
kind: Widget
metadata:
  name: my-widget
  namespace: demo
spec:
  size: small
argocd app sync demo && argocd app get demo
# (representative) — the Widget row has a blank HEALTH column
GROUP              KIND     NAMESPACE  NAME       STATUS   HEALTH
demo.kloudvin.io   Widget   demo       my-widget  Synced

Health Status:  Healthy        # <-- the app is "Healthy" despite the Widget being unassessed!
What just happened: the Widget is Synced (it exists as Git declares) but has no HEALTH value — Argo CD has no check for this kind, so it forms no opinion and excludes the Widget from the rollup. The app proudly reports Healthy even though you have no idea whether the Widget works. That is the blind spot.
Now add the Lua health check from the section above to argocd-cm and force a re-evaluation:
# Apply the argocd-cm with the Widget health check, then hard-refresh
kubectl apply -f argocd-cm.yaml
argocd app get demo --hard-refresh
# (representative) — the Widget now gets assessed; no controller set .status, so:
GROUP              KIND     NAMESPACE  NAME       STATUS   HEALTH        MESSAGE
demo.kloudvin.io   Widget   demo       my-widget  Synced   Progressing   Waiting for widget to become ready

Health Status:  Progressing    # <-- the Widget now participates in the rollup
What just happened: Argo CD now runs your Lua check. Because nothing has written .status.phase, the script returns Progressing — honest: “I can’t confirm it’s ready.” The Widget is finally visible to health. Simulate its controller by writing the status yourself:
# Pretend the Widget's operator marked it Ready
kubectl -n demo patch widget my-widget --type=merge --subresource=status \
  -p '{"status":{"phase":"Ready"}}'
argocd app get demo --hard-refresh
# (representative)
demo.kloudvin.io  Widget  demo  my-widget  Synced  Healthy   Widget is ready
Health Status:  Healthy
What just happened: the Lua saw phase: Ready and returned Healthy — now a real Healthy, one you can trust. Patch phase to Failed and re-refresh to watch it go Degraded; deliberately break the Lua (index a nil field) and re-refresh to see the genuine Unknown health state. You have now driven every value on both axes.
Teardown.
# Remove the app (and its resources), and revert argocd-cm
argocd app delete demo --cascade
kubectl -n argocd apply -f argocd-cm-original.yaml   # or edit out the Widget key
What just happened: --cascade deletes the managed resources (Deployment, Service, CRD, Widget) along with the Application; reverting argocd-cm removes the custom health check. Your cluster is back to a clean Argo CD.
Common mistakes and troubleshooting
Every row here traces back to conflating the two axes or misreading a rollup. Keep it close during real incidents.
| Symptom | Likely cause | Fix |
|---|---|---|
App is OutOfSync, panic sets in — “the app is down!” |
Reading sync as health. OutOfSync only means live ≠ Git; the app may be perfectly Healthy. | Check the health badge. If Healthy, it’s drift or an un-synced commit — argocd app diff, then sync. |
App is Synced but Degraded |
Argo CD applied Git faithfully; your workload is failing (bad image, crash loop, failing probe). | It’s your bug, not Argo CD’s. Open the resource tree, read MESSAGE, then kubectl logs. |
App stuck Progressing forever |
Readiness never met — bad image, failing probe, or a LoadBalancer Service with no address. |
Find the Progressing child in the tree. After progressDeadlineSeconds a Deployment flips to Degraded, exposing the cause. |
CRD shows blank health; app reads Healthy but the resource is broken |
No health check for that kind → excluded from the rollup (the blind spot). | Add a Lua resource.customizations.health.<group>_<kind> in argocd-cm. |
Health is Unknown on a resource |
A health check ran and errored — usually a Lua script indexing a nil field. | Guard every obj.status access; hard-refresh; read the message for the Lua error. |
Sync status is Unknown with ComparisonError |
Argo CD couldn’t render/reach the source — repo down, bad revision, chart template error. | Read the ComparisonError; fix repo/revision/path/render — not your pods. |
App is perpetually OutOfSync no matter how often you sync |
A controller mutates a field Argo CD isn’t told to ignore (HPA replicas, injected sidecar, CA bundle). |
Add a scoped ignoreDifferences for that exact field (forward-referenced diffing lesson). |
A resource shows Missing and won’t appear |
Declared in Git but blocked from creation — RBAC, failed admission webhook, missing namespace, or a later sync wave. | Check events/Conditions; fix the blocker; confirm CreateNamespace=true or the namespace exists. |
A resource shows Suspended and looks alarming |
It’s intentional — a CronJob with suspend: true or a paused Argo Rollout. |
Nothing to fix. Suspended is Argo CD correctly reporting a deliberate pause. |
App Degraded but every visible resource looks fine |
Worst-child rollup — one unhealthy child (maybe collapsed/among many) is dragging it. | Sort the resource tree by HEALTH; the one non-Healthy child is the cause. |
Three gotchas deserve extra words because they cost the most hours:
1. “The badge is yellow/red, so Argo CD is broken.” Almost never. OutOfSync means you have drift or an un-synced commit; Degraded means your workload is failing. In both cases Argo CD is doing its job — detecting a diff, or honestly reporting an unhealthy resource. Before you touch the application-controller, ask which axis is unhappy and whether that axis is even about Argo CD: the sync axis can implicate it (a ComparisonError is Argo CD’s side), but a Degraded health almost never does.
2. The Synced+Degraded trap. The single most misdiagnosed state. Because the big green Synced is so reassuring, people hunt for the problem anywhere but their own manifest. The discipline: the instant you see Degraded, ignore the sync badge and go straight to the resource tree and kubectl logs/describe. Synced tells you the cause is in Git; the health tree tells you which resource and why.
3. The invisible CRD. A Healthy app is only as trustworthy as its health checks. Custom resources without a check aren’t counted in the rollup, so their app’s Healthy is a partial truth. Wherever you depend on a CRD, write or confirm a health check for it — otherwise you’re watching a green light that can’t see half the room.
Cheat-sheet
Bookmark this. It answers “which axis is which, and how do I read both fast?”
| Command / concept | What it does |
|---|---|
argocd app get <app> |
App-level sync + health rollup and the per-resource tree with STATUS/HEALTH/MESSAGE |
argocd app diff <app> |
Exact field-level diff between rendered Git and live (the meaning of OutOfSync) |
argocd app get <app> --refresh |
Re-run the comparison against the latest Git before reporting |
argocd app get <app> --hard-refresh |
Re-render and re-evaluate health, ignoring caches (use after editing argocd-cm) |
argocd app sync <app> |
Apply Git to the cluster → drives OutOfSync toward Synced |
argocd app wait <app> --health |
Block until the app reaches a Healthy state (great in CI) |
argocd app resources <app> |
List managed resources with their per-resource statuses |
kubectl -n <ns> describe <kind>/<name> |
The Kubernetes-side reason a resource is Degraded/Progressing |
Sync status values:
| Value | One-line meaning |
|---|---|
Synced |
Live matches the desired state in Git |
OutOfSync |
Live differs from Git (drift or un-synced commit) |
Unknown |
Comparison couldn’t run — a ComparisonError |
Health status values:
| Value | One-line meaning |
|---|---|
Healthy |
The resource is working |
Progressing |
Converging, not there yet |
Degraded |
Failed / gave up |
Suspended |
Intentionally paused (not an error) |
Missing |
In Git but not present live |
Unknown |
A health check ran and couldn’t decide |
The four combinations (the whole lesson in four rows):
| Sync | Health | Verdict |
|---|---|---|
| Synced | Healthy | Ship it |
| Synced | Degraded | Your bug — check the manifest/image, not Argo CD |
| OutOfSync | Healthy | Drift or un-synced change — diff, then sync |
| OutOfSync | Progressing | A sync in flight — wait for it to converge |
Custom health check shape (argocd-cm data key): resource.customizations.health.<group>_<kind> → Lua returning hs.status (Healthy/Progressing/Degraded/Suspended) and hs.message.
Interview and exam questions
Q: In one sentence each, what do Argo CD’s sync status and health status mean?
A: Sync status answers “does the live cluster match the desired state rendered from Git?” (Synced/OutOfSync/Unknown); health status answers “are the live resources actually working?” (Healthy/Progressing/Degraded/Suspended/Missing/Unknown). They are independent axes.
Q: An app is Synced but Degraded. Whose problem is it, and where do you look?
A: It’s your problem, not Argo CD’s. Synced means Argo CD applied exactly what Git contains; Degraded means a live resource is failing. Open the resource tree in argocd app get, find the Degraded child, read its MESSAGE, and go to kubectl logs/describe. Common causes: bad image tag, crash loop, failing readiness probe.
Q: How can an app be OutOfSync yet Healthy at the same time?
A: The resources are running fine (Healthy) but live differs from Git (OutOfSync) — typically because someone ran kubectl edit (drift) or because a new commit hasn’t been synced yet (in manual-sync apps). Sync and health measure different things, so this combination is normal.
Q: How does Argo CD compute OutOfSync?
A: The repo-server renders the desired manifests at targetRevision (helm/kustomize/plain YAML); the application-controller fetches live objects, normalizes both sides (stripping system defaults and anything under ignoreDifferences), and compares field by field. If every managed resource matches → Synced; if any differ → OutOfSync; if it can’t render/compare → Unknown.
Q: What does “health is computed by per-resource-kind checks” mean? Give three examples.
A: “Healthy” is defined differently per kind. A Deployment is Healthy when its available replicas meet the desired count; a LoadBalancer Service is Healthy only once .status.loadBalancer.ingress has an address; a Job is Healthy when its Complete condition is true. The verdict comes from each resource’s own live status, never from Git.
Q: Explain the app-level health rollup. Why can one resource turn a 40-resource app Degraded?
A: Health rolls up “worst status wins,” ranked Healthy → Suspended → Progressing → Missing → Degraded → Unknown. The app reports the worst status among its resources, so a single Degraded pod makes the whole app Degraded regardless of how many resources are Healthy. Sync rolls up differently: any OutOfSync resource makes the app OutOfSync.
Q: You add a custom resource and the app still shows Healthy, but you’re not sure the CR works. Why, and what do you do?
A: Argo CD has no health check for that kind, so it forms no opinion and excludes the resource from the rollup — the app looks Healthy because the CR is invisible to the calculation, not because it’s confirmed working. Add a Lua health check under resource.customizations.health.<group>_<kind> in argocd-cm so the CR is actually assessed.
Q: What’s the difference between Missing and Degraded health?
A: Missing means a resource is declared in Git but doesn’t exist live (often transient right after creation, or blocked by RBAC/admission/a pending sync wave). Degraded means a resource exists but has failed (crash loop, exceeded progress deadline, failed Job). Missing = “not there”; Degraded = “there and broken.”
Q: An app sits at Progressing and never becomes Healthy. How do you diagnose it?
A: Open the resource tree and find the Progressing child. Common causes: pods failing readiness (bad image/probe) or a LoadBalancer Service/Ingress waiting on an external address. For Deployments, after spec.progressDeadlineSeconds (default 600s) Kubernetes flags ProgressDeadlineExceeded and Argo CD flips it to Degraded, which surfaces the real reason.
Q: Sync status is Unknown. What happened and where’s the fix?
A: Argo CD couldn’t run the comparison — a ComparisonError. The source is unreachable, the revision doesn’t exist, the path is wrong, or the Helm/Kustomize render failed. Read the ComparisonError in argocd app get; the fix is on the repo/render side, never in your running pods.
Q (scenario): A junior engineer says “Argo CD broke our deploy — it’s showing red.” The app is Synced/Degraded. How do you coach them?
A: Reframe the two axes: Synced proves Argo CD did its job (cluster matches Git), so it didn’t “break” anything. The red is on the health axis — a live resource is failing because of what’s in Git. Walk them to the resource tree, read the MESSAGE, then the pod logs. The fix is in their manifest or image; Argo CD is correctly reporting reality.
Q: A LoadBalancer Service shows Progressing for two minutes after a sync on EKS. Bug or normal? Does it differ on AKS/GKE?
A: Normal. A LoadBalancer Service is Healthy only once the cloud assigns an external address; until then it’s Progressing. The wait exists on all three clouds — the address is provisioned by the Azure cloud-controller/LB on AKS, the NLB via the in-tree CCM or AWS Load Balancer Controller on EKS, and the Google Cloud LB on GKE. It’s only a problem if it never resolves, which points at the LB controller or its cloud identity.
Key takeaways
- Sync status and health status are two orthogonal axes. Sync asks “does live match Git?” (
Synced/OutOfSync/Unknown); health asks “do the live resources work?” (Healthy/Progressing/Degraded/Suspended/Missing/Unknown). Never read one as the other. - OutOfSync is not failure. It means the cluster drifted from Git or a commit hasn’t synced — the resources can be perfectly Healthy. It implicates Git or a drift, not your running app.
- Synced + Degraded is your bug, not Argo CD’s. Argo CD applied exactly what Git contains; a failing app after a clean sync means the problem is in your manifest or image. Go straight to the resource tree and
kubectl logs. - Health is per-resource-kind. “Healthy” means available replicas for a Deployment, an assigned address for a LoadBalancer Service/Ingress, completion for a Job. Built-in checks cover core kinds and many popular CRDs.
- The app rolls up “worst status wins” for health, so one bad child turns the whole app Degraded — and a resource with no health check is skipped entirely, letting an app read Healthy while that resource is silently broken.
- Teach Argo CD your CRDs with a Lua health check under
resource.customizations.health.<group>_<kind>inargocd-cm: read the resource’s.status, returnHealthy/Progressing/Degraded, and default to Progressing when you can’t tell. - Read both axes in
argocd app get: the header is the rollup, the resource tree is the drill-down with per-resource STATUS, HEALTH, and MESSAGE. The MESSAGE column usually names the exact cause. - The computation is cloud-neutral except one edge: a LoadBalancer Service or Ingress is only Healthy once the cloud assigns an address — AKS, EKS, and GKE each provision it differently, so a brief
Progressingafter a sync is normal, and a permanent one is a cloud LB problem.