In a nutshell
If you are new to the Well-Architected Framework, start here. Operational Excellence is the pillar about how you run a system after it is built — not the shape of the architecture, but the team, the procedures, the instruments, and the discipline of getting better every week. The other pillars ask whether the design is secure, reliable, fast, cheap, and sustainable. This one asks a different question: when this thing is live at 3 a.m. and something is wrong, does your organization respond like a trained crew — or like a fire drill nobody rehearsed?
A mental model: think of a commercial airline. A brilliantly engineered aircraft (that is the other five pillars) still cannot fly passengers safely for decades without an operations discipline around it, and that discipline has exactly the four parts this pillar uses:
- Organization — the crew roster and chain of command. Who is captain, who is first officer, who owns which decision, and how do you escalate when something is off?
- Prepare — the pre-flight checklist, instrument checks, and simulator training. You do not discover a broken altimeter at cruising altitude; you catch it on the ground with a checklist, and you drill emergencies in a simulator before they happen for real.
- Operate — flying by the instruments and handling events by procedure. You watch the gauges (telemetry), and when a warning lights up you run the memorized checklist for it, the same way every time, regardless of which pilot is flying.
- Evolve — the post-flight debrief and the industry-wide safety board. Aviation gets safer every year because every incident and near-miss is investigated blamelessly and the lesson is shared with every airline. Your workload should improve the same way.
That analogy is not a coincidence: modern site-reliability and operations-excellence thinking borrowed checklists, blameless debriefs, and “black box” flight recorders straight from aviation safety culture. Hold the airline picture in your head and every section below has a home.
One naming warning before you read further. In this lesson “AWS WAF” means the Well-Architected Framework, not the Web Application Firewall — Amazon unfortunately abbreviates both as “WAF”. This entire lesson is about the framework pillar; there is no firewall content here. (More on the collision in Going deeper.)
Level: Advanced — with a beginner on-ramp · Time: ~55 min
Before this lesson, it helps to know: what the AWS Well-Architected Framework and its six pillars are (see the sibling pillar lessons), roughly what CloudWatch, IAM, and AWS Organizations do, and what “infrastructure as code” means. You do not need to have run any of the tools below — every command and template here is illustrative and labelled. If you want the underlying services first, the observability toolchain is covered in CloudWatch & CloudTrail observability and the account structure in Control Tower multi-account landing zone.
After this lesson you will be able to:
- Explain the four best-practice areas (Organization, Prepare, Operate, Evolve) and map them to the OPS 1–OPS 11 questions the Well-Architected Review actually asks.
- Tell a runbook apart from a playbook — and know which one an alarm should point to.
- Read and reason about a real SSM Automation runbook, a canary deployment with automatic rollback, a composite alarm, an EMF metric log, and a cfn-guard policy — the concrete artifacts this pillar produces.
- Run a Well-Architected Framework Review (WAFR) with the Well-Architected Tool, treat its output as a backlog, and use milestones to prove you improved.
- Recognize the five OE design principles and the failure modes (alert fatigue, click-ops drift, blameful post-mortems) they exist to prevent.
Where this fits
The AWS Well-Architected Framework (AWS WAF) is Amazon’s set of architectural best practices organized into six pillars — Operational Excellence, Security, Reliability, Performance Efficiency, Cost Optimization, and Sustainability — and Operational Excellence is the pillar AWS lists first for a reason: it is the one that governs how the team supports, observes, and continually improves the workload across its whole lifecycle. Where Reliability asks “will it stay up?” and Security asks “is it defensible?”, Operational Excellence asks “can your organization understand its workloads’ health, respond to events as a practiced discipline, and get better every iteration without being told?” Its currency is not a clever topology but codified procedures, telemetry, and feedback loops. This article — part 1 of the series — goes deep on the four best-practice areas AWS uses to structure the pillar (Organization, Prepare, Operate, Evolve), three cross-cutting capabilities that the OPS questions hammer on (telemetry, runbooks and playbooks, operations as code), and the connective tissue that ties it all together: the design principles and the Well-Architected Framework Review process.
A note on terminology before we start: in the official Operational Excellence pillar whitepaper, the best practices are grouped under four areas — Organization (how you set up to succeed), Prepare (designing for and readying operations before go-live), Operate (running the workload and understanding its health day to day), and Evolve (learning and improving over time). These map to the OPS questions (OPS 1 through OPS 11). The cross-cutting topics — telemetry, runbooks/playbooks, operations as code — are not separate areas but threads woven through Prepare and Operate; I have pulled them out as their own sections below because they are where most teams have the largest gaps, and because the AWS exam, the WAFR, and real incidents all turn on them.
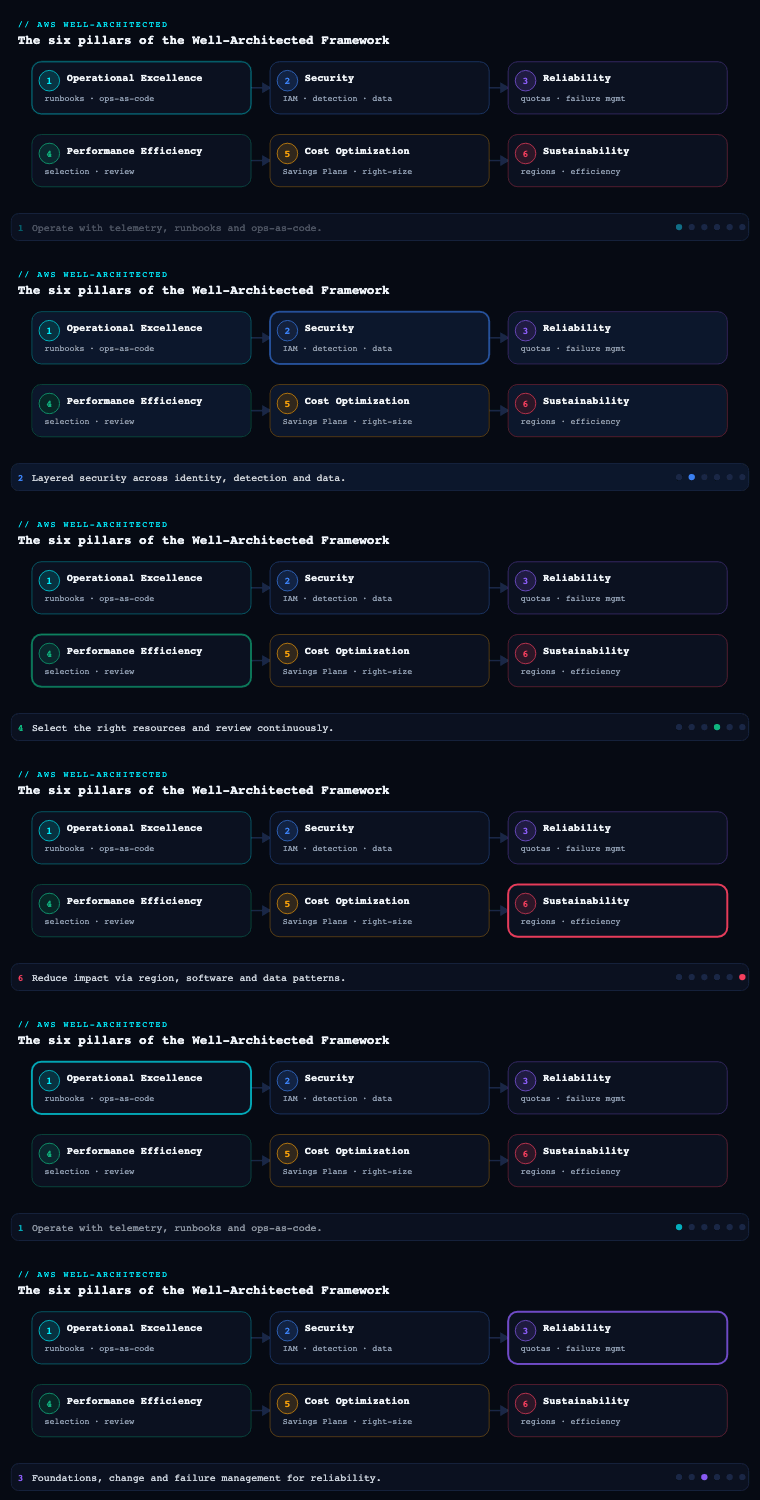
Organization
What it is. Organization is the first best-practice area and it covers everything before you write a line of operational tooling: understanding your business and customer priorities, defining how teams are structured, agreeing how responsibilities are shared, and establishing the governance and culture in which operations happen. In OPS terms it answers OPS 1 (“How do you determine what your priorities are?”), OPS 2 (“How do you structure your organization to support your business outcomes?”), and OPS 3 (“How does your organizational culture support your business outcomes?”).
Why it matters. Tooling cannot rescue a broken operating model. If the people who build a service never carry its pager, they optimize for “passes review”, not “is operable”. The classic failure is the over-the-wall handoff to a separate ops team that lacks the context to debug what it is running. AWS is deliberately agnostic about the exact operating model — it does not mandate “you build it, you run it” — but it insists you choose consciously and that every team understands its role in the shared business outcome. Without that, you get the two failure modes the pillar exists to prevent: unclear ownership during an incident (everyone assumes someone else is handling it) and misaligned priorities (the team polishes a feature the business never asked for while a known operational risk goes unfunded).
How to do it well.
- Evaluate and prioritize against business and compliance needs. Make a prioritized list of operational tasks and threats. AWS calls out evaluating governance, internal/external compliance, and threat landscape as inputs. Priorities are revisited as the business changes — they are not a one-time exercise.
- Choose an operations model deliberately. AWS describes several along a spectrum: fully separated (a central operations team), fully separated with a centralized platform team (a platform/landing-zone team provides paved roads), and fully integrated (“you build it, you run it”). Most enterprises land on a hybrid: a central platform/Cloud Center of Excellence team owns guardrails and shared tooling, while product teams own their workloads’ operations on top.
- Make responsibilities explicit. Capture ownership in writing. AWS recommends that team members know their responsibilities, know how to escalate, and that the relationships between teams (who provides what to whom) are documented and understood.
- Build a supportive culture. Executives set the tone; teams are empowered to act; people are encouraged to experiment within safe-to-fail boundaries; and you provide the time, resources, and psychological safety for blameless learning.
Artifacts, decisions, and AWS tooling.
| Concern | Artifact / decision | AWS service that supports it |
|---|---|---|
| Business priorities | Prioritized operational-task and threat list; mapping of features to outcomes | — (governance process) |
| Org structure | Operating-model decision; RACI; escalation paths | AWS Organizations (account structure mirrors team boundaries) |
| Guardrails / paved road | Account-vending and baseline controls | AWS Control Tower, Service Control Policies (SCPs), AWS Organizations |
| Ownership & cost accountability | Tagging standard, per-team accounts | AWS Organizations, cost allocation tags, AWS Budgets |
| Shared knowledge | Living standards, runbooks, escalation docs | AWS Systems Manager Documents, repo-resident Markdown |
The most consequential structural decision is your AWS Organizations and account layout — multi-account, with workloads isolated into separate accounts grouped by Organizational Units (OUs), deployed and governed through AWS Control Tower. The account boundary is the cleanest way to encode ownership: it gives each team a blast-radius-limited environment, its own cost view, and SCP-enforced guardrails it cannot escape. Get the org chart and the account chart to agree and most ownership ambiguity disappears before it can cause an incident.
Prepare
What it is. Prepare is the best-practice area that covers everything you do to be ready for operations before — and as — a workload goes live: designing the workload (and its operations) for understandability, ensuring it emits telemetry, reducing defects through engineering practices, mitigating deployment risk, and getting your people and procedures ready to support it. It answers OPS 4 (“How do you implement observability?”), OPS 5 (“How do you reduce defects, ease remediation, and improve flow into production?”), OPS 6 (“How do you mitigate deployment risks?”), and OPS 7 (“How do you know that you are ready to support a workload?”).
Why it matters. Operability is a design property, not something you bolt on after the fact. A workload that ships with no instrumentation, no health endpoints, no runbooks, and no defined “are we ready?” gate becomes an operational liability the moment it sees real traffic — every incident is then a first-time exploration instead of a practiced response. Prepare is where you pay the operability cost deliberately and early, so that day-two operations are a known quantity. The OPS 7 “operational readiness” gate, in particular, is the thing that stops a team from launching a workload that nobody is actually ready to run at 3 a.m.
How to do it well.
- Design for observability up front (OPS 4). Decide what telemetry the workload must emit — application metrics, business KPIs, logs, traces, and health checks — and make emitting it a Definition-of-Done item, not a follow-up ticket. (Covered in depth in the Telemetry section below.)
- Improve flow and reduce defects (OPS 5). Use version control for everything (app and infrastructure), test and validate changes in CI, build software-and-config in a managed, repeatable build process, and integrate quality gates (unit/integration tests, static analysis, security scanning) into the pipeline so defects are caught before production.
- Mitigate deployment risk (OPS 6). Plan for safe, reversible change: make deployments small and frequent, automate them, prefer immutable infrastructure, and use progressive deployment strategies (canary, linear, blue/green) so a bad change affects a fraction of traffic and can be rolled back automatically on a CloudWatch alarm.
- Validate operational readiness (OPS 7). Use an Operational Readiness Review (ORR) — a structured checklist, ideally encoded — to confirm that dashboards, alarms, runbooks, on-call rotation, escalation paths, and capacity plans all exist before go-live. Use game days to rehearse failure and confirm the team and tooling actually work.
Artifacts, decisions, and AWS tooling.
| Prepare activity | Artifact produced | AWS services |
|---|---|---|
| Source control & build | Repos, build specs, pipeline definitions | AWS CodePipeline, CodeBuild, CodeArtifact, Git (CodeCommit/GitHub) |
| Quality gates | Test reports, SAST/dependency scan results | CodeBuild, Amazon Inspector, CodeGuru |
| Safe deployment | Deployment configuration (canary/blue-green) with rollback alarms | AWS CodeDeploy, AWS AppConfig (feature flags + safe config rollout) |
| Observability design | Telemetry plan; instrumented code; dashboards | CloudWatch, AWS X-Ray, Application Signals, OpenTelemetry (ADOT) |
| Operational readiness | ORR checklist, game-day reports, runbook inventory | Well-Architected Tool custom lenses, Systems Manager |
A crucial Prepare decision is how you flag and roll out change separately from deploying code. AWS AppConfig lets you ship a feature behind a flag and turn it on progressively with a deployment strategy and a CloudWatch-alarm-based automatic rollback — decoupling “deployed” from “released” and shrinking the blast radius of a bad change to a tunable percentage.
Worked example: a canary deployment that rolls itself back (OPS 6).
The prose above says “prefer progressive deployment so a bad change affects a fraction of traffic and can be rolled back automatically on a CloudWatch alarm.” Here is what that actually looks like. This is an AWS SAM template for a Lambda function that shifts traffic in a canary and reverses itself the moment an alarm fires — no human in the loop:
# template.yaml (AWS SAM) — canary release with automatic alarm-based rollback
Resources:
  ShipmentTracker:
    Type: AWS::Serverless::Function
    Properties:
      Handler: app.handler
      Runtime: python3.12
      AutoPublishAlias: live          # every deploy publishes a new version + shifts the 'live' alias
      DeploymentPreference:
        Type: Canary10Percent5Minutes  # 10% of traffic for 5 min, then the remaining 90%
        Alarms:                        # if ANY of these is in ALARM during the shift, roll back
          - !Ref TrackLookupLatencyAlarm
          - !Ref TrackLookupErrorAlarm
        Hooks:
          PreTraffic:  !Ref RunSmokeTests      # validate BEFORE any real traffic
          PostTraffic: !Ref RunIntegrationTests # validate AFTER 100% shift

  TrackLookupErrorAlarm:
    Type: AWS::CloudWatch::Alarm
    Properties:
      Namespace: AWS/Lambda
      MetricName: Errors
      Dimensions:
        - { Name: FunctionName, Value: !Ref ShipmentTracker }
        - { Name: Resource, Value: !Sub "${ShipmentTracker}:live" }
      Statistic: Sum
      Period: 60
      EvaluationPeriods: 1
      Threshold: 5
      ComparisonOperator: GreaterThanThreshold
      TreatMissingData: notBreaching
Read it top to bottom the way the deployment engine does. AutoPublishAlias: live means clients always invoke the live alias, never a raw version — so CodeDeploy (which SAM wires up under the hood) can move the alias’s weighting from the old version to the new one gradually. Type: Canary10Percent5Minutes is one of the predefined CodeDeploy deployment configurations: send 10% of traffic to the new version, wait five minutes, then send the rest. During those five minutes the two named CloudWatch alarms are the trip-wire — if TrackLookupErrorAlarm sees more than five errors in a one-minute window, CodeDeploy automatically shifts the alias back to the old version and marks the deployment failed. The Hooks are Lambda functions that run before any traffic (PreTraffic — smoke-test the new version in isolation) and after full shift (PostTraffic), and a non-zero result from either also triggers rollback.
Two things a beginner should take from this. First, “deployed” and “released” are now separate events: the code is deployed to a new version instantly, but released to users only as fast as the canary allows — that decoupling is the whole point of OPS 6. Second, the rollback needs no human and no pager at 3 a.m.; the alarm is the decision-maker. The predefined configs step up in aggressiveness (Canary10Percent5Minutes → Linear10PercentEvery1Minute → AllAtOnce), and you match the config to the blast radius you can tolerate. On containers you get the same behavior from ECS blue/green via CodeDeploy or Argo Rollouts on EKS; on plain config changes (no code) you get it from AWS AppConfig deployment strategies, described next.
Operate
What it is. Operate is the best-practice area for running the workload day to day: understanding the health of both your workload and your operations, and responding to events — whether expected (a scaling event, a deploy) or unexpected (an incident) — in a planned, repeatable way. It answers OPS 8 (“How do you understand the health of your workload?”), OPS 9 (“How do you understand the health of your operations?”), and OPS 10 (“How do you manage workload and operations events?”).
Why it matters. This is where the rubber meets the road. A workload that is well-designed but poorly operated still fails its users: alerts that nobody tuned create fatigue and get ignored; incidents without a defined response become heroics that depend on one person who happens to know the system; and “health” measured only as “is the box up?” misses the customer experience entirely. Operate is the discipline of knowing what good looks like (so you can detect deviation), and having a practiced, often-automated response so that events are handled the same way every time regardless of who is on call.
How to do it well.
- Define workload health by outcomes, not just resources (OPS 8). Identify Key Performance Indicators (KPIs) that reflect the customer/business outcome (orders/min, checkout success rate, p99 latency) and the workload metrics that drive them. Build dashboards that distinguish business health from infrastructure health, and set alarms on KPIs with meaningful thresholds.
- Measure your operations, not just your workload (OPS 9). Track operational health metrics — MTTD, MTTR, MTBF, change failure rate, deployment frequency, lead time for changes (the DORA four), and toil — so you can tell whether your operations practice is improving, not just the system.
- Respond to events as a discipline (OPS 10). Have a defined process for every routine event and a structured incident response process for the unexpected ones: alerts route to the right responder, severity drives the response, runbooks and playbooks guide action, and post-incident analysis is mandatory. Automate the routine responses so humans handle only what genuinely needs judgment.
Operate KPIs and what they tell you.
| Metric | What it measures | Why it matters | AWS source |
|---|---|---|---|
| MTTD (mean time to detect) | Detection latency from fault to alert | Are you finding problems before customers do? | CloudWatch alarms, DevOps Guru |
| MTTR (mean time to recover) | Time from detection to restoration | The number customers actually feel | Incident Manager, runbook automation |
| Change failure rate | % of deployments causing a failure | Quality of your delivery pipeline | CodeDeploy + CloudWatch |
| Deployment frequency | How often you ship to prod | Flow and small-batch discipline | CodePipeline metrics |
| Toil % | Time on manual, repetitive ops work | Where automation should be invested | Operations tracking |
Artifacts, decisions, and AWS tooling. The Operate toolchain centers on Amazon CloudWatch (metrics, logs via CloudWatch Logs and Logs Insights, dashboards, alarms, composite alarms, synthetics canaries, and Real-User Monitoring) and Amazon CloudWatch Application Signals for application-level SLOs. For understanding operations health and surfacing anomalies, Amazon DevOps Guru uses ML to flag operational issues and likely causes. For event response, AWS Systems Manager Incident Manager orchestrates incidents (engagement, runbook execution, post-incident analysis), Amazon EventBridge routes events to automated responders, and Systems Manager Automation executes the actual remediation. Artifacts: a workload health dashboard, an operations health dashboard, an alarm catalog with owners and thresholds, an incident response plan, and severity definitions with escalation paths.
Worked example: composite alarms that kill the noise, and an event that fixes itself (OPS 10).
“Alarms rebuilt around KPIs and composite alarms to kill the noise” is easy to say. The mechanism is a composite alarm: an alarm whose state is a boolean expression over other alarms, so a single actionable page fires only when a combination of conditions is true — not every time one twitchy metric crosses a line. A single high-latency blip that customers never noticed should not wake anyone; latency and an elevated error rate together should:
aws cloudwatch put-composite-alarm \
  --alarm-name track-lookup-unhealthy \
  --alarm-rule "ALARM(\"track-lookup-p99-latency\") AND ALARM(\"track-lookup-5xx-rate\")" \
  --alarm-actions arn:aws:sns:us-east-1:123456789012:oncall-sev2 \
  --actions-enabled
track-lookup-unhealthy goes into ALARM only when both child alarms are simultaneously breaching. The two child alarms can stay noisy internally; the composite is the only thing wired to the pager, so on-call sees one high-signal event instead of two flapping ones. Composite alarms also let you suppress downstream alarms during a known dependency outage (an ALARM_ACTIONS_SUPPRESSOR), which is how you stop one root-cause failure from generating fifty pages.
Now make a routine event fix itself so a human never sees it at all. When the composite alarm changes state, EventBridge catches the event and runs a Systems Manager Automation runbook:
// EventBridge rule pattern: match the composite alarm entering ALARM
{
  "source": ["aws.cloudwatch"],
  "detail-type": ["CloudWatch Alarm State Change"],
  "detail": {
    "alarmName": ["track-lookup-unhealthy"],
    "state": { "value": ["ALARM"] }
  }
}
The rule’s target is an SSM Automation document (say, RestartUnhealthyTasks) invoked through an EventBridge IAM role that is allowed only ssm:StartAutomationExecution on that one document. That is the OPS 10 ideal in three moving parts: detect (the composite alarm), route (the EventBridge rule), remediate (the Automation runbook) — with Incident Manager engaged in parallel for anything that turns out to need judgment. The table in the section above lists MTTD/MTTR/change-failure-rate as the numbers to watch; this pattern is how you drive MTTR down, because the fastest incident is the one that never pages a person. The trap to avoid — auto-remediation that loops forever on a problem it cannot actually fix — is covered in Going deeper.
Evolve
What it is. Evolve is the best-practice area for continuous improvement: dedicating time and resources to learning from operational events and metrics, sharing those lessons across teams, and making incremental improvements to the workload and to the operations practice itself. It answers OPS 11 (“How do you evolve operations?”) and it is the feedback loop that closes the whole PDCA-style cycle of the pillar.
Why it matters. A team that never sets aside time to improve accumulates operational debt: the same incident recurs, the same toil persists, the same brittle runbook is followed by rote. Evolve is the deliberate counter-force — it treats getting better as scheduled, funded work rather than something that happens “when there’s time” (which is never). It is also where lessons stop being trapped in one team’s heads and become organizational knowledge: a fix one team discovers should not have to be rediscovered by every other team.
How to do it well.
- Learn from every operational event. Run blameless post-incident analyses (PIRs / correction-of-error) for incidents and near-misses; the goal is to fix the system and process, not assign blame. Drive each to documented, owned, time-boxed action items and actually track them to completion.
- Make improvement scheduled work. Allocate capacity each iteration to act on the lessons — pay down operational debt, automate toil, tighten alarms, harden runbooks. AWS explicitly recommends dedicating time/resources for incremental improvement.
- Validate insights and share them. Analyze trends across operations metrics to find systemic issues (not just one-off incidents), and share lessons learned across teams so improvements compound organization-wide.
- Feed lessons back into the design. Improvements should flow into your standards, your IaC modules, and your golden paths so the fix is inherited by everyone, not reapplied manually.
Artifacts, decisions, and AWS tooling.
| Evolve activity | Artifact | AWS / tooling |
|---|---|---|
| Post-incident learning | PIR / Correction-of-Error (COE) documents with action items | Systems Manager Incident Manager (built-in post-incident analysis) |
| Trend analysis | Operations metrics review; recurring-issue reports | CloudWatch dashboards, DevOps Guru insights, QuickSight |
| Improvement backlog | Prioritized operational-debt and toil backlog | Issue tracker; reviewed each iteration |
| Re-assessment | Periodic Well-Architected re-review with improvement plan | AWS Well-Architected Tool (milestones) |
| Knowledge sharing | Lessons-learned library, updated golden paths | Wiki, Systems Manager Documents |
The Well-Architected Tool’s milestones feature is the natural home for Evolve at the architecture level: you snapshot a review, work the improvement plan, then take a new milestone and measure the delta. That turns “we should improve” into an auditable trajectory.
Telemetry
What it is. Telemetry is the data your workload and operations emit so you can understand them: metrics (numeric time series), logs (event records), traces (the path of a request across services), and events (state changes). Implementing observability — turning that telemetry into the ability to ask new questions of your system — is the substance of OPS 4 and the prerequisite for everything in Operate and Evolve.
Why it matters. You cannot operate, alarm on, troubleshoot, or improve what you cannot see. Crucially, AWS draws a line between monitoring (pre-defined dashboards/alarms answering known questions) and observability (rich, high-cardinality telemetry that lets you answer unknown questions during a novel incident). The deepest 3 a.m. outages are precisely the ones you did not anticipate — so telemetry must be rich enough to debug a failure mode you never imagined, not just light up a dashboard you already built.
How to do it well.
- Instrument across all three signals. Emit application and business metrics (not just CPU/memory), structured logs, and distributed traces. For metrics that matter, prefer high-resolution and consider embedded metric format (EMF) so you can extract custom metrics from structured logs.
- Standardize on OpenTelemetry. Use the AWS Distro for OpenTelemetry (ADOT) so instrumentation is portable and vendor-neutral; route to CloudWatch and/or X-Ray.
- Tie telemetry to user experience. Add synthetic canaries (CloudWatch Synthetics) to catch problems before users do, and Real-User Monitoring (CloudWatch RUM) to see the actual client experience.
- Define SLOs. Use CloudWatch Application Signals to set Service Level Objectives and burn-rate alarms on the golden signals (latency, errors, throughput, saturation), so alerting is tied to the customer promise rather than arbitrary resource thresholds.
- Make telemetry actionable. Aggregate and query at scale (Logs Insights), correlate signals on a single pane, and let ML surface anomalies (DevOps Guru, CloudWatch anomaly detection).
The AWS telemetry stack at a glance.
| Signal | Primary AWS service | Notes |
|---|---|---|
| Metrics | Amazon CloudWatch (+ Managed Service for Prometheus for Prometheus-native) | High-res, custom, EMF, anomaly detection |
| Logs | CloudWatch Logs + Logs Insights | Centralized query; EMF for metrics-from-logs |
| Traces | AWS X-Ray (+ ADOT) | Service maps, latency analysis across services |
| Dashboards/visualization | CloudWatch dashboards, Amazon Managed Grafana | Single pane; Grafana for multi-source |
| Synthetic / real-user | CloudWatch Synthetics, CloudWatch RUM | Proactive + actual UX |
| SLOs & golden signals | CloudWatch Application Signals | App-level SLOs and service health |
Artifacts: an instrumentation/telemetry standard (what every service must emit), a metrics and logging library baked into the paved road, dashboards per workload, and a defined set of SLOs with burn-rate alarms.
Worked example: custom metrics for free with EMF, and an SLO you can alarm on (OPS 4).
Two telemetry ideas above deserve to be made concrete, because they are where teams either save or waste real money and get either actionable or useless alerts.
First, embedded metric format (EMF). The naive way to record a business metric is to call the PutMetricData API on every request — which is a network call in your hot path and is billed per request. EMF instead lets you write a specially-structured JSON log line, and CloudWatch extracts the metric from it asynchronously, at no per-call API cost:
{
  "_aws": {
    "Timestamp": 1717977600000,
    "CloudWatchMetrics": [
      {
        "Namespace": "NorthwindTrack",
        "Dimensions": [["Service", "Operation"]],
        "Metrics": [{ "Name": "DispatchCreateLatency", "Unit": "Milliseconds" }]
      }
    ]
  },
  "Service": "dispatch",
  "Operation": "CreateDispatch",
  "DispatchCreateLatency": 42,
  "requestId": "a1b2c3d4-e5f6-7890-abcd-ef1234567890",
  "tenantId": "acme-freight"
}
The _aws block is the instruction to CloudWatch: “from this log group, extract a metric named DispatchCreateLatency in namespace NorthwindTrack, dimensioned by Service and Operation.” The value 42 becomes a metric data point. Everything outside _aws (requestId, tenantId) stays as high-cardinality log context you can query in Logs Insights — but is not turned into metric dimensions, which is exactly what keeps your metric cardinality (and bill) bounded while your logs stay rich. This is the practical resolution of the monitoring-vs-observability distinction the prose draws: cheap dimensioned metrics for the dashboard, rich untouched fields for the 3 a.m. investigation.
Second, an SLO with a burn-rate alarm in CloudWatch Application Signals. An SLO turns a golden-signal metric into a customer promise with an error budget — and you alarm on the rate you are burning that budget, not on a raw threshold:
| Piece | Example | Why it is defined this way |
|---|---|---|
| SLI (indicator) | % of tracking lookups with latency < 400 ms | Measures the customer’s actual experience, not a box’s CPU |
| SLO (objective) | 99.5% of lookups meet the SLI over 30 days | The promise; the other 0.5% is your error budget |
| Error budget | 0.5% of ~50M monthly requests ≈ 250k “allowed” slow requests | A quantified, spendable amount of unreliability |
| Fast burn alarm | budget burning ≥ 14.4× normal (≈ 2% of a 30-day budget in 1 hr) | Pages a human now — an outage is in progress |
| Slow burn alarm | budget burning ≈ 3× over 6 hr | A ticket, not a page — a slow leak worth fixing this week |
The point of burn-rate alarming is that it is symptom-based and self-prioritizing: a fast burn is a page because the budget will be gone by morning; a slow burn is a ticket. That is how you escape the alert fatigue that resource-level “CPU > 80%” alarms create — you alarm on the promise to the customer, at the urgency the math justifies. (Frontend equivalents live in CloudWatch observability via RUM and Synthetics.)
Runbooks and playbooks
What it is. AWS makes a precise distinction the WAFR (and the exam) expect you to know. A runbook is a documented procedure to achieve a known outcome — the steps for a routine or expected operation (deploy a release, fail over a database, rotate a credential, scale a fleet). A playbook is a documented process to investigate an issue whose cause is not yet known — the steps to diagnose and identify the root cause of an unexpected event so you can decide how to respond. Put simply: runbooks are for the known (“do X”); playbooks are for the unknown (“figure out what’s wrong”).
Why it matters. Without them, every operational action depends on tribal knowledge and improvisation under pressure — the slowest, most error-prone, least repeatable possible mode. Runbooks make routine operations consistent and safe to delegate (and to automate); playbooks make incident diagnosis systematic so a responder works the problem methodically instead of flailing. Both are what let a less-experienced on-call engineer perform like an expert, and both are the seed of automation: a mature runbook is just code that hasn’t been written yet.
How to do it well.
- Write them as code, store them in version control, and keep them current. A stale runbook is worse than none. Review and update them as the system changes, and after every incident that exposed a gap.
- Automate runbooks progressively. Encode them as Systems Manager Automation documents (runbooks) so the procedure becomes executable. AWS describes a maturity path: manual → partially automated (human triggers an automated step) → fully automated. Aim to climb it deliberately.
- Make playbooks investigative and branching. A good playbook lists the symptoms, the telemetry to check first, the likely hypotheses, and the diagnostic steps for each — pointing at the exact dashboards, log groups, and queries to run.
- Trigger and orchestrate them from your event flow. Wire EventBridge rules and CloudWatch alarms to invoke Automation runbooks; orchestrate human + automated incident steps through Incident Manager (which can auto-launch response plans and attach runbooks).
- Test them. Exercise runbooks and playbooks in game days so you find the broken step before a real incident does.
| Runbook | Playbook | |
|---|---|---|
| Purpose | Achieve a known outcome | Investigate an unknown issue |
| Trigger | Routine/expected operation | Unexpected event / incident |
| Form | Ordered, deterministic steps | Branching diagnostic guide |
| Automation target | High — becomes SSM Automation | Partial — steps may auto-gather telemetry |
| AWS home | SSM Automation documents | Docs + Incident Manager + dashboards |
Artifacts: a runbook library (versioned, increasingly as SSM Automation documents), a playbook library indexed by symptom/alert, and an alarm-to-runbook mapping so every actionable alarm names the procedure that addresses it.
Worked example: turning a tribal procedure into an SSM Automation runbook.
The section above claims “a mature runbook is just code that hasn’t been written yet,” and the enterprise scenario later reduces a 40-minute, one-person Aurora failover to a 4-minute job any on-call engineer can run. This is the code that does it — a Systems Manager Automation document (schema version 0.3) that gates on an approval, performs the failover through the AWS API, and waits until the cluster is actually healthy before reporting success:
schemaVersion: '0.3'
description: >-
  Fail over an Aurora cluster to a chosen replica, with a human approval gate
  and a health check. Any on-call engineer can run this; nobody needs tribal knowledge.
assumeRole: '{{ AutomationAssumeRole }}'
parameters:
  ClusterId:            { type: String }
  TargetInstanceId:     { type: String }
  Approvers:            { type: StringList }   # SNS-notified approvers
  AutomationAssumeRole: { type: String }       # least-privilege role, NOT the caller's identity
mainSteps:
  - name: ApproveFailover
    action: aws:approve                        # pauses here until an approver responds
    timeoutSeconds: 600
    onFailure: Abort
    inputs:
      Approvers: '{{ Approvers }}'
      Message: 'Approve Aurora failover of {{ ClusterId }} to {{ TargetInstanceId }}?'

  - name: Failover
    action: aws:executeAwsApi
    inputs:
      Service: rds
      Api: FailoverDBCluster
      DBClusterIdentifier: '{{ ClusterId }}'
      TargetDBInstanceIdentifier: '{{ TargetInstanceId }}'

  - name: WaitUntilAvailable
    action: aws:waitForAwsResourceProperty     # do NOT report success until the cluster is healthy
    timeoutSeconds: 600
    inputs:
      Service: rds
      Api: DescribeDBClusters
      DBClusterIdentifier: '{{ ClusterId }}'
      PropertySelector: '$.DBClusters[0].Status'
      DesiredValues: ['available']
Walk the four things that make this a safe runbook, not just a script. assumeRole means the automation runs as a dedicated, least-privilege role (AutomationAssumeRole) whose policy grants only rds:FailoverDBCluster and rds:DescribeDBClusters — the engineer who starts it never needs those permissions themselves, which is the whole point of codifying privileged operations. The aws:approve step is a hard human gate: the automation pauses and SNS-notifies the approvers, so a destructive action still requires a yes, but a controlled one with an audit trail. aws:executeAwsApi calls the RDS API directly — no scripting a CLI, no parsing text. And aws:waitForAwsResourceProperty is the maturity marker: a naive script would fire the failover and exit “success” while the cluster is still promoting a replica; this step blocks until Status == available, so “done” means actually done.
You now climb the automation maturity ladder deliberately: today an engineer triggers this from the console with two clicks (partially automated); tomorrow the composite alarm from the previous section triggers it through EventBridge with the approval step removed for a pre-blessed scenario (fully automated). Store the document in version control, review changes in a pull request, and test it in a game day — because a runbook you have never executed is a hypothesis, not a procedure.
Operations as code
What it is. Operations as code is the first and most foundational OE design principle: define your entire workload — infrastructure and the operations procedures that run it — as code, so both can be version-controlled, peer-reviewed, tested, and executed automatically rather than performed by hand. It extends “infrastructure as code” to cover operations: not just what you build, but how you run, patch, respond, and remediate.
Why it matters. Manual (“click-ops”) operations are the root cause of the two most expensive day-two problems: configuration drift (production no longer matches any known-good definition, so nobody can confidently reproduce or recover it) and inconsistent, unrepeatable response (the fix worked last time because a specific person remembered a specific sequence). Operations as code makes operations repeatable, reviewable, and testable: you can apply the same procedure identically every time, limit human error, code your response to events so it triggers automatically, and review an operational change in a pull request exactly like application code. It is also the prerequisite for the safe-deployment and runbook-automation practices above — they all assume the procedure is code.
How to do it well.
- Codify infrastructure declaratively. Define environments with AWS CloudFormation or the AWS CDK (or Terraform); modularize, parameterize per environment, and deploy through a pipeline — never the console for production.
- Codify operations procedures. Turn runbooks into Systems Manager Automation documents; manage patching with Patch Manager, configuration/inventory with State Manager, and ad-hoc fleet operations with Run Command — all declarative and auditable.
- Code your responses to events. Use EventBridge to trigger Lambda or SSM Automation so responses to operational events are automatic and consistent.
- Enforce guardrails as code. Use AWS Config (with conformance packs and auto-remediation), SCPs, and Control Tower controls so policy is executable and drift is detected and corrected automatically.
- Apply the same engineering rigor to ops code as app code. Version control, code review, automated tests (e.g., cfn-lint, cfn-guard policy-as-code, CDK assertions), and CI/CD for the operations tooling itself.
The operations-as-code toolchain.
| Layer | What you codify | AWS service |
|---|---|---|
| Infrastructure | Networks, accounts, resources | CloudFormation, CDK, Terraform |
| Account guardrails | Baselines, OUs, controls | Control Tower, SCPs |
| Compliance/config | Desired config + auto-remediation | AWS Config (conformance packs) |
| Operational procedures | Runbooks, patching, inventory | Systems Manager (Automation, Patch Manager, State Manager, Run Command) |
| Event-driven response | Automated remediation | EventBridge + Lambda / SSM Automation |
| Config/feature rollout | Safe, gradual config changes | AWS AppConfig |
Artifacts: an IaC repository with a reusable module library and per-environment parameters, a library of SSM Automation runbooks, AWS Config conformance packs with remediation, and pipelines that deploy both the infrastructure and the operations tooling.
Worked example: a guardrail that is code on both sides of deploy.
“Enforce guardrails as code” and “apply the same engineering rigor to ops code as app code” become concrete when you see the same rule enforced twice — once in the pipeline before anything ships, and once continuously in production to catch drift. Take a simple rule: every S3 bucket must have default encryption configured.
In the pipeline (preventive): a cfn-guard policy-as-code rule validates the CloudFormation template in CI, failing the build before a non-compliant bucket is ever created:
# s3-encryption.guard  (cfn-guard 2.x DSL)
let s3_buckets = Resources.*[ Type == 'AWS::S3::Bucket' ]

rule s3_default_encryption when %s3_buckets !empty {
  %s3_buckets.Properties.BucketEncryption exists
  <<
    Violation: every S3 bucket must define BucketEncryption (default encryption at rest).
  >>
}
cfn-guard validate --rules s3-encryption.guard --data template.yaml returns non-zero if any bucket lacks BucketEncryption, so the pipeline gate stops it. (Note: S3 has applied SSE-S3 default encryption to new objects automatically since 2023 — but the pipeline rule still matters because it enforces your explicit, auditable configuration and can require KMS-CMK encryption rather than accepting the AWS-managed default.)
In production (detective + corrective): the same intent runs continuously as an AWS Config managed rule with an automatic remediation that repairs any bucket that drifts out of compliance:
# CloudFormation: Config rule + auto-remediation
EncryptionRule:
  Type: AWS::Config::ConfigRule
  Properties:
    ConfigRuleName: s3-bucket-server-side-encryption-enabled
    Source: { Owner: AWS, SourceIdentifier: S3_BUCKET_SERVER_SIDE_ENCRYPTION_ENABLED }

EncryptionRemediation:
  Type: AWS::Config::RemediationConfiguration
  Properties:
    ConfigRuleName: !Ref EncryptionRule
    TargetType: SSM_DOCUMENT
    TargetId: AWS-EnableS3BucketEncryption   # AWS-owned Automation runbook
    Automatic: true
    MaximumAutomaticAttempts: 3
    RetryAttemptSeconds: 60
    Parameters:
      AutomationAssumeRole:
        StaticValue: { Values: ['arn:aws:iam::123456789012:role/ConfigRemediationRole'] }
      BucketName:
        ResourceValue: { Value: RESOURCE_ID }
Read the pairing as the two halves of operations-as-code. The cfn-guard rule is preventive: policy is executable and drift never enters through the front door. The Config rule is detective and corrective: if a bucket is created out-of-band (someone clicked in the console despite the SCP, or a rule was added later to existing infrastructure), Config flags it non-compliant and the AWS-EnableS3BucketEncryption Automation runbook fixes it within a few retries — again through a dedicated ConfigRemediationRole, not a human’s credentials. Package dozens of these into a conformance pack, deploy the pack org-wide from a delegated-admin account, and your written standard has become an always-on control. This is the same guardrail philosophy you meet in Organizations SCP guardrails — SCPs deny the action, Config catches and repairs the state.
The design principles and review process
What it is. Underneath the four best-practice areas, Operational Excellence is anchored by a short list of design principles, and the whole framework is operationalized through the Well-Architected Framework Review (WAFR) conducted with the AWS Well-Architected Tool. The five OE design principles are:
- Perform operations as code — define workload and operations procedures as code (the subject of the previous section).
- Make frequent, small, reversible changes — design workloads so components can be updated regularly in small increments that can be reversed if they fail, limiting blast radius.
- Refine operations procedures frequently — as you evolve the workload, evolve the procedures with it; use game days to validate that procedures (and the team) are effective and current.
- Anticipate failure — perform “pre-mortems” to identify potential failure sources, test failure scenarios, and validate your understanding of their impact (e.g., game days, fault injection).
- Learn from all operational events and metrics — drive improvement through lessons learned from all events, both successes and failures, and share what is learned across teams.
Why it matters. The principles are the why behind the practices — they are how you decide between two reasonable-looking options when the checklist is silent. The review process is what turns the framework from a document you read once into a recurring, evidence-based health check on a specific workload: a structured conversation, anchored by the OPS questions, that surfaces high- and medium-risk items, produces an improvement plan, and (via milestones) measures whether you actually improved. Without a review cadence, “well-architected” decays the moment the system changes.
How to do it well.
- Run the WAFR with the Well-Architected Tool, per workload. Define the workload, answer the OPS (and other pillar) questions, and let the tool identify High-Risk Issues (HRIs) and Medium-Risk Issues (MRIs) against the current best practices.
- Treat the output as a backlog, not a grade. The deliverable is a prioritized improvement plan, owned and time-boxed — exactly the input to the Evolve loop above.
- Use milestones to show a trajectory. Save a milestone, work the plan, re-review, save another, and report the delta. This is how Operational Excellence becomes measurable.
- Apply lenses where relevant. Use the appropriate Well-Architected Lens (e.g., Serverless, SaaS, Container) and consider a custom lens to encode your own ORR checklist so organizational standards are reviewed alongside AWS best practices.
- Schedule reviews around change. Re-review at major milestones and after significant architectural change — not once at launch and never again. The companion AWS Well-Architected Framework body of guidance and AWS Trusted Advisor checks feed continuous signal between formal reviews.
Artifacts. A defined workload in the Well-Architected Tool, a completed OPS questionnaire, an HRI/MRI list, a prioritized improvement plan, milestones that track progress, and (optionally) a custom lens encoding your ORR.
Going deeper
The four areas and the worked examples cover what Operational Excellence asks for. This section is for the reader who has shipped a few of these and now cares about the internals, the edge cases, the cost, and the ways each of these mechanisms fails in production.
The “AWS WAF” name collision — and where the OPS questions actually live
It is worth stating plainly because it trips up every newcomer and shows up in interviews: AWS overloads the abbreviation “WAF”. In this series it is the Well-Architected Framework — a set of best-practice guidance and a free review process. Elsewhere in AWS, AWS WAF is a completely different product: the Web Application Firewall that filters HTTP requests (SQL-injection rules, rate limiting, IP sets) in front of CloudFront, ALB, or API Gateway. They share three letters and nothing else. When someone says “run a WAF review,” disambiguate: a Well-Architected review is a structured questionnaire in the Well-Architected Tool; a Web Application Firewall review is a security-rules audit. This lesson, and every “OPS” reference in it, is 100% the framework.
On the framework side, the pillar’s structure is not arbitrary. The current Operational Excellence whitepaper organizes best practices under the four areas and eleven questions:
| Area | OPS questions | The one-line version |
|---|---|---|
| Organization | OPS 1–3 | Priorities, team structure, culture |
| Prepare | OPS 4–7 | Observability design, reduce defects, mitigate deployment risk, operational readiness |
| Operate | OPS 8–10 | Workload health, operations health, event/incident management |
| Evolve | OPS 11 | Learn and improve continuously |
The exact numbering shifts slightly across whitepaper revisions (AWS periodically re-cuts the questions), so treat the mapping of area → intent as stable and the specific numbers as version-sensitive. When you run a review in the tool, you answer the live version’s questions, not a memorized list.
GameDays and AWS FIS: engineering the failure you rehearse
“Anticipate failure” and “run game days” are principles until you have a tool that injects real faults on a schedule. AWS Fault Injection Service (FIS) is that tool — a managed chaos-engineering service that runs experiment templates: a set of actions (terminate these instances, add latency here, throttle this API, fail this AZ) against targets (selected by tag or resource filter), guarded by stop conditions bound to CloudWatch alarms. The stop condition is the safety rail that separates chaos engineering from chaos: the experiment aborts and rolls back the instant a real customer-impact alarm fires.
# FIS experiment template (conceptual) — inject latency, abort if the SLO alarm trips
actions:
  add-latency:
    actionId: aws:ssm:send-command    # e.g. run a stress/tc command via SSM on targets
    parameters: { duration: 'PT5M' }
    targets: { Instances: dispatch-fleet }
targets:
  dispatch-fleet:
    resourceType: aws:ec2:instance
    selectionMode: PERCENT(25)
    resourceTags: { app: dispatch }
stopConditions:
  - source: aws:cloudwatch:alarm
    value: arn:aws:cloudwatch:us-east-1:123456789012:alarm:track-lookup-unhealthy
The maturity progression is: run FIS experiments in pre-prod first to validate that your runbooks, alarms, and auto-remediation actually fire; then graduate to scheduled production game days once you trust the stop conditions. A game day is not “break things and see” — it is a hypothesis (“if 25% of the dispatch fleet slows down, the SLO alarm fires within two minutes and the auto-scale runbook restores capacity”) tested under controlled blast radius. When the hypothesis is wrong, that is the finding, and it feeds straight into Evolve.
Incident Manager, OpsCenter, and the anatomy of a response plan
The Operate section names Incident Manager; here is what it is actually made of. AWS Systems Manager Incident Manager is built from a few primitives: contacts (people, with contact channels — SMS, email, voice), escalation plans (engage contact A; if no ack in 5 minutes, engage B), response plans (the template that ties a CloudWatch alarm or EventBridge event to an impact level, the contacts to engage, the SSM runbooks to attach, and a chat channel), and the live incident record with an auto-captured timeline. When the composite alarm from earlier fires, the response plan can automatically open an incident, engage the on-call rotation, launch a diagnostic runbook, and drop everyone into a Slack/Chime channel via AWS Chatbot — before a human has typed anything.
Sitting alongside it, Systems Manager OpsCenter aggregates operational issues as OpsItems — a single queue of “things operators need to act on,” de-duplicated and enriched with related resources and suggested runbooks. The mental split: OpsCenter is the backlog of operational work (including non-urgent items DevOps Guru or Config raise); Incident Manager is the active incident machinery for the urgent ones. Both feed Evolve — Incident Manager has a built-in post-incident analysis template (blameless, with recommended action items) that becomes your correction-of-error document.
Observability at scale: the cost model nobody budgets for
The fastest way to get told “turn off the observability” is to let its bill surprise finance. Rough list prices (us-east-1, approximate, subject to change) that shape every telemetry design decision:
| Signal | Cost driver | Approx. list price | Design consequence |
|---|---|---|---|
| Custom metrics | Per metric-name × dimension combination | ~$0.30 / metric / month | Cardinality is cost. A userId dimension on a million users = a million metrics. Keep high-cardinality fields in logs, not metric dimensions — exactly what EMF enables. |
| Logs ingestion | Per GB ingested (Standard class) | ~$0.50 / GB | Sample debug logs; don’t log full payloads at INFO. |
| Logs Insights queries | Per GB scanned | ~$0.005 / GB scanned | Scope queries by time and log group; a broad query over TBs is a real charge. |
| Alarms | Per alarm / month | ~$0.10 (standard) / ~$0.30 (high-res) | Composite alarms reduce pages, not alarm count — but consolidating child alarms does both. |
| X-Ray / traces | Per trace recorded & scanned | per-million pricing | Sample. 100% tracing at scale is neither necessary nor affordable; sample by rule and always-trace errors. |
The three levers that keep the bill sane: EMF (custom metrics with bounded cardinality, no per-call API cost), trace sampling (a small percentage, plus every error), and log retention + tiering (set a retention policy per log group; ship long-term/audit logs to S3, not indefinite CloudWatch storage). Observability that bankrupts the team gets deleted in the next cost review — so treat its cost as a first-class design constraint, not an afterthought.
Cross-account observability: the monitoring-account pattern
The Organization section pushes account-per-team isolation — which immediately raises “so where does on-call look during an incident that spans six accounts?” The answer is CloudWatch cross-account observability via Observability Access Manager (OAM): designate one monitoring account, create a sink in it, and create a link from each source account that shares its metrics, logs, and traces (X-Ray) into the monitoring account. On-call then investigates across the whole estate from one pane, with search and service maps that cross account boundaries, without logging into each account. Pair it with centralized logging (source accounts ship logs to a central log-archive account, typically the Control Tower Log Archive account) so the audit trail is tamper-isolated from the teams that generate it. This is the observability half of the multi-account model — the account boundary gives you blast-radius isolation and a clean cross-account view, rather than forcing a choice between them.
Automation you can trust: least privilege, rate control, and runaway remediation
Auto-remediation is powerful enough to be dangerous, and three failure modes recur. First, over-privileged automation roles. Every SSM Automation assumeRole, EventBridge target role, and Config RemediationRole should carry a hand-audited least-privilege policy scoped to the exact APIs and resources it touches — because that role is a standing grant of privileged action that runs without a human. In cross-account automation, guard the assume-role with an external ID to prevent the confused-deputy problem. Second, no rate control. SSM Automation supports maxConcurrency and maxErrors; a fleet-wide remediation with maxConcurrency: 100% and no error budget can brick an entire fleet in one execution — set a low concurrency and a maxErrors that halts the run after a handful of failures, so a bad runbook stops after damaging a few targets, not all of them. Third, runaway remediation loops. The classic outage: an alarm triggers a remediation that does not actually fix the root cause, the alarm re-fires, the remediation runs again, forever — hammering the API and possibly the workload. Defenses: cap attempts (MaximumAutomaticAttempts on Config remediation), make remediations idempotent, and add a circuit-breaker so N failures in a window escalate to a human instead of looping. The rule of thumb: automate the response, but always leave a path for the automation to give up and page a person.
Putting the WAFR in the pipeline: your ORR as a custom lens
The design-principles section mentions custom lenses; the advanced move is to treat your Operational Readiness Review as code and run it as a governance gate, not a meeting. A Well-Architected custom lens is a JSON document you import-lens into the Well-Architected Tool:
{
  "schemaVersion": "2021-11-15",
  "name": "Northwind ORR",
  "description": "Operational Readiness Review encoded as a Well-Architected custom lens.",
  "pillars": [{
    "id": "ops_readiness",
    "name": "Operational Readiness",
    "questions": [{
      "id": "orr_telemetry",
      "title": "Does the service emit the standard telemetry and have alarms mapped to runbooks?",
      "choices": [
        { "id": "dashboards", "title": "Dashboards exist for all golden signals" },
        { "id": "alarm_runbook", "title": "Every actionable alarm maps to a runbook or playbook" }
      ],
      "riskRules": [
        { "condition": "dashboards && alarm_runbook", "risk": "NO_RISK" },
        { "condition": "default", "risk": "HIGH_RISK" }
      ]
    }]
  }]
}
Because the Well-Architected Tool has an API (create-workload, import-lens, create-milestone, and the review APIs), you can wire a lightweight review into the delivery pipeline: a service cannot promote to production until its workload passes the ORR custom lens with zero high-risk issues, checked programmatically. That closes the loop between Prepare (OPS 7 readiness) and Evolve (OPS 11 re-review) — the same checklist that gates launch is the one you re-run each quarter and measure with milestones. It also makes “well-architected” auditable to a regulator or a board: a milestone is a timestamped, versioned snapshot of the workload’s risk posture, and the delta between two milestones is your provable improvement.
Real-world enterprise scenario
Northwind Logistics is a fictional mid-size freight-and-parcel company running Northwind Track, a customer-facing shipment-tracking and dispatch platform on AWS: ~120 microservices on Amazon EKS, an event backbone on Amazon EventBridge and Amazon MSK, Aurora PostgreSQL and DynamoDB for data, fronted by CloudFront and API Gateway. Peak load is the pre-holiday surge, when tracking lookups spike 6x. Today they are bleeding: their last “click-ops” config change caused a 90-minute outage during a surge, alerts are so noisy on-call ignores them, and a single senior engineer is the only person who can fail over Aurora. They commission a six-month Operational Excellence uplift.
Organization. Northwind first fixes ownership. They restructure into an AWS Organizations layout with Control Tower: a Platform OU (a 9-person Platform Engineering team owning the paved road, guardrails, and shared observability), Workloads-Prod and Workloads-NonProd OUs with one account per bounded context (14 product squads), and a Security OU. SCPs deny console-based production changes and lock regions to us-east-1/eu-west-1. Each squad now owns its workload end to end (“you build it, you run it”), backed by the platform team’s tooling. They write a prioritized operational-task and threat list and a RACI, and the CTO mandates blameless post-incident reviews. Artifact: operating-model decision record, account/OU map, RACI, SCP set.
Prepare. Every service must now meet a Definition of Done that includes “operable”: emits the standard telemetry, has a dashboard, has alarms, and ships with at least one runbook. Delivery moves onto CodePipeline + CodeBuild with mandatory quality gates (unit/integration tests, Amazon Inspector image scans, cfn-guard policy checks). Deployments to EKS go canary via Argo Rollouts wired to CloudWatch alarms, and risky behavior changes ship behind AWS AppConfig feature flags with automatic alarm-based rollback. Before any service launches, it must pass an Operational Readiness Review encoded as a custom lens in the Well-Architected Tool. Artifact: ORR custom lens, pipeline definitions, AppConfig profiles, canary deployment configs.
Telemetry. The platform team ships a golden instrumentation library built on the AWS Distro for OpenTelemetry, exporting metrics and traces to CloudWatch and X-Ray. They stand up CloudWatch Application Signals with SLOs on the four critical journeys (tracking lookup p99 < 400 ms, dispatch-create success ≥ 99.9%), CloudWatch Synthetics canaries on the public tracking API, and RUM on the web app. DevOps Guru is enabled across prod accounts. Artifact: telemetry standard, per-workload dashboards, defined SLOs with burn-rate alarms.
Runbooks and playbooks. The single-engineer Aurora failover is the first thing codified: it becomes a Systems Manager Automation runbook, tested in a game day, and reduced from a 40-minute tribal procedure to a 4-minute, one-approval automated execution any on-call engineer can run. They build a playbook library indexed by alert — e.g., “tracking-lookup latency SLO burn” lists the X-Ray service map to open, the Logs Insights query to run, and the three likeliest causes. Every actionable alarm is mapped to either a runbook or a playbook. Artifact: SSM Automation runbook library, symptom-indexed playbooks, alarm-to-runbook map.
Operate. Alarms are rebuilt around KPIs and composite alarms to kill the noise; EventBridge routes events to SSM Automation for routine responses (e.g., auto-scale, auto-restart, auto-failover) so humans see only judgment calls. Systems Manager Incident Manager now orchestrates every Sev1/Sev2 — engaging the right responder, auto-attaching the relevant runbook, and capturing the timeline. They begin tracking MTTD, MTTR, change failure rate, and deployment frequency on an operations-health dashboard. Artifact: operations-health dashboard, severity definitions, Incident Manager response plans.
Evolve. Every incident and near-miss now produces a Correction-of-Error document with owned, time-boxed action items, tracked to completion; the platform team reserves 20% of each sprint for operational-debt paydown and toil automation. They run a quarterly WAFR in the Well-Architected Tool, working the HRI/MRI improvement plan and snapshotting milestones to prove the trajectory. Lessons feed back into the golden library and IaC modules so every squad inherits each fix. Artifact: COE library, operational-debt backlog, quarterly WAFR milestones.
Outcome (measured over the six months):
| Metric | Before | After |
|---|---|---|
| MTTR (Sev1) | ~95 min | ~18 min |
| Change failure rate | 19% | 4% |
| Deployment frequency | ~3/week | ~40/week |
| Aurora failover time | ~40 min (1 person) | ~4 min (any on-call) |
| Surge-window outages (peak season) | 3 | 0 |
| Open WAFR High-Risk Issues (OPS) | 11 | 1 |
The decisive shift was cultural and structural — account-per-squad ownership plus operations-as-code — but it was the telemetry + runbook pairing that turned a fragile, hero-dependent operation into a practiced discipline, and the WAFR milestones that made the improvement provable to the board.
Deliverables & checklist
By the end of an Operational Excellence engagement you should be able to point at:
Common beginner mistakes
These are conceptual traps — misunderstandings about what the pillar is — rather than the architectural pitfalls listed further down. Each is a belief a newcomer holds, why it is wrong, and the model to replace it with.
-
“WAF here means the Web Application Firewall.” It does not. In this series WAF = Well-Architected Framework; AWS WAF the firewall is a separate product that shares the abbreviation. Right model: when you see “WAF” or “OPS” in a Well-Architected context, think review-and-best-practices, not request-filtering.
-
“Operational Excellence is just monitoring — set up some dashboards.” Dashboards are one thread (telemetry) of one area (Prepare/Operate). Right model: the pillar is four areas — Organization (who owns what), Prepare (be ready before go-live), Operate (run it by procedure), Evolve (get better) — and AWS deliberately lists Organization first because tooling cannot rescue a broken operating model.
-
“A runbook and a playbook are the same thing.” They are precisely different, and the review will catch you conflating them. Right model: a runbook achieves a known outcome (“do X” — deploy, fail over, rotate); a playbook investigates an unknown (“figure out what is wrong”). An alarm points to a runbook if the fix is known, a playbook if the cause is not.
-
“We ran a Well-Architected Review once, so we are well-architected.” A review is a snapshot; architecture decays the moment it changes. Right model: the WAFR output is a backlog, not a grade — a prioritized improvement plan you work, then re-review, tracking the delta with milestones. Schedule reviews around change.
-
“More alarms means more safety.” More untuned alarms means alert fatigue, and a fatigued on-call mutes everything — including the real page. Right model: alarm on SLOs and KPIs (customer outcomes) with composite alarms and burn-rate urgency, and route automatable events to automated responders so a human sees only judgment calls.
-
“Observability just means having dashboards.” Dashboards answer questions you already knew to ask; the outage that takes you down is the one you did not anticipate. Right model: monitoring answers known questions (pre-built dashboards/alarms); observability is rich, high-cardinality telemetry (traces, structured logs, EMF) that lets you answer new questions during a novel incident. You need both, but invest in the second.
-
“Operations as code just means Terraform/CloudFormation.” Infrastructure-as-code is only half of it. Right model: operations-as-code also covers the procedures that run the workload — runbooks as SSM Automation, remediation as Config + EventBridge, patching as Patch Manager — all version-controlled, reviewed, and testable like application code.
-
“A post-incident review is about finding who caused it.” Blame kills the honesty that makes the review useful, and the incident recurs anyway. Right model: reviews are blameless and fix the system and process; every one produces owned, time-boxed action items that are actually tracked to completion.
Common pitfalls
- Treating Operational Excellence as a tooling problem. Buying CloudWatch dashboards without fixing ownership and culture just produces prettier graphs nobody acts on. Fix the operating model and the Definition of Done first; tooling amplifies a healthy practice, it does not create one.
- Monitoring instead of observing. Teams build dashboards for the failures they already understand and are then blind during the novel incident that actually takes them down. Invest in rich, high-cardinality telemetry (traces, structured logs, EMF) so you can debug the failure you didn’t anticipate — not just the one you did.
- Confusing runbooks and playbooks (and writing neither). The WAFR will catch this, but the real cost is on-call: routine operations get improvised and incidents get flailed. Codify known procedures as runbooks (and automate them via SSM Automation); write investigative playbooks for the unknowns. Keep both in version control and current.
- Alert fatigue from un-tuned, resource-level alarms. Alarming on CPU instead of customer outcomes buries real signals in noise until on-call mutes everything. Alarm on SLOs and KPIs with composite alarms, and route automatable events to automated responders so humans see only what needs judgment.
- Post-incident reviews with no follow-through (or with blame). A PIR that assigns blame kills the honesty that makes it useful; one without tracked, time-boxed action items changes nothing and the incident recurs. Make reviews blameless, drive every one to owned action items, and reserve sprint capacity to actually do them.
- Doing the WAFR once and shelving it. A single launch-time review decays the moment the architecture changes. Schedule recurring reviews around change, treat the output as a backlog not a grade, and use milestones to prove you closed the High-Risk Issues.
Practice challenges
Work these top to bottom — they escalate from “can you classify it” to “can you design and harden it.” Try each before opening the solution.
1. (Beginner) Put each symptom in the right area. Classify each into Organization / Prepare / Operate / Evolve: (a) “the same incident has recurred three times and nobody scheduled the fix”; (b) “the service shipped with no dashboard or runbook”; © “during an incident nobody knew who owned the failing service”; (d) “alerts are so noisy on-call ignores them.”
<details><summary>Solution</summary>
(a) Evolve (OPS 11 — no feedback loop turning lessons into scheduled work). (b) Prepare (OPS 4/OPS 7 — operability and readiness were not a Definition-of-Done gate). © Organization (OPS 2 — ownership and escalation not defined). (d) Operate (OPS 9/OPS 10 — operations health and event management; the fix is SLO/composite alarms).
Why: every operational problem maps to an area and its OPS questions — naming the area tells you which practice to apply. </details>
2. (Beginner) Runbook or playbook? Label each: (a) “steps to fail over the Aurora cluster”; (b) “the tracking API is slow and we don’t know why — where do we look?”; © “rotate the database credential”; (d) “checkout error rate spiked after no deploy — investigate.”
<details><summary>Solution</summary>
(a) Runbook — known outcome. (b) Playbook — investigate an unknown. © Runbook — known, routine, automatable. (d) Playbook — diagnose an unexpected event.
Why: runbooks achieve a known outcome and become SSM Automation; playbooks are branching investigation guides for the unknown. </details>
3. (Intermediate) Make the page fire only on real customer pain. You have two alarms, checkout-p99-latency and checkout-5xx-rate, each individually flappy. Write the composite alarm that pages only when both are breaching.
<details><summary>Solution</summary>
aws cloudwatch put-composite-alarm \
  --alarm-name checkout-unhealthy \
  --alarm-rule "ALARM(\"checkout-p99-latency\") AND ALARM(\"checkout-5xx-rate\")" \
  --alarm-actions arn:aws:sns:us-east-1:123456789012:oncall-sev2
Why: AND in the composite rule requires both conditions simultaneously, so a lone latency blip stays silent — the composite is the only alarm wired to the pager, killing the noise.
</details>
4. (Intermediate) Fix a cardinality/cost bomb. A service calls PutMetricData on every request for a metric RequestLatency with dimensions Service, Operation, and userId (millions of users). Explain the problem and rewrite it as an EMF log that keeps userId queryable but not as a metric dimension.
<details><summary>Solution</summary>
The userId dimension creates a separate metric per user — millions of custom metrics at ~$0.30 each — plus a synchronous API call per request. Emit EMF instead:
{
  "_aws": {
    "Timestamp": 1717977600000,
    "CloudWatchMetrics": [{
      "Namespace": "Checkout",
      "Dimensions": [["Service", "Operation"]],
      "Metrics": [{ "Name": "RequestLatency", "Unit": "Milliseconds" }]
    }]
  },
  "Service": "checkout", "Operation": "Pay",
  "RequestLatency": 88,
  "userId": "u-12345"
}
Why: only Service/Operation are in Dimensions, so metric cardinality is bounded; userId stays as a high-cardinality log field for Logs Insights — rich context, bounded cost, no per-call API charge.
</details>
5. (Advanced) Design an SLO and its burn-rate alarms. For a checkout API doing ~20M requests/30 days, target 99.9% success. State the error budget in requests, and define a fast-burn page vs a slow-burn ticket.
<details><summary>Solution</summary>
Error budget = 0.1% × 20M = 20,000 allowed failures / 30 days. Alarms on budget burn rate: fast burn ≈ 14.4× (consumes ~2% of the 30-day budget in 1 hour — measured over a short 5-min/1-hr window) → page now; slow burn ≈ 3× over 6 hours → ticket. Implement with CloudWatch Application Signals SLOs, or math-expression alarms comparing observed error rate to the budgeted rate over short and long windows.
Why: alarming on burn rate (not a raw threshold) self-prioritizes urgency — a fast burn empties the budget by morning and deserves a page; a slow leak is a ticket. </details>
6. (Advanced) Harden a naive auto-remediation. An alarm triggers an SSM Automation runbook via EventBridge, but the runbook does not fix root cause, so the alarm re-fires and it runs forever. List the guardrails you would add.
<details><summary>Solution</summary>
- Idempotency — the runbook must be safe to run repeatedly and should no-op if the condition is already handled.
- Attempt cap / circuit breaker — after N executions in a window, stop auto-running and escalate to a human (Config remediation’s
MaximumAutomaticAttempts, or a counter guarding the EventBridge target). - Rate control — set SSM Automation
maxConcurrencylow andmaxErrorssmall so a bad run damages a few targets, not the whole fleet. - Least-privilege
assumeRole— the automation role grants only the exact APIs/resources it needs (with an external ID for cross-account). - Root-cause check first — branch to a playbook/human if the fix does not clear the alarm.
Why: automation must always have a path to give up and page a person; an unbounded remediation loop is itself an outage. </details>
Glossary
- Well-Architected Framework (WAF) — AWS’s best-practice guidance across six pillars, plus a free review process. In this lesson “WAF” always means this, never the Web Application Firewall.
- Pillar — one of the six lenses of the framework: Operational Excellence, Security, Reliability, Performance Efficiency, Cost Optimization, Sustainability.
- Operational Excellence — the pillar covering how you run a workload: organization, preparation, operation, and continuous improvement.
- OPS questions — the numbered best-practice questions (OPS 1–OPS 11) the review asks for this pillar.
- WAFR — Well-Architected Framework Review: a structured, questionnaire-based health check on a specific workload, run in the Well-Architected Tool.
- HRI / MRI — High-/Medium-Risk Issues surfaced by a review; the input to your improvement plan.
- Milestone — a saved, timestamped snapshot of a workload’s review in the Well-Architected Tool; the delta between milestones is provable improvement.
- Custom lens — a JSON-defined set of your own questions and risk rules (e.g. an ORR) reviewed alongside AWS’s in the Well-Architected Tool.
- Organization / Prepare / Operate / Evolve — the four best-practice areas of the pillar (who owns what / be ready before go-live / run it by procedure / get better over time).
- Runbook — a documented, ordered procedure to achieve a known outcome; matures into an SSM Automation document.
- Playbook — a branching investigation guide for diagnosing an unknown issue.
- Telemetry — the metrics, logs, traces, and events a workload emits so you can understand it.
- Monitoring vs observability — monitoring answers known questions (pre-built dashboards/alarms); observability is rich telemetry that answers new questions during a novel incident.
- SLI / SLO / error budget — the measured indicator (e.g. % fast requests), the objective/promise on it (e.g. 99.9%), and the amount of allowed unreliability (100% − SLO).
- Burn rate — how fast you are consuming the error budget; fast burn → page, slow burn → ticket.
- EMF (Embedded Metric Format) — a structured JSON log line CloudWatch reads to extract custom metrics without a per-call
PutMetricDataAPI charge, keeping high-cardinality fields as logs. - Composite alarm — a CloudWatch alarm whose state is a boolean expression over other alarms; used to page on a combination of conditions and to suppress noise.
- Canary / linear / blue-green — progressive deployment strategies that shift traffic to a new version gradually (or between two environments) so a bad change hits a fraction and can auto-roll-back.
- AppConfig — AWS service for shipping and progressively rolling out configuration/feature flags separately from code, with alarm-based rollback.
- SSM Automation — Systems Manager runbooks-as-code (schema
0.3): steps likeaws:approve,aws:executeAwsApi,aws:waitForAwsResourceProperty. - Incident Manager — Systems Manager service that orchestrates incidents: contacts, escalation plans, response plans, timelines, and post-incident analysis.
- OpsCenter / OpsItem — the aggregated backlog of operational issues (OpsItems) operators need to act on, inside Systems Manager.
- DevOps Guru — ML service that surfaces operational anomalies and likely causes.
- ADOT — AWS Distro for OpenTelemetry; vendor-neutral instrumentation exporting to CloudWatch/X-Ray.
- X-Ray / Application Signals — distributed tracing (service maps, latency) and application-level SLO/golden-signal monitoring.
- RUM / Synthetics — Real-User Monitoring (actual client experience) and synthetic canaries (scripted probes that catch problems before users do).
- MTTD / MTTR / MTBF — mean time to detect / recover / between failures.
- DORA metrics — deployment frequency, lead time for changes, change failure rate, and time to restore — the delivery-performance four.
- Toil — manual, repetitive, automatable operational work; a metric to drive down.
- COE / PIR — Correction-of-Error / Post-Incident Review: a blameless analysis producing owned, time-boxed action items.
- Game day — a rehearsed exercise (often using AWS FIS) that injects failure to validate that alarms, runbooks, and people work.
- AWS FIS — Fault Injection Service: managed chaos-engineering with experiment templates, actions, targets, and alarm-bound stop conditions.
- cfn-guard — policy-as-code that validates CloudFormation templates against rules in CI (preventive guardrail).
- AWS Config / conformance pack — continuously evaluates resource configuration against rules and can auto-remediate drift (detective + corrective); a conformance pack bundles many rules for org-wide deployment.
- Control Tower / SCP / OU — multi-account landing-zone service / Service Control Policy (org-wide guardrail) / Organizational Unit (account grouping).
- OAM (Observability Access Manager) — enables CloudWatch cross-account observability: a monitoring account with a sink, source accounts with links.
- ORR — Operational Readiness Review: the “are we ready to run this?” gate before go-live (OPS 7), ideally encoded as a custom lens.
- RACI — a responsibility matrix (Responsible, Accountable, Consulted, Informed) documenting who owns what.
- Blameless — a culture/practice that fixes systems and processes rather than assigning individual fault, so people report problems honestly.
What’s next
Part 2 of the AWS Well-Architected Framework series moves from running the workload to defending it — the Security pillar: identity and access management, detective controls, infrastructure and data protection, and incident response on AWS.