In a nutshell
DevOps is a way of working where the people who build software and the people who run it stop being two separate camps and share one goal: getting good software to real users quickly and safely, over and over. That is the whole idea. It is not a product you install, and it is not a job you hire one person to “be”. It is a set of habits, held together by automation and a few honest measurements.
Picture a restaurant. In a badly run one, the chefs cook a dish, slide it onto the pass, and never hear another word — they don’t know if it arrived cold, whether diners loved it, or that half of it came back untouched. The waiters, meanwhile, get blamed for food they never cooked. In a great restaurant the kitchen and the floor share one goal — a happy diner — they taste their own food, and they hear within seconds when something is wrong so they can fix the very next plate. DevOps is that second restaurant, applied to software: the builders (Dev) and the runners (Ops) share ownership, get fast feedback from real customers, and use every meal to get better.
Everything else in this lesson is machinery bolted onto that one idea. CALMS names the five ingredients. The infinity loop draws the never-ending cycle of build-and-run. CI/CD is the automation that turns shipping from a scary event into a boring routine. The four DORA metrics are the numbers that tell you, honestly, whether any of it is working. Don’t try to memorise the acronyms on the first pass — read for the shape of the thing, and the vocabulary will stick as you go.
Level: Beginner · Time: ~38 min
Ask ten engineers what DevOps means and you will get a job title, a Jenkins server, a Kubernetes cluster, and a YAML file. None of those is the answer. DevOps is a way of working that closes the gap between the people who build software (Dev) and the people who run it in production (Ops) — and the practices, automation and metrics that make that collaboration fast, safe and repeatable. The tools are downstream of the idea. You can buy every pipeline product on the market and still not be doing DevOps; conversely, a small team with a shell script and a culture of shared ownership often outperforms an enterprise drowning in tooling.
This lesson is the on-ramp for the whole DevOps track. By the end you will be able to explain what DevOps is and why the old wall between Dev and Ops was so expensive; you will know the CALMS model that frames a DevOps transformation; you will be able to walk the lifecycle infinity loop stage by stage; you will understand — precisely, because interviewers love this question — the difference between Continuous Integration, Continuous Delivery and Continuous Deployment; you will be able to run a value-stream mapping exercise to find where work actually gets stuck; and you will know the four DORA metrics and the Elite/High/Medium/Low tiers that turn “are we any good at this?” into a number you can track. Throughout, the three principles behind everything — flow, feedback and continual learning — keep recurring, because they are the spine of the whole discipline.
Learning objectives
After working through this lesson you will be able to:
- Define DevOps as a culture plus a set of practices, and explain the cost of the traditional Dev/Ops silo and the “throw it over the wall” anti-pattern.
- Describe the CALMS model — Culture, Automation, Lean, Measurement, Sharing — and use it as a maturity lens.
- Walk the DevOps lifecycle (plan → code → build → test → release → deploy → operate → monitor) and explain why it is drawn as an infinity loop rather than a line.
- State the exact differences between Continuous Integration, Continuous Delivery and Continuous Deployment, and identify which one a team is actually practising.
- Run a basic value-stream mapping exercise to find the real bottleneck between idea and production.
- Define the four DORA metrics and place a team in the Elite / High / Medium / Low performance bands.
- Connect everything back to the three underlying principles: flow, feedback and continual learning.
Prerequisites
You need almost nothing to start. A general familiarity with how software gets written and shipped — that code lives in a repository, that it has to be built and tested, and that it eventually runs on a server somewhere — is plenty. No prior pipeline experience, no cloud background and no programming specialism are assumed; every term is defined as it appears. This is the first stop in the DevOps Zero-to-Hero ladder, and everything that follows — YAML for pipelines, CI/CD pipeline design, deployment strategies, GitOps, DevSecOps and internal developer platforms — builds directly on the vocabulary and mental models below. If you have read the course’s Terraform or Kubernetes tracks you will already recognise the value of automation and reproducibility; this lesson gives you the framework that ties all of it together.
What DevOps is — and the wall it tears down
For most of software history, two tribes owned the lifecycle. Developers were measured on change: ship features, close tickets, move fast. Operations were measured on stability: keep the lights on, no outages, no surprises. Those incentives are in direct opposition. Developers wanted to deploy on Friday afternoon; operations wanted a change freeze. The handoff between them — developers finishing code and “throwing it over the wall” to ops to run — became the single most expensive and error-prone moment in the whole process. Ops received software they had never seen, with deployment instructions in a Word document, and were then held accountable when it failed at 2am.
This is the silo problem, and DevOps is the response to it. The core move is to make delivery and operations a shared responsibility — “you build it, you run it”, in Amazon’s famous phrasing — so that the people writing the code feel the operational consequences of their choices, and the people running it have a say in how it is built. The wall comes down. Crucially, DevOps does not mean “developers do ops” or “we fired the ops team and renamed everyone DevOps Engineer”. It means the system of work changes so the two concerns are aligned rather than adversarial.
It is worth naming what DevOps is not, because the misconceptions are everywhere:
| DevOps is NOT… | Why that’s wrong |
|---|---|
| A job title | “DevOps Engineer” exists, but DevOps is an organisational practice; one person cannot “be the DevOps”. |
| A specific tool | Jenkins, GitHub Actions, Docker and Kubernetes enable DevOps; buying them does not make you a DevOps shop. |
| Just automation | Automation is one pillar (the A in CALMS). Culture is the hard part and the part tools cannot buy. |
| The same as a CI/CD pipeline | A pipeline is an implementation of some DevOps practices, not the whole discipline. |
| A department you create | Creating a separate “DevOps team” often just builds a third silo between Dev and Ops. |
The deepest research on the topic — the Accelerate book and the annual DORA (DevOps Research and Assessment) reports — found that the organisations that adopt these ways of working ship more often and more reliably at the same time. The old belief that you must trade speed for stability turns out to be false: the best performers are better at both, because the same practices (small batches, automation, fast feedback) improve throughput and stability simultaneously.
CALMS: the five dimensions of a DevOps transformation
If “culture” sounds too fuzzy to act on, the CALMS model breaks it into five concrete dimensions. It is the standard lens for assessing how far along a DevOps journey an organisation is, and it is a frequent interview prompt.
| Letter | Dimension | What it means | What it looks like when present |
|---|---|---|---|
| C | Culture | Shared ownership, blameless attitude, collaboration over hand-offs | Dev and Ops in the same standups; blameless post-mortems; psychological safety |
| A | Automation | Remove manual, repetitive, error-prone toil from build, test and deploy | One-button builds and deploys; infrastructure as code; automated tests |
| L | Lean | Small batch sizes, eliminate waste, optimise flow (from Lean manufacturing) | Small frequent changes; work-in-progress limits; value-stream thinking |
| M | Measurement | Decide with data, not opinion; measure flow, quality and feedback | DORA metrics tracked; dashboards; SLOs; error budgets |
| S | Sharing | Share knowledge, tools, responsibility and outcomes across teams | Internal docs and platforms; pairing; communities of practice; shared on-call |
Two observations a senior practitioner will stress. First, Culture is the load-bearing letter — the other four are far easier to buy or build, and a team with great automation but a blame culture will still under-perform, because people will hide failures rather than learn from them. Second, the letters reinforce each other: Measurement without Sharing produces dashboards nobody acts on; Automation without Lean just lets you ship large, risky batches faster. Treat CALMS as a system, not a checklist.
The DevOps lifecycle: the infinity loop
DevOps work is usually drawn as an infinity loop (a sideways figure-eight) rather than a straight line or a one-way pipeline. The shape is deliberate: software delivery is continuous and cyclical, not a project with an end. What you learn from running software in production (the right-hand loop, “Ops”) feeds directly back into what you plan and build next (the left-hand loop, “Dev”). There is no finish line; you go round and round, ideally getting faster and safer each lap.
The loop has eight canonical stages. The first four are the “Dev” side, the second four are the “Ops” side, and they meet in the middle:
| Stage | Side | What happens | Typical tooling |
|---|---|---|---|
| Plan | Dev | Define what to build; backlog, requirements, design | Jira, Azure Boards, GitHub Issues |
| Code | Dev | Write the software; version control; review | Git, GitHub/GitLab, IDEs |
| Build | Dev | Compile/package the code into an artifact | Maven, npm, Docker, MSBuild |
| Test | Dev | Verify correctness and quality automatically | JUnit, pytest, Selenium, SAST/SCA |
| Release | Ops | Version and stage the validated artifact, ready to ship | Artifact repos, release pipelines, approvals |
| Deploy | Ops | Push the release into an environment (and ultimately production) | Argo CD, Helm, Spinnaker, cloud deploy |
| Operate | Ops | Run the software; manage infrastructure and scale | Kubernetes, Terraform, cloud platforms |
| Monitor | Ops | Observe behaviour, performance and incidents in production | Prometheus, Grafana, Datadog, OpenTelemetry |
The arrow from Monitor back to Plan is the most important one in the whole diagram, and the one teams most often neglect. It is the feedback loop: production telemetry, incident learnings and user behaviour become inputs to the next planning cycle. A team that ships into a black hole — deploying without monitoring, or monitoring without feeding insights back into planning — has drawn a line, not a loop, and has thrown away the compounding advantage DevOps is meant to give.
It is worth distinguishing the lifecycle (this conceptual loop — the stages of work) from a CI/CD pipeline (a concrete, automated implementation that typically spans Code → Build → Test → Release → Deploy). The lifecycle is the map; the pipeline is one vehicle that drives part of it.
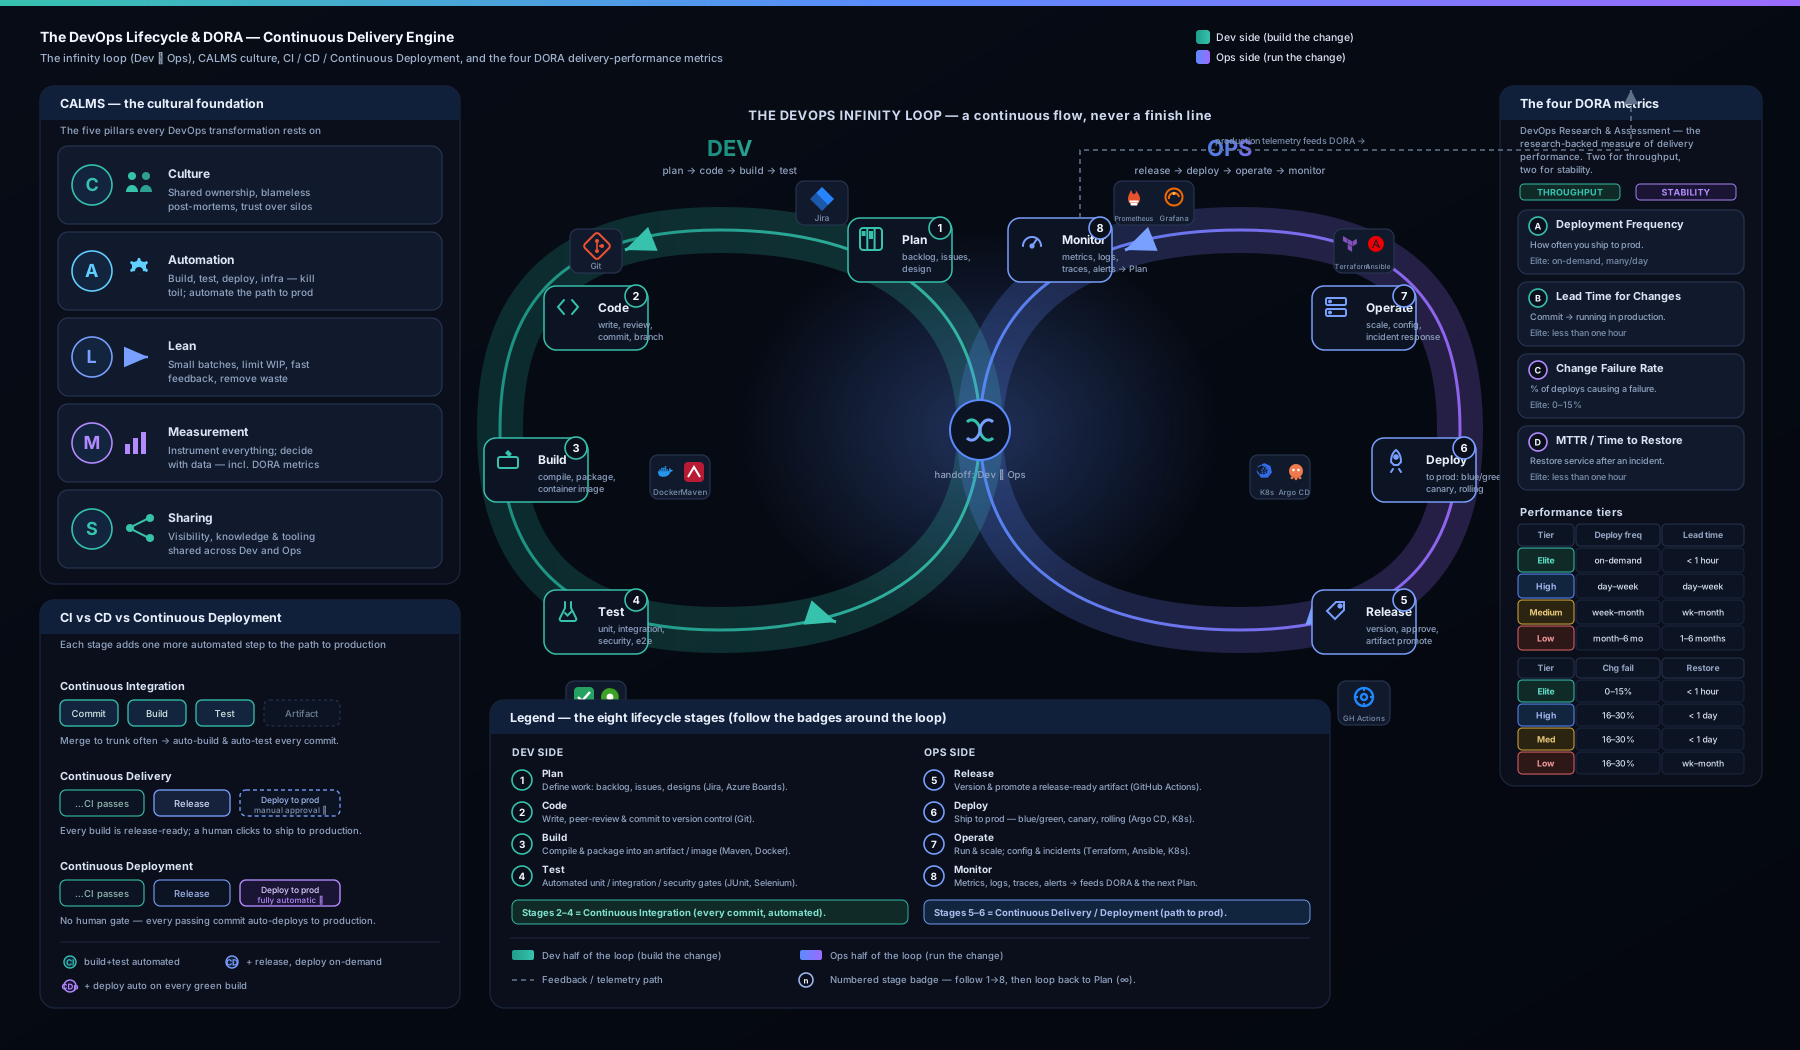
Trace the diagram above the way you would read the loop itself: start at Plan on the left, follow the eight stages around through the Dev side and into the Ops side where they meet in the middle, and arrive at Monitor — then follow the all-important feedback arrow from Monitor back to Plan that turns a dead-end line into a living loop. The four DORA metrics are overlaid on the points of the cycle they measure, so you can see where in the loop each number is actually taken.
CI vs CD vs Continuous Deployment — the distinction interviewers probe
These three terms are used loosely and incorrectly all the time, and being able to separate them cleanly is a reliable signal of seniority. They form a ladder: each builds on the one before.
Continuous Integration (CI) is the practice of every developer merging their work into a shared mainline frequently — at least daily — with every merge automatically built and tested. The point is to catch integration problems within hours instead of discovering, weeks later, that two branches are hopelessly incompatible (“merge hell”). CI is fundamentally about keeping the codebase in a known-good, always-buildable state. Its prerequisites are a version-control system, a trunk or short-lived branches, a fast automated test suite, and the team discipline to fix a broken build immediately.
Continuous Delivery (CD) extends CI: every change that passes the pipeline is automatically built, tested and packaged into a release artifact that is ready to deploy to production at any time — but the final push to production is a manual, business decision (someone clicks “deploy”). The software is always in a deployable state; you choose when to release. This is the sweet spot for the majority of organisations, especially those with regulatory sign-offs or marketing-driven release timing.
Continuous Deployment goes one step further: every change that passes all automated stages is automatically deployed to production with no human gate. There is no “deploy” button — passing the pipeline is the deploy. This demands the highest maturity: comprehensive automated testing, robust monitoring, feature flags to decouple deploy from release, and automated rollback, because there is no human in the loop to catch a bad change.
The single most useful way to hold the difference in your head:
| Build & test on every commit | Always release-ready artifact | Deploy to prod automatically | |
|---|---|---|---|
| Continuous Integration | Yes | — | — |
| Continuous Delivery | Yes | Yes | No — manual approval to release |
| Continuous Deployment | Yes | Yes | Yes — no human gate |
Note the abbreviation trap: “CD” almost always means Continuous Delivery. Continuous Deployment is the stricter, fully-automated cousin and is usually written out in full to avoid confusion. The practical difference between the two is exactly one manual approval step — but that step represents a large jump in the testing, observability and rollback maturity a team needs before it is safe to remove it.
Value-stream mapping: finding the real bottleneck
You can have a beautiful CI/CD pipeline and still take three weeks to get a one-line change into production — because the pipeline is only one segment of the journey from idea to value delivered to a user. Value-stream mapping (VSM) is a Lean technique, borrowed from manufacturing, for making that entire journey visible so you can find where time is actually lost. It is the practical expression of the Lean in CALMS and the flow principle.
The method is straightforward:
- Map every step from a customer request (or idea) to it running in production and delivering value — including the invisible ones: backlog grooming, waiting for review, waiting for QA, waiting for a release window, waiting for a change-approval board.
- For each step, record two numbers: process time (PT) — how long the work actually takes when someone is doing it — and lead time (LT) — the total elapsed time from when the step could start to when the next step begins, including all the waiting.
- Compute flow efficiency = total process time ÷ total lead time. In most unoptimised organisations this is shockingly low — often under 15% — meaning work spends the overwhelming majority of its life sitting in a queue, not being worked on.
- Attack the biggest wait, not the biggest work. The instinct is to optimise the coding or build step; the data almost always shows the bottleneck is a queue — a code review nobody picks up, a weekly release train, a manual approval that takes four days.
A simplified value stream for a typical change might look like this:
| Step | Process time (working) | Lead time (incl. waiting) | The waste |
|---|---|---|---|
| In backlog → picked up | — | 5 days | Prioritisation queue |
| Coding | 4 hours | 1 day | — |
| Waiting for code review | — | 2 days | Reviewer queue (the classic killer) |
| Build & automated tests | 20 min | 20 min | Already automated — fast |
| Waiting for QA | — | 3 days | Manual QA queue |
| Waiting for release window | — | 4 days | Weekly release train |
| Deploy | 15 min | 15 min | — |
Here the actual work is roughly half a day, but the change takes well over two weeks — a flow efficiency in the low single-digit percentages. Notice that automating the build harder buys you minutes, while killing the weekly release train and the review queue buys you days. VSM stops teams from optimising the part that feels technical and ignoring the queues that dominate the timeline. This is also exactly why DORA’s lead time for changes is such a powerful metric: it is the value stream, distilled to a single number.
The four DORA metrics
Everything above is qualitative. The DORA metrics are how you make it measurable. DORA — DevOps Research and Assessment, the research program behind the Accelerate book and the annual State of DevOps report — identified four key metrics that, together, reliably distinguish high-performing software teams from low-performing ones. Two measure throughput (speed) and two measure stability (quality) — and the central finding is that the best teams excel at both at once, demolishing the old speed-versus-stability trade-off.
| Metric | Pillar | What it measures | How it’s taken |
|---|---|---|---|
| Deployment frequency | Throughput | How often you successfully release to production | Count of successful prod deployments per unit time |
| Lead time for changes | Throughput | How fast a commit gets to production | Median time from code committed → running in prod |
| Change failure rate (CFR) | Stability | How often a deployment causes a failure | % of deployments needing a hotfix, rollback or patch |
| Failed deployment recovery time | Stability | How quickly you recover from a failed deployment | Median time from failure detected → service restored |
A few precision points that separate a strong answer from a vague one:
- Deployment frequency is about production deploys, not merges to
main. A merge is a change; a deploy is a release to users. Counting merges flatters teams that batch their releases. - Lead time for changes starts at code committed (the first commit, not the merge) and ends at running in production. It is the engineering slice of the value stream, and it is the metric VSM directly improves.
- Change failure rate has a denominator of deployments, not incidents: CFR = failed deployments ÷ total deployments. You must therefore record your successful deploys too.
- The fourth metric was historically called MTTR (mean time to restore); recent DORA reports renamed it “failed deployment recovery time” to make explicit that it measures recovery from a deployment-induced failure, not from any random infrastructure incident. A failed disk in a datacentre is a reliability concern, not a delivery one.
- Report medians (p50), not averages, for the time-based metrics. The DORA bands are about distributions, and a single 3am rollback will wreck a mean.
Crucially, you measure all four together. Optimising one in isolation invites gaming: a team told only to raise deployment frequency can ship tiny, pointless commits; a team told only to lower change failure rate can simply stop deploying. The four form a balanced scorecard — two for speed, two for safety — precisely so that improving the system, not gaming a number, is the only way to move them all in the right direction.
The DORA performance tiers: Elite, High, Medium, Low
DORA groups teams into four performance tiers based on those metrics. The exact numeric thresholds shift year to year as the whole industry improves and as the report occasionally collapses or relabels bands, so treat the figures below as representative orders of magnitude rather than gospel — what matters is the dramatic gap between tiers.
| Tier | Deployment frequency | Lead time for changes | Change failure rate | Recovery time |
|---|---|---|---|---|
| Elite | On-demand — multiple times per day | Less than one hour | 0–15% | Less than one hour |
| High | Between once per day and once per week | One day to one week | 16–30% | Less than one day |
| Medium | Between once per week and once per month | One week to one month | 16–30% | Less than one day |
| Low | Between once per month and once every six months | One to six months | 16–30%+ | Up to a week or more |
The headline that lands in interviews: Elite performers deploy roughly hundreds to thousands of times more frequently than Low performers, with lead times measured in hours rather than months, and they recover from failures faster too. The gap between Elite and Low is not a few percent — it is orders of magnitude, on both speed and stability simultaneously. That is the empirical proof behind every claim in this lesson: the practices (small batches, automation, fast feedback, shared ownership) are not just pleasant; they produce measurably, dramatically better outcomes.
The right way to use the tiers is as a direction, not a leaderboard. Find where your team honestly sits, identify the single metric holding you back, trace it to a cause in your value stream, fix that, and measure again. That loop — measure, learn, improve, re-measure — is itself the DevOps method applied to your own delivery.
The three principles underneath everything: flow, feedback, continual learning
Strip away the tools and the acronyms and DevOps rests on three principles, often called the Three Ways (from The Phoenix Project and The DevOps Handbook). Every practice in this lesson is an expression of one of them.
- Flow (the First Way) — optimise the whole left-to-right stream from Dev to the customer, not any single team’s local efficiency. Make work visible, shrink batch sizes, limit work-in-progress, and never pass defects downstream. CI, value-stream mapping and deployment frequency all serve flow.
- Feedback (the Second Way) — create fast, constant feedback from right (production) to left (development), so problems are seen and fixed at the source. Monitoring, automated tests, the Monitor→Plan arrow, change failure rate and recovery time all serve feedback. The faster the feedback, the cheaper the fix.
- Continual learning and experimentation (the Third Way) — foster a culture of blameless learning, deliberate experimentation, and treating failure as information. Blameless post-mortems, error budgets, and dedicating time to improving the system itself all serve this. This is the cultural engine that keeps the loop spinning faster over time.
Hold these three in mind and the rest of the DevOps track reads as variations on a theme: every pipeline stage, deployment strategy and platform you will build is ultimately there to improve flow, tighten feedback, or accelerate learning.
Going deeper
The fundamentals above are enough to hold a smart conversation about DevOps and to pass most junior interviews. This section is for when you want to understand why the organisational moves work, and how the discipline scales from one team to a whole engineering organisation. It is safe to skip on a first read and come back to once the basics feel comfortable.
What CI looks like as real automation
The CI vs CD section defined Continuous Integration as a practice — merge often, and build-and-test every change automatically. In a real project that practice is implemented by a CI server watching your repository. Here is a minimal, current GitHub Actions workflow that does exactly the Build → Test stages of the lifecycle on every push and pull request:
# .github/workflows/ci.yml
name: CI
on:
  push:
    branches: [main]
  pull_request:
jobs:
  build-and-test:
    runs-on: ubuntu-latest
    steps:
      - uses: actions/checkout@v4
      - uses: actions/setup-python@v5
        with:
          python-version: "3.12"
      - name: Install dependencies
        run: pip install -r requirements.txt
      - name: Run tests
        run: pytest -q
Read it top-down. on: says when to run — on every push to main, and on every pull request, so a broken change is caught before it merges. runs-on: is the throwaway machine the CI server spins up fresh each time. Each - uses: pulls in a reusable, versioned action (actions/checkout@v4 fetches your code; actions/setup-python@v5 installs Python), and each - run: is a shell command. That is the whole idea of CI in one file: the same Build and Test steps you would otherwise run by hand, executed automatically on every change, giving the team fast feedback and keeping main always green. Continuous Delivery would add a packaging step (build a versioned artifact or container image); Continuous Deployment would add a final deploy job with no human gate. Note that secrets — registry credentials, tokens, keys — never live in this file; they are stored in the repository’s encrypted secrets and referenced as ${{ secrets.NAME }}. The discipline of merging small changes into a shared trunk that this workflow rewards is covered in depth in Trunk-Based Development, Feature Flags & Migration.
Conway’s Law: your architecture will look like your org chart
In 1967 Melvin Conway observed that “any organization that designs a system will produce a design whose structure is a copy of the organization’s communication structure.” The practical meaning is uncomfortable: if Dev and Ops are separate departments that talk to each other through tickets, the software they produce will have a hard, ticket-shaped seam between “build” and “run” — the very wall DevOps is trying to remove. This is why reorganising teams is often a prerequisite for changing architecture, and why the Inverse Conway Maneuver — deliberately shaping teams to mirror the architecture you want (for example, small teams that each own one service end-to-end) — is a standard DevOps move. Silos are not merely a morale problem; they get baked into the code.
Team Topologies: four team types, three interaction modes
“Shared ownership” is a nice slogan; Team Topologies (Matthew Skelton and Manuel Pais) turns it into an operating model. It argues that a fast-flow organisation needs only four fundamental team types:
- Stream-aligned team — the default: a team aligned to a single valuable stream of work (a product, a customer journey) that both builds and runs it. Most teams should be this shape.
- Platform team — builds an internal product (the platform) that makes stream-aligned teams faster by turning hard infrastructure into self-service.
- Enabling team — a temporary “coaching” team of specialists that helps a stream-aligned team adopt a new capability (say, test automation), then withdraws.
- Complicated-subsystem team — owns a part that needs deep specialist knowledge (a video codec, a pricing engine) so the stream-aligned teams don’t all have to.
And three ways those teams should interact:
- Collaboration — two teams work closely for a short, defined time to figure something out (high bandwidth, high cost — use sparingly).
- X-as-a-Service — one team consumes something another provides with minimal talking (the platform model).
- Facilitating — an enabling team helps another team learn a new skill.
The load-bearing concept is cognitive load: a team can only hold so much in its collective head. Piling “build the feature and master Kubernetes, networking, security, and observability” onto every product team crushes flow. Team Topologies is the map for distributing that load — which leads straight to platform engineering.
Platform engineering: DevOps at scale
“You build it, you run it” is liberating for one team and exhausting for fifty — you end up with fifty teams each reinventing CI, secrets management, monitoring and Kubernetes YAML, badly. Platform engineering is the industry’s answer: a platform team treats the paved road to production as a product, and its users are the other engineers. The deliverable is an Internal Developer Platform (IDP) offering golden paths — opinionated, self-service, well-supported routes to do the common things (spin up a service, get a database, ship to prod) without filing a ticket or having to learn the whole stack.
Nuances a senior engineer will insist on:
- The platform is self-service, not a gate. The moment the platform team has to approve deploys, you have rebuilt the ops silo under a new name. Golden paths are paved, not walled — teams can step off the path when they genuinely must.
- It is a product, not a project. It has users, a roadmap and adoption metrics; if engineers route around it, that is a product failure to be fixed, not a compliance problem to be enforced.
- It “shifts down” complexity rather than shifting it left onto every team. The hard, shared parts — multi-tenancy, policy, secrets wiring, observability plumbing — live once in the platform.
- Platform engineering is DevOps culture applied to the developer experience, not a repudiation of it. (Backstage, the CNCF’s open-source developer portal, is a common IDP starting point.)
The journey from a single pipeline up to a full platform is the subject of its own lesson, Architecting the DevOps Ladder: Single Pipeline to Platform.
SRE, error budgets, and the “NoOps” myth
Two ideas people routinely confuse with DevOps:
- SRE (Site Reliability Engineering) is Google’s specific implementation of the DevOps philosophy — famously summarised as “class SRE implements interface DevOps”. It makes reliability an engineering discipline with hard numbers: SLIs (what you measure — request latency, error rate), SLOs (the target — e.g., 99.9% of requests under 300 ms) and the crucial error budget = 1 − SLO. If you are inside budget you ship fast; if you burn it, you slow down and invest in reliability. The error budget converts the old Dev-versus-Ops fight (“ship!” versus “stability!”) into a single shared number both sides manage together. SRE also caps toil — manual, repetitive operational work — at roughly 50% of an engineer’s time so that automation keeps winning. The incident and on-call side of this is expanded in SRE: Incident Management, Postmortems, On-call & Toil.
- “NoOps” — the notion that serverless or fully-managed platforms mean “no operations” — is a misconception. The operational work does not vanish; it moves (into the platform, into the cloud provider, or into the application code). Someone still owns reliability, cost and incidents. DevOps is shared ops, not no ops.
Blameless postmortems, done properly
A blameless postmortem is not “be nice and don’t name names”. It rests on a specific belief: given the information, incentives and tools the engineer had at the time, their action was reasonable — so the defect lives in the system, not the person. In practice that means:
- Fight hindsight bias. “They should have known the disk was full” is only obvious after the fact. Reconstruct what was actually visible in the moment, on the actual dashboards.
- Look for contributing factors, not a single root cause. Real incidents have several (a missing alert and a confusing runbook and a risky manual step). “Human error” is where the investigation starts, never where it ends.
- Produce action items with owners and dates that harden the system — add the alert, add the guardrail, automate the manual step — and track them to done.
- Blameless is not accountability-free. Teams still own fixing the contributing factors; what is off the table is punishing an individual for a systemic failure. Punishment simply teaches people to hide incidents, which is precisely how small failures grow into big ones.
The economics: small batches, Little’s Law, and the J-curve
Why does “ship small and often” keep winning? Little’s Law from queueing theory says that average lead time = average work-in-progress ÷ average throughput. Cut work-in-progress — smaller batches, fewer things in flight — and lead time falls mathematically, no heroics required. Small batches also shrink risk: a 10-line change that breaks is trivial to find and roll back; a 10,000-line quarterly release that breaks is an archaeology project. This is the quantitative core underneath the word “flow”.
Two honest caveats round out the advanced picture:
- The J-curve. Transformations often get worse before they get better — new automation and process add friction before they pay off. Accelerate’s data shows teams commonly dip partway through the journey; leaders who lose nerve at the trough never reach the upside.
- Goodhart’s Law: “when a measure becomes a target, it ceases to be a good measure.” This is exactly why DORA is four metrics, tracked at the team/service level and never used to rank individuals. DORA’s own research has since added a fifth signal — operational reliability — and looks at factors such as documentation quality and platform investment, precisely because delivery performance is a system property, not a personal scoreboard.
Hands-on lab
You do not need any cloud account or paid tooling for this lab — only Git (free) and a terminal. The goal is to experience the smallest possible CI loop and to calculate DORA-style numbers by hand, so the concepts stop being abstract.
Part A — a one-command “pipeline” locally. We will simulate the Build → Test stages of the lifecycle with a tiny script, so you can feel what CI automates.
-
Create a working folder and initialise a repository:
mkdir devops-onramp && cd devops-onramp git init -
Create a trivial “application” — a shell function — and a test for it:
cat > app.sh <<'EOF' add() { echo $(( $1 + $2 )); } EOF cat > test.sh <<'EOF' . ./app.sh result=$(add 2 3) if [ "$result" -eq 5 ]; then echo "PASS"; else echo "FAIL: got $result"; exit 1; fi EOF -
Create a local “CI pipeline” — the script a CI server would run on every commit — that builds (here, just syntax-checks) and tests:
cat > ci.sh <<'EOF' set -e echo "== Build (syntax check) =="; bash -n app.sh && echo "build ok" echo "== Test =="; bash test.sh echo "== Pipeline green ==" EOF chmod +x ci.sh -
Run your “pipeline”:
./ci.shExpected output:
== Build (syntax check) == build ok == Test == PASS == Pipeline green == -
Now practise Continuous Integration by hand: make a change, run the pipeline before committing, and only commit if it is green — exactly what a real CI server enforces automatically.
git add app.sh test.sh ci.sh
./ci.sh && git commit -m "feat: add() with passing CI"
Validation:
git log --onelineshows one commit, and it only exists because the pipeline passed. Try breakingapp.sh(e.g. change the+to-), re-run./ci.sh, and watch it exit withFAIL— that red build is the fast feedback CI exists to give you.
Part B — calculate DORA metrics by hand. Imagine the last 30 days of one service: 60 production deployments, of which 6 needed a hotfix; the median commit-to-prod time was 3 hours; the median recovery from those 6 failures was 25 minutes.
- Deployment frequency = 60 / 30 days = 2 per day → High/Elite throughput.
- Lead time for changes = 3 hours → comfortably High, near Elite.
- Change failure rate = 6 / 60 = 10% → Elite stability.
- Recovery time = 25 minutes → Elite.
Write those four numbers down and place the team in the tier table above. This is the entire DORA practice in miniature: capture four signals, compute four numbers, locate yourself, and decide what to improve.
Cleanup: there is nothing to tear down — just remove the practice folder if you wish:
cd .. && rm -rf devops-onramp
Cost note: zero. This lab uses only Git and a shell, both free, and runs entirely on your machine.
Practice challenges
Six graded exercises, from beginner to advanced. Try each before opening its solution — struggling for a minute first is what makes the answer stick. All of them can be done on paper; none needs a cloud account.
Challenge 1 (beginner) — name the practice. A team merges every change to main, and each merge automatically triggers a build and the full test suite. A release manager then clicks a “Deploy to production” button every Friday to ship whatever has accumulated. Which of CI, Continuous Delivery or Continuous Deployment is this team practising?
<details> <summary>Solution</summary>
Continuous Delivery. Every change is automatically built, tested and kept release-ready, but a human still makes the final decision to deploy (the Friday button click). Why: the presence of an automatic build-and-test on every merge rules out “just committing”; the manual approval before production rules out Continuous Deployment (which has no human gate). </details>
Challenge 2 (beginner) — spot the anti-pattern. A company reorganises by creating a central “DevOps team” that owns every pipeline and is the only team allowed to push to production; product teams must file a ticket to get anything deployed. Which CALMS dimensions does this violate, and what has the company accidentally built?
<details> <summary>Solution</summary>
It violates Culture and Sharing (and undermines Lean/flow). The company has built a third silo — a new wall between Dev and Ops — and turned a would-be platform team into a gate. Why: DevOps distributes ownership into delivery teams; a central team that must approve every deploy recreates the exact hand-off DevOps exists to remove. A platform team should enable self-service, not gate it. </details>
Challenge 3 (intermediate) — compute the DORA tier. Over the last 30 days a service had 22 production deployments; 4 of them required a rollback; the median time from commit to production was 2 days; and the median recovery from those failures was 5 hours. Compute all four DORA metrics and assign a performance tier.
<details> <summary>Solution</summary>
- Deployment frequency = 22 / 30 ≈ 0.73/day (roughly one every 1.4 days) → between once per day and once per week → High.
- Change failure rate = 4 / 22 ≈ 18% → in the 16–30% band → High.
- Lead time for changes = 2 days → one day to one week → High.
- Failed deployment recovery time = 5 hours (< 1 day) → High.
The team is solidly High across all four. Why: computing each metric against the representative tier table lands every one in the High band — a consistent picture, which is the point of tracking all four together. </details>
Challenge 4 (intermediate) — value-stream math. A change moves through these steps: backlog wait 4 days; coding 6 h work / 1 day elapsed; waiting for review 3 days; build + automated tests 15 min; waiting for QA 2 days; waiting for the release window 5 days; deploy 10 min. Estimate flow efficiency, name the single biggest wait, and state which of the Three Ways your fix serves.
<details> <summary>Solution</summary>
Total process time ≈ 6 h + 15 min + 10 min ≈ 6.4 hours (~0.27 day). Total lead time ≈ 4 + 1 + 3 + 2 + 5 days + 25 min ≈ 15 days. Flow efficiency ≈ 0.27 / 15 ≈ 1.8% — under 2%. The single biggest wait is the 5-day release window; the next is the 4-day backlog and the 3-day review queue. Fixing the release window (deploy on demand instead of a weekly train) serves the First Way — Flow. Why: optimising the 15-minute build saves minutes; killing the 5-day release train saves days — attack the biggest queue, not the fastest step. </details>
Challenge 5 (advanced) — design the team topology. Three product teams all wait on one overwhelmed central infrastructure team to provision environments and wire up pipelines; that central team is a bottleneck, and the product teams are drowning in Kubernetes and networking detail. Using Team Topologies, propose team types and interaction modes that would restore flow.
<details> <summary>Solution</summary>
Turn the central infrastructure team from a gating ops team into a platform team that offers an Internal Developer Platform as X-as-a-Service — self-service golden paths for environments, pipelines and deploys — so the three stream-aligned product teams stop filing tickets and their cognitive load drops. Where a product team needs to learn a new capability (say, progressive delivery), spin up a temporary enabling team interacting via Facilitating, then disband it. Why: the bottleneck is a hand-off queue; converting it to self-service (X-as-a-Service) removes the queue, and shifting infrastructure complexity down into the platform frees the product teams to own their streams end-to-end. </details>
Challenge 6 (advanced) — defuse the gamed metric. A VP mandates: “Increase deployment frequency 5× by next quarter.” Explain how a team could hit that target while making delivery worse, and rewrite the goal so it cannot be gamed.
<details> <summary>Solution</summary>
A single-metric target is trivially gamed: split one real change into five deploys, or ship empty/no-op commits, and deployment frequency rises 5× while nothing improves — or even worsens if quality slips. Rewrite it as a balanced goal with guardrails: “Raise deployment frequency 5× while holding change failure rate at or below today’s, holding or reducing lead time, and keeping recovery time flat.” Why: the four DORA metrics are a deliberately balanced set (two speed, two stability); pinning the two stability metrics as guardrails and watching lead time means the only way to move deployment frequency is to genuinely shrink batch size — defeating Goodhart’s Law. </details>
Common beginner mistakes
These are conceptual traps — wrong mental models that quietly steer good effort in the wrong direction. They are distinct from the symptom→cause→fix table in the next section; here the fix is a corrected way of thinking.
-
“We’ll adopt DevOps by buying the right tools.” The misconception is that DevOps is a technology purchase. Tools are the A (Automation) in CALMS — one pillar of five. Bolt world-class automation onto a blame culture and people will still hide failures and guard their silos. Right model: DevOps is a change to the system of work; culture is the load-bearing part, and tools amplify whatever culture you already have.
-
“We need a DevOps team to own DevOps.” Creating a separate team to “do the DevOps” feels organised, but it usually builds a third silo between Dev and Ops and turns that team into a new gate. Right model: embed delivery-and-operations ownership inside product teams; if you need a shared team, make it a platform team that enables self-service, never one that approves every deploy.
-
“We have a CI server, so we’re doing CI.” Running Jenkins or GitHub Actions on long-lived feature branches that merge once a fortnight is not Continuous Integration — it is automated builds on top of “merge hell”. Right model: CI is a practice — integrate small changes into a shared trunk at least daily, keep the build green, and fix red immediately. The server only automates a discipline the team has to actually follow.
-
“CD means Continuous Deployment.” People use “CD” to mean the fully-automated, no-human-gate version. By convention CD = Continuous Delivery (always release-ready, human decides when); the gateless variant is spelled out as Continuous Deployment. Right model: the difference between them is exactly one manual approval step — and a large jump in the testing, monitoring and rollback maturity needed to safely remove it.
-
“More deployments is always better.” Chasing deployment frequency alone can wreck quality — you can always deploy more by deploying more carelessly. Right model: the four DORA metrics move together; pair every throughput metric with a stability metric, and treat a rising change failure rate as the brake on a rising deploy rate.
-
“DORA scores tell us who our best engineers are.” Using delivery metrics to rank or reward individuals is the fastest way to get them gamed. Right model: DORA measures the team/service system, not people; it is a compass for improving the way of working, and the moment it becomes a personal target it stops measuring anything real (Goodhart’s Law).
-
“The pipeline is slow, so that’s our bottleneck.” Engineers instinctively optimise the technical step they can see. Right model: map the whole value stream first — the bottleneck is almost always a queue (code review, manual QA, a weekly release window), and shaving the already-fast build buys minutes while draining a queue buys days.
-
“Blameless means nobody is accountable.” Managers sometimes resist blameless postmortems fearing they excuse mistakes. Right model: blameless targets the system, not the person — the team still owns fixing the contributing factors; what is removed is punishing an individual, which only teaches people to hide incidents until they become disasters.
Common mistakes & troubleshooting
| Symptom | Cause | Fix |
|---|---|---|
| “We adopted DevOps but nothing improved” | Bought tools, never changed the culture or the hand-offs | Start with the C in CALMS — shared ownership, blameless post-mortems — before more automation |
| Created a separate “DevOps team” and silos got worse | A new team became a third wall between Dev and Ops | Embed responsibility in delivery teams; a platform team enables, it does not gate |
| Deployment frequency looks great but quality fell | Optimised one DORA metric in isolation | Always track all four; pair every throughput metric with a stability metric |
| Pipeline is fast but changes still take weeks | The bottleneck is a queue, not the pipeline | Run a value-stream map; attack the biggest wait (review/QA/release window), not the build |
| DORA dashboard counts merges as deployments | Conflated a change event with a release event | Emit an explicit deploy event from the deploy job; count production releases only |
| “Continuous Deployment” claimed, but there’s a manual approval | Confused Delivery with Deployment | If a human clicks deploy, it is Continuous Delivery; Deployment has no gate |
| Averages make metrics swing wildly | Using mean for lead time / recovery | Report the median (p50); one outlier wrecks a mean |
| Post-mortems hunt for who to blame | Blame culture; people hide failures | Make post-mortems blameless; the system, not the person, is the defect |
Best practices
- Lead with culture. Shared ownership and psychological safety make every other practice stick; tooling bolted onto a blame culture fails.
- Shrink batch sizes. Small, frequent changes are easier to review, test, deploy and roll back. Large batches are where risk hides.
- Automate the repetitive path. Builds, tests and deploys should be one button (or zero buttons). Reserve human judgement for genuine decisions, not toil.
- Make work visible. A board, a value-stream map and DORA dashboards turn invisible queues and pain into things the team can actually fix.
- Measure the system, not individuals. Use DORA at the team/service level to improve the way of working, never to rank or punish people — that only teaches gaming.
- Close the loop. The Monitor→Plan feedback arrow is the whole point; feed production learnings into the next cycle, every cycle.
- Practise blameless post-mortems. Treat every failure as information about the system, and capture the learning where the team will see it.
Security notes
DevOps done well makes software more secure, not less — but only if security is built into the loop rather than bolted on at the end. A few foundational points that the later DevSecOps lessons expand on:
- Shift security left. Move security checks (dependency scanning/SCA, static analysis/SAST, secret scanning) into the pipeline at Build and Test, so vulnerabilities are caught in minutes by the same fast-feedback loop that catches bugs — not in a manual audit weeks later. This is the origin of the term DevSecOps: security as a shared responsibility across the whole loop.
- Never put secrets in code or pipeline files. Credentials, tokens and keys belong in a secrets manager or short-lived OIDC-issued credentials, never in a Git repository or a YAML file. (The course’s IaC and pipeline lessons cover keyless OIDC and dynamic secrets in depth.)
- Automation is a privilege boundary. A CI/CD pipeline that can deploy to production is one of the most powerful identities in your estate; protect it with least-privilege credentials, required reviewers on the deploy step, and an audit trail.
- Speed aids security. A short lead time and fast recovery mean you can patch a vulnerability and get the fix to production in hours rather than months — making the throughput metrics a security asset, not a risk.
Interview & exam questions
1. Is DevOps a tool, a team, or a culture? Primarily a culture — a way of working that unites Dev and Ops around shared ownership of delivery and operations — supported by practices (CI/CD, IaC, monitoring) and automation/tools. It is not a single tool, and creating an isolated “DevOps team” usually backfires by adding a third silo.
2. What does CALMS stand for, and which letter is hardest? Culture, Automation, Lean, Measurement, Sharing. Culture is the hardest and most important — the other four can be bought or built, but without a collaborative, blameless culture they under-deliver.
3. Why is the DevOps lifecycle drawn as an infinity loop? Because delivery is continuous and cyclical, not a project with an end. Learnings from running software in production (Monitor) feed back into Plan, so the loop never closes — you iterate forever, ideally faster each lap.
4. Explain the difference between Continuous Integration, Continuous Delivery and Continuous Deployment. CI: every commit is automatically built and tested against a shared mainline. Continuous Delivery: every passing change is also packaged into a release artifact that is always ready to deploy, but the production release is a manual decision. Continuous Deployment: every passing change is automatically deployed to production with no human gate. The difference between the last two is exactly one manual approval step.
5. “CD” — Delivery or Deployment? By convention CD = Continuous Delivery. Continuous Deployment is the stricter, fully-automated variant and is usually spelled out to avoid ambiguity.
6. Name the four DORA metrics and which pillar each belongs to. Deployment frequency and lead time for changes (throughput/speed); change failure rate and failed deployment recovery time (formerly MTTR) (stability/quality).
7. Why must you track all four DORA metrics together? Because optimising one in isolation invites gaming — you can raise deployment frequency with trivial commits, or lower change failure rate by simply not deploying. The four form a balanced scorecard (two speed, two stability) so that only genuinely improving the system moves them all.
8. What does DORA’s central finding say about speed versus stability? That the trade-off is false. Elite performers are better at both — they deploy far more often and fail less and recover faster — because small batches, automation and fast feedback improve throughput and stability simultaneously.
9. What is value-stream mapping and what does it usually reveal? A Lean technique that maps every step from idea to production, recording process time and waiting time for each. It usually reveals that the bottleneck is a queue (code review, manual QA, a release window) rather than the actual engineering work, and that flow efficiency is shockingly low (often well under 15%).
10. What is the most-neglected arrow in the lifecycle, and why does it matter? The Monitor → Plan feedback arrow. Without it you ship into a black hole and lose the compounding learning that makes DevOps pay off — you have drawn a line, not a loop.
11. What are the Three Ways? Flow (optimise the whole left-to-right stream), Feedback (fast feedback from production back to development), and Continual learning/experimentation (a blameless culture of improvement). Every DevOps practice serves one of them.
12. How would you measure whether a DevOps initiative is actually working? Track the four DORA metrics at the team/service level over time and watch the trend. Improvement in throughput and stability together is the signal; movement in only one (or gaming) is not.
13. What is Conway’s Law, and how do DevOps teams use it deliberately? Conway’s Law says a system’s design mirrors the communication structure of the organisation that built it — separate Dev and Ops departments produce a hard build/run seam in the software. Teams exploit this with the Inverse Conway Maneuver: shape teams to match the architecture you want (small teams owning a service end-to-end) so the desired design falls out naturally.
14. What problem does platform engineering solve, and how is it different from a central ops team? It solves the “you build it, you run it” tax at scale — fifty teams each reinventing CI, secrets and monitoring. A platform team offers an Internal Developer Platform with self-service golden paths as a product. The critical difference from an old central ops team is that the platform enables self-service; it does not gate deploys. The moment it must approve every release, it has become a new silo.
Quick check
- True or false: buying a CI/CD tool means your organisation is “doing DevOps”.
- Which CALMS letter is generally considered the hardest and most important?
- In one sentence, what is the difference between Continuous Delivery and Continuous Deployment?
- Which two DORA metrics measure stability rather than throughput?
- In a value-stream map, where is the bottleneck almost always found?
Answers
- False. Tools enable DevOps but do not constitute it; culture and practices are the substance.
- Culture (the C).
- Continuous Delivery keeps every change ready to release but requires a manual approval to deploy to production; Continuous Deployment deploys every passing change automatically with no human gate.
- Change failure rate and failed deployment recovery time (MTTR).
- In a queue / waiting step (e.g. code review, manual QA, or a release window) — not in the active engineering work.
Exercise
Pick a real change you or your team shipped recently — anything from a feature to a config tweak. Then:
- Map its value stream. List every step from “idea/ticket created” to “running in production and delivering value”, including all the waiting. For each step, estimate the process time (active work) and the lead time (elapsed, including waiting).
- Compute flow efficiency (total process time ÷ total lead time). Be honest — most people are surprised how low it is.
- Identify the single biggest wait and write one concrete change that would shrink it (e.g. “review SLA of 4 hours”, “deploy on demand instead of the Thursday train”).
- Estimate your four DORA metrics for that service over the last month and place the team in a tier.
- Write a short paragraph: which DORA metric is your weakest, which value-stream queue is most responsible for it, and which of the Three Ways (flow, feedback, learning) your proposed fix serves. This is exactly the reasoning a senior engineer brings to a delivery retrospective.
Certification mapping
This lesson maps to the foundational, vendor-neutral DevOps knowledge that recurs across certifications:
- DevOps Institute — DevOps Foundation: directly covers CALMS, the Three Ways, CI/CD definitions, value-stream mapping and metrics — this lesson is core preparation.
- AWS Certified DevOps Engineer – Professional (DOP-C02), Microsoft Azure DevOps Engineer Expert (AZ-400), Google Cloud Professional DevOps Engineer: each assumes fluency in the CI/CD distinctions, the lifecycle, and DORA-style measurement before diving into vendor tooling.
- PeopleCert / DevOps Institute DevSecOps Foundation: builds on the “shift security left” idea introduced in the security notes.
The vocabulary here — CALMS, the infinity loop, CI vs CD vs Continuous Deployment, the four DORA metrics and tiers — appears in the opening, conceptual questions of essentially every DevOps exam.
Glossary
- DevOps — a culture and set of practices uniting software development and operations around shared, fast, reliable delivery.
- CALMS — Culture, Automation, Lean, Measurement, Sharing; the five-dimension model for assessing DevOps maturity.
- The Three Ways — Flow, Feedback, and Continual learning/experimentation; the underlying principles of DevOps.
- DevOps lifecycle — the cyclical (infinity-loop) flow of plan → code → build → test → release → deploy → operate → monitor.
- Continuous Integration (CI) — frequently merging to a shared mainline with automated build and test on every commit.
- Continuous Delivery (CD) — keeping every change in an always-deployable state, releasing to production by a manual decision.
- Continuous Deployment — automatically deploying every change that passes the pipeline, with no human gate.
- CI/CD pipeline — an automated implementation of (part of) the lifecycle, typically spanning code → build → test → release → deploy.
- Value-stream mapping (VSM) — a Lean technique to visualise every step from idea to delivered value and find the real bottleneck.
- Flow efficiency — process (active) time ÷ total lead time; how much of a change’s life is work versus waiting.
- DORA — DevOps Research and Assessment; the research program behind the Accelerate findings and State of DevOps reports.
- Deployment frequency — how often you successfully release to production (a throughput metric).
- Lead time for changes — median time from code committed to running in production (a throughput metric).
- Change failure rate (CFR) — percentage of deployments that cause a failure requiring remediation (a stability metric).
- Failed deployment recovery time — median time to recover from a failed deployment, formerly MTTR (a stability metric).
- Performance tiers — DORA’s Elite / High / Medium / Low bands grouping teams by their four metrics.
- Blameless post-mortem — an incident review that treats failure as information about the system, not fault of a person.
- You build it, you run it — Amazon’s phrase for shared Dev/Ops ownership: the team that writes a service also operates it in production.
- Conway’s Law — the observation that a system’s design mirrors the communication structure of the organisation that built it.
- Inverse Conway Maneuver — deliberately shaping teams to match the architecture you want, so that architecture emerges naturally.
- Team Topologies — an operating model of four team types (stream-aligned, platform, enabling, complicated-subsystem) and three interaction modes (collaboration, X-as-a-Service, facilitating).
- Cognitive load — the total amount a team must hold in mind; keeping it low (often via a platform) is essential for fast flow.
- Platform engineering — treating the internal path to production as a self-service product; DevOps applied at organisational scale.
- Internal Developer Platform (IDP) — the self-service product a platform team builds so other engineers can ship without tickets.
- Golden path — an opinionated, well-supported, self-service route through the platform for a common task (paved, not walled).
- SRE (Site Reliability Engineering) — Google’s concrete implementation of DevOps that engineers reliability with SLIs, SLOs and error budgets.
- SLI / SLO — Service Level Indicator (what you measure) and Service Level Objective (the target you commit to).
- Error budget — 1 − SLO; the allowed amount of unreliability that lets teams balance shipping speed against stability.
- Toil — manual, repetitive, automatable operational work; SRE caps it (~50%) so automation keeps winning.
- NoOps — the misconception that managed/serverless platforms eliminate operations; the work moves, it does not vanish.
- Little’s Law — lead time = work-in-progress ÷ throughput; the queueing-theory basis for why smaller batches ship faster.
- J-curve — the common dip in performance partway through a DevOps transformation before the gains arrive.
- Goodhart’s Law — “when a measure becomes a target, it ceases to be a good measure”; why DORA is four team-level metrics, never an individual score.
Next steps
You now have the conceptual spine of DevOps: the culture and CALMS, the lifecycle loop, the CI/CD ladder, value-stream thinking, and the DORA metrics that tell you whether any of it is working. The next lesson, YAML for DevOps: Pipelines, Anchors, Templates & the Gotchas (yaml-for-devops-pipelines-anchors-templates-jinja), grounds all of this in the language every pipeline and manifest is written in — because before you can build a CI/CD pipeline, you need to read and write YAML without falling into its famous traps. From there the track moves into CI/CD Pipeline Design (cicd-pipeline-design-stages-gates-artifacts) and Deployment Strategies (devops-deployment-strategies-rolling-bluegreen-canary-flags), where the practices in this lesson become concrete, running pipelines.