In a nutshell
Picture a large office building — that is your Kubernetes cluster. Every floor is a node, and on each floor you post one facilities person: the node Agent. Their job is local and physical — read that floor’s power and water meters (host and container metrics), empty the bins and keep a copy of every memo (logs), and take messages from the people actually working there (traces from the app pods on that node). One per floor, doing floor-level work. In Kubernetes terms that “one per node” shape is a DaemonSet.
Now, there is information no single floor owns: the master tenant directory, the fire-safety status of the whole building, the live headcount. You do not want every floor’s facilities person phoning building management independently for that — hundreds of calls would swamp the front desk. So you appoint one building manager: the Cluster Agent. It asks building management (the Kubernetes API server) once, then briefs every floor. It also handles building-wide jobs no single floor owns (cluster checks), and answers HR’s “should we hire more staff?” question so the building can grow itself (external metrics for autoscaling). Everything the two of them gather is couriered to head office — the Datadog backend — over one secure line.
That division of labour is the whole idea, and it is why this is not “just install an agent.” The node Agent does per-host work; the Cluster Agent does per-cluster work and shields the API server from a stampede. A thin controller called the Datadog Operator hires and supervises both from a single instruction sheet (a DatadogAgent custom resource — a Kubernetes object type added by the Operator, in the CRD / controller pattern). Change the sheet, the Operator rearranges the staff to match.
Why a beginner should care: observability only pays off when a trace (what one request did), the metrics under it (how the host and pod were doing at that moment), and the logs it emitted all line up on one screen. Getting them to line up is not magic — it is three tiny tags (env, service, version) stamped consistently, plus the two-agent topology above. Get those right and “why was checkout slow at 14:32?” becomes a two-minute answer instead of a war room.
Level: Intermediate · Time: ~34 min
After this lesson you can:
- Explain the node Agent / Cluster Agent split and say exactly which one collects each signal — and why the split protects the API server.
- Stand up the Datadog Operator, a node Agent DaemonSet, and an HA Cluster Agent from one declarative
DatadogAgentresource. - Turn on metrics, APM traces, and pod log collection together, and prove all three correlate through unified
env/service/versiontagging. - Use Autodiscovery annotations to configure an integration (and its log parsing) without ever editing the Agent.
- Auto-inject a language tracer with the admission controller instead of rebuilding images, and autoscale a workload on a Datadog query via
DatadogMetric. - Keep the whole thing cheap and safe: control tag cardinality, split the API/app keys, and keep credentials out of git.
A payments platform runs ~40 services across three EKS clusters, and the on-call rotation has the same complaint every week: when checkout latency spikes, nobody can say in under ten minutes whether it is the database, a noisy neighbour pod, a downstream API, or a bad deploy. Metrics live in one tool, traces in another, and pod logs are a kubectl logs lottery that vanishes the moment a pod restarts. The mandate from the new head of SRE is blunt: one pane of glass where a trace, the host metrics under it, and the exact log lines for that request all line up — and it has to be deployable by Terraform and survive a node recycle. This guide walks through standing that up with Datadog on Kubernetes the way it should be done in production: the Datadog Operator managing a node-level Agent DaemonSet and a Cluster Agent, wired for cluster metrics, APM traces, and pod log collection with Autodiscovery and consistent tagging.
We will use the Operator rather than the raw Helm chart or hand-rolled manifests because it gives you a single declarative DatadogAgent custom resource, reconciled continuously, that a GitOps tool can own end to end. Dynatrace is the obvious alternative in this space and many shops run it; here Datadog is the chosen APM/observability backend, and everything below assumes that decision is made.
Prerequisites
- A Kubernetes cluster, v1.27+, with
kubectlandhelmv3.12+ configured against it. Examples assume EKS but call out where AKS/GKE differ. - Cluster-admin (the install creates RBAC, a
CustomResourceDefinition, and privileged DaemonSet pods). - A Datadog account plus an API key and an app key (the app key is what the Cluster Agent uses for cluster-level features and the External Metrics provider).
- Your Datadog site value —
datadoghq.com(US1),datadoghq.eu(EU),us3.datadoghq.com,us5.datadoghq.com, etc. Using the wrong site is the single most common reason “nothing shows up.” - Helm and Terraform on the workstation or CI runner. Identity to the cluster comes from your IdP — Okta or Entra ID federated to the cloud provider — so engineers assume a role rather than holding static kubeconfig credentials.
- A secrets backend. We store the Datadog keys in HashiCorp Vault and project them into the cluster, never in a plaintext manifest or a committed values file.
- New to the underlying pieces? The Operator model rests on CRDs, controllers & the operator pattern; the APM wiring uses the downward API; auto-injection uses admission webhooks. Skim whichever is unfamiliar and the rest reads easily.
Target topology
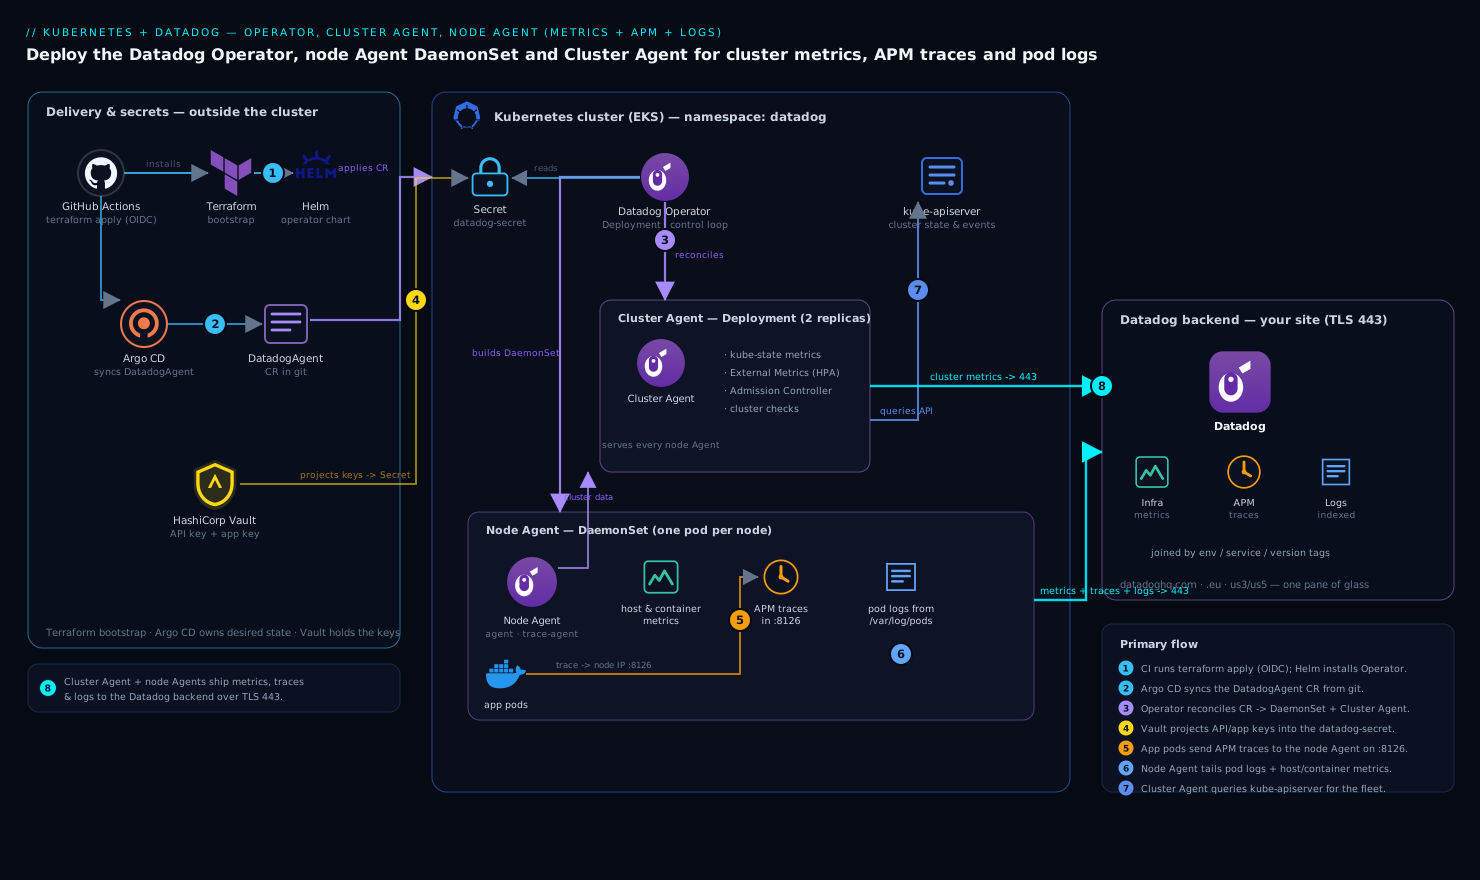
The deployment has three moving parts inside the cluster and one outside it. The Datadog Operator runs as a Deployment and watches a single DatadogAgent custom resource — it is the control loop that turns your desired state into the actual workloads. From that resource it reconciles a node Agent DaemonSet (one pod per node, collecting host and container metrics, receiving APM traces from local application pods over the node’s IP, and tailing container log files off the node filesystem) and a Cluster Agent Deployment (a small set of replicas that talk to the Kubernetes API on behalf of every node Agent, so you do not have dozens of pods hammering the API server). Outside the cluster sits the Datadog backend at your chosen site, which the Cluster Agent and node Agents ship to over TLS on 443.
The reason the Cluster Agent exists is worth internalising: it is the single component that queries the API server for cluster-level state (events, kube-state metrics, the node/pod topology) and serves that to node Agents, plus it hosts the External Metrics Provider so a HorizontalPodAutoscaler can scale on a Datadog query. Node Agents handle the per-host work; the Cluster Agent handles the per-cluster work. Keep that split clear and the rest of the configuration follows from it.
The pieces, at a glance
If you remember nothing else, remember which component owns what — every configuration choice later maps back to this table.
| Component | Kubernetes kind | How many | What it owns |
|---|---|---|---|
| Datadog Operator | Deployment | 1 (small controller) | Watches the DatadogAgent CR; creates/updates the two agents below |
| node Agent | DaemonSet | one pod per node | Host + container metrics, APM trace intake (port 8126), log tailing, live processes |
| Cluster Agent | Deployment | 2 (HA, leader-elected) | Single API-server watcher, kube-state metrics, cluster checks, external metrics, admission controller |
| Cluster Check Runner | Deployment | 0–N (optional) | Runs cluster-level checks off the node Agents at scale |
The mental one-liner: DaemonSet = per node, Cluster Agent = per cluster. Metrics and logs are inherently per-node (they come off each host), so the DaemonSet collects them. Cluster state (how many pods exist, what events fired, the API’s view of the world) is per-cluster, so a single Cluster Agent watches it once and hands it out.
Operator vs Helm chart vs raw manifests
There are three ways to install Datadog on Kubernetes. They are not equivalent, and the choice shapes day-two life more than the install day.
| Approach | What you hand-manage | Reconciled continuously? | Best when |
|---|---|---|---|
| Datadog Operator (this guide) | One DatadogAgent CR |
Yes — the Operator self-heals drift | GitOps, want per-feature toggles, multi-cluster fleets |
Helm chart (datadog/datadog) |
A large values.yaml, templated on each helm upgrade |
No — only at upgrade time | Simple single clusters, teams already deep in Helm |
| Raw manifests | Every DaemonSet/Deployment/RBAC object yourself | No | Learning only — you will drift and regret it |
The Operator wins for the payments scenario because a DatadogAgent is a first-class object a controller reconciles on a loop: flip spec.features.apm.enabled to false and it removes exactly the APM plumbing and nothing else, then snaps back if someone hand-edits the live resource. A Helm values.yaml is templated once per helm upgrade and then inert. If your shop is committed to Helm, the chart is perfectly production-grade — but you give up the continuous reconcile and the clean per-feature granularity that make the rest of this lesson tidy.
How each signal reaches Datadog
Three signals, three slightly different paths. Beginners conflate them; keeping them separate is what makes correlation click later.
| Signal | Collected by | Path to Datadog | Key detail |
|---|---|---|---|
| Host + container metrics | node Agent | Agent → intake:443 | Reads the kubelet / cAdvisor on each node |
| kube-state metrics + events | Cluster Agent | Cluster Agent → intake:443 | Watched once, not per node |
| Logs | node Agent | Tails /var/log/pods → intake |
containerCollectAll or per-pod AD annotations |
| Traces (APM) | node Agent trace-agent | app pod → node IP:8126 (or UDS) | Joined to metrics/logs by unified tags |
| Live processes / containers | node Agent process-agent | Agent → intake:443 | Powers the Live Containers / Processes views |
Notice the odd one out: kube-state and events go through the Cluster Agent, everything else through the node Agent. That single arrow is the reason your API server stays calm on a 240-node cluster — one watcher instead of 240.
1. Put the Datadog keys in Vault and project them into the cluster
Never bake the API and app keys into a Helm values file that lands in git — that is exactly the kind of leak that haunts a repo’s history forever. Store them in HashiCorp Vault and let the Vault Secrets Operator (or the Vault Agent injector) materialise a native Kubernetes Secret the Datadog Operator can reference.
Write the keys into Vault (KV v2) once, from an authenticated session:
# Keys come from the Datadog UI: Organization Settings > API Keys / Application Keys
vault kv put secret/datadog/prod \
  api-key="$DD_API_KEY" \
  app-key="$DD_APP_KEY"
Then create the namespace and a VaultStaticSecret so the Vault Secrets Operator syncs those values into a Kubernetes Secret named datadog-secret:
kubectl create namespace datadog
# vault-static-secret.yaml
apiVersion: secrets.hashicorp.com/v1beta1
kind: VaultStaticSecret
metadata:
  name: datadog-keys
  namespace: datadog
spec:
  type: kv-v2
  mount: secret
  path: datadog/prod
  destination:
    name: datadog-secret      # the K8s Secret the Operator will read
    create: true
  refreshAfter: 1h
  hmacSecretData: true
kubectl apply -f vault-static-secret.yaml
kubectl get secret datadog-secret -n datadog -o jsonpath='{.data}' | jq 'keys'
# expect: ["api-key","app-key"]
If you do not run Vault, the fallback is kubectl create secret generic datadog-secret -n datadog --from-literal api-key=... --from-literal app-key=..., but treat that as a lab-only shortcut. Either way, the Datadog Operator consumes the keys by Secret reference, so the credential never appears in the resource you commit.
2. Install the Datadog Operator with Helm
The Operator itself is a small controller. Install it from the official Helm repo into the datadog namespace:
helm repo add datadog https://helm.datadoghq.com
helm repo update

helm install datadog-operator datadog/datadog-operator \
  --namespace datadog \
  --version 1.11.0 \
  --set image.tag=1.11.0
Confirm the Operator is running and the DatadogAgent CRD is registered before you create any custom resource:
kubectl get pods -n datadog -l app.kubernetes.io/name=datadog-operator
kubectl get crd datadogagents.datadoghq.com
Pinning --version matters: the DatadogAgent API surface evolves, and you want CI to install a known controller version, not whatever is newest the day the pipeline runs.
3. Define the DatadogAgent custom resource (metrics + APM + logs)
This is the heart of the deployment — one declarative object that turns on cluster metrics, APM, and log collection together, sets your site, and references the Vault-projected secret. Apply it and the Operator builds the DaemonSet and Cluster Agent for you.
# datadog-agent.yaml
apiVersion: datadoghq.com/v2alpha1
kind: DatadogAgent
metadata:
  name: datadog
  namespace: datadog
spec:
  global:
    site: datadoghq.com            # MATCH your account's site exactly
    clusterName: payments-prod-eks # shows up as kube_cluster_name tag
    credentials:
      apiSecret:
        secretName: datadog-secret
        keyName: api-key
      appSecret:
        secretName: datadog-secret
        keyName: app-key
    # Unified tagging: env/service/version stamped on every metric, trace, and log
    tags:
      - "team:payments"
    podLabelsAsTags:
      app: kube_app
    env:
      - name: DD_ENV
        value: prod

  features:
    apm:
      enabled: true
      hostPortConfig:
        enabled: true             # apps send traces to the node IP on 8126
    logCollection:
      enabled: true
      containerCollectAll: true   # tail logs from every container, not just annotated ones
    liveProcessCollection:
      enabled: true
    npm:
      enabled: false              # turn on later if you want network performance monitoring
    clusterChecks:
      enabled: true
    externalMetricsServer:
      enabled: true               # lets HPAs scale on Datadog queries
      useDatadogMetrics: true

  override:
    nodeAgent:
      image:
        tag: "7.54.0"
    clusterAgent:
      replicas: 2                 # HA for the cluster-level component
      image:
        tag: "7.54.0"
Apply it and watch the Operator reconcile:
kubectl apply -f datadog-agent.yaml
kubectl get datadogagent datadog -n datadog -o wide

# The Operator should produce a DaemonSet and a Cluster Agent Deployment:
kubectl get daemonset  -n datadog
kubectl get deployment -n datadog -l app.kubernetes.io/component=cluster-agent
kubectl get pods -n datadog -o wide
You want one node-Agent pod per schedulable node and (here) two Cluster Agent pods. The tags, DD_ENV, and clusterName settings implement unified service tagging — the env, service, and version triplet that lets Datadog correlate a trace to the metrics and logs from the same workload. Skipping this is why so many Datadog rollouts end up with data that will not join across signals.
4. Verify and tune log collection
containerCollectAll: true tails the container log files Kubernetes writes under /var/log/pods and /var/lib/docker/containers, which the Operator mounts read-only into the node Agent. That gives you logs from everything immediately. To control noise and parse structured logs, use Autodiscovery pod annotations on your application Deployments rather than editing the Agent:
# excerpt from an application Deployment's pod template
metadata:
  annotations:
    ad.datadoghq.com/checkout.logs: |
      [{
        "source": "java",
        "service": "checkout",
        "log_processing_rules": [{
          "type": "multi_line",
          "name": "stack_traces",
          "pattern": "\\d{4}-\\d{2}-\\d{2}"
        }]
      }]
Here checkout is the container name; source drives the Datadog log pipeline (so Java stack traces are stitched into one event, not split per line), and service ties the logs to the same service as its traces. Confirm logs are flowing from the Agent’s own status:
AGENT=$(kubectl get pod -n datadog -l agent.datadoghq.com/component=agent \
  -o jsonpath='{.items[0].metadata.name}')

kubectl exec -n datadog "$AGENT" -c agent -- agent status | sed -n '/Logs Agent/,/^$/p'
Look for BytesSent climbing and each integration showing Status: OK. To exclude a chatty namespace from log collection entirely, add DD_CONTAINER_EXCLUDE_LOGS="kube_namespace:kube-system" via spec.override.nodeAgent.env rather than disabling collection globally.
5. Instrument an application for APM
The node Agent receives traces on port 8126 via the host port you enabled in step 3, so each application pod sends to the node it runs on. The cleanest way to get the right endpoint into the app is the Kubernetes downward API, then add the language tracer.
Add these to the application container’s env:
env:
  - name: DD_AGENT_HOST          # node IP, via the downward API
    valueFrom:
      fieldRef:
        fieldPath: status.hostIP
  - name: DD_TRACE_AGENT_PORT
    value: "8126"
  - name: DD_ENV
    value: "prod"
  - name: DD_SERVICE
    value: "checkout"
  - name: DD_VERSION
    value: "2026.06.10"          # match your release/version tag
For a Node.js service, install and load the tracer as the very first import:
npm install dd-trace
# entrypoint: node -r dd-trace/init server.js
Datadog also supports auto-instrumentation through the Admission Controller that the Cluster Agent runs — annotate a pod with admission.datadoghq.com/js-lib.version and the tracer library is injected for you, no image rebuild. That is the better path at scale; the explicit install above is the transparent version for understanding what is happening. Confirm traces land by hitting the service, then checking the trace agent:
kubectl exec -n datadog "$AGENT" -c trace-agent -- agent status | sed -n '/APM/,/^$/p'
# TracesReceived and TracesBytesReceived should be > 0 after traffic
6. Wire it into CI and GitOps
The DatadogAgent resource is desired state, so it belongs in version control and is applied by your delivery pipeline — Argo CD for the in-cluster manifests, with the bootstrap (Helm Operator install, namespace, Vault wiring) done by Terraform so the whole thing is reproducible.
A minimal Terraform shape installs the Operator chart and lets Argo own the custom resource:
resource "helm_release" "datadog_operator" {
  name       = "datadog-operator"
  repository = "https://helm.datadoghq.com"
  chart      = "datadog-operator"
  version    = "1.11.0"
  namespace  = "datadog"
  create_namespace = true
}

resource "argocd_application" "datadog" {
  metadata { name = "datadog" }
  spec {
    source {
      repo_url        = "https://github.com/payments/observability"
      path            = "datadog/overlays/prod"   # holds datadog-agent.yaml
      target_revision = "HEAD"
    }
    destination { server = "https://kubernetes.default.svc"  namespace = "datadog" }
    sync_policy { automated { prune = true  self_heal = true } }
  }
}
The GitHub Actions workflow that runs terraform apply authenticates to the cloud via OIDC (no stored cloud credentials), and the Datadog keys are read from Vault at apply time, never passed as plaintext CI variables. Argo’s self_heal then guarantees that if someone hand-edits the live DatadogAgent, it snaps back to git. If your org runs Jenkins instead of GitHub Actions, the same two stages — terraform apply for bootstrap, argocd app sync datadog for the manifests — map cleanly onto a declarative Jenkinsfile.
Validation
Walk the signals end to end before you call it done:
# 1. Every node has an Agent; Cluster Agent is healthy
kubectl get pods -n datadog -o wide
kubectl get pods -n datadog -l app.kubernetes.io/component=cluster-agent

# 2. Cluster Agent is actually serving node Agents (the key integration)
DCA=$(kubectl get pod -n datadog -l app.kubernetes.io/component=cluster-agent \
  -o jsonpath='{.items[0].metadata.name}')
kubectl exec -n datadog "$DCA" -- agent status | grep -A5 "Cluster Agent"
kubectl exec -n datadog "$AGENT" -c agent -- agent status | grep -A3 "Cluster Agent"
# node Agent should report it is talking to the Cluster Agent, not the API server directly

# 3. Connectivity to your Datadog site
kubectl exec -n datadog "$AGENT" -c agent -- agent status | grep -A5 "Forwarder"
Then in the Datadog UI: open Infrastructure > Kubernetes and confirm the cluster payments-prod-eks and its nodes appear; open APM > Services and confirm checkout shows traces tagged env:prod; open Logs and filter service:checkout to see the multi-line stack traces stitched correctly. The win condition from the opening scenario is that clicking a slow trace in APM surfaces the host metrics under it and the correlated log lines — all joined by the unified env/service/version tags you set in step 3.
Rollback / teardown
Because everything is declarative, removal is clean and ordered — delete the custom resource first so the Operator tears down what it created, then the Operator, then the secret and namespace:
# 1. Operator removes the DaemonSet + Cluster Agent it reconciled
kubectl delete -f datadog-agent.yaml

# 2. (GitOps) disable the Argo app so it does not recreate the resource
argocd app set datadog --sync-policy none   # or delete the Application

# 3. Remove the Operator and CRD
helm uninstall datadog-operator -n datadog
kubectl delete crd datadogagents.datadoghq.com

# 4. Clean up secrets + namespace
kubectl delete -f vault-static-secret.yaml
kubectl delete namespace datadog
For a partial rollback — say APM is causing trouble — flip spec.features.apm.enabled to false and re-apply; the Operator reconciles the change without touching metrics or logs. That granularity is the main reason to run the Operator over a monolithic Helm install.
Common pitfalls
- Wrong
site. Agents connect, report healthy, and you still see nothing — because they are shipping todatadoghq.comwhile your org is ondatadoghq.eu. CheckForwarderinagent statusand matchspec.global.siteto your account. - APM host port blocked. If a
NetworkPolicyor a security group denies pod-to-node traffic on 8126, apps cannot reach their local Agent. Either allow it, or switch to the Unix Domain Socket transport (DD_APM_RECEIVER_SOCKET) which avoids host networking entirely. - Log volume surprise.
containerCollectAll: trueingests everything, and Datadog bills per ingested GB. Exclude noisy namespaces withDD_CONTAINER_EXCLUDE_LOGSand sample where you can before the first invoice lands. - One Cluster Agent replica. A single replica makes cluster checks and the metrics provider a single point of failure during a node drain. Run at least two (as above) with a leader election lease.
- Missing unified tags. Forget
DD_ENV/DD_SERVICE/DD_VERSIONon the app and your traces, metrics, and logs will not correlate — the whole point of the exercise. Set them on every workload, ideally via the Admission Controller defaults. - Tracer not loaded first. A language tracer imported after your web framework misses spans. For Node it must be
-r dd-trace/init; for Python,ddtrace-run.
Security notes
Treat the Datadog keys as the crown jewels they are: hold them in HashiCorp Vault, project them as a referenced Kubernetes Secret, and never commit them — a leaked API key lets anyone write to your org. Scope cluster access through your IdP, Okta or Entra ID federated to the cloud provider, so engineers assume short-lived roles instead of sharing a static kubeconfig. The node Agent runs privileged to read host log files and container runtime sockets, so keep its image pinned and patched and let your runtime-security tooling — CrowdStrike Falcon for workload threat detection, Wiz (with Wiz Code scanning the IaC in the pull request) for posture and misconfiguration drift — watch the DaemonSet like any other privileged workload. Restrict the app key to the Cluster Agent only; node Agents need just the API key. Route any Agent health or security alert into ServiceNow so an unexpected DaemonSet change becomes a tracked incident, not a missed log line. If your perimeter terminates at Akamai, allow the Datadog intake endpoints for your site through egress controls so Agents can reach the backend.
Cost notes
Datadog bills primarily on per-host infrastructure, ingested + indexed log GB, and APM ingested/indexed spans, so the levers are about volume, not the install. Use log filtering and exclusion (DD_CONTAINER_EXCLUDE_LOGS, plus exclusion filters in the UI) to ingest only what you will actually query; archive the rest to cheap object storage and rehydrate on demand. For APM, enable ingestion sampling so you keep a statistically useful share of traces rather than 100% of a high-traffic service. Run the Cluster Agent at two replicas, not ten — it is lightweight and the cluster checks feature deliberately moves work off the per-node Agents, which also trims API-server load. Right-size the node Agent resource requests; an oversized DaemonSet multiplies waste by every node in the fleet. And track host count: scaling the cluster scales your Datadog host bill linearly, so node autoscaling decisions are also cost decisions. This whole topology is deliberately lean — Operator, one DaemonSet, two Cluster Agent pods — precisely so the observability layer does not become a line item that rivals the workloads it watches.
Going deeper
The six steps above get a working install. This section is for when you own it: how the Cluster Agent actually protects the API server, how Autodiscovery finds your integrations, how traces get tagged and correlated, how the admission controller rewrites your pods, and where the money and the blast radius really are.
The Cluster Agent: one watcher, fanned out
On a naive install with no Cluster Agent, every node Agent independently opens watches against the Kubernetes API server for the data it needs to tag metrics — the pod-to-node map, deployment metadata, kube-state metrics, cluster events. On a 240-node cluster that is 240 clients doing near-identical LIST/WATCH calls, and it is a well-known way to melt an API server (and blow past etcd’s comfort zone) during a rollout or a mass reschedule.
The Cluster Agent collapses that fan-in into a fan-out. It is the only component that watches the API server for cluster-level state. Node Agents no longer talk to the API server for that data at all — they make a lightweight gRPC/HTTPS call to the Cluster Agent’s service and receive pre-computed metadata (which is why the Validation step checks that a node Agent reports “talking to the Cluster Agent”). One watcher, N consumers. The Cluster Agent runs two replicas but only one is active at a time: they use a leader election lease (a Lease object in the API) so exactly one instance performs the watching and the cluster checks, while the other stands by for instant failover.
That same component also dispatches cluster checks. A “cluster check” is an integration that should run once per cluster, not once per node — monitoring an external load balancer, a managed database endpoint, a control-plane component. The Cluster Agent’s leader schedules each such check onto a healthy node Agent (or, at scale, onto a dedicated Cluster Check Runner Deployment so the heavy checks do not compete with node-level collection). Without this, you would either miss the check or run it redundantly on all N nodes and pay for N copies of the same metric.
External metrics: autoscaling on a Datadog query
Kubernetes lets a HorizontalPodAutoscaler scale on “external” metrics through the external.metrics.k8s.io aggregated API. Something has to serve that API; when you set externalMetricsServer.enabled: true, the Cluster Agent registers itself as the provider and answers those queries by asking Datadog. That is what lets you autoscale on a real business signal — requests per second from APM, queue depth, p95 latency — instead of only CPU and memory — the same HPA machinery you may already use for CPU, pointed at a Datadog query.
With useDatadogMetrics: true, you define the query declaratively as a DatadogMetric custom resource rather than embedding a raw query string in the HPA:
# datadogmetric.yaml
apiVersion: datadoghq.com/v1alpha1
kind: DatadogMetric
metadata:
  name: checkout-requests-per-second
  namespace: payments
spec:
  query: "sum:trace.http.request.hits{service:checkout,env:prod}.as_rate()"
The HPA then references it by the special datadogmetric@<namespace>:<name> external-metric name:
# hpa.yaml
apiVersion: autoscaling/v2
kind: HorizontalPodAutoscaler
metadata:
  name: checkout
  namespace: payments
spec:
  scaleTargetRef:
    apiVersion: apps/v1
    kind: Deployment
    name: checkout
  minReplicas: 3
  maxReplicas: 20
  metrics:
    - type: External
      external:
        metric:
          name: datadogmetric@payments:checkout-requests-per-second
        target:
          type: AverageValue
          averageValue: "50"       # scale to keep ~50 req/s per pod
Storing the query as a DatadogMetric means it lives in git, is reviewed like any other manifest, and can be reused by several HPAs — and the Cluster Agent only evaluates the queries actually referenced, which keeps its API-call budget to Datadog small.
Autodiscovery: templates that follow your pods
Pods are ephemeral and land on random nodes with random IPs, so you cannot statically configure “monitor Redis at 10.0.4.12:6379.” Autodiscovery (AD) solves this: you attach an integration template to the workload, and whichever node Agent the pod lands on renders that template against the pod’s live IP and port and starts the check. When the pod moves, the check moves with it.
The template variables %%host%% and %%port%% are filled in at runtime from the container. The modern annotation is a single ad.datadoghq.com/<container>.checks map (the older three-annotation form — check_names, init_configs, instances — still works but is more error-prone):
# on the Redis pod template — the Agent configures the redisdb integration itself
metadata:
  annotations:
    ad.datadoghq.com/redis.checks: |
      {
        "redisdb": {
          "init_config": {},
          "instances": [
            {
              "host": "%%host%%",
              "port": "6379"
            }
          ]
        }
      }
    ad.datadoghq.com/redis.logs: |
      [{"source": "redis", "service": "cart-cache"}]
Here redis is the container name inside the pod (not the pod name) — AD keys on the container so a multi-container pod can configure each one separately. The .logs annotation you already met in step 4 is the same mechanism for the logs pipeline.
For a cluster check (run once, not per node), you annotate the Service rather than the pod and tag it so the Cluster Agent — not a node Agent — owns it:
# monitor a database endpoint once per cluster, dispatched by the Cluster Agent
apiVersion: v1
kind: Service
metadata:
  name: payments-postgres
  namespace: payments
  annotations:
    ad.datadoghq.com/service.checks: |
      {
        "postgres": {
          "init_config": {},
          "instances": [
            {
              "dbm": true,
              "host": "%%host%%",
              "port": 5432,
              "username": "datadog"
            }
          ]
        }
      }
    ad.datadoghq.com/tags: '{"cluster_check": "true"}'
spec:
  selector:
    app: postgres
  ports:
    - port: 5432
You can also drive AD from container image names centrally (spec.override with DD_EXTRA_CONFIG_PROVIDERS), so any pod running redis is auto-monitored without per-workload annotations — useful when you do not control every team’s manifests.
APM ingestion: the trace agent and unified service tagging
APM traffic does not go through the main Agent process. Each node Agent pod runs a dedicated trace-agent container that listens on port 8126 (the host port you enabled) or, more securely, on a Unix Domain Socket. An instrumented app emits spans (one unit of work — a DB query, an HTTP call); the tracer library batches them into traces (one request end to end) and ships them to the local trace-agent, which buffers, applies sampling, and forwards to Datadog. Sending to the local node’s trace-agent — reached via the downward API’s status.hostIP — keeps trace traffic on-node and off the network fabric.
Unified service tagging is the glue. The trio env, service, version must be identical across the metric, the trace, and the log for the same workload, because that is literally the join key Datadog uses to stitch them on one screen. There are three places it gets set, and they must agree:
| Where | How | Applies to |
|---|---|---|
| App container env | DD_ENV, DD_SERVICE, DD_VERSION |
Traces the app emits |
| Pod labels | tags.datadoghq.com/env / service / version |
Metrics + logs for that pod (read by the Agent) |
DatadogAgent global |
spec.global.env / tags |
Cluster-wide defaults |
version is the quietly powerful one: set it to your release tag and Datadog’s “Deploy Tracking” can show that error rate tripled the moment 2026.06.11 rolled out — the fastest possible “was it the deploy?” answer. Get the triplet wrong (a typo, checkout vs checkout-svc) and the signals silently fail to correlate, which is the most common “it’s installed but useless” outcome.
The admission controller: auto-injecting the tracer
Asking every team to add tracer env vars and rebuild images does not scale. The Cluster Agent runs a mutating admission webhook (an admission controller) that rewrites pods at creation time to do it for you. It can inject the unified-tag env vars, the socket/host config, and the language tracer itself via an init container that copies the library into a shared volume — no Dockerfile change.
The fleet-wide form is Single Step Instrumentation, configured as a feature on the DatadogAgent:
spec:
  features:
    admissionController:
      enabled: true
      mutateUnlabelled: false        # only mutate pods that opt in via label
    apm:
      enabled: true
      instrumentation:
        enabled: true                # a.k.a. APM_INSTRUMENTATION / single-step
        enabledNamespaces:
          - payments                 # scope it; do not boil the ocean on day one
        libVersions:
          java: "1"
          python: "2"
With mutateUnlabelled: false, a workload opts in per-pod by labelling its template — and the same labels carry the unified tags so injection and tagging happen together:
metadata:
  labels:
    admission.datadoghq.com/enabled: "true"
    tags.datadoghq.com/env: "prod"
    tags.datadoghq.com/service: "checkout"
    tags.datadoghq.com/version: "2026.06.10"
  annotations:
    admission.datadoghq.com/java-lib.version: v1.20.0   # pin a specific tracer
Roll it out namespace by namespace with enabledNamespaces (or exclude with disabledNamespaces); pin libVersions so a tracer auto-update never surprises you in prod. This is the “better path at scale” that step 5 alluded to — the explicit env-var install there is the same result done by hand so you can see the moving parts.
Live containers and processes
liveProcessCollection.enabled: true turns on the node Agent’s process-agent, which powers the Live Processes and Live Containers views — a real-time, top-like feed of every process and container with CPU/memory/IO, two-second granularity, no dashboards to build. It is the fastest way to catch the noisy-neighbour pod from the opening scenario. Two caveats worth knowing: process command-line arguments can contain secrets (a password passed as a flag), so Datadog offers argument scrubbing you should keep on; and at very high container churn the process-agent adds measurable overhead, so it is one of the first things to scope down if a node Agent gets hot.
Tags, cardinality, and cost control
Every tag combination on a metric creates a distinct time series, and custom metrics are billed per distinct series. Cardinality is therefore a direct cost dial, and Kubernetes makes it easy to explode by accident. The Agent has three cardinality levels:
| Level | Adds tags like | Use for |
|---|---|---|
low (default) |
kube_deployment, kube_service, env |
Almost everything |
orchestrator |
+ pod_name |
When you truly need per-pod granularity |
high |
+ container_id |
Rarely — debugging, short windows |
spec:
  override:
    nodeAgent:
      env:
        - name: DD_CHECKS_TAG_CARDINALITY
          value: "low"
The two features that quietly blow up a bill are podLabelsAsTags and podAnnotationsAsTags: map a label that holds a unique value (a pod-template-hash, a build ID, a request ID) into a tag and you multiply every metric by the number of unique values that ever existed. Rule of thumb: only promote low-cardinality, stable labels (app, team, tier) to tags; never a hash, a timestamp, or a user ID. Datadog’s Metrics Summary page shows the top metrics by cardinality — check it after any tagging change, before the invoice does it for you.
RBAC and the API vs app key
The Operator generates the RBAC each component needs, and the split mirrors the topology. The node Agent gets a modest ClusterRole — read nodes, pods, endpoints, and the metrics it needs to tag data — because per-host collection is most of its job. The Cluster Agent gets a broader one: watch cluster-wide state, manage the leader-election Lease, run the admission webhook, and — when external metrics are on — register with the external.metrics.k8s.io aggregated API. Review these ClusterRoles like any privileged install; the node Agent’s host access already makes the DaemonSet sensitive.
The two Datadog credentials are not interchangeable, and understanding why tightens your security posture:
- API key — authenticates data submission (metrics, logs, traces). Every Agent needs it. It is a write credential to your org’s intake.
- App key — authenticates programmatic reads/actions against the Datadog API. Only the Cluster Agent needs it, and only for cluster-level features: the External Metrics Provider queries Datadog with it, and it backs some cluster-check registration. Node Agents never need it.
So scope the app key to the Cluster Agent’s Secret reference only, keep both keys in Vault, and rotate the API key on any suspicion of leak — because with it, anyone can write arbitrary data (and cost) into your org.
Practice challenges
Work these against a cluster with the Operator and DatadogAgent applied. Each has a worked solution — try first, then check.
1. (Beginner) Prove the topology. Show that there is exactly one node-Agent pod per schedulable node, and that the Cluster Agent is running two replicas.
<details> <summary>Solution</summary>
# node count vs node-Agent pod count should match
kubectl get nodes --no-headers | wc -l
kubectl get pods -n datadog -l agent.datadoghq.com/component=agent --no-headers | wc -l

# Cluster Agent replicas
kubectl get deployment -n datadog -l app.kubernetes.io/component=cluster-agent
Why: a DaemonSet schedules one pod per (schedulable) node by design, so the two counts matching is the fastest confirmation the DaemonSet is healthy; the Deployment shows 2/2 for the HA Cluster Agent.
</details>
2. (Beginner) Stamp unified tags via labels. Without touching the app image, add env/service/version to the checkout Deployment’s pods so its metrics and logs correlate with its traces.
<details> <summary>Solution</summary>
# in the Deployment's spec.template.metadata.labels
labels:
  tags.datadoghq.com/env: "prod"
  tags.datadoghq.com/service: "checkout"
  tags.datadoghq.com/version: "2026.06.10"
Why: the Agent reads the tags.datadoghq.com/* pod labels and applies them to that pod’s metrics and logs, matching the DD_ENV/DD_SERVICE/DD_VERSION on the traces — that shared triplet is the join key.
</details>
3. (Intermediate) Configure an integration by annotation only. Enable the Redis integration for a cart-cache pod purely with Autodiscovery — no Agent config file, no restart of the Agent.
<details> <summary>Solution</summary>
# on the cart-cache pod template; container name is "redis"
metadata:
  annotations:
    ad.datadoghq.com/redis.checks: |
      {"redisdb": {"init_config": {}, "instances": [{"host": "%%host%%", "port": "6379"}]}}
Why: AD renders %%host%% from the pod’s live IP on whichever node it lands, so the check follows the pod — no static endpoint and nothing to edit on the Agent.
</details>
4. (Intermediate) Silence a noisy namespace’s logs without turning logs off. containerCollectAll is on, but kube-system is drowning your log bill. Exclude just that namespace.
<details> <summary>Solution</summary>
spec:
  override:
    nodeAgent:
      env:
        - name: DD_CONTAINER_EXCLUDE_LOGS
          value: "kube_namespace:kube-system"
Why: the exclude filter drops those logs at the Agent before ingestion, so you stop paying for them while keeping containerCollectAll for everything else — targeted, not global, disablement.
</details>
5. (Advanced) Autoscale on a business metric. Make the checkout Deployment scale on requests per second from APM instead of CPU, keeping ~50 req/s per pod, between 3 and 20 replicas.
<details> <summary>Solution</summary>
# 1) the query as a DatadogMetric
apiVersion: datadoghq.com/v1alpha1
kind: DatadogMetric
metadata: { name: checkout-rps, namespace: payments }
spec:
  query: "sum:trace.http.request.hits{service:checkout,env:prod}.as_rate()"
---
# 2) the HPA referencing it
apiVersion: autoscaling/v2
kind: HorizontalPodAutoscaler
metadata: { name: checkout, namespace: payments }
spec:
  scaleTargetRef: { apiVersion: apps/v1, kind: Deployment, name: checkout }
  minReplicas: 3
  maxReplicas: 20
  metrics:
    - type: External
      external:
        metric: { name: "datadogmetric@payments:checkout-rps" }
        target: { type: AverageValue, averageValue: "50" }
Why: externalMetricsServer makes the Cluster Agent serve external.metrics.k8s.io; the HPA reads the DatadogMetric by its datadogmetric@ns:name handle, so a Datadog query drives replica count.
</details>
6. (Advanced) Auto-inject the tracer for one namespace. Turn on single-step APM instrumentation for the payments namespace only, and opt a single pod in without instrumenting the whole namespace blindly.
<details> <summary>Solution</summary>
# DatadogAgent: enable, but only mutate opted-in pods
spec:
  features:
    admissionController: { enabled: true, mutateUnlabelled: false }
    apm:
      enabled: true
      instrumentation:
        enabled: true
        enabledNamespaces: ["payments"]
        libVersions: { java: "1" }
# on the target pod template — the opt-in
metadata:
  labels:
    admission.datadoghq.com/enabled: "true"
Why: enabledNamespaces scopes the blast radius to payments, and mutateUnlabelled: false means only pods carrying the admission.datadoghq.com/enabled: "true" label are rewritten — a controlled rollout, not a big-bang mutation.
</details>
Common beginner mistakes
These are wrong mental models, not typos — each is the misconception, why it is wrong, and the model to replace it with.
- “I can skip the Cluster Agent — the node Agents already talk to the API server.” They can, and on a small cluster it even works. But every node Agent then independently watches the API server, and at scale that fan-in is a classic way to overload the control plane during a rollout. Right model: the Cluster Agent is one watcher that fans cluster state out to N node Agents — it exists to protect the API server, not as optional polish.
- “Tags are free, so tag everything.” Every distinct tag combination is a separate time series, and custom metrics bill per series. Mapping a
pod-template-hashor request ID into a tag viapodLabelsAsTagsmultiplies your metrics by every value that ever existed. Right model: tags are a cost dial — promote only low-cardinality, stable labels (app,team,tier); keep hashes, IDs, and timestamps out. - “It’s installed, so traces, metrics, and logs will correlate.” Correlation is not automatic — it is the
env/service/versiontriplet matching across all three signals. One typo (checkoutvscheckout-svc) and they silently do not join. Right model: unified service tagging is the product; without the matching triplet on every workload you have three disconnected tools, not one pane of glass. - “Logs alone are enough — I’ll grep them when something breaks.” Logs without the trace they belong to tell you what was printed but not which request or how slow. Right model: ship logs with the same
service(and trace-id injection from the tracer) so a slow APM trace links straight to its exact log lines — that link is the whole point of running APM and logs together. - “I’ll put the keys in the values file for now and fix it later.” A key committed to git is leaked forever, even after you delete it, because history keeps it — and the API key is a write credential to your whole org. Right model: the credential lives in Vault and is consumed by Secret reference; it never appears in any file you commit, from day one.
- “One Cluster Agent replica is fine.” With one replica, a node drain or crash takes cluster checks and the external-metrics provider down until it reschedules — so HPAs stall and cluster metrics gap. Right model: run two with leader election; only the leader works, the other is warm standby for instant failover.
Glossary
- Datadog Operator — a small in-cluster controller that watches a
DatadogAgentcustom resource and reconciles the node Agent DaemonSet and Cluster Agent to match it. DatadogAgent(CR) — the single declarative object (APIdatadoghq.com/v2alpha1) that describes your whole Datadog install; edit it, and the Operator rearranges the agents.- node Agent — the per-node worker, deployed as a DaemonSet (one pod per node), that collects host/container metrics, receives traces, and tails logs.
- Cluster Agent — the per-cluster worker; the single API-server watcher that fans cluster state out to node Agents, runs cluster checks, serves external metrics, and hosts the admission controller.
- Cluster Check Runner — an optional Deployment that executes cluster checks off the node Agents when the check load is heavy.
- DaemonSet — a Kubernetes workload that runs exactly one pod on every (matching) node; the natural shape for per-node collection.
- Autodiscovery (AD) — the mechanism that renders an integration template against a live pod’s IP/port at runtime, so checks follow ephemeral pods.
- Integration template — the check config attached via
ad.datadoghq.com/<container>.checksannotations, with%%host%%/%%port%%filled in per pod. - APM (Application Performance Monitoring) — distributed tracing: following one request across services as a trace made of spans.
- trace-agent — the dedicated container in each node Agent pod that receives spans on port 8126 (or a Unix socket) and forwards them.
- Unified service tagging — the
env/service/versiontrio, kept identical across metrics, traces, and logs, that lets Datadog correlate all three for one workload. versiontag — the release identifier that powers Deploy Tracking (“did error rate jump when this version shipped?”).- Cluster check — an integration that should run once per cluster (an external LB, a DB endpoint), dispatched by the Cluster Agent rather than every node.
- External Metrics Provider — the Cluster Agent serving
external.metrics.k8s.ioso an HPA can scale on a Datadog query. DatadogMetric— a CRD holding a Datadog query; referenced by an HPA via thedatadogmetric@<namespace>:<name>external-metric name.- HorizontalPodAutoscaler (HPA) — the Kubernetes controller that adjusts replica count based on a metric — here, an external Datadog query.
- Admission controller — the Cluster Agent’s mutating webhook that rewrites pods at creation to inject tags, config, and (optionally) the tracer.
- Single Step Instrumentation — enabling tracer auto-injection fleet-wide via
spec.features.apm.instrumentation(a.k.a.APM_INSTRUMENTATION), scoped by namespace. - Live processes / containers — the process-agent’s real-time,
top-like view of every process and container, enabled byliveProcessCollection. - Tag cardinality — the number of distinct tag combinations; each is a billed time series, so it is a direct cost dial (
low/orchestrator/high). - Custom metric — a metric billed per distinct tag combination; the thing high-cardinality tags multiply.
- Leader election — the
Lease-based scheme by which exactly one of the two Cluster Agent replicas is active at a time. - API key — the write credential for submitting data; every Agent needs it.
- App key — the read/action credential for the Datadog API; only the Cluster Agent needs it (external metrics, cluster-level actions).
- site — your Datadog region endpoint (
datadoghq.com,datadoghq.eu,us3/us5…); a mismatch is the classic “connected but no data” cause. containerCollectAll— the log-collection setting that tails every container’s logs, not just annotated ones.- downward API — the Kubernetes feature that exposes pod/node fields (like
status.hostIP) to a container as env vars; used to point the tracer at its local node Agent.