In a nutshell
SigNoz is an open-source, OpenTelemetry-native observability platform — one self-hosted tool that shows you your system’s traces (the path a request takes through your services), metrics (numbers over time, like latency and error rate), and logs (the text lines your apps print), all correlated in a single UI you run on your own Kubernetes cluster.
Here is the mental model. Think of SigNoz as the flight recorder plus air-traffic-control screen for your microservices. A trace is the flight path of one request as it hops from service to service; metrics are the instrument-panel gauges (how fast, how many, how many crashed); logs are the cockpit voice recorder — the detailed narration of what each service was doing. Most tools give you only one of those. SigNoz puts all three on one screen and lets you click from a gauge that just spiked to the exact flight that caused it, then straight to the voice recording of that flight — without switching tools and without shipping your data off to a vendor.
The “OpenTelemetry-native” part is what makes it future-proof. OpenTelemetry (OTel) is the vendor-neutral industry standard for how software emits telemetry. Because SigNoz speaks OTel and nothing proprietary, the instrumentation you add to your apps is not welded to SigNoz — point the same data at any other OTel backend later and nothing in your application code changes. You own both the data and the exit.
Level: Intermediate · Time: ~35 min
A mid-size payments company has three teams shipping forty microservices onto EKS, and the observability bill from their incumbent SaaS APM vendor has crossed the number that makes a CFO ask hard questions — usage-based ingest pricing turned a noisy quarter into a five-figure surprise. The platform team’s mandate is blunt: keep distributed tracing, metrics, and logs in one pane of glass, keep the data inside the company’s own VPC for a payments-compliance reason, and stop paying per-gigabyte to a vendor for telemetry the team generates itself. SigNoz fits the brief exactly — it is an open-source, OpenTelemetry-native APM that stores traces, metrics, and logs in a single ClickHouse columnar database you run yourself, with correlated trace-to-log navigation and service dashboards out of the box. This guide walks through standing it up on Kubernetes with the official Helm chart, pointing your workloads’ OTLP exporters at it, validating the pipeline end to end, and operating it like a service the on-call team can trust.
Prerequisites
- A Kubernetes cluster, 1.28+ (EKS/AKS/GKE or on-prem), with at least 3 worker nodes and ~8 vCPU / 16 GiB free for the stack; ClickHouse is the memory-hungry part.
kubectlandhelm3.13+ on your workstation, both pointed at the target cluster (kubectl config current-contextshows the right one).- A default StorageClass that provisions block volumes (gp3 on EKS, managed-csi on AKS, pd-ssd on GKE). ClickHouse needs durable PVs; do not run it on emptyDir.
- A namespace you control and cluster-admin (or enough RBAC to create CRDs, StatefulSets, and a LoadBalancer/Ingress).
- DNS you can point at an ingress (e.g.
signoz.internal.example.com) and a TLS certificate path if you terminate at the cluster. - At least one application emitting (or ready to emit) OTLP over gRPC/HTTP — or the OpenTelemetry demo, which we use to prove the pipeline.
What you’ll be able to do after this
- Stand up SigNoz on Kubernetes with a production-shaped
values.yaml(persistence, resources, retention) using the official Helm chart. If Helm itself is new, start with Helm fundamentals: charts, templates, values & releases. - Point any workload’s OTLP exporter at the in-cluster collector, using either the OpenTelemetry SDK or zero-code auto-instrumentation from the OTel Operator.
- Read the three signals — traces, metrics, logs — and pivot between them by trace ID to go from a latency spike to the exact failing request and its logs.
- Control cost deliberately with sampling and ClickHouse retention TTLs, and reason clearly about when self-hosting beats a SaaS APM.
- Operate the stack day-two: dashboards, alerts, scaling the collector, and clean rollback.
This assumes you are comfortable with Pods, Deployments, Services, and PersistentVolumeClaims. For the metrics half of observability from the Prometheus/Grafana angle, see Kubernetes monitoring with Prometheus & Grafana; SigNoz is the OpenTelemetry-native alternative that folds traces and logs into the same store rather than stitching three systems together.
Target topology
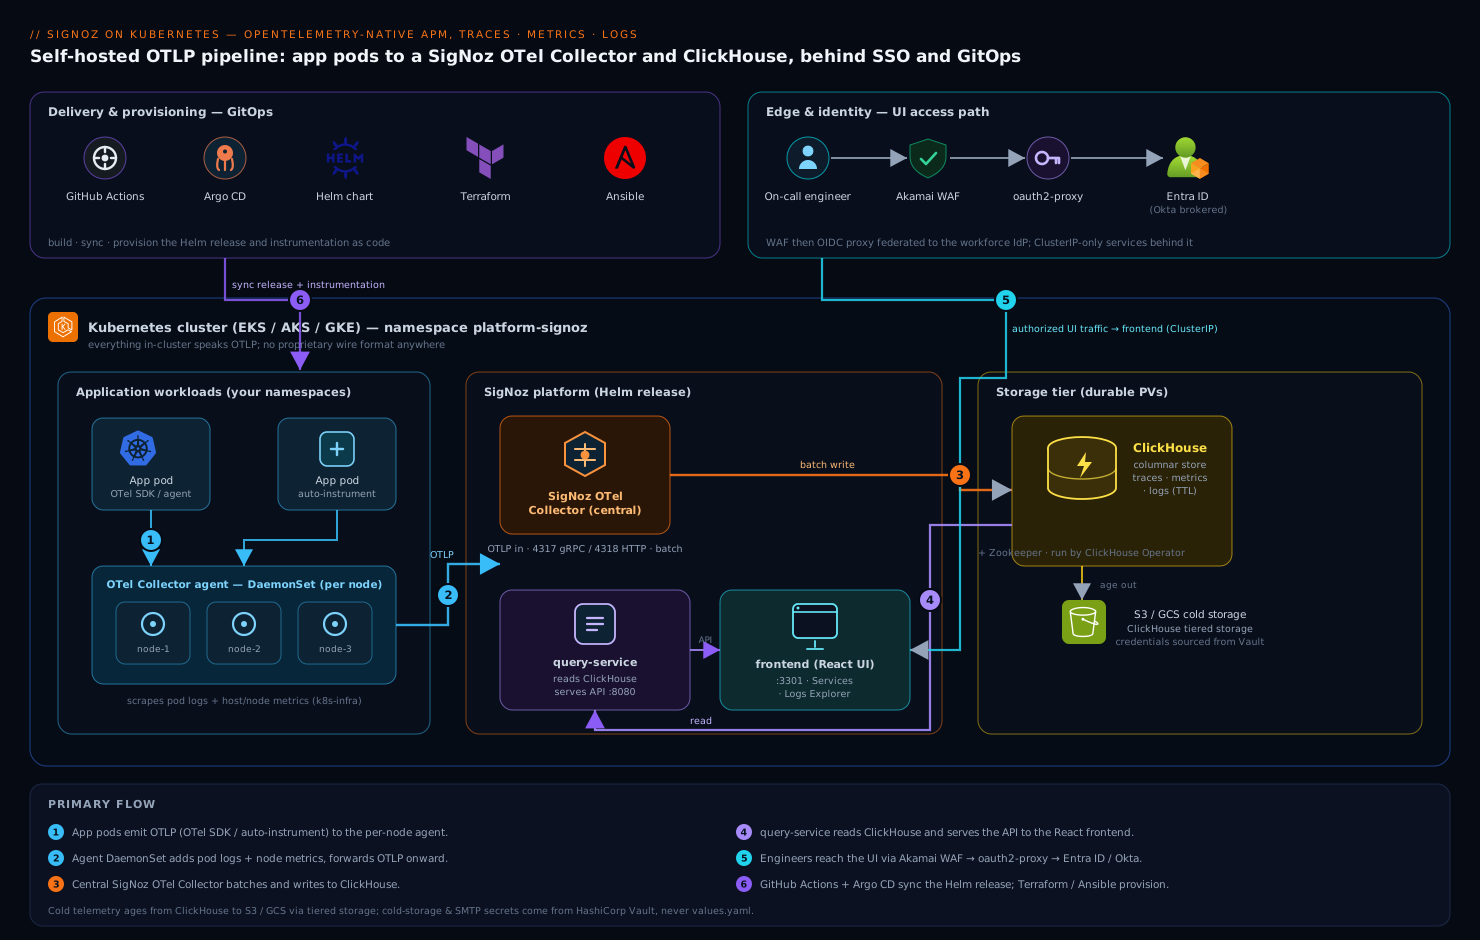
SigNoz on Kubernetes is four cooperating tiers, and keeping them straight in your head makes everything below obvious. At the bottom is ClickHouse (run by the ClickHouse Operator the chart bundles), the columnar store that holds traces, metrics, and logs in separate tables — this is the component that earns its keep, since columnar storage is why SigNoz can be cheap on disk and fast on aggregate queries. Above it sits the SigNoz OTel Collector, the cluster’s central ingest point: it receives OTLP on ports 4317 (gRPC) and 4318 (HTTP), batches, and writes to ClickHouse. Beside it the SigNoz query-service reads ClickHouse and serves the API; the frontend is the React UI. Around the edge, your application pods run the OpenTelemetry SDK (or an auto-instrumentation agent) and a per-node OTel Collector agent DaemonSet that scrapes pod logs and host metrics and forwards OTLP to the central collector. Everything in the cluster talks OTLP — there is no proprietary wire format anywhere in this picture, which is the whole point of choosing an OpenTelemetry-native tool.
What each piece actually does
The diagram names four tiers; this section explains what each one is for in plain terms, so the install steps below read as “wiring known parts together” rather than incantation. Read this once and the rest of the lesson clicks into place.
The OTel Collector is a telemetry post office. Every collector — the central one and the per-node agents — runs the same three-stage pipeline: receivers take telemetry in (OTLP on 4317/4318, plus scrapers for pod logs and host metrics), processors transform it in flight (batch it, cap memory, drop or redact fields, sample it), and exporters send it on (here, to ClickHouse). You will see this receiver → processor → exporter shape everywhere in OpenTelemetry; it is the one abstraction worth memorizing. The collector exists so your apps never talk to the storage backend directly — they emit OTLP to a nearby collector and forget about it, and you can change backends, add PII redaction, or turn on sampling centrally without redeploying a single application.
A “signal” is one of three data types, and OpenTelemetry treats all three as first-class peers rather than bolting logs on as an afterthought:
| Signal | What it is | Example question it answers | Stored in |
|---|---|---|---|
| Trace | The end-to-end path of one request across services, as a tree of timed spans | “Why was this checkout slow, and which service ate the 800 ms?” | signoz_traces |
| Metric | A number sampled over time (counter, gauge, histogram) | “Is p99 latency or error rate rising across all checkouts?” | signoz_metrics |
| Log | A timestamped text record from a service | “What exactly did the payment service print when it failed?” | signoz_logs |
The division of labour is the thing to internalize: metrics tell you something is wrong and how the trend looks; traces tell you where; logs tell you why. The payoff of an OTel-native tool is that these three are linked by shared identifiers, so you move between them in one click instead of three tools — the mechanics are in Going deeper.
Why ClickHouse and not Postgres or Elasticsearch? Telemetry is append-heavy, effectively write-once, and almost always queried by aggregation (“p99 latency for checkout-api over 6 hours”, “error count grouped by endpoint”). ClickHouse is a columnar database: it stores each column contiguously, so an aggregate over one column reads only that column off disk and compresses it hard (repeated values, delta encoding). That is why SigNoz can hold weeks of traces on modest SSD and still answer a dashboard query in milliseconds — and why the same data in a row store would cost several times the disk and RAM. The trade-off is honest: ClickHouse is memory-hungry on large aggregations (which is why the pitfalls below warn about OOMKills) and is useless for transactional point-updates — which telemetry never needs.
SigNoz vs. the DIY stack vs. SaaS — know exactly what you are choosing:
| SigNoz (this lesson) | DIY open-source stack | SaaS APM | |
|---|---|---|---|
| Traces | Built in (ClickHouse) | Jaeger / Tempo | Vendor cloud |
| Metrics | Built in (ClickHouse) | Prometheus + Grafana | Vendor cloud |
| Logs | Built in (ClickHouse) | Loki / Elasticsearch | Vendor cloud |
| Cross-signal correlation | One UI, one store, trace-ID pivots | You wire Grafana datasources together yourself | Built in |
| Data location | Your VPC | Your VPC | Vendor cloud |
| Cost model | Disk + compute you own | Disk + compute + integration effort | Per-GB ingest / per-host |
| Wire format | OpenTelemetry (portable) | Mixed (Prom, Jaeger, Loki) | Often OTel now, historically proprietary |
The middle column is the classic Prometheus + Grafana approach plus separate tracing and logging systems you integrate by hand; SigNoz’s pitch is one store and one UI for all three. The right column trades the per-GB bill for zero operational burden. There is no universally correct choice — the build-vs-buy calculus is spelled out in Going deeper.
Auto-instrumentation vs. SDK — you will use both, so know which does what:
| OTel SDK (in-code) | Auto-instrumentation (Operator) | |
|---|---|---|
| How | Add SDK libraries, initialize in the app | Annotate the pod; the operator injects an init-container agent |
| Code change | Yes (import, configure) | None |
| Coverage | Exactly what you instrument | Broad framework/library coverage out of the box |
| Custom spans / attributes | Full control | Limited (add the SDK on top for custom spans) |
| Best for | Libraries, custom business spans, fine control | Getting a whole fleet emitting traces fast, zero code churn |
| Languages | All OTel languages | Java, .NET, Node.js, Python, Go (via the operator) |
The two compose: start with auto-instrumentation to light up the fleet with zero code changes, then layer the SDK in where you need custom business spans or attributes. Auto-instrumentation sets up the tracer; the SDK enriches it.
1. Prepare the namespace, storage, and Helm repo
Create a dedicated namespace and confirm a default StorageClass exists before anything else — a missing default SC is the single most common reason the install hangs with pods stuck in Pending.
kubectl create namespace platform-signoz
kubectl get storageclass            # one row must show "(default)"

# If none is default, mark one (example: gp3 on EKS):
kubectl patch storageclass gp3 \
  -p '{"metadata":{"annotations":{"storageclass.kubernetes.io/is-default-class":"true"}}}'

helm repo add signoz https://charts.signoz.io
helm repo update
helm search repo signoz/signoz --versions | head
Pin a chart version rather than tracking latest, so a helm upgrade never surprises you with a ClickHouse schema bump during an incident:
export SIGNOZ_CHART_VERSION="0.60.0" # pick a concrete version from the search above
2. Write a values.yaml sized for production
The defaults run, but they run small. Create signoz-values.yaml with persistence, resource requests, and retention set deliberately. The retention numbers below are the lever that controls your disk bill — tune them to your compliance window, not higher.
# signoz-values.yaml
clickhouse:
  installCustomStorageClass: false
  persistence:
    enabled: true
    size: 100Gi               # traces+logs dominate; size to your ingest rate
  resourcesPreset: "large"    # ~ 4 CPU / 8Gi; ClickHouse wants headroom
  # Three replicas + zookeeper for HA in prod; single-node is fine to start
  replicasCount: 1

queryService:
  resources:
    requests: { cpu: "500m", memory: "1Gi" }
    limits:   { cpu: "1",    memory: "2Gi" }

otelCollector:
  resources:
    requests: { cpu: "500m", memory: "1Gi" }
    limits:   { cpu: "2",    memory: "4Gi" }
  # Expose OTLP inside the cluster only; ingress handles the UI (step 4)
  serviceType: ClusterIP

frontend:
  service:
    type: ClusterIP

# Retention (hours). 360h traces ≈ 15 days, 1080h metrics ≈ 45 days.
# These drive ClickHouse TTLs and therefore disk usage.
retention:
  totalRetentionPeriod: 360h
  metricsTotalRetentionPeriod: 1080h
  logsTotalRetentionPeriod: 360h
A note on secrets: SigNoz’s own components do not need external credentials to start, but do not bake any S3/GCS cold-storage keys or SMTP passwords into this file. Pull those from HashiCorp Vault — run the Vault Agent Injector and reference the secret via an annotation on the pod, or sync it with the Vault Secrets Operator into a Kubernetes Secret the chart consumes. Keeping cold-storage and alert-channel credentials out of values.yaml (and out of git) is the difference between a clean review and a leaked-credential incident.
3. Install the chart and watch it converge
Install into the namespace with your pinned version and values:
helm install signoz signoz/signoz \
  --namespace platform-signoz \
  --version "${SIGNOZ_CHART_VERSION}" \
  --values signoz-values.yaml \
  --wait --timeout 15m
ClickHouse and Zookeeper come up first; query-service and the collector wait on them. Watch the rollout:
kubectl -n platform-signoz get pods -w
# Expect, eventually all Running/Ready:
#   chi-signoz-clickhouse-cluster-0-0-0   Running
#   signoz-zookeeper-0                     Running
#   signoz-otel-collector-...              Running
#   signoz-query-service-0                 Running
#   signoz-frontend-...                    Running

# If a pod is Pending, it is almost always storage or resources:
kubectl -n platform-signoz describe pod -l app.kubernetes.io/component=clickhouse | tail -30
kubectl -n platform-signoz get pvc
The chart also installs the k8s-infra sub-chart — a DaemonSet of OTel Collector agents plus a cluster-metrics deployment — which immediately begins collecting node/pod metrics and pod logs and forwarding them to the central collector. That is why logs and infra metrics appear in the UI before you have instrumented a single application.
4. Expose the UI behind your ingress and SSO
Reach the UI quickly with a port-forward to confirm it is alive, then put it behind a real ingress — never expose query-service or the collector to the public internet directly.
# Quick smoke test only:
kubectl -n platform-signoz port-forward svc/signoz-frontend 3301:3301
# open http://localhost:3301
For durable access, front the frontend service with an Ingress and terminate TLS at the cluster. Authentication is the part that makes security sign off: SigNoz supports SAML/OIDC SSO on its paid tier, but the robust pattern that works on any edition is to put an OIDC-aware proxy in front of it and federate to your IdP. Wire oauth2-proxy to Microsoft Entra ID (or Okta as the workforce IdP, brokered to Entra) so only authenticated, group-scoped employees reach the dashboards:
# ingress-signoz.yaml
apiVersion: networking.k8s.io/v1
kind: Ingress
metadata:
  name: signoz
  namespace: platform-signoz
  annotations:
    nginx.ingress.kubernetes.io/auth-url: "https://oauth2.internal.example.com/oauth2/auth"
    nginx.ingress.kubernetes.io/auth-signin: "https://oauth2.internal.example.com/oauth2/start?rd=$scheme://$host$request_uri"
spec:
  ingressClassName: nginx
  tls:
    - hosts: ["signoz.internal.example.com"]
      secretName: signoz-tls
  rules:
    - host: signoz.internal.example.com
      http:
        paths:
          - path: /
            pathType: Prefix
            backend:
              service:
                name: signoz-frontend
                port: { number: 3301 }
kubectl apply -f ingress-signoz.yaml
Here oauth2-proxy validates the Entra/Okta token and only then lets the request reach SigNoz; group claims map to who may view production traces. Put Akamai (or your CDN/WAF) in front of the ingress for TLS, anycast, and bot/flood protection if the endpoint is reachable beyond the corporate network.
5. Point your applications’ OTLP exporters at SigNoz
Now feed it real telemetry. Every emitter — SDK or agent — sends OTLP to the central collector’s in-cluster DNS name: signoz-otel-collector.platform-signoz.svc.cluster.local, gRPC on 4317, HTTP on 4318. For a containerized service using the OpenTelemetry SDK, set the standard env vars (no vendor SDK, no API key — that portability is the dividend of OpenTelemetry):
# In your app Deployment's container spec:
env:
  - name: OTEL_EXPORTER_OTLP_ENDPOINT
    value: "http://signoz-otel-collector.platform-signoz.svc.cluster.local:4317"
  - name: OTEL_EXPORTER_OTLP_PROTOCOL
    value: "grpc"
  - name: OTEL_SERVICE_NAME
    value: "checkout-api"
  - name: OTEL_RESOURCE_ATTRIBUTES
    value: "deployment.environment=prod,service.namespace=payments,service.version=2.7.1"
  # Sample to control cost on high-traffic services:
  - name: OTEL_TRACES_SAMPLER
    value: "parentbased_traceidratio"
  - name: OTEL_TRACES_SAMPLER_ARG
    value: "0.1"           # 10% — raise for low-traffic, lower for firehose services
To instrument without touching app code, use the OpenTelemetry Operator’s auto-instrumentation: install the operator, create an Instrumentation CR pointing at the same collector endpoint, and annotate your pods. For a Java service:
kubectl apply -f https://github.com/open-telemetry/opentelemetry-operator/releases/latest/download/opentelemetry-operator.yaml
# instrumentation.yaml
apiVersion: opentelemetry.io/v1alpha1
kind: Instrumentation
metadata:
  name: otel-auto
  namespace: payments
spec:
  exporter:
    endpoint: "http://signoz-otel-collector.platform-signoz.svc.cluster.local:4317"
  propagators: ["tracecontext", "baggage"]
  sampler:
    type: parentbased_traceidratio
    argument: "0.1"
kubectl apply -f instrumentation.yaml
# Then add this annotation to the pod template of a Java workload:
#   instrumentation.opentelemetry.io/inject-java: "true"
Roll out the change through your existing delivery path — a GitHub Actions (or Jenkins) pipeline that builds and tests, with Argo CD syncing the updated manifests into the cluster — so the instrumentation env vars land via GitOps and are reviewable in a PR, not kubectl-applied by hand. Manage the SigNoz Helm release itself the same way: declare it in Terraform (the helm_release resource) or as an Argo CD Application, with Ansible handling any node-level prerequisites like sysctl tuning for ClickHouse on the worker nodes.
6. Verify traces, logs, and metrics in the UI
Generate load (deploy the OpenTelemetry demo or hit your instrumented service), then confirm all three signals correlate.
# Optional: the official OTel demo, repointed at SigNoz, is the fastest end-to-end proof.
helm install otel-demo open-telemetry/opentelemetry-demo \
  --namespace otel-demo --create-namespace \
  --set 'default.envOverrides[0].name=OTEL_EXPORTER_OTLP_ENDPOINT' \
  --set 'default.envOverrides[0].value=http://signoz-otel-collector.platform-signoz.svc.cluster.local:4317'
In the SigNoz UI: Services should list each service.name with p50/p99 latency, request rate, and error rate (the RED metrics) — this is your service-level dashboard, populated automatically from traces. Click a service → a slow trace → and use the trace-to-logs link to jump to that request’s logs in Logs Explorer, filtered by trace ID. That correlation — one click from a slow span to its logs — is the operational payoff and worth verifying explicitly.
Dashboards and alerting
SigNoz hands you two things without any dashboard-building: the Services page (RED metrics per service, derived from traces) and the infra dashboards (node/pod metrics, from the k8s-infra agents). You operate on top of those.
Dashboards. A SigNoz dashboard is a set of panels, each backed by a query against traces, metrics, or logs. Build them in the UI, but manage them as JSON in git (the UI imports and exports dashboard JSON) — that way a dashboard is reviewable and reproducible like any other config, and a dashboard is never a click-path only one person can rebuild. Panels can mix signals: a latency time-series (metric) beside an error-log count (log) beside a trace-count (trace), all scoped to one service on one board.
Alerts. An alert watches a query and fires to a channel (Slack, PagerDuty, email, webhook) when a threshold or anomaly triggers. The three shapes you will reach for:
- Metric threshold — “error rate on checkout-api > 2% for 5 minutes.”
- Trace-derived — “p99 latency on the
/payendpoint > 800 ms.” - Log-based — “count of
level=errorlogs from payments > 50 in 5 minutes.”
A representative metric alert, expressed as the values a SigNoz alert rule captures (the UI writes these; you can also manage the exported JSON in git):
# Representative SigNoz alert rule (as configured in the UI / exported JSON)
alert: HighCheckoutErrorRate
metric: signoz_calls_total          # RED "calls" counter, filtered to errors
condition:
  op: "> "
  threshold: 2                       # percent
  matchType: "at_least_once"
  evalWindow: 5m
labels:
  severity: page
  service: checkout-api
annotations:
  summary: "checkout-api error rate above 2% for 5 minutes"
notifications:
  - channel: pagerduty-payments
Route severity: page alerts to PagerDuty and everything else to Slack, and raise a ServiceNow incident from the page so there is a ticket and an audit trail, not just a channel ping — the same closing move the intro scenario ends on. Alerting well is a discipline of its own: threshold alerts are easy to write and easy to make noisy, so the SLO and burn-rate math that keeps alerts trustworthy lives in Going deeper.
Validation
Prove the pipeline from the wire up, not just from the UI:
# 1. The collector is receiving OTLP — send a synthetic trace with telemetrygen:
kubectl -n platform-signoz run telemetrygen --rm -it --restart=Never \
  --image=ghcr.io/open-telemetry/opentelemetry-collector-contrib/telemetrygen:latest -- \
  traces --otlp-endpoint signoz-otel-collector:4317 --otlp-insecure --traces 5

# 2. The collector's own metrics confirm accepted vs refused spans:
kubectl -n platform-signoz port-forward svc/signoz-otel-collector 8888:8888 &
curl -s localhost:8888/metrics | grep -E 'otelcol_receiver_accepted_spans|otelcol_exporter_send_failed'

# 3. Data actually landed in ClickHouse — query the traces table directly:
kubectl -n platform-signoz exec -it chi-signoz-clickhouse-cluster-0-0-0 -- \
  clickhouse-client --query \
  "SELECT count() FROM signoz_traces.signoz_index_v3 WHERE timestamp > now() - INTERVAL 10 MINUTE"

# 4. Query-service health and the API behind the UI:
kubectl -n platform-signoz exec -it signoz-query-service-0 -- wget -qO- localhost:8080/api/v1/health
A non-zero count in step 3 and accepted_spans rising in step 2 mean the path SDK → agent → collector → ClickHouse is intact. If send_failed climbs, the collector cannot reach ClickHouse — check the ClickHouse pod and the collector logs.
Rollback / teardown
Because the release is Helm-managed, rollback is clean. To revert a bad upgrade:
helm -n platform-signoz history signoz
helm -n platform-signoz rollback signoz <previous-revision> --wait
To remove SigNoz entirely — note that Helm does not delete PVCs, so storage (and your telemetry) survives an uninstall unless you remove the volumes explicitly:
helm -n platform-signoz uninstall signoz
helm -n otel-demo uninstall otel-demo            # if you installed the demo

# Data is still on disk until you delete the claims — do this only to wipe telemetry:
kubectl -n platform-signoz delete pvc -l app.kubernetes.io/instance=signoz
kubectl delete namespace platform-signoz otel-demo
Before any teardown, if the data matters, snapshot it: take a ClickHouse BACKUP to object storage, or snapshot the underlying PVs through your CSI driver.
Going deeper
Everything above gets a working stack. This section is for the engineer who has to run it at scale, keep the bill down, and explain the design choices in a review.
OpenTelemetry: the standard underneath
The whole stack rests on OpenTelemetry, a CNCF project now among the most active after Kubernetes itself. It defines four things you are implicitly relying on:
- OTLP (the OpenTelemetry Protocol) — the wire format every component speaks: protobuf over gRPC (4317) or HTTP (4318), one protocol for all three signals. Because it is a spec, your app’s exporter, the node agent, the gateway, and SigNoz’s collector interoperate across versions and even vendors.
- The Collector — a single binary with the receiver → processor → exporter pipeline you met earlier. A real pipeline that receives OTLP, caps memory, batches, and writes to ClickHouse looks like this:
# otel-collector pipeline (conceptual — SigNoz ships its own tuned version)
receivers:
  otlp:
    protocols:
      grpc: { endpoint: 0.0.0.0:4317 }
      http: { endpoint: 0.0.0.0:4318 }
processors:
  memory_limiter:
    check_interval: 1s
    limit_percentage: 80
    spike_limit_percentage: 25
  batch:
    send_batch_size: 10000
    timeout: 5s
exporters:
  clickhousetraces:
    datasource: tcp://clickhouse:9000/signoz_traces
service:
  pipelines:
    traces:
      receivers: [otlp]
      processors: [memory_limiter, batch]
      exporters: [clickhousetraces]
memory_limiter first, batch last is the ordering that keeps a collector from OOMing under a flood — the limiter sheds load before the batcher buffers it. Memorize that order; the reverse is a classic outage.
- The Operator + auto-instrumentation injection — the mechanism behind step 5’s one-line annotation. The OpenTelemetry Operator registers a mutating admission webhook. When a pod is created carrying
instrumentation.opentelemetry.io/inject-java: "true", the webhook intercepts the create, adds an init-container (opentelemetry-auto-instrumentation) that copies the language agent into a shared volume, and sets the env vars (the JVM-javaagent, theOTEL_*variables) on your container so the agent loads at startup — all with no rebuilt image. It supports Java, .NET, Node.js, Python, and Go. The annotation can also point at a specificInstrumentationCR bynamespace/namewhen you run more than one profile. - Semantic conventions — the agreed names for attributes (
service.name,http.request.method,db.system). They are why SigNoz can draw a Services dashboard from any language’s traces with no per-app configuration: everyone labels a service the same way. One current caveat worth pinning versions for: some conventions are still stabilizing —deployment.environmentwas superseded bydeployment.environment.name— so pin your SDK/agent versions and let the collector normalize rather than chase renames across a fleet.
The three signals and how they correlate
Correlation is the entire reason to keep the three signals in one store. Two mechanisms make the one-click pivot work, and both depend on a shared trace ID:
- Trace ↔ Logs, by trace ID. Context propagation stamps a trace ID (and span ID) onto every log record emitted inside a span — the OTel log data model carries
TraceId/SpanIdfields. SigNoz’s logs pipeline extracts those (from JSON attributes, or via a regex on plain text) into the standard fields, so one click on a slow span opens exactly that request’s logs, filtered by trace ID. If your logs do not carry a trace ID, this pivot silently does nothing — the single most common reason “trace-to-logs doesn’t work.” - Metrics ↔ Traces, by exemplar. A metric is an aggregate — by itself it has no request identity. An exemplar fixes that: when a histogram bucket records a value, it can attach a sample trace ID representing that measurement. So when p99 latency spikes on a chart, the exemplar hands you a trace ID for one of the slow requests behind the spike, and you jump from the aggregate straight to a concrete example.
That is the full triangle: metric spike → exemplar → a slow trace → trace-to-logs → the exact stack trace. Design your instrumentation so all three signals carry the same trace ID and a consistent service.name, and the three-way pivot just works.
ClickHouse: storage, retention, and the disk bill
- Retention is a TTL, enforced by ClickHouse. The
retentionblock in yourvalues.yamlbecomes a ClickHouseTTLon the tables — rows older than the window are dropped in the background. This is the primary disk lever; set it to your compliance window and no higher. - Tiered storage moves cold data to object storage. ClickHouse supports a storage policy with multiple volumes — hot NVMe/SSD for the recent window, an S3/GCS disk for older data. A
MOVE TTLages a partition from SSD to S3 automatically, so hot SSD holds only days while months live cheaply in object storage. This is how you keep long retention without a large SSD bill. - Schema and the versioned table name. Traces land in the
signoz_tracesdatabase; the index table the UI queries issignoz_index_v3in current versions — note the versioned name. A chart upgrade can migrate the schema, which is exactly why you pin the chart version and test upgrades in staging before an incident forces a blind bump. - Scaling ClickHouse. A single node is fine to prove the pipeline. For production, run a sharded, replicated cluster (
clickhouse.layout.shardsCount/clickhouse.layout.replicasCountin the chart) with ZooKeeper/Keeper coordinating replication — shards spread write and query load, replicas provide HA.
Sampling: head vs. tail
Sampling is how you keep cost sane without going blind. There are two strategies, and mature setups use both:
| Head sampling | Tail sampling | |
|---|---|---|
| Decision made | At the start of the trace, before the outcome is known | After the whole trace is collected |
| Where | SDK or agent (the OTEL_TRACES_SAMPLER in step 5) |
A gateway collector with the tail_sampling processor |
| Cost | Cheapest — dropped traces never travel the network | Higher — every span is buffered until the decision |
| Keeps all errors / slow traces? | No — the decision is blind to outcome | Yes — that is the entire point |
| Complexity | Trivial | Needs trace-aware routing |
Head sampling (step 5, parentbased_traceidratio at 0.1) is a blind coin flip keyed on the trace ID — cheap, and consistent across services because every service in a trace makes the same decision, but it drops errors at the same rate as successes. Tail sampling waits for the full trace, then applies policies — for example “keep 100% of traces with an error, 100% slower than 1 s, and 5% of the rest”:
# Gateway collector: keep all errors + slow traces, sample the rest
processors:
  tail_sampling:
    decision_wait: 10s
    policies:
      - name: errors
        type: status_code
        status_code: { status_codes: [ERROR] }
      - name: slow
        type: latency
        latency: { threshold_ms: 1000 }
      - name: sample-rest
        type: probabilistic
        probabilistic: { sampling_percentage: 5 }
There is a catch that dictates your topology: tail sampling only works if every span of a trace reaches the same collector instance — otherwise the processor decides on a partial trace and gets it wrong. So the standard pattern is an agent tier (DaemonSet — light head sampling + batching) exporting with the loadbalancingexporter keyed on trace ID to a gateway tier (Deployment running tail_sampling), which guarantees all spans of a trace land on one gateway pod. Many teams combine both: agents do light head sampling (say 50%) to cut network traffic, and the gateway applies the tail policies on what remains.
SLOs and alerting that doesn’t cry wolf
Threshold alerts (“error rate > 2%”) tend to page too often or too late. SLO-based alerting fixes the aim. An SLO (say, “99.9% of checkouts succeed over 30 days”) implies an error budget (0.1% may fail). You alert on burn rate — how fast you are spending that budget — not on instantaneous error rate: a fast burn (budget gone in hours) pages immediately; a slow burn (budget gone in weeks) opens a ticket. This multi-window, multi-burn-rate pattern from Google’s SRE practice is what turns SigNoz’s RED metrics into alerts an on-call actually trusts. Build the SLI from the same signoz_calls_total and latency metrics the Services page already exposes.
Self-hosted vs. SaaS, and why OTel means no lock-in
The build-vs-buy calculus, stated plainly:
- Self-hosted SigNoz wins when data must stay in your VPC (compliance, PII), when per-GB SaaS ingest pricing has outrun the cost of running ClickHouse (the intro scenario, exactly), and when you want one tool you fully control.
- SaaS wins when you would rather not operate a stateful ClickHouse cluster, want turnkey ML/anomaly features, and the bill is acceptable — the trade is money for zero operational burden. Deploying the Datadog agent on Kubernetes walks that model.
- The decision is reversible, and that is the whole point of OpenTelemetry. Because your apps emit vendor-neutral OTLP, switching backends is a collector exporter change, not a re-instrumentation project. You can even dual-export — send the same OTLP to SigNoz and a SaaS during a migration — and cut over with zero application changes. Instrument once with OTel; never be locked in again.
Scaling the collector: agent vs. gateway
- Agent (DaemonSet) — one collector per node, close to the pods. Cheap network hop, collects pod logs and host metrics, does light processing (batch, memory_limiter, head sampling). This is the k8s-infra sub-chart from step 3.
- Gateway (Deployment) — a horizontally-scaled central tier for expensive, stateful work: tail sampling, cross-service aggregation, egress to the backend, central redaction. Scale it with an HPA on CPU or queue length.
- Two tiers together is the production shape: agents fan in to a gateway. SigNoz’s own Helm chart already reflects this thinking — recent versions run two collectors, one for metrics and one for logs/traces, so each scales on its own workload profile.
A note on SigNoz’s own architecture, current: recent releases consolidated the separate query-service, frontend, and alertmanager processes into a single signoz binary that serves both the API and the UI on port 8080 (older versions — like the chart pinned in this lesson — still show separate signoz-query-service and signoz-frontend pods on 3301). The single binary supports both a unified deployment (everything in one process, simplest to run) and a service-specific deployment (components split out for HA and independent scaling). If your helm search shows a newer chart than the one pinned here, expect the consolidated names and the 8080 port — the collector and ClickHouse tiers are unchanged, so everything else in this lesson still holds.
Practice challenges
Work these against a scratch cluster (a single-node ClickHouse is enough). Each has a graded solution — try it before you peek.
Challenge 1 (Beginner) — Pre-flight the storage. Before installing, confirm the cluster has a default StorageClass, and if not, make gp3 the default. Why does this matter for SigNoz specifically?
<details> <summary>Solution</summary>
kubectl get storageclass         # look for "(default)" in the NAME column
kubectl patch storageclass gp3 -p \
  '{"metadata":{"annotations":{"storageclass.kubernetes.io/is-default-class":"true"}}}'
ClickHouse and ZooKeeper are StatefulSets that request PersistentVolumeClaims; with no default StorageClass the PVCs stay Pending and the pods never start. This is the number-one install hang.
</details>
Challenge 2 (Beginner) — Emit and confirm a service. Point one workload at the collector and make it appear on the Services page. Which env var is mandatory for the service to be named?
<details> <summary>Solution</summary>
env:
  - name: OTEL_EXPORTER_OTLP_ENDPOINT
    value: "http://signoz-otel-collector.platform-signoz.svc.cluster.local:4317"
  - name: OTEL_SERVICE_NAME
    value: "checkout-api"
OTEL_SERVICE_NAME sets the service.name attribute, which SigNoz groups the Services page by. Without it, telemetry lands under unknown_service.
</details>
Challenge 3 (Intermediate) — Cut trace volume by 90%. A firehose service is filling ClickHouse. Apply head sampling at 10% and verify the collector’s accepted-span rate drops.
<details> <summary>Solution</summary>
env:
  - name: OTEL_TRACES_SAMPLER
    value: "parentbased_traceidratio"
  - name: OTEL_TRACES_SAMPLER_ARG
    value: "0.1"
Confirm on the collector’s own metrics:
kubectl -n platform-signoz port-forward svc/signoz-otel-collector 8888:8888 &
curl -s localhost:8888/metrics | grep otelcol_receiver_accepted_spans
parentbased_ keeps the whole trace consistent — child services honour the root’s decision instead of each flipping its own coin, so you never get half a trace.
</details>
Challenge 4 (Intermediate) — Prove the data at the source. Skip the UI entirely. Show, from ClickHouse directly, that traces from the last 10 minutes landed.
<details> <summary>Solution</summary>
kubectl -n platform-signoz exec -it chi-signoz-clickhouse-cluster-0-0-0 -- \
  clickhouse-client --query \
  "SELECT count() FROM signoz_traces.signoz_index_v3 WHERE timestamp > now() - INTERVAL 10 MINUTE"
A non-zero count proves SDK → agent → collector → ClickHouse end to end, independent of the query-service or the UI — the fastest way to isolate whether a “no data” problem is ingest or display. </details>
Challenge 5 (Advanced) — Keep every error, sample the rest. Head sampling drops errors at the same rate as successes. Design a gateway policy that keeps 100% of error and >1 s traces but only 5% of the rest. What topology constraint does this force?
<details> <summary>Solution</summary>
processors:
  tail_sampling:
    decision_wait: 10s
    policies:
      - name: errors
        type: status_code
        status_code: { status_codes: [ERROR] }
      - name: slow
        type: latency
        latency: { threshold_ms: 1000 }
      - name: rest
        type: probabilistic
        probabilistic: { sampling_percentage: 5 }
Constraint: all spans of a trace must reach the same collector instance, so the agents must export with the loadbalancingexporter keyed on trace ID to the gateway tier. Otherwise the tail processor sees partial traces and its decisions are wrong.
</details>
Challenge 6 (Advanced) — Cap the disk bill at long retention. You must keep 90 days of traces for compliance but only have room for ~10 days on SSD. Outline the ClickHouse configuration that satisfies both.
<details> <summary>Solution</summary>
Use tiered storage: a ClickHouse storage policy with a hot SSD volume and an S3 volume, plus a MOVE TTL that ages partitions to S3 after ~10 days while the table’s delete TTL is 90 days.
-- sketch of the table TTL (SigNoz manages the real DDL for you)
TTL toDateTime(timestamp) + INTERVAL 10 DAY TO VOLUME 's3',
    toDateTime(timestamp) + INTERVAL 90 DAY DELETE
Hot SSD holds ~10 days; days 11–90 live cheaply in object storage; day 91 is dropped. You get the compliance window without paying for the SSD to hold all of it. </details>
Common pitfalls
- No default StorageClass → ClickHouse stuck
Pending. The most frequent failure. Mark a default SC (step 1) before installing. - Under-provisioned ClickHouse → OOMKills under query load. Aggregations are memory-intensive; give ClickHouse a real
resourcesPresetand limits, and watchkubectl top pod. - Exporting to the wrong endpoint. Apps must hit the in-cluster service DNS, not
localhost. gRPC is 4317, HTTP 4318 — mixing them up yields silent connection refusals. - No sampling on a firehose service. 100% trace ingest from a high-QPS service fills ClickHouse fast. Set
OTEL_TRACES_SAMPLER_ARGdeliberately per service. - Retention left at defaults. If you do not set the retention block, disk grows until the PV fills and ClickHouse wedges. Set TTLs to your compliance window in step 2.
helm upgradeacross a schema change mid-incident. Pin the chart version; test upgrades in staging first, since ClickHouse migrations run on upgrade.
Common beginner mistakes
These are the misconceptions that trip up newcomers — distinct from the symptom-and-fix pitfalls above. Each is the wrong mental model, why it’s wrong, and the right one.
“Capturing 100% of traces is the safe, complete choice.” It feels responsible, but on a high-QPS service it is how you turn a cost-savings project into a bigger ClickHouse bill than the SaaS you left. The right model: sampling is not data loss, it is statistics. 10% of healthy traces still gives accurate latency percentiles, and a tail sampler keeps 100% of the errors that actually matter. Sample deliberately per service; do not confuse raw volume with signal.
“I added the SDK, so traces will obviously connect across services.” Not without context propagation. A trace only stays one trace if the trace ID is carried across every hop — in HTTP/gRPC headers (the W3C traceparent header) and through async boundaries (queues, threads). Drop propagation at one service and the trace fractures into disconnected pieces. The model: a trace ID is a baton in a relay, and every service must pass it on. Auto-instrumentation and the tracecontext propagator handle this — right up until a hand-rolled HTTP client or a message queue quietly drops the header.
“The central collector is just a forwarder, so one replica is fine.” Then it is a single point of failure and a bottleneck — if it restarts, every app’s telemetry is dropped for that window, and under load it becomes the throttle on your entire pipeline. The model: the ingest path deserves the same HA thinking as any critical service — run the gateway as a scaled Deployment behind a Service, let agents buffer and retry, and size it for peak, not average.
“Logs and traces are separate tools, so I’ll just grep logs when something breaks.” That throws away the one-click pivot that makes this whole stack worth running. Logs without a trace ID are an unsearchable pile at 2 a.m. The model: a log line’s job is not only to say what happened but which request it happened in — get the trace ID into every log (structured logging plus propagation) so a slow span opens its own logs instantly.
“More instrumentation is always better — instrument everything.” Over-instrumentation buries the signal in noise, inflates cardinality (every unique attribute value is a new time series — a user_id label can explode a metric into millions of series and OOM ClickHouse), and raises cost with no diagnostic gain. The model: instrument the boundaries that matter (service entry/exit, DB calls, external APIs) well; keep high-cardinality identifiers on traces and logs (where they are cheap) and off metric labels (where they are ruinous). Precision beats coverage.
Security notes
Keep the collector’s OTLP ports and query-service ClusterIP-only; never put a public LoadBalancer on them — telemetry often contains request paths, user IDs, and headers you do not want exposed. Gate the UI behind oauth2-proxy → Entra ID / Okta with group-based access so only authorized engineers see production traces, and front it with Akamai for WAF if it is internet-reachable. Source any cold-storage (S3/GCS) and SMTP credentials from HashiCorp Vault, never values.yaml or git. Scrub PII at the collector with a transform/redaction processor before it reaches ClickHouse. Treat the cluster itself as a workload to defend: Wiz (and Wiz Code on your IaC) continuously scans the manifests and live cluster for posture drift like an accidentally-public service or an over-broad RBAC role, while CrowdStrike Falcon sensors on the node pool provide runtime threat detection feeding your SOC. A NetworkPolicy restricting who may reach the collector closes the loop.
Cost notes
The entire reason this project exists is cost, so engineer for it. ClickHouse’s columnar compression plus tuned retention TTLs are the two biggest levers — 15 days of traces and 45 days of metrics is a defensible default that keeps disk small; lengthen only where compliance demands. Sampling at the SDK is the second lever: dropping high-volume traces to 10% cuts ingest and storage proportionally with negligible loss of signal on healthy services (keep error traces with a tail sampler). Move old data to S3/GCS cold storage via ClickHouse tiered storage so hot SSD holds only the recent window. Run ClickHouse on right-sized nodes (memory-optimized instances earn their price here) and scale replicas only when query concurrency demands it. The payoff is concrete: the same traces-metrics-logs coverage the team had on the SaaS vendor, on infrastructure they already pay for, with a bill that scales with disk and compute they control rather than per-gigabyte ingest — which is exactly the number that started the conversation.
Glossary
- APM (Application Performance Monitoring) — tooling that shows how your application behaves in production: latency, errors, throughput, and the traces behind them.
- Observability — the property of being able to ask new questions about your system from its outputs (traces, metrics, logs) without shipping new code to answer them.
- OpenTelemetry (OTel) — the vendor-neutral CNCF standard for generating and shipping telemetry: the SDKs, the Collector, OTLP, and the semantic conventions.
- OTLP (OpenTelemetry Protocol) — the wire format for all three signals; protobuf over gRPC (port 4317) or HTTP (port 4318).
- Signal — one of the three telemetry data types: trace, metric, or log.
- Trace — the end-to-end record of one request as it moves through services, made of spans.
- Span — one timed unit of work within a trace (e.g. a single DB call), with a start, a duration, and attributes.
- Trace ID — the identifier shared by every span (and ideally every log) of one request; the key that links the signals.
- Context propagation — passing the trace ID/span ID across service and thread/queue boundaries (the W3C
traceparentheader) so a trace stays connected. - Metric — a number sampled over time: counter, gauge, or histogram.
- Log — a timestamped text record emitted by a service.
- Exemplar — a sample trace ID attached to a metric data point, letting you jump from an aggregate (a spike) to a representative trace.
- RED metrics — Rate, Errors, Duration: the three per-service signals SigNoz derives from traces for the Services dashboard.
- SLI / SLO / error budget — a Service Level Indicator is a measured success rate; the Objective is the target (e.g. 99.9%); the error budget is the allowed shortfall you alert on by burn rate.
- Sampling (head / tail) — keeping a subset of traces to control cost; head decides up front (blind to outcome), tail decides after the full trace (can keep all errors).
- OTel Collector — the pipeline binary (receivers → processors → exporters) that receives, transforms, and forwards telemetry.
- Receiver / Processor / Exporter — the three stages of a collector pipeline: take in, transform, send on.
- Agent vs. Gateway — collector deployment modes: an agent is a per-node DaemonSet close to the pods; a gateway is a scaled central Deployment for heavy or stateful work.
- Auto-instrumentation — zero-code telemetry injected by the OTel Operator via a pod annotation and an init-container.
- Instrumentation (CR) — the OTel Operator custom resource (
opentelemetry.io/v1alpha1) that configures what auto-instrumentation injects. - ClickHouse — the open-source columnar database SigNoz uses to store all three signals.
- Columnar store — a database that stores each column contiguously, making aggregations fast and compression high — ideal for telemetry.
- TTL (time-to-live) / retention — the age after which ClickHouse deletes (or tiers) telemetry; your main disk-cost lever.
- Tiered storage — moving old partitions from hot SSD to cheap object storage (S3/GCS) automatically via a
MOVE TTL. - StorageClass / PVC — how Kubernetes provisions durable disk; ClickHouse needs a default StorageClass to bind its PersistentVolumeClaims.
- Semantic conventions — OTel’s standard attribute names (
service.name,http.request.method) that let any backend understand any language’s telemetry. - Single binary (SigNoz) — the current SigNoz architecture that serves API + UI from one
signozprocess on port 8080, replacing the separate query-service/frontend.
Where this lands
When it is running, an on-call engineer paged at 2 a.m. opens one SigNoz tab, sees checkout-api error rate spiking on the Services dashboard, clicks into a failing trace, follows the trace-to-logs link to the exact stack trace, and confirms the bad deploy — all without leaving the tool and without the data ever leaving the company’s VPC. Optionally raise a ServiceNow incident from the alert so there is a ticket and an audit trail, not just a Slack ping. That single-pane, OpenTelemetry-native, self-hosted workflow — traces, metrics, and logs correlated in one ClickHouse-backed UI you own — is the destination. Start with a single-node ClickHouse and the demo to prove the pipeline, then scale ClickHouse to a replicated cluster, harden the ingress, and bring it under GitOps; that is the path from a weekend proof to a platform the whole engineering org relies on.