A Kubernetes Deployment will happily roll a broken image to 100% of your traffic as fast as readiness probes allow, because a passing readiness probe says nothing about your error rate or p99 latency. Progressive delivery closes that gap: you shift a small slice of traffic, measure real SLOs against the canary, and let a controller promote or roll back on the evidence. This article shows how to do that end to end with Argo Rollouts – converting a Deployment, shaping traffic, wiring Prometheus-backed analysis, and gating CI.
In a nutshell
A canary release is a taste-test before you serve the whole dining room. When a kitchen tries a new recipe, it does not plate it for all two hundred guests at once – it sends one dish to a single table, watches whether they eat it or send it back, and only then rolls the recipe out to everyone. If that one table complains, the kitchen pulls the dish before anyone else is affected. The name comes from the canaries miners carried underground: a small, sacrificial signal that warns you before the whole shaft is in danger.
That is exactly what Argo Rollouts does for a Kubernetes deployment. Instead of swapping every pod to the new version and hoping, you shift a small percentage of real production traffic – say 20% – to the new version, watch its actual metrics (are requests still returning 200s? is latency still under budget?), and let a controller automatically promote it to 100% if the numbers hold, or roll it straight back if they don’t. No human staring at a dashboard at 3am; the definition of “healthy,” written once in Git, makes the call on every release.
Why should a beginner care? Because the default Kubernetes rolling update – covered in Deployments, ReplicaSets, rollouts and rollback – has no idea whether the new version works. It only checks that the process started. A canary with metric analysis is the difference between “the pod is Running” and “users are being served correctly,” and it turns a 3am incident into a build that simply goes red on its own.
Level: Advanced · Time: ~29 min
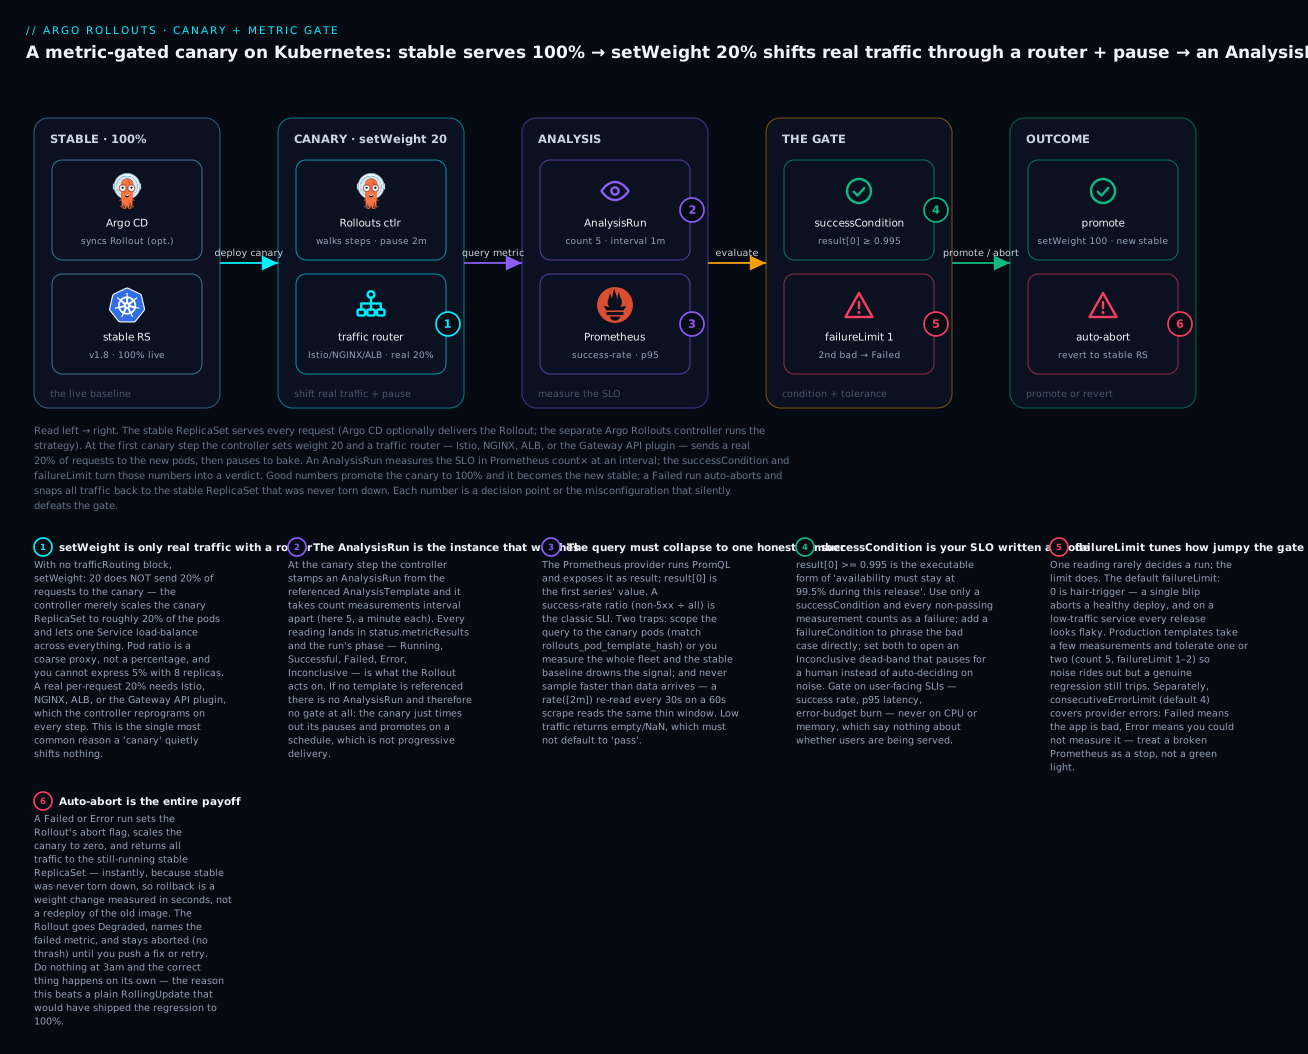
Read the diagram left to right and it is the whole lesson in one picture: stable serves 100%, a step shifts a real 20% through the traffic router and pauses, an AnalysisRun asks Prometheus whether the SLO still holds, and the successCondition/failureLimit verdict either promotes the canary to become the new stable or auto-aborts back to the stable ReplicaSet that was never torn down. The six numbered badges mark the exact places a canary goes wrong – (1) setWeight shifting nothing because no traffic router is configured, (2) the AnalysisRun that must actually be referenced to exist, (3) a Prometheus query that has to collapse to one honest number scoped to the canary, (4) the successCondition that encodes your SLO, (5) the failureLimit that decides how jumpy the gate is, and (6) the auto-abort that is the entire reason this beats a rolling update. Keep the picture in mind; every section below is one of these stages in detail.
1. Why rolling updates are not enough
A rolling update is a mechanical strategy: new pods become Ready before old ones are removed, respecting maxSurge and maxUnavailable. What it cannot answer is the only question that matters during a release – is the new version actually serving requests correctly? Readiness checks that a process is up, not that it returns 200s, not that latency is within budget, not that a downstream dependency still resolves under the new code path.
Progressive delivery adds a feedback loop. Promotion becomes conditional on metrics, and rollback is automatic when they regress. The unit of progress is a traffic weight, not a pod count, so blast radius is bounded by the percentage of users exposed rather than by how fast pods schedule.
Argo Rollouts is a drop-in replacement for the
Deploymentcontroller, with aRolloutcustom resource that adds canary and blue-green strategies, nativeAnalysisRunevaluation, and an abort path back to the last stable ReplicaSet. It is a CNCF Graduated project and integrates cleanly with Argo CD.
The mental model to carry through the rest of the lesson: a Deployment gives you speed and a Rollout gives you evidence. A rolling update answers “how fast can I replace pods?”; a canary answers “should I replace them at all?” Everything that follows – traffic weights, pauses, Prometheus queries, abort thresholds – exists to turn that second question into an automatic, repeatable decision.
2. Install the controller and the kubectl plugin
Install the controller into its own namespace, then add the kubectl plugin so you can drive and observe rollouts from the CLI.
# Controller
kubectl create namespace argo-rollouts
kubectl apply -n argo-rollouts \
  -f https://github.com/argoproj/argo-rollouts/releases/latest/download/install.yaml

kubectl rollout status deploy/argo-rollouts -n argo-rollouts
# kubectl plugin (macOS via Homebrew)
brew install argoproj/tap/kubectl-argo-rollouts

# Or download the binary directly (Linux amd64 shown)
curl -fsSLO https://github.com/argoproj/argo-rollouts/releases/latest/download/kubectl-argo-rollouts-linux-amd64
chmod +x ./kubectl-argo-rollouts-linux-amd64
sudo mv ./kubectl-argo-rollouts-linux-amd64 /usr/local/bin/kubectl-argo-rollouts

kubectl argo rollouts version
For a real cluster, pin to a specific release tag instead of latest so the controller version is reproducible, and manage the manifest through your GitOps repo rather than kubectl apply from a laptop.
The plugin is not optional cosmetics. It is how you read a rollout: the get rollout --watch tree view is the canonical way to see which step you are on, the current weight, the live AnalysisRun phase, and the pod-template-hash of each ReplicaSet. There is also a browser dashboard (kubectl argo rollouts dashboard, served on localhost:3100) that renders the same tree with promote/abort buttons – useful when you are teaching the flow or want a non-CLI human to make a promotion call.
3. Convert a Deployment to a Rollout
A Rollout is intentionally similar to a Deployment: the spec.template is identical and most operators carry over verbatim. The differences are that kind becomes Rollout, apiVersion becomes argoproj.io/v1alpha1, and a strategy.canary (or strategy.blueGreen) block replaces the rolling-update strategy.
apiVersion: argoproj.io/v1alpha1
kind: Rollout
metadata:
  name: checkout
  namespace: shop
spec:
  replicas: 8
  revisionHistoryLimit: 3
  selector:
    matchLabels:
      app: checkout
  template:
    metadata:
      labels:
        app: checkout
    spec:
      containers:
        - name: checkout
          image: ghcr.io/acme/checkout:1.8.0
          ports:
            - containerPort: 8080
          readinessProbe:
            httpGet: { path: /healthz, port: 8080 }
          resources:
            requests: { cpu: 200m, memory: 256Mi }
  strategy:
    canary:
      maxSurge: "25%"          # defaults to 25% if omitted
      maxUnavailable: 0         # keep stable capacity intact during the roll
      steps:
        - setWeight: 10
        - pause: { duration: 5m }
Do not run both a
Deploymentand aRolloutwith the sameselector. If you are migrating an existing app, either rename the workload or use theworkloadReffield on the Rollout to reference the existing Deployment so the controller adopts it without you duplicating the pod template.
Apply it and watch the canary surface in the plugin’s tree view:
kubectl apply -f checkout-rollout.yaml
kubectl argo rollouts get rollout checkout -n shop --watch
The workloadRef migration path deserves a second look because it is how most real conversions happen without a risky big-bang cutover. You point the Rollout at the existing Deployment and set scaleDown: onsuccess, so the Deployment keeps serving until the Rollout’s own pods are healthy, then scales to zero:
spec:
  workloadRef:
    apiVersion: apps/v1
    kind: Deployment
    name: checkout
    scaleDown: onsuccess     # progressively scale the old Deployment down
This lets you commit the Rollout beside the live Deployment, let the controller adopt the template, and remove the Deployment in a later commit – a two-step change your GitOps reviewer can actually reason about.
4. Canary steps, traffic weights, and pause conditions
The steps list is a state machine the controller walks top to bottom. The three primitives you will use constantly:
| Step | Effect |
|---|---|
setWeight: N |
Route N% of traffic to the canary (requires a traffic provider; see step 5) |
pause: { duration: 10m } |
Wait a fixed time, then continue automatically |
pause: {} |
Pause indefinitely until a human runs promote |
setCanaryScale |
Decouple canary replica count from traffic weight |
analysis |
Run an inline AnalysisRun that must pass before proceeding (step 6) |
A practical production canary looks like this:
strategy:
  canary:
    canaryService: checkout-canary
    stableService: checkout-stable
    steps:
      - setWeight: 5
      - pause: { duration: 2m }
      - analysis:
          templates:
            - templateName: success-rate-latency
      - setWeight: 25
      - pause: { duration: 5m }
      - setWeight: 50
      - pause: { duration: 5m }
      - setWeight: 100
Two refinements worth knowing. setCanaryScale runs the canary at low replica count while sending little traffic (saving cost during a long bake), or pins an explicit count regardless of weight:
- setCanaryScale:
    weight: 25              # scale canary to 25% of spec.replicas
# or
- setCanaryScale:
    matchTrafficWeight: true   # default behavior: replicas track weight
And dynamicStableScale: true scales the stable ReplicaSet down as the canary weight rises, so you are not paying for double capacity at 50/50. Use it only when you have a traffic provider; without one, abort cannot instantly shift traffic back and you risk a capacity gap on rollback.
Read the step list as a bounded ramp, not a countdown. Each setWeight is a ceiling on blast radius: at setWeight: 5 with a real traffic router, at most 5% of users can be hurt by the new version, no matter how badly it fails. The pause between steps is the bake – the window in which metrics have time to accumulate before you widen exposure. A common beginner instinct is to make the ramp fast (5 → 100 in a minute); the whole value is in pausing long enough at low weight for the analysis to reach a verdict on real traffic. Think “small and slow at the start, wide and fast once proven,” never the reverse.
5. Traffic shaping: NGINX, Istio, or SMI
Without a trafficRouting provider, setWeight is approximated by replica ratio – the controller scales canary vs stable pods so the proportion roughly matches the weight. That is coarse (you cannot do 5% with 8 replicas) and couples traffic to scaling. For real percentage control, plug in an ingress or mesh provider. The controller manipulates that provider’s native objects on each step.
NGINX Ingress. You provide a primary Ingress plus two Services; Rollouts creates and manages a shadow canary Ingress with the nginx.ingress.kubernetes.io/canary annotations, adjusting canary-weight per step.
strategy:
  canary:
    canaryService: checkout-canary   # required
    stableService: checkout-stable   # required
    trafficRouting:
      nginx:
        stableIngress: checkout       # your existing Ingress, backend = stableService
Istio. You own a VirtualService and a DestinationRule with named subsets; Rollouts rewrites the route weights and the subset pod-hash labels. Subset-level splitting needs only a single Service.
strategy:
  canary:
    trafficRouting:
      istio:
        virtualService:
          name: checkout-vsvc
          routes:
            - primary                 # the HTTP route name to manage
        destinationRule:
          name: checkout-destrule
          canarySubsetName: canary
          stableSubsetName: stable
SMI (Service Mesh Interface). For meshes that implement SMI (e.g., Linkerd), the smi provider manages a TrafficSplit object. The mechanics mirror the above: you supply canary and stable Services and the controller adjusts the split weights.
AWS ALB. On EKS the AWS Load Balancer Controller programs an Application Load Balancer; the alb provider rewrites the target-group weights on your Ingress so the split happens at the load balancer, not in the cluster.
strategy:
  canary:
    canaryService: checkout-canary
    stableService: checkout-stable
    trafficRouting:
      alb:
        ingress: checkout-ingress     # your ALB Ingress
        servicePort: 80
        rootService: checkout-root    # optional stable entry point
Gateway API. The vendor-neutral successor to Ingress splits traffic through an HTTPRoute with weighted backendRefs. Rollouts drives it through the Gateway API trafficrouter plugin (argoproj-labs/gatewayAPI), which the controller loads from its ConfigMap. This is the most portable option because the same HTTPRoute works across any conformant gateway, so one canary definition survives a change of ingress vendor.
strategy:
  canary:
    canaryService: checkout-canary
    stableService: checkout-stable
    trafficRouting:
      plugins:
        argoproj-labs/gatewayAPI:
          httpRoute: checkout-route     # the HTTPRoute to manage
          namespace: shop
The providers differ only in where the split happens and how granular it can be:
| Provider | Split point | Needs 2 Services? | Weight granularity | Typical home |
|---|---|---|---|---|
| Replica ratio (none) | kube-proxy / Service | No | Coarse (pod count) | Never for real canaries |
| NGINX Ingress | Ingress controller | Yes | 1% | Simple ingress, staging |
| Istio | Sidecar / mesh | Subset: 1 Service | 1% + header/mirror | Mesh, production |
| SMI (Linkerd) | Mesh (TrafficSplit) |
Yes | 1% | Linkerd meshes |
| AWS ALB | Load balancer | Yes | 1% | EKS |
| Gateway API plugin | Gateway (HTTPRoute) |
Yes | 1% + header/mirror | Portable / multi-vendor |
The provider choice does not change your
steps. That is the point of the abstraction: the same canary definition runs on NGINX in staging and Istio in production, with only thetrafficRoutingblock differing. Verify your provider actually honors small weights – some ingress controllers round aggressively at low percentages.
6. AnalysisTemplates: success rate, latency, and error budgets
This is where progressive delivery earns its name. An AnalysisTemplate (namespaced) or ClusterAnalysisTemplate (cluster-wide, reusable) declares one or more metrics. Each runs a query on a schedule and evaluates the result against a successCondition and/or failureCondition. The aggregate outcome is Successful, Failed, Error, or Inconclusive. The fields that govern the verdict:
| Field | Meaning |
|---|---|
interval |
How often to sample (e.g., 1m) |
count |
Total number of measurements to take |
successCondition |
Expression that, when true, marks a measurement a success |
failureCondition |
Expression that, when true, marks a measurement a failure |
failureLimit |
How many failed measurements are tolerated before the run fails (default 0) |
inconclusiveLimit |
How many inconclusive measurements before the run is inconclusive |
consecutiveErrorLimit |
Provider/query errors tolerated in a row before the run errors (default 4) |
A template that gates on both success rate and p99 latency, parameterized so it works for any service:
apiVersion: argoproj.io/v1alpha1
kind: AnalysisTemplate
metadata:
  name: success-rate-latency
  namespace: shop
spec:
  args:
    - name: service
    - name: namespace
  metrics:
    - name: success-rate
      interval: 1m
      count: 5
      successCondition: result[0] >= 0.995
      failureLimit: 1
      provider:
        prometheus:
          address: http://prometheus-operated.monitoring:9090
          query: |
            sum(rate(http_requests_total{
              service="{{args.service}}",namespace="{{args.namespace}}",
              code!~"5.."}[2m]))
            /
            sum(rate(http_requests_total{
              service="{{args.service}}",namespace="{{args.namespace}}"}[2m]))
    - name: p99-latency
      interval: 1m
      count: 5
      successCondition: result[0] <= 0.4
      failureLimit: 1
      provider:
        prometheus:
          address: http://prometheus-operated.monitoring:9090
          query: |
            histogram_quantile(0.99,
              sum(rate(http_request_duration_seconds_bucket{
                service="{{args.service}}",namespace="{{args.namespace}}"}[2m]))
              by (le))
result is an array; result[0] is the first (and for these queries, only) returned series value. Pass the args from the Rollout step:
- analysis:
    templates:
      - templateName: success-rate-latency
    args:
      - name: service
        value: checkout
      - name: namespace
        value: shop
Inline (in steps) vs background analysis matters. An inline analysis step blocks progression until the run completes. A background analysis runs alongside the whole canary from a chosen step and aborts the moment it fails – ideal for continuous error-budget monitoring across every weight:
strategy:
  canary:
    analysis:                  # background: runs concurrently
      templates:
        - templateName: success-rate-latency
      args:
        - { name: service, value: checkout }
        - { name: namespace, value: shop }
      startingStep: 2          # begin once traffic is non-trivial
    steps:
      - setWeight: 5
      - pause: { duration: 2m }
      - setWeight: 25
      - pause: { duration: 10m }
      - setWeight: 100
For error budgets, encode the SLO directly: a 99.9% target becomes a successCondition of result[0] >= 0.999 over a rolling window, enforced per release. Secrets for authenticated providers (Datadog, New Relic, a secured Prometheus) come from valueFrom.secretKeyRef on an arg, never inlined. If Prometheus itself is new to you, the SLI queries and how to expose http_requests_total are covered in Prometheus and Grafana metrics monitoring.
7. Automated rollback, abort thresholds, and inconclusive runs
The verdict drives the outcome automatically:
- Failed (failures exceed
failureLimit) -> the rollout is aborted. The controller shifts traffic back to the stable ReplicaSet and the canary scales down. No human action required. - Inconclusive (inconclusive measurements exceed
inconclusiveLimit, or no condition matched) -> the rollout pauses at its current step and waits for a human topromoteorabort. This is the correct default for “I genuinely cannot tell” – low traffic at 3am yields too few samples to judge, so the system stops rather than guesses. - Error (the provider itself fails, e.g., Prometheus unreachable, beyond
consecutiveErrorLimit) -> treated as a failure path; do not let a broken metrics pipeline silently green-light a release.
Tune the thresholds to your traffic shape:
metrics:
  - name: success-rate
    interval: 1m
    count: 5
    successCondition: result[0] >= 0.995
    failureLimit: 1            # one bad minute aborts
    inconclusiveLimit: 2       # tolerate two thin-data windows before giving up
    consecutiveErrorLimit: 3   # 3 scrape failures in a row = error
Set a
failureConditionas well as asuccessConditionwhen “not clearly good” should not automatically mean “bad.” With only asuccessCondition, every non-passing measurement counts as a failure. With both, a measurement that satisfies neither is inconclusive – which pauses for a human instead of aborting on noise.
Drive and inspect rollbacks from the plugin:
kubectl argo rollouts get rollout checkout -n shop --watch   # live tree + analysis
kubectl argo rollouts promote checkout -n shop               # advance one step / past a pause
kubectl argo rollouts promote checkout -n shop --full        # skip remaining steps + analysis
kubectl argo rollouts abort  checkout -n shop                # force rollback to stable
kubectl argo rollouts retry  rollout checkout -n shop        # resume an aborted rollout
kubectl argo rollouts undo   checkout -n shop                # roll back to a prior revision
A manual abort is sticky: the Rollout stays in Degraded until you retry or push a new revision, so an aborted release will not silently re-promote on the next reconcile.
8. Argo CD health checks and CI gates
If you run Argo CD, the integration is automatic. Argo CD ships a Lua health check for the argoproj.io/Rollout resource, so a Rollout reports as:
Progressingwhile a canary is advancing,Pausedwhile waiting on a pause or inconclusive analysis,Healthyonce fully promoted,Degradedwhen aborted or failed.
That means an aborted canary turns its Argo CD Application red, and selfHeal will not “fix” it by re-applying, because the manifest in Git is already what is deployed – the failure is runtime, not drift. Surface it in your sync/health gates rather than treating it as config noise.
For pipeline gating outside Argo CD, block the job on the rollout reaching a terminal-good state. The plugin’s status command exits non-zero on failure and supports a timeout, which is exactly what a CI step needs:
# Promote by setting the new image, then wait for the canary to fully succeed.
kubectl argo rollouts set image checkout \
  checkout=ghcr.io/acme/checkout:1.9.0 -n shop

# Blocks until Healthy; non-zero exit on Degraded/abort fails the pipeline.
kubectl argo rollouts status checkout -n shop --watch --timeout 900s
# GitHub Actions gate
- name: Wait for canary to succeed
  run: |
    kubectl argo rollouts status checkout -n shop --watch --timeout 900s
- name: Roll back on failure
  if: failure()
  run: kubectl argo rollouts abort checkout -n shop
This makes a regressed SLO a failed build. The deploy job goes red, the canary self-aborts, and traffic is already back on stable before an engineer opens the logs.
Enterprise scenario
A payments team had a textbook canary: 5% weight, a background AnalysisTemplate gating on success-rate over http_requests_total. A release that introduced a slow database query sailed through to 100% green, then paged on p99 latency twenty minutes later. The analysis was right and useless – their query used rate(...[2m]) but the Prometheus evaluation_interval and scrape were both 60s, and Argo Rollouts sampled at interval: 30s. Each measurement re-read the same under-populated 2m window, so the canary’s first ~90s of real traffic never accumulated enough samples to move the ratio off the stable baseline that was still dominating the series. The metric was an average over both ReplicaSets, not the canary.
The fix was to scope every query to the canary pod hash and align the lookback to the sample interval. Argo Rollouts injects {{args.*}}, so they passed the rollout’s pod-template-hash and matched on it:
metrics:
  - name: canary-success-rate
    interval: 1m            # match scrape, never sample faster than data arrives
    count: 8
    successCondition: result[0] >= 0.995
    failureLimit: 1
    provider:
      prometheus:
        address: http://prometheus-operated.monitoring:9090
        query: |
          sum(rate(http_requests_total{
            app="checkout",
            rollouts_pod_template_hash="{{args.canary-hash}}",
            code!~"5.."}[1m]))
          /
          sum(rate(http_requests_total{
            app="checkout",
            rollouts_pod_template_hash="{{args.canary-hash}}"}[1m]))
The label is set automatically on canary pods; the lesson is that an analysis query is only as honest as its label scope and its window. Validate both in the Prometheus UI against the canary hash before you trust the gate.
Going deeper
Everything above is the happy path. This section is the machinery underneath it – the parts that decide whether your gate is real or theatre, and the advanced routing that turns a canary into a full experimentation platform.
setWeight without a router only moves pods
This is the trap that catches the most people, so it is worth stating in mechanical terms. When there is no trafficRouting block, the controller cannot touch the network path at all. A Service load-balances across every Ready pod behind its selector, and Kubernetes gives you no per-request weighting. So Argo Rollouts fakes it: to “send 20%” it scales the canary ReplicaSet to ~20% of the pods and the stable to ~80%, and lets kube-proxy spread connections roughly evenly. The observed split is therefore canary_pods / total_pods, rounded to whole pods.
The consequences are concrete. With 8 replicas, the smallest non-zero weight you can actually express is 1/8 = 12.5%, so a setWeight: 5 silently behaves like setWeight: 12.5. Long-lived connections (gRPC, HTTP keep-alive, WebSockets) pin a client to whichever pod it first hit, so the real traffic distribution can be far from the pod ratio. And dynamicStableScale, mirror routing, and header routing are all unavailable because they have nothing to program. The rule is simple: if the canary needs a specific, small, or connection-independent percentage, you need a real router – NGINX, Istio, ALB, SMI, or the Gateway API plugin. Pod-ratio mode is fine for a lab and wrong for production.
The AnalysisRun math, and the no-data trap
An AnalysisRun is a small state machine. It takes count measurements, one every interval, after an optional initialDelay warm-up. The run’s total wall-clock is roughly initialDelay + count × interval. Each measurement is classified independently:
- matches
successCondition(and notfailureCondition) -> success - matches
failureCondition(or, with only asuccessCondition, fails it) -> failure - matches neither, when both are set -> inconclusive
- the provider query itself errored (Prometheus down, bad PromQL) -> error
The run’s verdict is then pure counting: it Fails the instant cumulative failures exceed failureLimit; it is Inconclusive if inconclusive measurements exceed inconclusiveLimit; it Errors if consecutive errors exceed consecutiveErrorLimit (default 4); otherwise, once all count measurements are in and none of those limits tripped, it is Successful. Two design implications fall out: a background run with count omitted measures forever until the rollout ends or it trips a limit; and failureLimit is what makes the gate robust to a single noisy scrape, which is why failureLimit: 0 is almost always wrong in production.
The subtle killer is the no-data trap. If the canary is receiving little or no traffic, a ratio like sum(rate(errors)) / sum(rate(total)) divides by zero and Prometheus returns empty – there is no result[0] at all. Depending on the condition, that either errors or evaluates false, and a perfectly healthy deploy gets aborted for the crime of being quiet. The defenses: guarantee traffic during analysis (drive synthetic load, or only analyze above a weight that yields real requests), use count and tolerance so one empty window does not decide the run, and never write a condition whose no-data behavior silently means “pass” – an unmeasurable release is not a good release, it is an unknown one.
Background vs inline analysis, in practice
Inline analysis is a checkpoint: the rollout stops at that step, spawns the run, and refuses to advance until it is Successful. Use it as a hard gate at a specific weight – “prove 5% is healthy before we go to 25%.” Background analysis is a guardrail: declared at strategy.canary.analysis, it starts at startingStep and runs concurrently for the rest of the rollout, aborting the moment it fails at any weight. Use it for continuous SLO monitoring across the whole ramp. The two compose: a background success-rate guardrail for the entire release, plus an inline latency checkpoint at the first weight before you widen exposure. Reach for background when the failure could appear at any weight (an error-budget burn); reach for inline when a specific weight is the thing you must certify before proceeding.
The metrics that matter
Gate on user-facing SLIs, never on resource usage. CPU at 80% tells you nothing about whether requests succeed; a canary can be pegged and perfectly healthy, or idle and returning 500s. Three families cover almost every service:
# 1. Success rate (availability) -- the non-5xx ratio, scoped to the canary
sum(rate(http_requests_total{app="checkout",rollouts_pod_template_hash="{{args.canary-hash}}",code!~"5.."}[1m]))
/
sum(rate(http_requests_total{app="checkout",rollouts_pod_template_hash="{{args.canary-hash}}"}[1m]))

# 2. p95 latency (responsiveness) -- from a native histogram
histogram_quantile(0.95,
  sum(rate(http_request_duration_seconds_bucket{app="checkout",rollouts_pod_template_hash="{{args.canary-hash}}"}[1m])) by (le))

# 3. Error-budget burn rate -- how fast this release is spending the month's budget
(1 - 0.999)                                  # the budget for a 99.9% SLO
/
(sum(rate(http_requests_total{app="checkout",code=~"5.."}[5m])) / sum(rate(http_requests_total{app="checkout"}[5m])))
Success rate is the floor; latency catches the “works but slow” regression that a 200-only check misses; burn rate is the SRE-grade signal that ties a release directly to your error budget, so a canary that would exhaust a month’s budget in an afternoon aborts even if raw availability still looks acceptable. Prefer p95/p99 over averages – a mean hides the tail where real users feel pain.
Experiment, mirror, and header routing
Beyond weighted canaries, Argo Rollouts has three advanced routing moves (all require a router that supports them – Istio or the Gateway API plugin, notably):
setMirrorRouteshadows a copy of live traffic to the canary without using its responses. Users still get the stable answer; the canary is exercised on real request shapes with zero user risk – perfect for load-testing a rewrite before it takes a single real request.setHeaderRouteroutes only requests carrying a header (sayx-canary: true) to the new version. Internal testers or a specific partner opt in; everyone else stays on stable. It is a canary scoped by identity rather than percentage.experimentruns ephemeral canary and baseline ReplicaSets side by side, each with its ownAnalysisRun, and compares them. Because the baseline is a fresh copy of the stable version taking the same traffic, it cancels out ambient noise (a slow afternoon affects both equally), letting you attribute a metric change to the code rather than the environment.
# Mirror 100% of GET traffic to the canary as dark traffic (no user impact)
- setMirrorRoute:
    name: mirror-canary
    percentage: 100
    match:
      - method: { exact: GET }
- pause: { duration: 10m }
- setMirrorRoute:                 # remove the mirror route before proceeding
    name: mirror-canary
kubectl-argo-rollouts, the operator’s cockpit
The plugin is how you operate a rollout day to day. Beyond get/promote/abort/retry/undo from step 7, the ones worth committing to muscle memory: kubectl argo rollouts lint -f rollout.yaml catches schema mistakes before apply; set image triggers a new revision without editing YAML; status --watch --timeout is the CI gate; and dashboard opens the local UI. A representative get rollout tree, mid-canary, reads like this (representative output):
Name:            checkout
Namespace:       shop
Status:          ॥ Paused
Message:         CanaryPauseStep
Strategy:        Canary
  Step:          3/8
  SetWeight:     25
  ActualWeight:  25
Images:          ghcr.io/acme/checkout:1.8.0 (stable)
                 ghcr.io/acme/checkout:1.9.0 (canary)
Replicas:
  Desired:       8
  Current:       10
  Updated:       2
  Ready:         10
  Available:     10

NAME                                 KIND         STATUS     AGE    INFO
⟳ checkout                           Rollout      ॥ Paused   2d
├──# revision:6
│  ├──⧉ checkout-7c9f8b6d5           ReplicaSet   ✔ Healthy  3m     canary
│  │  ├──□ checkout-7c9f8b6d5-abcde  Pod          ✔ Running  3m     ready:1/1
│  │  └──□ checkout-7c9f8b6d5-fghij  Pod          ✔ Running  3m     ready:1/1
│  └──α checkout-6-success-rate      AnalysisRun  ✔ Success  2m     ✔ 5
└──# revision:5
   └──⧉ checkout-5d7c6f4b8           ReplicaSet   ✔ Healthy  2d     stable
The α line is the AnalysisRun and its ✔ 5 means five successful measurements; the Step: 3/8 and SetWeight: 25 tell you exactly where the state machine paused. This one view answers “where am I, what does the analysis say, and which ReplicaSet is stable?” – the three questions every canary raises.
Practice challenges
Work these in order; each builds on the last. Solutions are hidden – try first, then check. No cluster is required to reason through the manifests, but if you have one, apply and watch with kubectl argo rollouts get rollout <name> --watch.
Challenge 1 (Beginner). Convert this Deployment fragment into a Rollout with a two-step canary: 20% weight, pause 5 minutes, then 100%. Keep 4 replicas.
kind: Deployment
metadata: { name: web, namespace: demo }
spec:
  replicas: 4
  selector: { matchLabels: { app: web } }
<details> <summary>Solution</summary>
apiVersion: argoproj.io/v1alpha1
kind: Rollout
metadata: { name: web, namespace: demo }
spec:
  replicas: 4
  selector: { matchLabels: { app: web } }
  template:
    metadata: { labels: { app: web } }
    spec:
      containers:
        - name: web
          image: ghcr.io/acme/web:1.0.0
  strategy:
    canary:
      steps:
        - setWeight: 20
        - pause: { duration: 5m }
        - setWeight: 100
Why: kind/apiVersion change, the rolling-update strategy becomes strategy.canary, and the template carries over unchanged. With 4 replicas and no router, setWeight: 20 really means “scale canary to ~1 of 4 pods” (25%) – pod-ratio approximation, which the next challenge fixes.
</details>
Challenge 2 (Beginner-Intermediate). The Challenge 1 rollout shifts pods, not real traffic. Add NGINX trafficRouting so setWeight controls actual request share. What two extra objects must exist?
<details> <summary>Solution</summary>
strategy:
  canary:
    canaryService: web-canary      # Service selecting canary pods
    stableService: web-stable      # Service selecting stable pods
    trafficRouting:
      nginx:
        stableIngress: web         # your existing Ingress -> web-stable
    steps:
      - setWeight: 20
      - pause: { duration: 5m }
      - setWeight: 100
Why: every non-Istio router needs a canaryService and a stableService, plus your existing Ingress (stableIngress). Rollouts then creates a managed web-canary Ingress with nginx.ingress.kubernetes.io/canary-weight: "20". Verify with kubectl get ingress -n demo – a second, controller-managed ingress appears.
</details>
Challenge 3 (Intermediate). Write an AnalysisTemplate that gates on Prometheus success rate >= 99.5%, scoped to the canary pods, taking 5 measurements a minute apart and tolerating one bad measurement. Then reference it inline after the 20% step.
<details> <summary>Solution</summary>
apiVersion: argoproj.io/v1alpha1
kind: AnalysisTemplate
metadata: { name: web-success-rate, namespace: demo }
spec:
  args:
    - name: canary-hash
  metrics:
    - name: success-rate
      interval: 1m
      count: 5
      successCondition: result[0] >= 0.995
      failureLimit: 1
      provider:
        prometheus:
          address: http://prometheus-operated.monitoring:9090
          query: |
            sum(rate(http_requests_total{app="web",
              rollouts_pod_template_hash="{{args.canary-hash}}",code!~"5.."}[1m]))
            /
            sum(rate(http_requests_total{app="web",
              rollouts_pod_template_hash="{{args.canary-hash}}"}[1m]))
# in strategy.canary.steps
- setWeight: 20
- pause: { duration: 2m }
- analysis:
    templates: [ { templateName: web-success-rate } ]
    args:
      - name: canary-hash
        valueFrom:
          podTemplateHashValue: Latest    # inject the canary ReplicaSet hash
Why: the query scopes to rollouts_pod_template_hash so it measures the canary, not the whole fleet. count: 5 + failureLimit: 1 rides out one noisy scrape but trips on a real regression. valueFrom.podTemplateHashValue: Latest is how Rollouts feeds the canary hash into the arg.
</details>
Challenge 4 (Intermediate-Advanced). Your service is low-traffic overnight and every release goes Inconclusive or aborts on empty data. Make the analysis (a) run in the background from step 2 and (b) treat “not clearly good” as inconclusive (pause for a human) rather than a failure. Explain the 3am behaviour.
<details> <summary>Solution</summary>
strategy:
  canary:
    analysis:
      templates: [ { templateName: web-success-rate } ]
      args: [ { name: canary-hash, valueFrom: { podTemplateHashValue: Latest } } ]
      startingStep: 2
    steps:
      - setWeight: 20
      - pause: { duration: 2m }
      - setWeight: 50
      - pause: { duration: 10m }
      - setWeight: 100
# in the metric: add a failureCondition so the dead-band is inconclusive, not failed
successCondition: result[0] >= 0.995
failureCondition: result[0] <  0.95
inconclusiveLimit: 3
Why: background analysis (startingStep: 2) watches the whole ramp instead of one checkpoint. With both conditions, a measurement between 0.95 and 0.995 – or empty data – matches neither and is inconclusive. At 3am, thin traffic produces inconclusive windows; after inconclusiveLimit: 3 the rollout pauses and waits for a human, instead of auto-aborting a healthy release on noise.
</details>
Challenge 5 (Advanced). Add a CI gate: a GitHub Actions job that promotes the new image, blocks until the canary is Healthy (15-minute cap), and auto-aborts on failure so traffic returns to stable. Bonus: add a p95 latency metric to the template with a 300ms budget.
<details> <summary>Solution</summary>
# GitHub Actions
- name: Promote new image
  run: kubectl argo rollouts set image web web=ghcr.io/acme/web:1.1.0 -n demo
- name: Wait for canary
  run: kubectl argo rollouts status web -n demo --watch --timeout 900s
- name: Roll back on failure
  if: failure()
  run: kubectl argo rollouts abort web -n demo
# extra metric in the AnalysisTemplate
- name: p95-latency
  interval: 1m
  count: 5
  successCondition: result[0] <= 0.3          # 300 ms, expressed in seconds
  failureLimit: 1
  provider:
    prometheus:
      address: http://prometheus-operated.monitoring:9090
      query: |
        histogram_quantile(0.95,
          sum(rate(http_request_duration_seconds_bucket{app="web",
            rollouts_pod_template_hash="{{args.canary-hash}}"}[1m])) by (le))
Why: status --watch --timeout 900s exits non-zero on Degraded/abort, failing the build; if: failure() fires the abort so stable is restored before anyone reads the logs. The latency budget is in seconds (0.3), the classic unit bug – writing 300 would demand p95 under 300 seconds and never trip.
</details>
Common beginner mistakes
setWeightshifts nothing because there is no traffic router. The number-one confusion. Without atrafficRoutingblock,setWeight: 20scales pods, it does not split requests, and small weights round to whole pods. The right mental model:setWeightis a request to the router; with no router there is nobody to honour it. Configure NGINX/Istio/ALB/Gateway API before you trust any percentage.- A flaky analysis aborts healthy releases.
failureLimit: 0(the default) means a single noisy scrape kills the deploy, and on a low-traffic service every release looks flaky. Take several measurements (count: 5) and tolerate one or two (failureLimit: 1–2). The gate should trip on a trend, not a blip. - No auto-rollback because the analysis is never referenced. Writing an
AnalysisTemplatedoes nothing on its own – it must appear insteps(inline) orstrategy.canary.analysis(background). A canary with beautiful PromQL that no step invokes just times out its pauses and promotes on a schedule. If there is noAnalysisRunin theget rollouttree, there is no gate. - The
successConditionis quietly wrong. The usual culprits: comparing latency in the wrong unit (<= 300when the metric is seconds, so it never trips), inverting a ratio, or setting only asuccessConditionso every non-passing sample counts as a failure. Validate the exact PromQL in the Prometheus UI and confirm which unit and direction “good” is. - Metric lag and mis-scoped queries. Sampling faster than Prometheus scrapes re-reads the same thin window; a
rate([2m])on a 60s scrape lags reality by minutes; and a query that omitsrollouts_pod_template_hashmeasures the whole fleet, so the stable baseline drowns the canary’s signal. Align the lookback to the scrape/interval and always scope to the canary hash. - Running a Deployment and a Rollout with the same selector. Two controllers fight over the same pods. Migrate with
workloadRef, or rename the workload – never leave both live. pause: {}used by accident. An empty pause halts forever until a human runspromote. Beginners wait for a rollout that is doing exactly what they asked. Usepause: { duration: 10m }for an automatic resume; reservepause: {}for a deliberate manual gate.
Verify
Confirm the controller, the traffic split, and the analysis are all doing what you think.
# Controller is up
kubectl get pods -n argo-rollouts

# Rollout state, current step, and traffic weight
kubectl argo rollouts get rollout checkout -n shop

# Both ReplicaSets exist mid-canary; note the pod-template-hash
kubectl get rs -n shop -l app=checkout

# Analysis runs and their verdicts
kubectl get analysisrun -n shop
kubectl describe analysisrun -n shop <name>   # shows each measurement + value

# Provider objects are being rewritten (NGINX example)
kubectl get ingress -n shop                   # a managed -canary ingress appears
# Istio example
kubectl get virtualservice,destinationrule -n shop -o yaml | grep -A2 weight

# Sanity-check the query in Prometheus directly before trusting the gate
# (run the same PromQL in the Prometheus UI / API and confirm it returns a value)
A healthy canary shows a single setWeight reflected in the provider object, AnalysisRuns in Successful phase with sampled values that match what Prometheus returns, and the Rollout advancing through steps. An aborted one shows traffic back at the stable Service, the canary ReplicaSet scaled to 0, and a Degraded phase.
Checklist
Glossary
- Rollout – the Argo Rollouts custom resource (
argoproj.io/v1alpha1) that replaces a Deployment and adds canary/blue-green strategies with metric analysis. - Canary – a release strategy that exposes a new version to a small slice of real traffic first, widening only if metrics hold.
- Blue-green – the sibling strategy: run the full new version behind a preview Service, then flip all traffic at once. See Argo Rollouts blue-green with preview and analysis gates.
- Stable / canary ReplicaSet – the current-good pods (stable) and the new pods under test (canary); the canary becomes stable on promotion.
setWeight: N– a canary step requesting that N% of traffic go to the canary; only real with atrafficRoutingprovider, otherwise approximated by pod ratio.pause– a canary step that waits:{ duration: 10m }resumes automatically;{}waits indefinitely for a humanpromote.trafficRouting– the block that names a real traffic provider (NGINX, Istio, SMI, ALB, Gateway API plugin) so weights split actual requests.- canaryService / stableService – the two Services most routers require, selecting canary and stable pods respectively.
- AnalysisTemplate / ClusterAnalysisTemplate – a reusable, parameterized definition of metrics and pass/fail conditions; namespaced or cluster-wide.
- AnalysisRun – a live instance of a template spawned during a rollout; its phase (Successful/Failed/Error/Inconclusive) drives promotion or abort.
- metric – one query inside a template, with its own
interval,count, and conditions. successCondition/failureCondition– expressions overresultthat mark a measurement good or bad; setting both creates an inconclusive dead-band.failureLimit– how many failed measurements are tolerated before the run Fails (default 0).inconclusiveLimit– how many inconclusive measurements before the run is Inconclusive and pauses for a human.consecutiveErrorLimit– consecutive provider errors (default 4) before the run Errors; distinguishes “app is bad” from “could not measure.”result[0]– the first value the provider query returns; conditions compare against it.- provider – the metrics backend for a metric (Prometheus, Datadog, New Relic, Wavefront, a Job, a web query, etc.).
- SLI / SLO – Service Level Indicator (the measured thing, e.g. success rate) and Objective (the target, e.g. 99.9%); a
successConditionencodes an SLO. - error budget – the allowed amount of failure under an SLO (1 − target); burn rate measures how fast a release spends it.
- p95 / p99 latency – the 95th/99th-percentile response time from a histogram; the tail where real users feel slowness.
rollouts_pod_template_hash– the label Rollouts stamps on pods so a query can scope to the canary rather than the whole fleet.- promote / abort / retry / undo – plugin verbs to advance, force-rollback, resume-after-abort, and revert-to-a-prior-revision.
setCanaryScale/dynamicStableScale– decouple canary replica count from weight, and scale stable down as canary grows.- experiment /
setMirrorRoute/setHeaderRoute– advanced routing: A/B a baseline vs canary, shadow dark traffic, or route by header. - kubectl-argo-rollouts – the CLI plugin (
get,promote,abort,status,lint,dashboard) that drives and observes rollouts. - Progressing / Paused / Healthy / Degraded – the Argo CD health states a Rollout reports; Degraded means aborted or failed.
Pitfalls and next steps
The failures I see most often are not controller bugs. They are analysis that never had a chance to be right: queries scoped to the wrong label so they measure the whole fleet instead of the canary; thresholds copied from a high-traffic service onto a low-traffic one, so every release goes inconclusive; or a setWeight that does nothing because no trafficRouting provider is configured and replica-ratio rounding cannot express the intended percentage. Always run your PromQL in the Prometheus UI first, and always confirm the provider object actually changed weight after the first step.
The second class is operational blindness. A canary is a runtime event, so treat it like one. Scrape the controller’s metrics (the rollout_info series carries a phase label; the endpoint is on port 8090) into a Grafana dashboard, fire a notification on any Rollout entering Degraded, and write a one-page runbook covering how to read analysis output, when to promote past an inconclusive run versus abort, and how retry differs from pushing a new revision. From there, extend the same analysis templates to your blue-green deployments – the metric gate is identical, only the traffic flip differs – as covered in Argo Rollouts blue-green with preview and analysis gates.