Canary shifts a percentage of live traffic onto the new version and measures it under partial exposure. Blue-green does the opposite: it stands up the entire new version, validates it out of band while zero production traffic touches it, then flips 100% of traffic in a single atomic selector change. When the new code path is right, that swap is instant; when it is wrong, the rollback is equally instant because the old ReplicaSet is still running. Argo Rollouts makes this a first-class strategy with a preview service, pre-promotion analysis, and a tunable window during which the old stack stays warm. This article builds the full flow and the guardrails around it.
In a nutshell
Think of blue-green like opening a second, identical shop next door before you move your customers into it. Blue is the shop that is open right now — every customer walks through its doors. Green is the brand-new shop you have just finished building: fully stocked, lights on, staff standing by — but the front door is locked, and a private side entrance lets you walk in and inspect it. You test green thoroughly through that side entrance (the preview service). Only when you are satisfied do you move the single sign that says “ENTRANCE” from the blue door to the green door — and every customer now walks into green, all at once. If green turns out to be a disaster, you move the sign straight back to blue, which you deliberately left open and staffed for exactly this reason.
In Kubernetes terms: you run the old version (blue) and the new version (green) side by side as two full sets of Pods. A preview Service lets you test green out of band while 100% of real traffic still hits blue. An analysis gate — automated smoke tests and metric checks — must pass before anything changes. Then a single edit to the active Service flips all traffic to green in one instant. Because blue is still running, rolling back is just flipping the sign back — no rebuild, no waiting.
That “flip a sign” cutover is what makes blue-green different from a rolling update (which swaps Pods a few at a time) and from canary (which sends a slice of live traffic to the new version). Blue-green trades money — you pay for two full copies at once — for two things you often want badly: nobody sees the new version until it has proven itself, and rollback is instant.
Level: Advanced · Time: ~30 min
Where this sits: this lesson assumes you are comfortable with Pods, ReplicaSets, and the built-in rolling update from Deployments, ReplicaSets, rollouts & rollback, and that you have met the canary strategy in Progressive delivery with Argo Rollouts (canary + metrics). Prometheus queries appear in the analysis gates; if sum(rate(...)) is unfamiliar, skim Prometheus & Grafana metrics monitoring first.
After this lesson you will be able to:
- Explain when blue-green beats canary and a plain rolling update — and when its 2x cost is not worth it.
- Write a
Rolloutwith ablueGreenstrategy wired toactiveServiceandpreviewService. - Gate promotion behind
prePromotionAnalysis(aJobsmoke test and a Prometheus check) so a bad build cannot be promoted. - Tune
autoPromotionEnabled,scaleDownDelaySeconds, andscaleDownDelayRevisionLimitto set who promotes and how long your instant-rollback window lasts. - Perform and verify an instant rollback with
abort(pre-cutover) andundo(post-cutover).
Here is the whole flow on one page — the two stacks, the preview test, the gate, the atomic flip, and the rollback path:
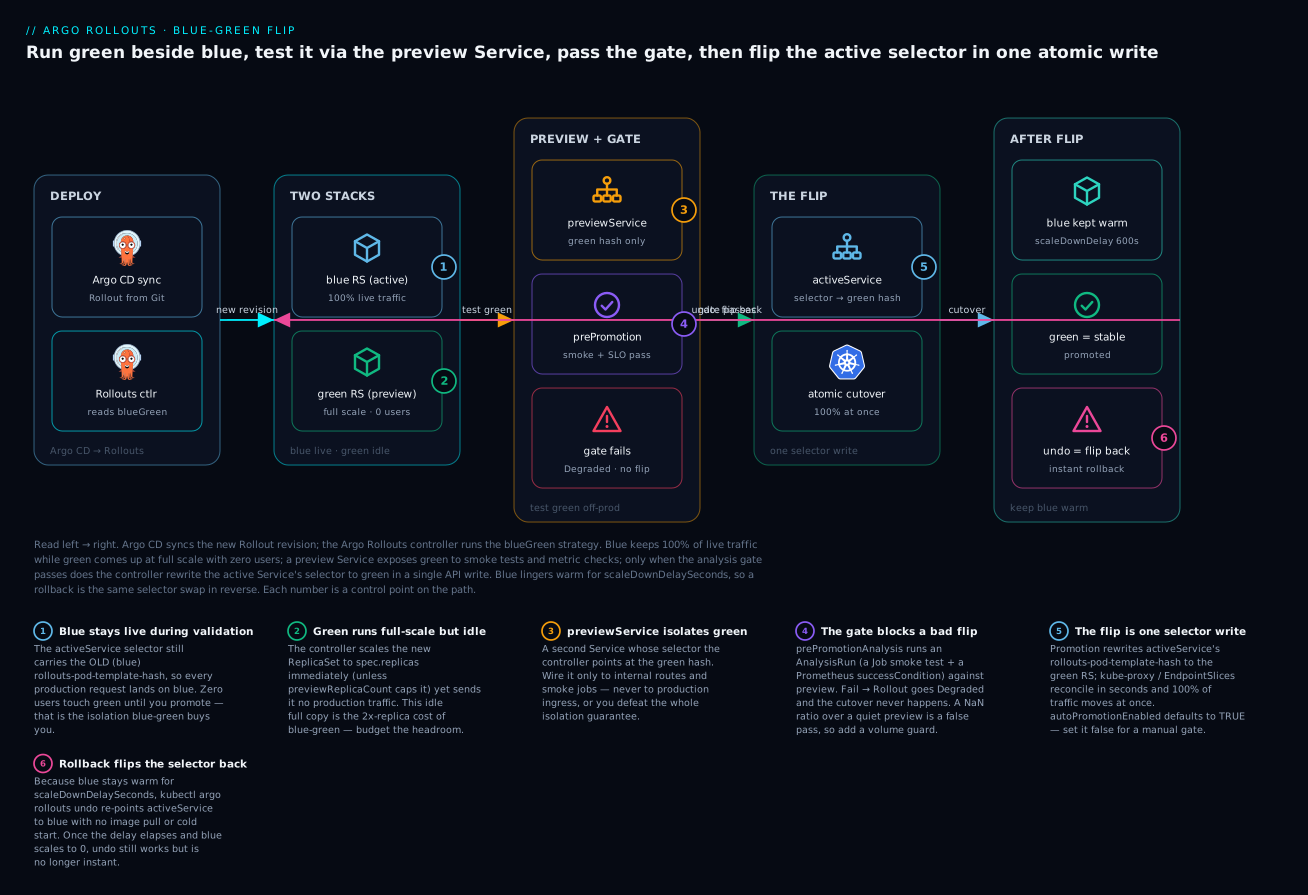
Trace it left to right: blue serves 100% while green comes up at full scale with zero users; the preview Service exposes green to smoke tests and metric checks; when the analysis gate passes, the controller rewrites the active Service’s selector to green in a single API write; blue lingers warm for scaleDownDelaySeconds so an undo flips the selector straight back.
1. Blue-green vs. canary: when a full-environment swap is the right call
Both are progressive delivery; they fail in different shapes. Canary bounds blast radius by traffic percentage over time. Blue-green bounds it by time-to-validate before any user is exposed at all, then accepts a binary cutover.
| Dimension | Blue-green | Canary |
|---|---|---|
| Production exposure during validation | Zero (preview service only) | Live, weighted (e.g. 5% to 50%) |
| Cutover | Atomic, 100% at once | Gradual over steps |
| Rollback | Re-point active selector, instant | Set weight back to 0, near-instant |
| Cost during release | 2x replicas (both stacks full) | ~1x + canary delta |
| Best for | Schema-coupled releases, batch/stateful workloads, “validate then flip” change windows | Stateless HTTP services where you want real-traffic signal |
Reach for blue-green when partial exposure is meaningless or dangerous: a release coupled to a forward-compatible database migration you want fully smoke-tested before any user hits it, a queue consumer where “5% of traffic” is not a coherent concept, or a regulated change window where you must prove the green stack healthy before flipping. Reach for canary when real user traffic is the only honest signal and you can tolerate a small cohort seeing the new version.
Blue-green’s defining cost is that you run two full copies of the workload simultaneously. Budget the headroom, and tune
scaleDownDelaySeconds(covered below) so you do not pay 2x replicas any longer than your rollback window requires.
2. Install the controller (brief)
If you have not already deployed the controller, install it and the kubectl plugin. Pin a real release tag in production rather than latest, and manage the manifest through GitOps.
kubectl create namespace argo-rollouts
kubectl apply -n argo-rollouts \
  -f https://github.com/argoproj/argo-rollouts/releases/download/v1.7.2/install.yaml
kubectl rollout status deploy/argo-rollouts -n argo-rollouts

# kubectl plugin (macOS)
brew install argoproj/tap/kubectl-argo-rollouts
kubectl argo rollouts version
3. Define the Rollout with activeService, previewService, and the blue-green strategy
Blue-green needs two Service objects pointing at the same pod label set. The controller manages their selectors by injecting a generated rollouts-pod-template-hash so that active always routes to the live ReplicaSet and preview always routes to the new one being validated.
# services.yaml -- two Services, identical app selector, no hash (the controller adds it)
apiVersion: v1
kind: Service
metadata:
  name: checkout-active
  namespace: shop
spec:
  selector:
    app: checkout
  ports:
    - port: 80
      targetPort: 8080
---
apiVersion: v1
kind: Service
metadata:
  name: checkout-preview
  namespace: shop
spec:
  selector:
    app: checkout
  ports:
    - port: 80
      targetPort: 8080
The Rollout itself. Note kind: Rollout, apiVersion: argoproj.io/v1alpha1, and the strategy.blueGreen block that wires the two services together:
apiVersion: argoproj.io/v1alpha1
kind: Rollout
metadata:
  name: checkout
  namespace: shop
spec:
  replicas: 6
  revisionHistoryLimit: 3
  selector:
    matchLabels:
      app: checkout
  template:
    metadata:
      labels:
        app: checkout
    spec:
      containers:
        - name: checkout
          image: registry.example.com/checkout:1.42.0
          ports:
            - containerPort: 8080
          readinessProbe:
            httpGet:
              path: /healthz
              port: 8080
            initialDelaySeconds: 5
            periodSeconds: 5
  strategy:
    blueGreen:
      activeService: checkout-active
      previewService: checkout-preview
      autoPromotionEnabled: false      # require an explicit promote (see step 5)
      scaleDownDelaySeconds: 600        # keep old RS warm 10 min after cutover
      prePromotionAnalysis:
        templates:
          - templateName: smoke-and-slo
        args:
          - name: preview-service
            value: checkout-preview
      postPromotionAnalysis:
        templates:
          - templateName: post-cutover-error-rate
        args:
          - name: active-service
            value: checkout-active
When you apply a new image, the controller creates a fresh ReplicaSet, points checkout-preview at it, and – because autoPromotionEnabled: false – pauses with the green stack fully scaled but receiving no production traffic. The active selector still points at the old (blue) ReplicaSet. Nothing has been promoted yet.
Here is every knob in that strategy.blueGreen block, so nothing in the manifest is magic:
| Field | Type | Default | What it controls |
|---|---|---|---|
activeService |
string (required) | — | The Service that carries live traffic. The controller owns its rollouts-pod-template-hash selector and rewrites it on promotion. |
previewService |
string | none | The Service pointed at the new (green) ReplicaSet for out-of-band validation. Omit it and you lose the preview lane. |
autoPromotionEnabled |
bool | true |
Whether the controller flips automatically once pre-promotion analysis passes. false = wait for a manual promote. |
autoPromotionSeconds |
int | 0 |
Auto-promote this many seconds after the green stack is ready, even with no manual action (a timed soak). |
scaleDownDelaySeconds |
int | 30 |
How long the old (blue) ReplicaSet stays scaled up after cutover — your instant-rollback window. |
scaleDownDelayRevisionLimit |
int | unlimited | How many previous ReplicaSets to keep warm, capping the 2x-replica bill. |
previewReplicaCount |
int | = spec.replicas |
Run green at fewer replicas during preview to cut cost, then scale to full on promotion. |
prePromotionAnalysis |
object | none | An AnalysisRun that must pass before the flip. Fail → Degraded, no cutover. |
postPromotionAnalysis |
object | none | An AnalysisRun that runs after the flip while blue is still warm — the automated rollback trigger. |
antiAffinity |
object | none | Ask the scheduler to place blue and green Pods on different nodes so one node loss cannot take both. |
previewMetadata / activeMetadata |
object | none | Labels/annotations stamped onto Pods while they are the preview vs. active version (handy for dashboards and routing). |
The one field you never set yourself is the selector’s rollouts-pod-template-hash. When the controller renders a ReplicaSet it hashes the Pod template into a short suffix (for example checkout-6b9f4c8d7) and stamps every Pod in that RS with rollouts-pod-template-hash: 6b9f4c8d7. “Active” and “preview” are then nothing more than which hash value each Service’s selector currently carries. Promotion is a one-line edit to the active Service’s selector — which is exactly why the cutover is atomic and the rollback is free.
4. Validate the green stack with pre-promotion analysis and smoke jobs
prePromotionAnalysis runs an AnalysisRun against the preview service before the controller will cut over. If it fails, the Rollout is marked Degraded and the cutover never happens. This is where you put smoke tests and out-of-band SLO checks.
A robust template combines two measurement styles: a Job-based smoke test (run a pod, assert exit code 0) and a metric query (assert the preview is actually serving). Argo Rollouts treats an AnalysisRun as successful only when every metric meets its successCondition within the allowed failureLimit.
apiVersion: argoproj.io/v1alpha1
kind: AnalysisTemplate
metadata:
  name: smoke-and-slo
  namespace: shop
spec:
  args:
    - name: preview-service
  metrics:
    # 1) Job-based smoke test: hit the preview service end to end.
    - name: smoke
      provider:
        job:
          spec:
            backoffLimit: 1
            template:
              spec:
                restartPolicy: Never
                containers:
                  - name: smoke
                    image: registry.example.com/checkout-smoke:1.0.0
                    command: ["/bin/sh", "-c"]
                    args:
                      - |
                        set -e
                        curl -fsS http://{{args.preview-service}}/healthz
                        curl -fsS http://{{args.preview-service}}/api/cart/selftest
    # 2) Metric: preview success rate must be healthy under synthetic load.
    - name: preview-success-rate
      initialDelay: 30s
      interval: 30s
      count: 5
      successCondition: result[0] >= 0.99
      failureLimit: 1
      provider:
        prometheus:
          address: http://prometheus.monitoring.svc.cluster.local:9090
          query: |
            sum(rate(http_requests_total{service="checkout-preview",code!~"5.."}[2m]))
            /
            sum(rate(http_requests_total{service="checkout-preview"}[2m]))
For the job provider, the measurement is the pod’s exit status: a zero exit is Successful, non-zero is Failed. That makes it the natural place for contract tests, migration dry-runs, or a Postman/k6 suite packaged as an image. The metric provider, meanwhile, requires that your synthetic traffic actually exercise the preview service so the query returns a meaningful ratio – a quiet preview returns NaN and fails the successCondition, which is the safe default.
It helps to know the three terminal states an AnalysisRun can reach, because they behave differently. Successful means every metric met its successCondition — the gate opens. Failed means a metric breached failureLimit (too many bad measurements) — the gate slams shut and the Rollout goes Degraded. Inconclusive means the run finished without clearly passing or failing (often a metric with inconclusiveLimit set, or a query returning no data) — by default that is treated as not-promotable, but it is worth handling explicitly rather than relying on a NaN to save you. The Enterprise scenario at the end of this lesson is a real story of exactly that gap.
5. Manual gates, autoPromotionEnabled, and scaleDownDelay tuning
These three knobs decide who promotes and how long you can roll back.
autoPromotionEnabled. With false, the Rollout pauses after pre-promotion analysis passes and waits for an explicit promote. With true (the default), it cuts over automatically the moment analysis succeeds. For a regulated change window you want false; for a fully metric-gated pipeline you may trust true. You can also set autoPromotionSeconds to auto-promote after a fixed soak even without manual action.
| You want… | Set |
|---|---|
| A human to eyeball green and click promote inside a change window | autoPromotionEnabled: false |
| Fully automated promotion the instant analysis passes | autoPromotionEnabled: true (the default) |
| Automated promotion, but only after a fixed soak on preview | autoPromotionEnabled: true + autoPromotionSeconds: 600 |
| Cheaper preview: run green at partial scale until promotion | previewReplicaCount: 2 (with replicas: 6) |
Promote manually with the plugin once you have eyeballed the green stack:
# Watch the rollout pause at the pre-promotion gate
kubectl argo rollouts get rollout checkout -n shop --watch

# Promote: flip active -> green
kubectl argo rollouts promote checkout -n shop

# Or abort and tear down the green stack instead
kubectl argo rollouts abort checkout -n shop
scaleDownDelaySeconds. After cutover, the old ReplicaSet is not deleted immediately – it is scaled to zero only after this delay (default 30 seconds). This is your instant-rollback window: as long as the old RS exists, undo re-points the active selector to it in one step. Set it to cover the time it takes your alerting and on-call to notice a bad release. A common production value is 300 to 900 seconds.
Trade-off: a longer
scaleDownDelaySecondsmeans you pay for 2x replicas for that whole window. On expensive node pools, pair it with ascaleDownDelayRevisionLimitso you keep only the last N old ReplicaSets warm rather than an unbounded set.
strategy:
  blueGreen:
    activeService: checkout-active
    previewService: checkout-preview
    autoPromotionEnabled: false
    scaleDownDelaySeconds: 600
    scaleDownDelayRevisionLimit: 1   # keep only the immediately-previous RS warm
    antiAffinity:                    # optional: spread blue and green across nodes
      preferredDuringSchedulingIgnoredDuringExecution:
        weight: 100
6. Wiring Prometheus, Datadog, or Job-based providers into analysis
The same AnalysisTemplate shape supports multiple providers; you pick per metric. Job-based providers were shown in step 4. The two most common metric providers are Prometheus and Datadog.
Datadog requires a Secret with API and app keys, referenced by the provider. Use apiVersion: v2 of the Datadog provider for the current query semantics:
apiVersion: argoproj.io/v1alpha1
kind: AnalysisTemplate
metadata:
  name: post-cutover-error-rate
  namespace: shop
spec:
  args:
    - name: active-service
  metrics:
    - name: error-rate
      interval: 1m
      count: 5
      successCondition: result < 0.01
      failureLimit: 2
      provider:
        datadog:
          apiVersion: v2
          interval: 5m
          query: |
            sum:trace.http.request.errors{service:checkout}.as_count() /
            sum:trace.http.request.hits{service:checkout}.as_count()
apiVersion: v1
kind: Secret
metadata:
  name: datadog
  namespace: argo-rollouts        # provider reads it from the controller namespace
type: Opaque
stringData:
  api-key: "<DATADOG_API_KEY>"
  app-key: "<DATADOG_APP_KEY>"
  address: "https://api.datadoghq.com"
Two rules keep analysis honest regardless of provider. First, failureLimit should be greater than zero so a single scrape blip does not abort a good release, but small enough that a real regression trips it within a couple of intervals. Second, prefer ratios with a guard on volume – a successCondition of result[0] >= 0.99 on a numerator with near-zero denominator is a false pass; add a separate metric asserting minimum request volume during the analysis window.
7. Traffic cutover: service selectors vs. ingress/Gateway API
The default blue-green mechanism is pure service selector swapping: the controller mutates the selector of the active Service to carry the new pod-template hash. This works with any Service type and needs no traffic-management add-on – the cutover is a single Kubernetes API write and propagates as fast as kube-proxy/endpoints reconcile.
That default does not, by itself, control an external load balancer or an L7 router. If clients reach the app through an Ingress or the Gateway API, the swap of the Service selector still works as long as the Ingress backend targets the active Service by name – the Ingress points at checkout-active, and the controller changes which pods that Service selects. For finer control (header-based preview routing, or swapping which Service the route targets) Argo Rollouts integrates with traffic routers; for blue-green the common, robust pattern is to keep the Ingress/Gateway pinned to the active Service and let selector swapping do the cutover:
apiVersion: gateway.networking.k8s.io/v1
kind: HTTPRoute
metadata:
  name: checkout
  namespace: shop
spec:
  parentRefs:
    - name: shop-gateway
  rules:
    - backendRefs:
        - name: checkout-active     # pinned; controller swaps the Service's pods
          port: 80
Expose the preview Service to your validation tooling on a separate hostname or internal-only route so smoke jobs and manual checks can reach green without touching production ingress. Never wire the preview Service into the production route – that defeats the entire isolation guarantee of blue-green.
8. Instant rollback: re-point the active selector, preserve the old ReplicaSet
Because the old ReplicaSet stays scaled up for scaleDownDelaySeconds, rollback is a selector flip, not a redeploy. Two paths:
# If you are still within the pre-promotion pause (never cut over):
kubectl argo rollouts abort checkout -n shop

# If you already promoted but are still inside the scaleDownDelay window:
kubectl argo rollouts undo checkout -n shop          # roll back to previous revision
kubectl argo rollouts undo checkout -n shop --to-revision=41
undo re-points the active Service at the previous ReplicaSet’s pods. As long as that ReplicaSet has not been scaled to zero, traffic returns to the known-good version in seconds with no image pull, no scheduling, no cold start. This is the single most important reason to set scaleDownDelaySeconds deliberately: it is your rollback budget. Once the delay elapses and the old RS scales to zero, an undo still works but now incurs a full scale-up, so it is no longer instant.
postPromotionAnalysis (wired in step 3) gives you an automated version of the same safety: it runs after cutover, and if error rate breaches its successCondition while the old RS is still warm, the Rollout enters a Degraded state and you (or a controller-driven undo) can flip back immediately.
9. Dashboarding rollout state and alerting on aborted promotions
The controller exposes Prometheus metrics on port 8090; the most actionable is rollout_info with a phase label (Healthy, Paused, Degraded, Progressing). Scrape it and alert on Degraded and on aborted analysis.
groups:
  - name: argo-rollouts
    rules:
      - alert: RolloutDegraded
        expr: rollout_info{phase="Degraded"} == 1
        for: 2m
        labels:
          severity: page
        annotations:
          summary: "Rollout {{ $labels.name }} in {{ $labels.namespace }} is Degraded"
      - alert: RolloutStuckPaused
        expr: rollout_info{phase="Paused"} == 1
        for: 30m
        labels:
          severity: warning
        annotations:
          summary: "Rollout {{ $labels.name }} paused >30m (awaiting promotion?)"
A Degraded phase almost always means a pre- or post-promotion AnalysisRun failed – which is exactly the aborted-promotion signal you want to page on. Pair the metric alert with the built-in dashboard from the kubectl plugin (kubectl argo rollouts dashboard) for a live view during change windows.
Going deeper
What the “atomic flip” actually does to the data plane
The promotion is a single write to one field: the active Service’s spec.selector.rollouts-pod-template-hash. Everything downstream is ordinary Kubernetes reconciliation. The instant that selector changes, the EndpointSlice controller recomputes the Service’s backing endpoints — dropping the blue Pod IPs and adding the green ones — and every kube-proxy (or your CNI’s service implementation, for example Cilium) reprograms its iptables/IPVS/eBPF rules to match. There is no connection draining built into the swap itself: existing keep-alive connections to blue Pods stay open until they close, while new connections land on green. This is why a graceful preStop hook and a sane terminationGracePeriodSeconds on your Pods still matter even though blue is not deleted at cutover — when scaleDownDelaySeconds finally elapses and blue scales to zero, those Pods go through normal termination.
Two consequences fall out of this. First, the cutover is as fast as endpoint propagation — typically sub-second in a small cluster, a few seconds in a very large one — not instantaneous everywhere at the same microsecond. Second, anything that caches endpoints itself (a service mesh sidecar, an external load balancer with its own health checks, a client with a long DNS TTL) flips on its reconcile schedule, not Kubernetes’. If you run a mesh, the flip is only as atomic as the mesh’s config distribution.
previewReplicaCount: paying less for the green stack
The textbook 2x cost assumes green runs at full spec.replicas the whole time it is in preview. previewReplicaCount breaks that assumption: set it lower and the controller runs only that many green Pods during validation, then scales green to full spec.replicas as part of promotion (before the selector flip completes). A Rollout with replicas: 20 and previewReplicaCount: 3 pays for 23 Pods during the gate instead of 40 — you validate on a representative-but-cheaper green stack, and only pay full 2x for the brief promotion window.
strategy:
  blueGreen:
    activeService: checkout-active
    previewService: checkout-preview
    previewReplicaCount: 3          # validate on 3 green Pods…
    autoPromotionEnabled: false     # …then scale to full replicas on promote
    scaleDownDelaySeconds: 600
    previewMetadata:
      labels:
        role: preview               # stamped on green Pods while previewing
    activeMetadata:
      labels:
        role: active                # stamped once they carry live traffic
The catch: your pre-promotion analysis now runs against a smaller stack, so a capacity or concurrency regression that only shows up at full scale can slip through. Use previewReplicaCount when the risk you are gating on is correctness (does the migration reconcile? does the API return 200?), not when it is throughput.
The analysis gate as a hard interlock, with a volume guard
prePromotionAnalysis is not advisory — it is an interlock wired in series with the flip. The controller will not touch the active selector until the AnalysisRun reports Successful. That makes the quality of the analysis the whole ballgame, and the classic failure is a ratio metric that reads healthy simply because nothing is hitting the preview. Guard every ratio with a companion metric that asserts minimum volume, so a quiet preview fails closed instead of passing on a NaN:
apiVersion: argoproj.io/v1alpha1
kind: AnalysisTemplate
metadata:
  name: preview-slo-with-volume-guard
  namespace: shop
spec:
  args:
    - name: preview-service
  metrics:
    # Guard: require real synthetic load before trusting the ratio.
    - name: request-volume
      initialDelay: 30s
      interval: 30s
      count: 5
      successCondition: result[0] >= 50      # >= 50 req/window or the run fails
      failureLimit: 0
      provider:
        prometheus:
          address: http://prometheus.monitoring.svc.cluster.local:9090
          query: |
            sum(rate(http_requests_total{service="checkout-preview"}[1m]))
    # Ratio: only meaningful once the guard above passes.
    - name: preview-success-rate
      initialDelay: 30s
      interval: 30s
      count: 5
      successCondition: result[0] >= 0.99
      failureLimit: 1
      provider:
        prometheus:
          address: http://prometheus.monitoring.svc.cluster.local:9090
          query: |
            sum(rate(http_requests_total{service="checkout-preview",code!~"5.."}[2m]))
            /
            sum(rate(http_requests_total{service="checkout-preview"}[2m]))
Because an AnalysisRun is Successful only when every metric passes, adding the volume guard means “high success rate over almost no requests” can no longer open the gate. Pair this with a Job-based smoke test (section 4) and you have both a hard pass/fail on concrete inputs and a statistical floor on real traffic.
abort, undo, and abortScaleDownDelaySeconds
There are two distinct rollback verbs and they act at different points. abort applies before promotion: it stops the rollout, marks it aborted, and (after abortScaleDownDelaySeconds, default 30) scales the green preview stack back down — blue never stopped serving, so there is nothing to roll back to, you simply throw green away. undo applies after promotion: it re-points the active selector to a previous ReplicaSet. As long as that RS is still warm (within scaleDownDelaySeconds) the flip-back is instant; past that window undo still works but must first scale the old RS from zero.
abortScaleDownDelaySeconds is the mirror of scaleDownDelaySeconds for the green stack on an abort — set it above zero if you want a moment to inspect a rejected green stack (logs, exec into a Pod) before it disappears. Set it to 0 only if you never debug failed previews.
Blue-green vs. canary, as a cost and blast-radius calculation
The two strategies price risk differently, and the numbers matter at scale:
| Blue-green | Canary (no traffic router) | Canary (with traffic router) | |
|---|---|---|---|
| Extra replicas during release | Up to +100% (or previewReplicaCount) |
~+one step’s worth | ~+one step’s worth |
| Users exposed to a bad build before you know | 0 (gate blocks) or 100% (after flip) | pod-ratio slice | exact weighted slice |
| Cutover shape | One atomic step | Ramp of scale steps | Ramp of real traffic % |
| Rollback speed | Instant (selector flip) | Near-instant (abort) | Near-instant (weight → 0) |
| Needs Istio/NGINX/ALB/Gateway API | No | No | Yes |
Blue-green’s honest cost is the doubled footprint; its honest benefit is that the validation window has zero production exposure and the cutover has no “5% of users saw the bug” middle ground. Canary inverts both. Reach for blue-green when a partial exposure is meaningless (a queue consumer) or forbidden (a schema-coupled release under change control); reach for canary when real user traffic is the only trustworthy signal.
antiAffinity and where the green Pods land
antiAffinity in the blueGreen block asks the scheduler to keep blue and green Pods off the same nodes. The preferred… form adds a soft weight; the required… form is a hard constraint that can leave green Pods Pending if you lack the spread. It exists because the whole promise of blue-green is “the old version is still there to fall back on” — and that promise is weaker if a single node hosts both stacks and dies. The cost is more nodes (you cannot bin-pack blue and green together), which compounds the 2x-replica bill. On expensive GPU or memory-optimized pools this is often the dominant line item, and scaleDownDelayRevisionLimit: 1 plus a modest scaleDownDelaySeconds is how you keep it bounded.
Integrating with Ingress, Gateway API, and a mesh
Selector swapping (section 7) is provider-agnostic and needs no add-on, which is why it is the default and the right choice for most blue-green setups: pin the Ingress/HTTPRoute backend to the active Service and let the controller change which Pods that Service selects. If you need something selector swapping cannot express — header-based preview routing (send only requests with x-preview: true to green), or swapping which Service a route targets rather than which Pods a Service selects — Argo Rollouts can drive a traffic router (Istio VirtualService, NGINX, ALB, or the Gateway API via a plugin) through the same blueGreen block using previewService/activeService plus the router config. For blue-green specifically, most teams do not need it; it is the canary strategies that lean on traffic routers for true per-request weighting.
The kubectl-argo-rollouts plugin is not just cosmetics
The plugin (kubectl argo rollouts …) talks to the same API objects kubectl does, but it renders the Rollout’s strategy state — current step, analysis status, which RS is active vs. preview, revision history — in one view that raw kubectl get rollout cannot. promote, abort, undo, and set image are all conveniences over patches you could write by hand, but the get rollout --watch and dashboard views are the fastest way to see a gate pause or an aborted analysis during a change window. In CI/CD you would use the declarative equivalents (patch the image via GitOps, let Argo CD sync), but at the terminal during an incident the plugin is the tool.
Practice challenges
Work these in order; each builds on the last. Solutions are collapsed — try first.
1 (Beginner) — Spot the auto-flip. You apply a Rollout with a blueGreen strategy, previewService and activeService set, and no autoPromotionEnabled line. You push a new image and the active Service flips to green immediately, with no pause. Why?
<details><summary>Solution</summary>
autoPromotionEnabled defaults to true. With no pre-promotion analysis to gate on, the controller promotes the moment green is ready. Add autoPromotionEnabled: false (and/or a prePromotionAnalysis) to get a pause. Why: the default optimizes for hands-off promotion, which surprises everyone exactly once.
</details>
2 (Beginner) — Give green a private door. Write the two Service manifests for a Rollout named api (Pods labelled app: api, container port 8080) so the controller can manage an active and a preview lane.
<details><summary>Solution</summary>
apiVersion: v1
kind: Service
metadata:
  name: api-active
  namespace: prod
spec:
  selector:
    app: api
  ports:
    - port: 80
      targetPort: 8080
---
apiVersion: v1
kind: Service
metadata:
  name: api-preview
  namespace: prod
spec:
  selector:
    app: api
  ports:
    - port: 80
      targetPort: 8080
Both carry the same app selector and no rollouts-pod-template-hash — the controller injects and manages that. Why: if you hard-code the hash, the controller cannot swap it and the flip breaks.
</details>
3 (Intermediate) — Make a quiet preview fail closed. Your prePromotionAnalysis has a single Prometheus success-rate metric with successCondition: result[0] >= 0.99. A release with almost no synthetic traffic passes the gate anyway. Add a guard so an empty preview cannot pass.
<details><summary>Solution</summary>
Add a second metric asserting minimum request volume, with failureLimit: 0:
- name: request-volume
  interval: 30s
  count: 5
  successCondition: result[0] >= 50
  failureLimit: 0
  provider:
    prometheus:
      address: http://prometheus.monitoring.svc.cluster.local:9090
      query: sum(rate(http_requests_total{service="api-preview"}[1m]))
An AnalysisRun passes only when every metric passes, so a near-zero denominator now fails the run instead of returning a NaN that reads as healthy. Why: a ratio over no traffic is not validation.
</details>
4 (Intermediate) — Size the rollback window. Your alerting takes up to 8 minutes to page on-call after a bad release, and on-call needs ~4 minutes to react. You are on an expensive node pool. Set scaleDownDelaySeconds and cap the cost.
<details><summary>Solution</summary>
strategy:
  blueGreen:
    scaleDownDelaySeconds: 720          # >= 8 min detect + 4 min react
    scaleDownDelayRevisionLimit: 1      # keep only the previous RS warm
720s covers detect-plus-react so undo is still an instant selector flip when the page fires; scaleDownDelayRevisionLimit: 1 keeps only one old RS warm so you pay 2x for one revision, not an unbounded set. Why: scaleDownDelaySeconds is your rollback budget — size it to the real detect-plus-react time, not a guess.
</details>
5 (Advanced) — Gate on a migration, not a metric. A release is coupled to a database migration that must be proven correct before any user touches green. A Prometheus ratio cannot express “the ledger reconciles to the cent.” Design the gate.
<details><summary>Solution</summary>
Use a Job-based metric in prePromotionAnalysis that runs a container which replays a recorded transaction corpus through previewService and asserts the result, exiting non-zero on any mismatch:
metrics:
  - name: ledger-replay
    provider:
      job:
        spec:
          backoffLimit: 0
          template:
            spec:
              restartPolicy: Never
              containers:
                - name: replay
                  image: registry.example.com/ledger-replay:1.0.0
                  args: ["--target", "http://ledger-preview", "--assert-balances"]
The Job provider maps exit 0 → Successful, non-zero → Failed, so a concrete pass/fail on real inputs becomes a hard interlock. Combine with autoPromotionEnabled: false so a human still promotes inside the change window. Why: when a regression must be impossible to promote past, assert it on real inputs, not on a statistical ratio.
</details>
6 (Advanced) — Halve the preview bill. A Rollout with replicas: 30 on memory-optimized nodes is too expensive to double for every release, but the risk you gate on is correctness, not throughput. Cut the preview cost.
<details><summary>Solution</summary>
strategy:
  blueGreen:
    previewReplicaCount: 4      # validate on 4 green Pods, not 30
    autoPromotionEnabled: false # scale to full 30 on promote
You pay for 34 Pods during the gate instead of 60; green scales to the full 30 as part of promotion. Why: previewReplicaCount is the right lever when correctness — not capacity — is what the gate proves. Do not use it if you are gating on throughput or concurrency, which only appear at full scale.
</details>
Common beginner mistakes
- Assuming promotion is manual by default.
autoPromotionEnableddefaults totrue. Without an explicitfalse(or a gatingprePromotionAnalysis), the flip happens the instant green is ready — the single most common “why did it just cut over?” surprise. The right mental model: blue-green auto-promotes unless you tell it not to. - Hard-coding the pod-template-hash into a Service selector. The controller owns the
rollouts-pod-template-hashlabel on the active and preview Services. Put a fixed hash in yourself and the selector swap has nothing to change — the cutover silently breaks. Your Services carry only the app selector; the controller adds the hash. - Treating
scaleDownDelaySecondsas cleanup, not a rollback budget. It defaults to 30 seconds. Leave it there and your “instant rollback” window is 30 seconds — long gone by the time a human notices a bad release. It is not garbage-collection tuning; it is how longundostays instant. Size it to your real detect-plus-react time. - Forgetting the 2x resource cost. Blue-green runs two full copies of the workload. On a large or expensive
Rolloutthat can double your bill for the release window (and longer, ifscaleDownDelaySecondsis generous). Budget the headroom, cap it withscaleDownDelayRevisionLimit, and reach forpreviewReplicaCountwhen correctness is the risk. - Shipping without a real analysis gate. A
blueGreenstrategy with noprePromotionAnalysis— or one with a single ratio metric over a quiet preview — is not validation. A success-rate query with a near-zero denominator returnsNaNand can read as healthy. Always pair a ratio with a volume guard, and prefer aJobsmoke test for pass/fail on concrete inputs. - Wiring the preview Service into production ingress. The whole point of
previewServiceis that green sees zero production traffic until you flip. Point your Ingress/HTTPRouteat the active Service only; expose preview on an internal-only route for smoke jobs. Route production at preview and you have destroyed the isolation you paid 2x for. - Thinking the flip drains connections. The selector swap moves new connections to green; existing keep-alive connections to blue stay open until they close. You still need
preStophooks and a sane grace period for when blue eventually scales down.
Verify
Confirm the blue-green machinery behaves before you trust it with production traffic.
# 1) Trigger a release and confirm it PAUSES at the pre-promotion gate (no cutover yet)
kubectl argo rollouts set image checkout checkout=registry.example.com/checkout:1.43.0 -n shop
kubectl argo rollouts get rollout checkout -n shop
#   Expect: status Paused, BlueGreenPause, active still on old RS, preview on new RS

# 2) Confirm the active Service still selects the OLD pod hash, preview selects the NEW one
kubectl get svc checkout-active checkout-preview -n shop \
  -o custom-columns=NAME:.metadata.name,HASH:.spec.selector.rollouts-pod-template-hash

# 3) Confirm the AnalysisRun for pre-promotion ran and passed
kubectl get analysisrun -n shop
kubectl argo rollouts get rollout checkout -n shop | grep -i analysis

# 4) Promote and confirm the active Service hash flips to the new RS
kubectl argo rollouts promote checkout -n shop
kubectl get svc checkout-active -n shop -o jsonpath='{.spec.selector.rollouts-pod-template-hash}'

# 5) Confirm the OLD ReplicaSet is still up (rollback window) until scaleDownDelay elapses
kubectl get rs -n shop -l app=checkout

# 6) Force a rollback and confirm traffic returns to the previous revision instantly
kubectl argo rollouts undo checkout -n shop
kubectl argo rollouts status checkout -n shop   # Expect: Healthy on prior revision
If step 1 cuts straight to Healthy without pausing, check that autoPromotionEnabled is false. If step 3 shows the AnalysisRun as Failed, inspect it with kubectl describe analysisrun <name> -n shop – a failed smoke Job or a NaN Prometheus result are the usual causes.
Enterprise scenario
A payments platform team ran a stateful ledger-reconciliation service behind blue-green. Their constraint: every release was coupled to a database migration, and compliance required that the new version be proven correct against a replica of production data before any customer transaction touched it – partial canary exposure was explicitly disallowed by their change-control policy. Their first cut used autoPromotionEnabled: true with a single Prometheus success-rate check, and it bit them: the preview service had almost no synthetic traffic, so the ratio query returned NaN, Argo Rollouts treated the analysis window as inconclusive-but-not-failing on an early scrape, and a release with a broken migration auto-promoted.
The fix had three parts. They moved validation into a Job-based pre-promotion metric that replayed a recorded transaction corpus through the preview service and asserted ledger balances reconciled to the cent (exit 0 or fail). They set autoPromotionEnabled: false so a release engineer had to issue the promote inside the approved window. And they raised scaleDownDelaySeconds to 900 with scaleDownDelayRevisionLimit: 1, giving on-call a 15-minute instant-rollback budget while capping the 2x-replica cost to one prior revision.
strategy:
  blueGreen:
    activeService: ledger-active
    previewService: ledger-preview
    autoPromotionEnabled: false
    scaleDownDelaySeconds: 900
    scaleDownDelayRevisionLimit: 1
    prePromotionAnalysis:
      templates:
        - templateName: ledger-replay   # Job: replay corpus, assert balances; exit 0 = pass
      args:
        - name: preview-service
          value: ledger-preview
The lesson generalized across their platform: blue-green analysis is only as trustworthy as the load you drive at the preview service. A metric query over a quiet preview is not validation – the Job provider, which asserts a concrete pass/fail on real inputs, is the right primitive when a regression must be impossible to promote past.
Checklist
Glossary
- Blue-green deployment — a release strategy that runs the old version (blue) and new version (green) side by side, validates green out of band, then switches all traffic at once.
- Rollout (CRD) — Argo Rollouts’
argoproj.io/v1alpha1replacement for a Deployment; addsstrategy.blueGreenandstrategy.canary. - activeService — the Service that carries live production traffic; the controller manages its selector and rewrites it on promotion.
- previewService — a second Service pointed at the green ReplicaSet so you can validate it without production traffic.
- rollouts-pod-template-hash — a label the controller derives from the Pod template and stamps on every Pod in a ReplicaSet; “active” vs “preview” is just which hash each Service’s selector currently carries.
- ReplicaSet (RS) — the object that actually runs a set of identical Pods; blue and green are two ReplicaSets of the same Rollout.
- autoPromotionEnabled — whether the controller flips automatically once pre-promotion analysis passes; defaults to
true. - autoPromotionSeconds — auto-promote after a fixed soak even without a manual promote.
- prePromotionAnalysis / postPromotionAnalysis —
AnalysisRuns that gate the flip (before) or watch for regressions (after, while blue is warm). - AnalysisTemplate — a reusable definition of metrics and their pass/fail conditions; an AnalysisRun is one execution of it.
- successCondition / failureLimit — the expression a metric must satisfy, and how many bad measurements are tolerated before the run fails.
- Inconclusive — an AnalysisRun that neither clearly passed nor failed; treated as not-promotable by default.
- scaleDownDelaySeconds — how long blue stays scaled up after cutover; your instant-rollback window (default 30s).
- scaleDownDelayRevisionLimit — how many previous ReplicaSets to keep warm, capping the 2x cost.
- previewReplicaCount — run green at fewer replicas during preview to reduce cost, then scale to full on promotion.
- abortScaleDownDelaySeconds — how long a rejected green stack lingers after an
abortbefore scaling down (default 30s). - antiAffinity — a scheduling preference or requirement that keeps blue and green Pods on different nodes.
- promote / abort / undo — flip to green; cancel before the flip and discard green; re-point the active selector to a previous revision.
- Traffic router — an external L7 router (Istio/NGINX/ALB/Gateway API) Argo Rollouts can drive for per-request weighting; blue-green usually does not need one.
- Rollout phases —
Healthy,Progressing,Paused(awaiting promotion),Degraded(analysis failed) — the states you dashboard and alert on.