In a nutshell
New Relic on Kubernetes is really two agents plus one piece of magic. The first agent watches the cluster — an infrastructure agent that runs on every node and reports “is this node healthy, is this pod restarting, how much CPU is this container burning.” The second agent watches your code — a language APM agent you add to a service to get distributed traces and stack traces from inside the application. The magic is Pixie: instead of asking forty teams to add instrumentation, Pixie uses eBPF to watch the traffic itself, in the Linux kernel, and hand you request rates, latency, and errors for every service — with no code changes, no redeploys, nothing to import.
Think of it like instrumenting a building. The infrastructure agent is the building management system — power draw, temperature, which rooms are occupied. An APM agent is a body-cam you clip onto one specific worker to see exactly what they do, step by step. Pixie is a set of hallway cameras: they see everyone walking between rooms without anyone wearing a body-cam, so you instantly get a map of who talks to whom and how long each trip takes — even for the teams that never opted in.
The reason this matters to a beginner: the single hardest part of observability is usually getting the data in the first place, and traditionally that meant editing every service. Pixie’s eBPF approach flips that — you get broad, automatic telemetry on day one, then add the heavyweight APM agents only where you need deep, code-level detail. Everything — infra metrics, APM traces, Pixie’s eBPF telemetry, and logs — flows to one New Relic backend and is stitched together by a shared clusterName, so a slow trace, the pod under it, and the log lines for that request all line up.
Level: Intermediate · Time: ~27 min · Assumes: comfort with pods, Deployments, DaemonSets, and Helm, and a cluster you can run kubectl against. No prior New Relic or eBPF knowledge is needed — this lesson builds both. After it you will be able to: install the nri-bundle chart for infrastructure, events, and logs; add Pixie for eBPF auto-telemetry; auto-inject language APM agents with the k8s-agents-operator; write NRQL to prove data is arriving; and reason about which of the three layers answers which question — and what each one costs.
A payments company runs forty microservices on a 60-node EKS cluster, and every incident review ends the same way: the on-call engineer knew a pod was unhealthy but had no idea which downstream call was slow, because nobody had time to add tracing to forty services across four languages. The mandate from the platform team is blunt — full cluster visibility plus per-service request tracing, live in a week, without asking forty product teams to re-instrument their code. This guide does exactly that: it installs the New Relic Kubernetes integration for infrastructure and control-plane health, drops in language APM agents where deep code-level traces are wanted, and layers Pixie on top to capture HTTP, gRPC, DNS, and database telemetry from the whole cluster using eBPF — no code changes, no redeploys. By the end you have golden signals for every service and a teardown path that leaves no trace.
Prerequisites
- A Kubernetes cluster 1.27+ (EKS, AKS, or GKE) with kernel 4.14+ on Linux nodes — Pixie’s eBPF probes will not load on older kernels or on Windows/Fargate nodes.
kubectl(matching the server minor version),helm3.12+, and cluster-admin for the install (Pixie deploys a privileged DaemonSet).- A New Relic account with a License key (ingest) and a Pixie deploy key; both retrieved from the New Relic UI under Administration.
- Egress to
*.newrelic.comand*.nr-data.neton 443, or a network proxy if nodes are private. - Cluster nodes with at least 1 vCPU / 2 GiB headroom per node for the Pixie Vizier and the infra agent.
Target topology
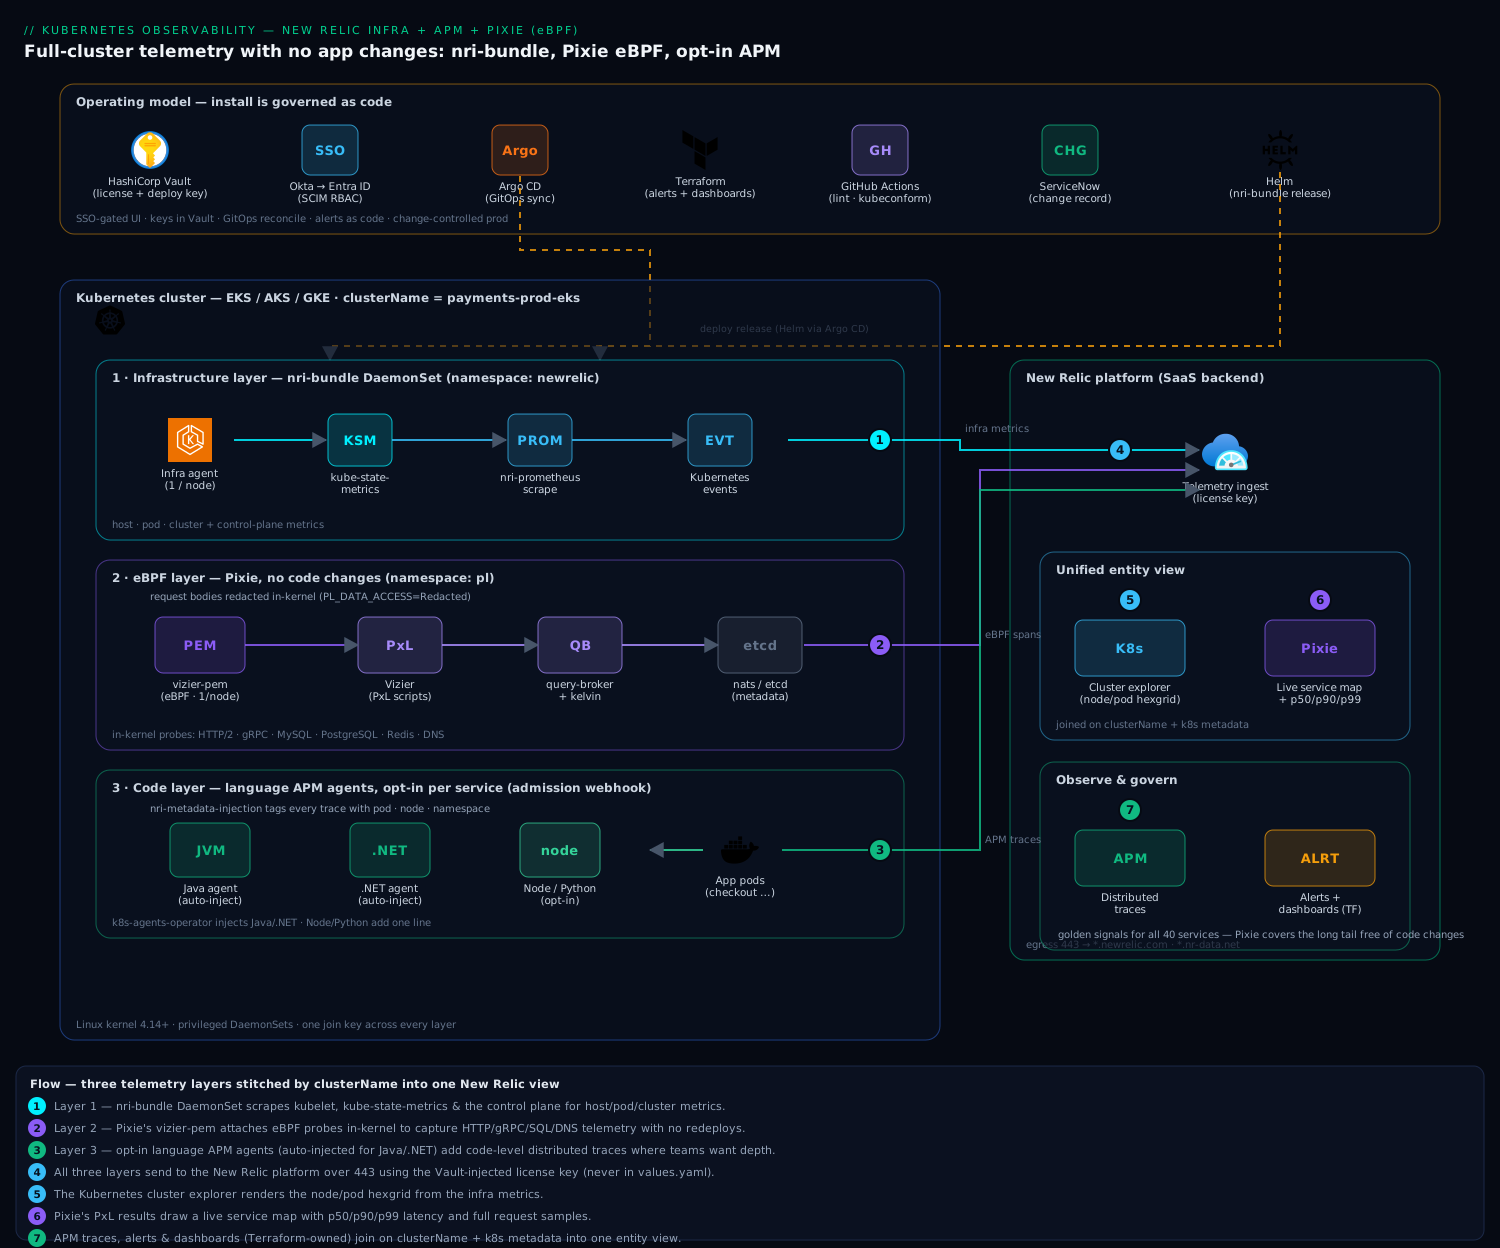
The design has three telemetry layers feeding one backend. The infrastructure layer is a New Relic DaemonSet (nri-bundle) on every node, scraping kubelet, kube-state-metrics, and the control plane for host, pod, and cluster metrics. The eBPF layer is Pixie — a per-node PEM (Pixie Edge Module) that attaches eBPF probes in-kernel to capture full-body request telemetry for HTTP/2, gRPC, MySQL, PostgreSQL, Redis, and DNS, with a per-cluster Vizier that runs PxL scripts and ships results to New Relic. The code layer is optional language APM agents, injected only into the services where a team wants distributed traces and code-level stack traces. All three send to the New Relic platform, where the same clusterName and Kubernetes metadata stitch them into one view.
Around that, the operating model is real: engineers reach the New Relic UI through Okta SSO federated to Entra ID for SCIM-provisioned RBAC; the License and Pixie keys live in HashiCorp Vault and are injected at deploy time, never committed; Argo CD reconciles the Helm release from Git; Terraform owns the alert policies and dashboards as code; and a ServiceNow change record gates the production rollout.
1. Stage the keys in Vault (never in Git)
The integration needs two secrets — the New Relic License key and the Pixie deploy key. Put them in HashiCorp Vault, which acts as the system of record for secrets here, and let the Vault Secrets Operator sync them into the cluster as a native Secret. Do not paste them into values.yaml.
Write the secrets to a KV-v2 mount:
vault kv put secret/observability/newrelic \
  license_key="$NEW_RELIC_LICENSE_KEY" \
  pixie_deploy_key="$PIXIE_DEPLOY_KEY"
Then have the Vault Secrets Operator materialize them into the target namespace as a Kubernetes Secret named newrelic-keys:
# vso-newrelic.yaml
apiVersion: secrets.hashicorp.com/v1beta1
kind: VaultStaticSecret
metadata:
  name: newrelic-keys
  namespace: newrelic
spec:
  type: kv-v2
  mount: secret
  path: observability/newrelic
  destination:
    name: newrelic-keys
    create: true
  refreshAfter: 1h
  vaultAuthRef: vault-auth-k8s
kubectl create namespace newrelic
kubectl apply -f vso-newrelic.yaml
kubectl get secret newrelic-keys -n newrelic   # confirm it exists before installing Helm
The Helm chart will reference this existing Secret rather than receiving raw key values, so rotation in Vault propagates without a redeploy.
Why two keys, and only two? New Relic actually has several credential types — the License (ingest) key every agent uses to send data, the Pixie deploy key used to register Pixie, plus a User (API) key for the Terraform provider and a Pixie API key for the
pxCLI. Only the first two are needed to deploy the stack, so only those two go in the cluster’s Secret. The## Going deepersection lays out all four and where each belongs.
2. Install the New Relic Kubernetes integration (infra + control plane)
The nri-bundle chart is the umbrella: it installs the infrastructure agent DaemonSet, the Kubernetes integration, kube-state-metrics (if you don’t already run it), the Prometheus agent, and the Kubernetes events forwarder. Add the repo and render a values file.
helm repo add newrelic https://helm-charts.newrelic.com
helm repo update
# nr-values.yaml
global:
  cluster: payments-prod-eks
  # Reference the Vault-synced Secret instead of inlining the key:
  customSecretName: newrelic-keys
  customSecretLicenseKey: license_key
  lowDataMode: true            # drops chatty default metrics; big cost lever

kube-state-metrics:
  enabled: true                # set false if KSM already runs in the cluster
newrelic-infrastructure:
  privileged: true             # needed for full host metrics
kubeEvents:
  enabled: true
nri-prometheus:
  enabled: true
nri-metadata-injection:
  enabled: true                # auto-links APM traces to pods/nodes
Install it into the newrelic namespace:
helm upgrade --install nri-bundle newrelic/nri-bundle \
  --namespace newrelic \
  --values nr-values.yaml \
  --version 5.x \
  --wait --timeout 5m
Within a minute or two, the Kubernetes cluster explorer in New Relic should show every node and pod. The cluster: payments-prod-eks value is the join key — keep it identical across every layer in this guide.
What’s inside the nri-bundle umbrella chart
nri-bundle is not one thing — it is a Helm umbrella that toggles a set of sub-charts on and off from a single values file. That is why one helm upgrade can deploy the whole observability stack, and why the values above have top-level keys like kubeEvents and nri-prometheus: each maps to a sub-chart. The pieces worth knowing:
| Sub-chart (values key) | What it deploys | The signal it produces |
|---|---|---|
newrelic-infrastructure |
the infra agent DaemonSet (one pod/node) + the Kubernetes integration | host, node, pod, container metrics (K8s*Sample) |
nri-kube-events (kubeEvents) |
a Deployment forwarding Kubernetes Events | kubectl get events as a queryable stream |
kube-state-metrics |
KSM, if you don’t already run it | Deployment/ReplicaSet/Pod object state |
nri-prometheus / newrelic-prometheus-agent |
scrapes Prometheus /metrics endpoints |
any Prometheus-exposed app metric |
nri-metadata-injection |
a mutating webhook | stamps pod/node/namespace onto APM traces |
newrelic-logging (logging) |
a Fluent Bit DaemonSet | container stdout/stderr logs |
newrelic-pixie + pixie-chart |
Pixie PEMs + Vizier and the NR bridge | eBPF request telemetry (step 3) |
k8s-agents-operator |
the APM auto-injection operator | language agents via Instrumentation CRs (step 4) |
You do not have to enable all of them. The install above turns on infra, events, KSM, Prometheus, and metadata injection; Pixie and the APM operator come in the next two steps. nri-prometheus is the classic Prometheus scraper; on newer bundles the recommended path is newrelic-prometheus-agent (an agent-mode Prometheus that remote-writes to New Relic) — pick one, not both.
Turn on log forwarding
The one signal the topology diagram hasn’t captured yet is logs. The bundle carries newrelic-logging, a Fluent Bit DaemonSet that tails every container’s stdout/stderr off the node filesystem (/var/log/containers) and ships it to New Relic Logs — automatically tagged with the pod, namespace, and clusterName, so a log line joins the same entity as its metrics and traces. Enable it in nr-values.yaml:
logging:
  enabled: true                # newrelic-logging: a Fluent Bit DaemonSet
Re-run the same helm upgrade --install from above, then confirm the forwarder landed on every node:
kubectl get pods -n newrelic -l app.kubernetes.io/name=newrelic-logging -o wide
# one Fluent Bit pod per node, all Running
In New Relic, Logs now streams container output, and because lowDataMode also trims log attributes, you get the lines without a label explosion. To keep a chatty namespace out, exclude it with a Fluent Bit filter rather than disabling logging cluster-wide (see the cost notes).
3. Add Pixie for eBPF auto-telemetry
Pixie is what gives you per-service request telemetry without touching application code: its PEM uses eBPF to trace syscalls and protocol traffic in-kernel, and the Vizier runs PxL scripts to turn that into service maps, latency, and full request samples. You can enable Pixie inside the same nri-bundle release.
Add to nr-values.yaml:
newrelic-pixie:
  enabled: true
  # apiKey injected from the Vault Secret, not inlined:
  customSecretApiKeyName: newrelic-keys
  customSecretApiKeyKey: pixie_deploy_key
pixie-chart:
  enabled: true
  deployKey: ""                # left blank; sourced from the Secret below
  clusterName: payments-prod-eks
  pixieDeployKeySecret: newrelic-keys
Re-run the same helm upgrade --install from step 2 so the chart reconciles with Pixie enabled. Then watch the Pixie components come up:
kubectl get pods -n pl                       # Pixie installs into the 'pl' namespace
# Expect: vizier-pem (one per node, DaemonSet), vizier-query-broker,
#         vizier-metadata, kelvin, and a nats/etcd pair.
The vizier-pem DaemonSet must be Running on every Linux node — if a pod is stuck, it is almost always the kernel-version or privileged-securityContext check (see Pitfalls). Once healthy, open the Kubernetes > Pixie tab in New Relic and run a script:
# Optional: install the px CLI to query the cluster directly
px run px/service_stats -- --cluster payments-prod-eks
# Shows per-service RPS, p50/p90/p99 latency, and error rate from eBPF data.
You now have HTTP/gRPC/SQL/DNS golden signals for all forty services without a single redeploy.
A first look at PxL
Pixie’s data is queried with PxL, a Python/Pandas-flavored language that runs inside the cluster against the eBPF-captured tables. The New Relic UI ships dozens of canned scripts, but you can run them from the CLI too:
# Top talkers: per-service inbound RPS, latency, and error rate
px run px/service_stats

# Full HTTP request samples the PEMs captured (method, path, status, latency)
px run px/http_data
Each script reads columnar tables — http_events, conn_stats, process_stats — that the PEMs populate in-kernel, so you are querying data that never left the cluster to get here. That in-cluster storage model is central to how Pixie stays cheap; the ## Going deeper section explains exactly how the capture works.
4. Inject APM agents where you want code-level traces
Pixie gives breadth; APM agents give depth — full distributed traces, transaction breakdowns, and error stack traces inside the code. Add them only to the services that need it. For JVM and .NET, the cleanest path is the New Relic Kubernetes APM auto-injection (an admission webhook), so teams don’t edit Dockerfiles.
Install the operator and a per-language instrumentation policy:
helm upgrade --install newrelic-apm-injection newrelic/nri-bundle \
  --namespace newrelic --reuse-values \
  --set k8s-agents-operator.enabled=true
# apm-instrumentation.yaml
apiVersion: newrelic.com/v1alpha1
kind: Instrumentation
metadata:
  name: payments-java
  namespace: newrelic
spec:
  agent:
    language: java
    image: newrelic/newrelic-java-init:latest
  podLabelSelector:
    matchLabels:
      newrelic-instrumentation: "java"   # opt-in per deployment
kubectl apply -f apm-instrumentation.yaml
# Teams opt a service in by labeling its pods:
kubectl patch deployment checkout -n payments \
  --type merge -p '{"spec":{"template":{"metadata":{"labels":{"newrelic-instrumentation":"java"}}}}}'
For a Node.js or Python service that prefers explicit control, the agent is a one-line addition instead:
# Node.js example
RUN npm install newrelic
ENV NEW_RELIC_APP_NAME="checkout-api" \
    NEW_RELIC_LICENSE_KEY_FROM_SECRET="newrelic-keys" \
    NODE_OPTIONS="-r newrelic"
Because nri-metadata-injection is enabled (step 2), every APM trace is automatically tagged with its pod, node, and namespace, so an APM transaction links straight to the Pixie service map and the infra dashboard.
Auto-injection internals, and the OpenTelemetry alternative
The k8s-agents-operator you enabled is a mutating admission webhook. When a pod whose labels match an Instrumentation resource is created, the operator injects an init container that copies the language agent into a shared volume, then sets the environment variables (JAVA_TOOL_OPTIONS, NODE_OPTIONS, and so on) that make the runtime load it at start-up. Nothing changes in the image or the Dockerfile — opting a service in is the one-label patch above, and opting out is deleting the label and restarting the pod. That is why this scales to forty services without forty pull requests.
There is a second way to get code-level traces that skips New Relic’s agents entirely: OpenTelemetry. New Relic is OTLP-native, so a service already instrumented with the OTel SDK (or auto-instrumented by the OpenTelemetry Operator) can ship straight to New Relic’s OTLP endpoint with no New Relic agent at all. The ## Going deeper section covers when to pick each path.
5. Wire it into GitOps and govern as code
Manual helm upgrade is fine for the first cluster; production should be reconciled by Argo CD, which continuously syncs the Helm release from Git so the cluster state always matches the reviewed manifest. Define the release as an Argo CD Application:
# argocd-newrelic.yaml
apiVersion: argoproj.io/v1alpha1
kind: Application
metadata:
  name: newrelic-observability
  namespace: argocd
spec:
  project: platform
  source:
    repoURL: https://github.com/kloudvin/platform-observability
    targetRevision: main
    path: charts/nri-bundle
    helm:
      valueFiles: [values/payments-prod.yaml]
  destination:
    server: https://kubernetes.default.svc
    namespace: newrelic
  syncPolicy:
    automated: { prune: true, selfHeal: true }
A GitHub Actions pipeline lints the chart, runs helm template | kubeconform against the cluster’s API schema, and opens the PR; merging triggers Argo CD to roll it out. The alert policies, NRQL conditions, and dashboards are owned by Terraform using the New Relic provider, so observability config lives in version control beside everything else:
resource "newrelic_alert_policy" "k8s_golden" {
  name = "payments-prod-eks golden signals"
}

resource "newrelic_nrql_alert_condition" "pod_crashloop" {
  policy_id   = newrelic_alert_policy.k8s_golden.id
  name        = "Pod CrashLoopBackOff"
  nrql { query = "SELECT count(*) FROM K8sContainerSample WHERE clusterName = 'payments-prod-eks' AND status = 'Waiting' AND reason = 'CrashLoopBackOff'" }
  critical { operator = "above" threshold = 0 threshold_duration = 300 threshold_occurrences = "all" }
}
The production sync itself is gated by a ServiceNow change record — the GitHub Actions job will not promote to the prod cluster until the linked CHG ticket is in an approved state, giving you an auditable change trail per the platform’s controls.
6. Validation
Prove each layer independently before declaring victory.
# Infra agent: one pod per node, all Running
kubectl get pods -n newrelic -l app.kubernetes.io/name=newrelic-infrastructure -o wide

# Pixie PEM: one per node, all Running
kubectl get ds vizier-pem -n pl

# Confirm metrics are actually arriving (run in New Relic query builder):
#   FROM K8sNodeSample SELECT uniqueCount(nodeName) WHERE clusterName = 'payments-prod-eks'
#   FROM Span SELECT count(*) WHERE clusterName = 'payments-prod-eks' SINCE 5 minutes ago
In the New Relic UI: the Kubernetes cluster explorer should render the node/pod hexgrid; the Pixie tab should draw a live service map with latency; and any APM-instrumented service should appear under APM & Services with distributed traces that cross service boundaries. Generate a little load (kubectl run loadgen --image=busybox --restart=Never -- wget -q -O- http://checkout.payments) and watch the request appear in Pixie within seconds — that round trip is the end-to-end proof.
7. Rollback and teardown
Because everything went in through Helm and one namespace, removal is clean and leaves no orphaned privileged DaemonSets.
# Disable Pixie first (unloads eBPF probes), then remove the bundle:
helm upgrade nri-bundle newrelic/nri-bundle -n newrelic \
  --reuse-values --set newrelic-pixie.enabled=false --set pixie-chart.enabled=false --wait

helm uninstall nri-bundle -n newrelic
kubectl delete namespace pl          # Pixie's namespace
kubectl delete namespace newrelic    # infra agent + secrets

# If using GitOps, delete the Argo CD app so it doesn't re-create the release:
kubectl delete application newrelic-observability -n argocd
To roll back a single bad release instead of removing everything, use helm rollback nri-bundle <REVISION> -n newrelic after finding the revision with helm history nri-bundle -n newrelic. Revoke the Pixie deploy key in the New Relic UI and rotate the Vault entry if the cluster is being decommissioned.
Going deeper
This section is for the reader who wants to know what is actually happening under the three layers — how Pixie captures traffic without touching your code, how the data model bills you, and when to reach for infra vs APM vs Pixie. None of it is required to get data flowing, but it is the difference between “I installed a Helm chart” and “I know why my bill looks like that.”
Pixie’s eBPF magic: capturing traffic with zero instrumentation
The PEM (Pixie Edge Module) is one DaemonSet pod per node, and it does something the language agents cannot: it reads your services’ traffic from the outside, in the kernel. It attaches eBPF probes — kprobes on the syscalls that send and receive data (write, read, sendto, recvfrom) and uprobes on the TLS libraries (OpenSSL, Go’s crypto/tls, BoringSSL) so it can see request bodies before they are encrypted and after they are decrypted. From that raw byte stream it runs protocol parsers that recognize HTTP/1.1, HTTP/2, gRPC, MySQL, PostgreSQL, Cassandra, Redis, Kafka, DNS, NATS, AMQP, and Mongo, and reconstructs each request/response pair with its latency. Because the probe sits at the syscall boundary, it works for any language — a Go binary, a JVM, a Python app all look the same at read()/write().
Two properties make this safe and cheap. First, eBPF programs are verified before they load — the kernel proves they terminate and touch no memory they shouldn’t, so a bad probe can’t crash the node. Second, the captured data stays in the cluster: the PEMs hold it in an in-memory, columnar store with a rolling, memory-bounded retention (a few hours of full-fidelity data, not a permanent warehouse). Nothing is shipped out until a PxL script runs and returns a result — which is why Pixie’s raw telemetry is effectively free of per-GB ingest until you promote a script’s output to New Relic.
The Vizier is Pixie’s in-cluster control plane — a query broker, a metadata service, and Kelvin, the distributed query engine that fans a PxL script out to every PEM and merges the results — and the newrelic-pixie bridge runs the scripts you’ve chosen on a schedule and forwards their outputs to New Relic. The catch is the flip side of “it reads the kernel”: Pixie needs a Linux kernel 4.14+, a node image that permits eBPF and the privileged securityContext, and real nodes it controls. That rules out AWS Fargate and Windows nodes, and it can trip on hardened/locked-down node images — exactly the failure the Pitfalls section describes.
The OpenTelemetry path: New Relic is OTLP-native
New Relic ingests OTLP (the OpenTelemetry wire protocol) directly — you do not need a New Relic-specific agent to send it traces, metrics, or logs. Point any OpenTelemetry SDK or Collector at the New Relic OTLP endpoint and set the license key as the auth header:
# OTLP/gRPC on 4317, OTLP/HTTP on 4318; EU accounts use otlp.eu01.nr-data.net
OTEL_EXPORTER_OTLP_ENDPOINT="https://otlp.nr-data.net:4317"
OTEL_EXPORTER_OTLP_HEADERS="api-key=${NEW_RELIC_LICENSE_KEY}"
So you have two ways to get code-level traces: New Relic’s language APM agents (the deepest New Relic-specific detail, auto-injected by the operator) or OpenTelemetry (vendor-neutral, portable to any OTLP backend). The rule of thumb: if a service already emits OTel, ship it straight to New Relic and skip the agent; if it has no instrumentation and you want the richest New Relic APM experience with least effort, use the agent. This OTLP-native design is also why an OSS, OpenTelemetry-first stack like SigNoz on Kubernetes is a drop-in conceptual sibling — same telemetry, different backend.
Infra vs APM vs Pixie: which layer answers which question
The three layers overlap enough to confuse beginners, but each has a job the others do poorly. Reach for the one that answers your actual question:
| Question you’re asking | Layer | Why |
|---|---|---|
| Is this node/pod healthy? OOMKilled? throttled? | Infra (nri-bundle) |
host + kubelet + KSM metrics; the only layer with node-level truth |
| Which services talk to which, and how fast? | Pixie | eBPF service map + golden signals, no code changes, whole cluster |
| Why is this line of code slow / throwing? | APM agent | in-process spans, stack traces, DB query attribution |
| What did this pod print at 14:03? | Logs (newrelic-logging) |
Fluent Bit tails stdout/stderr |
| Cluster-wide golden signals on day one, 40 services | Pixie | breadth for free of instrumentation |
| Distributed trace across six services with custom spans | APM agent | Pixie sees the hops, but not your custom business spans |
The pattern that actually works in production: Pixie for breadth (every service, immediately), APM for depth (the handful of services where you need code-level traces), infra for the substrate, logs for the details — all joined by clusterName.
NRQL, dashboards, and alerts as code
Everything New Relic stores is queryable with NRQL, a SQL-flavored language over event types. The ones this lesson produces:
| Event type | Comes from | Sample question |
|---|---|---|
K8sNodeSample, K8sPodSample, K8sContainerSample |
infra + k8s integration | node/pod/container health |
Span |
APM agents / OTLP | distributed traces |
Metric |
dimensional metrics, Prometheus, Pixie | any time series |
Log |
newrelic-logging |
container output |
A query reads SELECT <function> FROM <eventType> WHERE <filter> [FACET ...] [SINCE ...]:
-- Pods restarting the most in the last hour, by namespace
FROM K8sContainerSample SELECT sum(restartCount)
WHERE clusterName = 'payments-prod-eks'
FACET namespaceName SINCE 1 hour ago

-- p95 request duration per service from Pixie/APM spans
FROM Span SELECT percentile(duration.ms, 95)
WHERE clusterName = 'payments-prod-eks' FACET service.name SINCE 30 minutes ago
The lesson already defines the alert policy and a CrashLoopBackOff condition in Terraform (step 5) — that same NRQL is what a newrelic_nrql_alert_condition wraps. Keep dashboards and alerts in Terraform beside the Helm values so a reviewer sees the whole observability change in one PR.
Cardinality, DPM, and what actually drives the bill
New Relic bills on data ingested (GB) and per-user seats — not on the number of agents. The thing that quietly inflates ingest is cardinality: every unique combination of a metric’s attribute values is a distinct time series, and data points per minute (DPM) is how fast you’re producing them. Put a high-cardinality attribute on a metric — a pod name, a request ID, a full URL path — and one metric becomes tens of thousands of series. That is the single most common New Relic cost surprise, and it comes from dimensions, not from having “too many nodes.”
The levers, in order of impact:
lowDataMode: true(already set in step 2) — drops the chattiest default metrics and trims attributes; the biggest single lever on a large cluster.- Scope the Prometheus scrape —
nri-prometheus/newrelic-prometheus-agentwill scrape everything carrying aprometheus.io/scrapeannotation; allowlist the targets you actually dashboard rather than the whole cluster. - Let Pixie carry the long tail — its raw eBPF data stays in-cluster and cheap; only promote the PxL scripts you actually chart.
- APM only where it earns its keep — code-level agents ingest far more per service than Pixie’s sampled telemetry.
You can watch your own ingest with NRQL — meta, but useful:
FROM NrConsumption SELECT sum(GigabytesIngested)
FACET usageMetric SINCE 1 day ago
For the Prometheus-heavy shops, contrast this with a self-hosted Prometheus and Grafana stack where you pay in storage and operational effort instead of per-GB ingest — same cardinality trap, different bill.
The license key, secrets, and the four key types New Relic uses
New Relic has several credential types, and mixing them up is a classic first-day snag:
| Key | Used for | Who holds it |
|---|---|---|
| License (ingest) key | sending telemetry in | every agent, the OTLP header |
| Pixie deploy key | registering/deploying Pixie to a cluster | the newrelic-pixie / pixie-chart install |
| User (API) key | NerdGraph API, the Terraform provider | CI / the person running terraform apply |
| Pixie API key | the px CLI querying the cluster directly |
an engineer’s workstation |
Only the first two are needed to deploy the stack in this lesson, and both live in HashiCorp Vault, synced into the cluster as the newrelic-keys Secret (step 1) and referenced by the chart — never inlined in values.yaml, never committed. Because the chart reads them by Secret reference, rotating the value in Vault propagates on the next sync with no redeploy. The user key that Terraform needs is a CI secret, not a cluster secret; keep it in the pipeline’s secret store, not in the Helm values.
Agent-based vs eBPF-based observability
Zoom out and the two philosophies on display here are worth naming, because you will choose between them again and again:
| Agent-based (infra + APM) | eBPF-based (Pixie) | |
|---|---|---|
| How it gets data | code/agent runs inside the process or on the host | kernel probes read syscalls/TLS from outside |
| Coverage effort | per-service opt-in (or an operator to inject) | whole cluster at once, zero per-service work |
| Depth | full: custom spans, business context, stack traces | broad: protocol-level requests, latency, errors |
| Blind spots | services nobody instrumented | your own custom in-code spans |
| Overhead | in-process CPU/memory per service | per-node CPU for capture; privileged DaemonSet |
| Node requirements | none special | kernel 4.14+, eBPF-capable, real nodes (no Fargate) |
Neither wins outright — that is why this lesson runs both. eBPF gives you the map of the whole city for free; agents give you the body-cam on the workers who matter. Cilium’s Hubble is the same eBPF-observes-the-kernel idea applied to network flows and policy verdicts rather than application requests — worth a look to cement the mental model that the kernel is the cheapest place to observe from. An agent-based cousin worth comparing is the Datadog Agent and Cluster Agent, which solves the same “one pane of glass” problem entirely with node and application agents.
Practice challenges
Work these against the topology you built. Try each before opening the solution.
1. (Beginner) Prove the infra agent is on every node. After the nri-bundle install, confirm there is exactly one infrastructure agent pod per node and all are Running.
<details> <summary>Solution</summary>
kubectl get pods -n newrelic -l app.kubernetes.io/name=newrelic-infrastructure -o wide
# Compare the pod count to your node count:
kubectl get nodes --no-headers | wc -l
It is a DaemonSet, so pod count should equal schedulable Linux-node count. A missing pod usually means a taint the DaemonSet doesn’t tolerate, or a Windows/Fargate node. </details>
2. (Beginner) Explain why one Pixie PEM is missing. kubectl get ds vizier-pem -n pl shows DESIRED 6, READY 5. One node has no PEM. List the likely causes, most likely first.
<details> <summary>Solution</summary>
Most to least likely: (1) that node’s kernel is <4.14 or its image blocks eBPF; (2) it’s a Fargate/Windows node (unsupported); (3) a hardened node image denies the privileged securityContext; (4) insufficient CPU/memory headroom so the pod is Pending. Investigate with:
kubectl get pods -n pl -o wide | grep -v Running
kubectl describe pod -n pl vizier-pem-xxxxx | tail -20
uname -r   # on the node itself
</details>
3. (Intermediate) Write the NRQL for container restarts. In the New Relic query builder, write a query that returns the number of container restarts in payments-prod-eks in the last hour, broken down by pod.
<details> <summary>Solution</summary>
FROM K8sContainerSample SELECT sum(restartCount)
WHERE clusterName = 'payments-prod-eks'
FACET podName SINCE 1 hour ago
FACET is NRQL’s GROUP BY; restartCount is a field on K8sContainerSample. Wrap this in a newrelic_nrql_alert_condition to alert on it.
</details>
4. (Intermediate) Cut ingest without losing coverage. Your New Relic bill jumped after you enabled the full Prometheus scrape on a 60-node cluster. Name three changes that reduce ingest while keeping cluster and service visibility.
<details> <summary>Solution</summary>
(1) Confirm global.lowDataMode: true. (2) Scope nri-prometheus/newrelic-prometheus-agent to an allowlist of scrape targets instead of every annotated pod. (3) Remove APM agents from services that don’t need code-level traces and let Pixie cover them for free — its eBPF data stays in-cluster. Verify the drop with FROM NrConsumption SELECT sum(GigabytesIngested) SINCE 1 day ago.
</details>
5. (Advanced) Pick the right layer. For each question, name the layer that answers it: (a) “was this pod OOMKilled?”; (b) “which downstream call in checkout is slow?” with no code-level agent installed; © “show the exact SQL query and stack trace for a slow request.”
<details> <summary>Solution</summary>
(a) Infra — K8sContainerSample/K8sPodSample carry the OOM/restart reason. (b) Pixie — its eBPF service map gives per-hop latency with no instrumentation. © APM agent — only the in-process agent captures the SQL statement and the code stack trace; Pixie sees the DB call at protocol level but not your stack.
</details>
6. (Advanced) Redact PII before it leaves the node. A payments service’s HTTP bodies contain card numbers, and compliance forbids raw bodies leaving the cluster. How do you use Pixie safely?
<details> <summary>Solution</summary>
Because Pixie samples request bodies, scrub them in-cluster before any script output ships. Use PxL’s redaction — px.redact_pii() / px.redact_pii_best_effort() in the scripts you promote — and/or run the cluster in a redacted data-access mode so bodies are masked before egress (the Security note’s PL_DATA_ACCESS=Redacted). Combined with Pixie’s default in-cluster storage, raw card numbers never leave the node. This is the eBPF equivalent of agent-side scrubbing.
</details>
Common beginner mistakes
- Expecting Pixie to replace APM. Pixie gives you breadth — every service’s request rate, latency, and errors at the protocol level — but it does not see your custom in-code spans, business context, or the stack trace of a slow function. It samples traffic; it is not a full distributed-trace-with-your-annotations tool. The right model: Pixie for the whole map, an APM agent on the few services where you need code-level depth. They complement, they don’t substitute.
- Ignoring Pixie’s kernel and node requirements. eBPF probes load into the kernel, so they need Linux 4.14+, an eBPF-capable node image, and the privileged securityContext — and they simply cannot run on Fargate or Windows nodes. Beginners install Pixie on a serverless-node cluster, see PEMs stuck, and assume the install is broken. It isn’t; those nodes are unsupported by design. Check
uname -rand the node type before blaming the chart. - Under-budgeting for DPM and cardinality. The bill is driven by data ingested, and the sneaky multiplier is cardinality — a high-cardinality attribute (pod name, request ID, raw URL) turns one metric into tens of thousands of series. Leaving
lowDataMode: falseand scraping every Prometheus endpoint on a big cluster can multiply ingest an order of magnitude. Start locked down and add metrics deliberately; the default is not “safe and cheap.” - Putting the license key in plain YAML. Pasting the license or Pixie deploy key into
values.yaml(or worse, committing it) leaks a credential that lets anyone write to your account — and git history is forever. Keep keys in Vault, sync them to a Secret, and reference the Secret by name so rotation needs no redeploy. A key in a values file is agit blameaway from an incident. - Over-collecting “just in case.” Turning on the full Prometheus scrape, a second
kube-state-metrics, every log stream, and APM on all forty services because you can produces a bill that rivals the workloads you’re watching — and a UI too noisy to use. Observability is a budget: collect what you’ll actually query, let Pixie cover the long tail cheaply, and add depth where an incident proved you needed it. - Assuming
clusterNamestitches itself. The infra agent, Pixie, and APM agents only appear as one cluster if they share an identicalclusterName/clustervalue. Typo it in one layer and you get three disconnected datasets that each look half-broken. Set it once and reuse the exact string everywhere (the Pitfalls note below reinforces this).
Common pitfalls
- Pixie PEMs CrashLoopBackOff on certain nodes. Almost always an unsupported kernel (<4.14), a hardened node image that blocks eBPF, or missing privileged securityContext. Check
kubectl logs vizier-pem-xxxxx -n pland confirm the node kernel withuname -r. Fargate and Windows nodes are unsupported — taint them out of the DaemonSet. - Mismatched
clusterNameacross layers. If the infra agent, Pixie, and APM agents disagree onclusterName, the UI shows three disconnected datasets. Set it once and reuse it everywhere. - Cost blowout from default metrics. Leaving
lowDataMode: falseand enabling the full Prometheus scrape on a large cluster can multiply ingest. Start withlowDataMode: trueand add metrics deliberately. - Double kube-state-metrics. If KSM already runs in the cluster, setting
kube-state-metrics.enabled=truedeploys a second one and doubles those series. Point the integration at the existing KSM instead.
Security and cost notes
Security. Pixie’s PEM and the infra agent both run privileged with host access — that is inherent to eBPF and host-metric collection, so confine them to the pl/newrelic namespaces and keep the node images patched. Pixie samples request bodies, which can contain PII; enable its built-in data redaction (PL_DATA_ACCESS=Redacted) for regulated workloads so card numbers and tokens are scrubbed in-kernel before they ever leave the node. Keys live only in HashiCorp Vault and are injected as a synced Secret; UI access is through Okta-to-Entra ID SSO with SCIM-driven RBAC, so an engineer who leaves the org loses New Relic access automatically.
Cost. New Relic bills on data ingest and per-user seats, so the levers are lowDataMode, scoping the Prometheus scrape, and APM-instrumenting only the services that truly need code-level traces — let Pixie cover the long tail of services for free of code changes. Pixie’s own telemetry is sampled and short-retention by default; promote only the scripts you actually dashboard. On a 60-node cluster this typically lands an order of magnitude cheaper than per-service APM everywhere, which was the whole point of the eBPF-first design.
Glossary
- New Relic — a SaaS observability platform; you send it metrics, traces, logs, and events and query them with NRQL. Billed on data ingested and per-user seats.
- nri-bundle — the umbrella Helm chart that installs New Relic’s Kubernetes stack: the infrastructure agent, Kubernetes integration, events forwarder, KSM, Prometheus agent, metadata injection, logging, Pixie, and the APM operator.
- Infrastructure agent — the DaemonSet (one pod per node) that collects host, node, pod, and container metrics from the kubelet and cgroups.
- Kubernetes integration — the New Relic component that turns kubelet, KSM, and control-plane data into
K8s*Sampleevents. - kube-state-metrics (KSM) — a standard add-on that exposes the state of Kubernetes objects (Deployments, Pods, …) as metrics; New Relic scrapes it.
- nri-metadata-injection — a mutating webhook that stamps pod/node/namespace metadata onto APM traces so code-level traces link to the right entity.
- APM agent — a language-specific library (Java, .NET, Node, Python, …) loaded into an application to capture distributed traces, transactions, and stack traces from inside the code.
- k8s-agents-operator — New Relic’s operator that auto-injects APM agents via an init container when a pod matches an
Instrumentationcustom resource — no Dockerfile edits. - Pixie — a CNCF, eBPF-based, in-cluster observability tool that captures application request telemetry (HTTP, gRPC, SQL, DNS, …) with no code changes.
- eBPF — a mechanism to load small, verified programs into the running Linux kernel and attach them to hooks (syscalls, TLS functions). Runs at near-native speed and can’t crash the kernel. Pixie’s capture is built from eBPF programs.
- PEM (Pixie Edge Module) — Pixie’s per-node DaemonSet that attaches the eBPF probes and holds captured data in an in-memory columnar store.
- Vizier — Pixie’s in-cluster control plane: the query broker, metadata service, and Kelvin query engine that run PxL scripts across the PEMs.
- Kelvin — Pixie’s distributed query engine; it fans a PxL script out to every PEM and merges the results.
- PxL (Pixie Language) — a Python/Pandas-flavored language for querying Pixie’s in-cluster tables (
http_events,conn_stats, …). - License (ingest) key — the credential agents use to send telemetry to your New Relic account; also the OTLP
api-keyheader. - Pixie deploy key — the credential used to register and deploy Pixie into a cluster.
- User (API) key — the credential for New Relic’s NerdGraph API and the Terraform provider (a CI secret, not a cluster secret).
- OTLP / OpenTelemetry — the vendor-neutral telemetry protocol; New Relic ingests OTLP directly, so OTel-instrumented apps need no New Relic agent.
- NRQL (New Relic Query Language) — the SQL-flavored language for querying New Relic event types (
FROM <eventType> SELECT … WHERE … FACET …). - DPM (data points per minute) — how fast you produce metric data points; combined with cardinality (unique attribute combinations = distinct time series), it drives ingest and therefore cost.
- lowDataMode — a New Relic setting that drops chatty default metrics and trims attributes; the biggest single ingest-reduction lever.
- Golden signals — the four core service-health metrics: latency, traffic, errors, saturation. Pixie gives you these per service with no instrumentation.
- Span — one unit of work in a distributed trace (an HTTP call, a DB query); stored as the
Spanevent type. - Data redaction — scrubbing PII (card numbers, tokens) from captured request bodies before it leaves the node; in Pixie via PxL
px.redact_pii()or a redacted data-access mode.