A payments platform runs forty microservices across three Amazon EKS clusters, and the on-call engineer’s nightmare is the 2 a.m. page that says “checkout latency is up” with no trace to follow — the team has CloudWatch metrics, scattered application logs in three formats, and no single view that connects a slow POST /charge to the downstream ledger pod that is actually GC-thrashing. The mandate from the new VP of Engineering is blunt: one observability backend, full-stack, with distributed traces that cross service boundaries and a live topology map the SRE team can point at during an incident. This guide deploys exactly that — the Dynatrace Operator managing OneAgent for host, process, and deep-code monitoring, alongside an OpenTelemetry Collector that owns vendor-neutral trace/metric/log pipelines — onto EKS, so every span, metric, and log line lands in one Dynatrace tenant and feeds the Smartscape dependency model.
In a nutshell
If you have never touched Dynatrace, start here. Dynatrace is an observability platform — a single place that answers “is my application healthy, and if not, why?” On Kubernetes you do not install it by hand, pod by pod. Instead you install one thing, the Dynatrace Operator, and it does the rest: it rolls out OneAgent (a monitoring agent that runs on every node and automatically watches every process — your Java, Node.js, Go, and .NET apps — with zero code changes), and it pulls Kubernetes events, node metrics, and workload topology straight from the cluster’s API.
The mental model: think of OneAgent as a security-camera system for a building that installs itself in every room the moment the room is built. You do not wire each camera; a single controller (the Operator) notices every new pod and clips a camera onto it automatically. Every camera streams to one control room (your Dynatrace tenant). And in that control room sits Davis AI, Dynatrace’s causal engine — instead of showing you forty blinking alarms when checkout breaks, Davis follows the dependency map, finds the one camera showing the actual fire (say, a GC-thrashing ledger pod), and hands you the root cause instead of the symptoms.
The second half of this lesson adds the OpenTelemetry (OTel) Collector alongside OneAgent. OneAgent is automatic but Dynatrace-specific; OpenTelemetry is a vendor-neutral standard for telemetry your own code emits. Running both means you get breadth for free (OneAgent auto-instruments everything) and control where you want it (OTel for the custom spans and business metrics you deliberately add) — all landing in the same tenant.
Level: Advanced · Time: ~31 min
By the end you’ll be able to:
- Explain what the Dynatrace Operator, OneAgent, ActiveGate, and DynaKube each do, and how they fit together on EKS.
- Pick the right OneAgent deployment mode (
classicFullStack,cloudNativeFullStack,applicationMonitoring, orhostMonitoring) for a given cluster — including EKS Fargate. - Stand up full-stack monitoring plus an OpenTelemetry ingest path through an in-cluster ActiveGate, under GitOps.
- Reason about Host-Unit / consumption licensing so the Dynatrace bill does not surprise you.
- Say precisely when OneAgent’s zero-code auto-instrumentation is enough and when you reach for manual OpenTelemetry.
Prerequisites
- An EKS cluster on Kubernetes 1.28+ with at least three worker nodes (the OneAgent DaemonSet runs one pod per node). Confirm with
kubectl versionandkubectl get nodes. kubectl,helmv3.12+,eksctl, and the AWS CLI v2 installed and authenticated against the target account.- Cluster-admin RBAC on the EKS cluster (the Operator installs CRDs and a privileged DaemonSet).
- A Dynatrace SaaS tenant (e.g.
https://abc12345.live.dynatrace.com) with permission to create access tokens. - HashiCorp Vault reachable from the cluster, used here to hold the Dynatrace API and data-ingest tokens so they never live as plaintext in Git or a bare Kubernetes Secret.
- An OIDC identity provider — Okta federated to Microsoft Entra ID — already wired to Dynatrace for SSO, so engineers log into the Dynatrace UI with corporate credentials and SCIM-provisioned groups, not local Dynatrace users.
gitand access to the GitOps repo that Argo CD reconciles, plus a GitHub Actions runner with OIDC trust to AWS (no long-lived keys).
Target topology
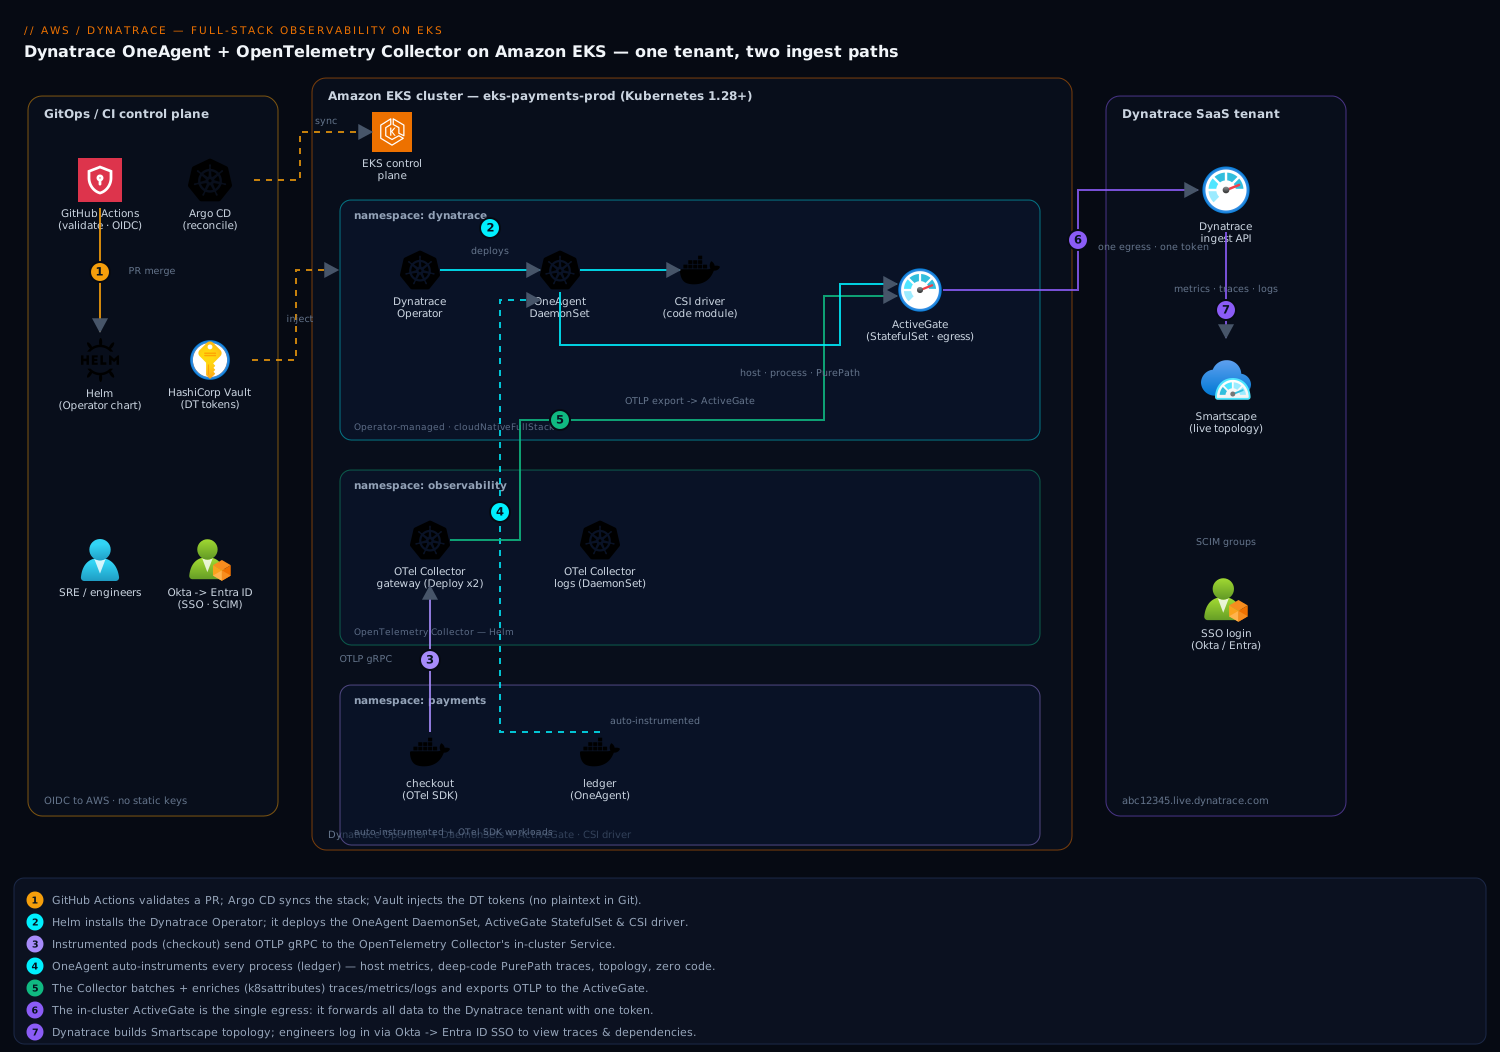
The data plane has two complementary ingest paths into the same Dynatrace tenant. OneAgent, deployed by the Operator as a node-level DaemonSet plus an ActiveGate StatefulSet, auto-instruments every process on every node — JVMs, Node.js, Go binaries, the kubelet — and streams host metrics, deep-code traces (PurePath), and process topology that builds Smartscape with zero code changes. In parallel, the OpenTelemetry Collector (deployed as both a per-node DaemonSet for logs/host metrics and a gateway Deployment for trace aggregation) receives OTLP from services that emit their own spans and metrics via OTel SDKs, batches and enriches them, then exports over OTLP to the same tenant through the ActiveGate. Application pods talk OTLP to the Collector’s ClusterIP Service; the Collector and OneAgent both egress to Dynatrace through the in-cluster ActiveGate, so only one component holds an outbound path and the data-ingest token. Vault injects tokens at pod start; Argo CD reconciles the whole stack from Git.
How the pieces fit together
The topology above has four Dynatrace-side moving parts. Before the hands-on, here is what each one is and why it exists — this is the mental model that makes every later step obvious.
The Dynatrace Operator is a Kubernetes controller (a pod running the controller pattern) that you install once per cluster. It watches a single custom resource — the DynaKube — and makes the cluster match it. If the DynaKube says “full-stack OneAgent plus a routing ActiveGate,” the Operator creates the OneAgent DaemonSet, the ActiveGate StatefulSet, the mutating webhook, and the RBAC to run them. It is the same reconcile-loop idea as any operator (see Kubernetes CRDs, Operators & the Controller Pattern), applied to observability.
The DynaKube custom resource is your single declarative knob. One YAML object names the tenant, the token Secret, the OneAgent mode, and the ActiveGate capabilities. Everything the Operator builds flows from it, which is why it belongs in Git under Argo CD — change the DynaKube, and the cluster’s entire monitoring posture changes through a reviewed pull request.
OneAgent is the data collector that does the actual watching. In full-stack modes it runs as a DaemonSet — exactly one pod per node — and does two jobs: it reports host-level signals (CPU, memory, disk, network, every process) and it auto-injects a small library, the code module, into your application containers so their requests become distributed traces. Dynatrace calls a full end-to-end trace a PurePath. No SDK, no code change, no redeploy of your app to add instrumentation.
ActiveGate is a smart proxy that sits between the cluster and the Dynatrace tenant. Give it the routing capability and every OneAgent and OTel Collector egresses through it instead of each opening its own connection to the internet — one hop, one place the ingest token lives. Give it the kubernetes-monitoring capability and it also connects to the Kubernetes API server to pull cluster events, node and pod metrics, and workload topology (this is how the Dynatrace Kubernetes app knows your namespaces and deployments exist).
The four OneAgent modes — pick one
The single most important decision in the DynaKube is which key you set under spec.oneAgent. It selects the deployment mode, and the wrong choice is the most common beginner mistake on EKS.
| Mode | Host DaemonSet? | App code injection | CSI driver | Best for |
|---|---|---|---|---|
classicFullStack |
Yes | Yes, via the host OneAgent | Optional | Traditional VMs/nodes; simplest full-stack; each pod loads its own copy of the code module |
cloudNativeFullStack |
Yes | Yes, via webhook + CSI | Required | The recommended default on EKS — full host + app monitoring, code module stored once per node and shared read-only |
applicationMonitoring |
No | Yes, via webhook | Optional | App-only deep monitoring with no privileged host DaemonSet — the mode for EKS Fargate, or restrictive platforms |
hostMonitoring |
Yes | No | No | Infrastructure metrics only (host CPU/mem/disk), no distributed tracing |
The mental shortcut: full-stack modes give you host metrics and traces; applicationMonitoring gives you traces only (lighter, no DaemonSet); hostMonitoring gives you host metrics only. cloudNativeFullStack is classicFullStack plus the CSI driver, which stores the code module once per node instead of copying it into every pod — that memory saving is why it is the EKS default and why step 3 sets csidriver.enabled=true.
Where OpenTelemetry fits. OneAgent is automatic but proprietary. The OpenTelemetry Collector you deploy in steps 5–7 handles the telemetry your teams emit deliberately through OTel SDKs — custom business spans, RED metrics, structured logs — in a vendor-neutral format. Both paths converge in the same tenant and reconcile because both stamp the same k8s.pod.name resource attribute. You are not choosing OneAgent or OTel; you are using OneAgent for breadth and OTel for the spans only your code knows how to draw.
EKS specifics up front. Three things about EKS shape the choices below: (1) Fargate has no DaemonSets, so Fargate-only workloads must use applicationMonitoring; (2) the CSI driver needs writable node storage, which works on Amazon Linux 2/2023 and Bottlerocket but has to be configured on more hardened AMIs; and (3) if you want Dynatrace to pull CloudWatch metrics for AWS services (RDS, ELB) the ActiveGate should assume an IAM role via IRSA rather than carry static AWS keys — covered in “Going deeper.”
1. Create the Dynatrace access tokens
Dynatrace separates the operator/API token (used by the Operator to query the deployment API and pull OneAgent images) from the data-ingest token (used to push metrics/traces/logs). Create both with least-privilege scopes. You can do this in the UI under Access Tokens, or via the API:
DT_TENANT="https://abc12345.live.dynatrace.com"
DT_PAT="dt0c01.SEED.BOOTSTRAP_PAT_WITH_TOKEN_SCOPES"   # a one-time PAT to mint the others

# API/operator token: deployment + cluster ACL scopes
curl -sX POST "$DT_TENANT/api/v2/apiTokens" \
  -H "Authorization: Api-Token $DT_PAT" -H "Content-Type: application/json" \
  -d '{"name":"eks-operator","scopes":[
        "activeGateTokenManagement.create","entities.read","settings.read",
        "settings.write","DataExport","InstallerDownload"]}'

# Data-ingest token: metrics, logs, OpenTelemetry traces
curl -sX POST "$DT_TENANT/api/v2/apiTokens" \
  -H "Authorization: Api-Token $DT_PAT" -H "Content-Type: application/json" \
  -d '{"name":"eks-data-ingest","scopes":[
        "metrics.ingest","logs.ingest","openTelemetryTrace.ingest","events.ingest"]}'
2. Store the tokens in HashiCorp Vault
Do not paste tokens into a manifest. Write them into Vault and let the Vault Agent (or the Vault Secrets Operator) materialize them as a Kubernetes Secret at deploy time, so the token rotates centrally and never appears in Git or argocd history.
vault kv put secret/dynatrace/eks-prod \
  apiToken="dt0c01.OPERATOR_TOKEN_FROM_STEP_1" \
  dataIngestToken="dt0c01.DATA_INGEST_TOKEN_FROM_STEP_1"
Bind a Kubernetes auth role so only the dynatrace namespace service accounts can read it:
vault write auth/kubernetes/role/dynatrace \
  bound_service_account_names=dynatrace-operator,dynakube-oneagent \
  bound_service_account_namespaces=dynatrace \
  policies=dynatrace-read ttl=1h
The Vault Secrets Operator then syncs secret/dynatrace/eks-prod into a Secret named dynakube in the dynatrace namespace — the exact name the DynaKube custom resource expects in step 4.
3. Install the Dynatrace Operator with Helm
Add the chart repo and install into a dedicated dynatrace namespace. The Operator brings the DynaKube and EdgeConnect CRDs and a webhook that injects OneAgent into application pods.
helm repo add dynatrace https://raw.githubusercontent.com/Dynatrace/dynatrace-operator/main/config/helm/repos/stable
helm repo update

kubectl create namespace dynatrace

helm upgrade --install dynatrace-operator dynatrace/dynatrace-operator \
  --namespace dynatrace \
  --set "installCRD=true" \
  --set "csidriver.enabled=true" \
  --atomic
csidriver.enabled=true installs the CSI driver that lets OneAgent run in cloudNativeFullStack mode with a shared read-only code module per node, instead of a separate copy per pod — this is the recommended mode on EKS for memory efficiency. Confirm the Operator is healthy:
kubectl -n dynatrace rollout status deploy/dynatrace-operator
kubectl -n dynatrace get pods   # expect operator, webhook, and csi-driver pods Running
4. Apply the DynaKube custom resource
The DynaKube CR is the single declarative object that tells the Operator what to deploy: the tenant URL, the Secret holding the tokens, the OneAgent mode, and the ActiveGate role set. Save this as dynakube.yaml in the GitOps repo so Argo CD owns it.
apiVersion: dynatrace.com/v1beta3
kind: DynaKube
metadata:
  name: dynakube
  namespace: dynatrace
spec:
  apiUrl: https://abc12345.live.dynatrace.com/api
  # references the Secret synced from Vault in step 2
  tokens: dynakube
  oneAgent:
    cloudNativeFullStack:
      tolerations:
        - effect: NoSchedule
          key: node-role.kubernetes.io/control-plane
          operator: Exists
      args:
        - --set-host-group=eks-payments-prod
  activeGate:
    capabilities:
      - routing            # in-cluster egress proxy to the tenant
      - kubernetes-monitoring
      - dynatrace-api
    resources:
      requests: { cpu: 500m, memory: 512Mi }
      limits:   { cpu: "1",  memory: 1.5Gi }
Apply it (or let Argo CD sync it — see step 8):
kubectl apply -f dynakube.yaml
kubectl -n dynatrace get dynakube dynakube -o jsonpath='{.status.phase}'   # -> Running
kubectl -n dynatrace get daemonset    # oneagent DaemonSet, one pod per node
kubectl -n dynatrace get statefulset  # activegate
The --set-host-group=eks-payments-prod flag tags every host so Smartscape and management-zone rules can scope this cluster cleanly. The kubernetes-monitoring ActiveGate capability pulls cluster events, node/pod metrics, and workload topology straight from the Kubernetes API.
5. Deploy the OpenTelemetry Collector
OneAgent covers auto-instrumentation; the Collector covers everything you instrument yourself with OTel SDKs and any third-party OTLP source. Install it with the official Helm chart in deployment mode for the trace gateway. Create otel-values.yaml:
mode: deployment
replicaCount: 2
image:
  repository: otel/opentelemetry-collector-contrib
presets:
  kubernetesAttributes:
    enabled: true        # stamps k8s.pod.name, k8s.namespace.name, etc.
config:
  receivers:
    otlp:
      protocols:
        grpc: { endpoint: 0.0.0.0:4317 }
        http: { endpoint: 0.0.0.0:4318 }
  processors:
    batch:
      send_batch_size: 1000
      timeout: 5s
    memory_limiter:
      check_interval: 2s
      limit_percentage: 80
      spike_limit_percentage: 20
    k8sattributes: {}
  exporters:
    otlphttp/dynatrace:
      # route through the in-cluster ActiveGate, not the public tenant
      endpoint: https://dynakube-activegate.dynatrace.svc.cluster.local:443/e/abc12345/api/v2/otlp
      headers:
        Authorization: "Api-Token ${env:DT_INGEST_TOKEN}"
      tls:
        insecure_skip_verify: true   # ActiveGate uses its self-signed internal cert
  service:
    pipelines:
      traces:
        receivers: [otlp]
        processors: [memory_limiter, k8sattributes, batch]
        exporters: [otlphttp/dynatrace]
      metrics:
        receivers: [otlp]
        processors: [memory_limiter, k8sattributes, batch]
        exporters: [otlphttp/dynatrace]
      logs:
        receivers: [otlp]
        processors: [memory_limiter, k8sattributes, batch]
        exporters: [otlphttp/dynatrace]
The DT_INGEST_TOKEN env var is injected from the same Vault-synced Secret, so the Collector never carries a hardcoded token:
helm repo add open-telemetry https://open-telemetry.github.io/opentelemetry-helm-charts
helm repo update

helm upgrade --install otel-collector open-telemetry/opentelemetry-collector \
  --namespace observability --create-namespace \
  -f otel-values.yaml \
  --set-string "extraEnvs[0].name=DT_INGEST_TOKEN" \
  --set-string "extraEnvs[0].valueFrom.secretKeyRef.name=dynakube" \
  --set-string "extraEnvs[0].valueFrom.secretKeyRef.key=dataIngestToken" \
  --atomic
6. Point application services at the Collector
Instrumented services send OTLP to the Collector’s in-cluster Service. Set the standard OTel environment variables on each workload — here on the checkout deployment:
kubectl -n payments set env deployment/checkout \
  OTEL_EXPORTER_OTLP_ENDPOINT="http://otel-collector-opentelemetry-collector.observability.svc.cluster.local:4317" \
  OTEL_EXPORTER_OTLP_PROTOCOL="grpc" \
  OTEL_SERVICE_NAME="checkout" \
  OTEL_RESOURCE_ATTRIBUTES="service.namespace=payments,deployment.environment=prod"
Services that have no SDK at all are still covered automatically: the OneAgent code module injected by the Operator’s webhook produces PurePath traces for them without any config. The two streams reconcile in Dynatrace because both carry the same k8s.pod.name resource attribute — OneAgent stamps it natively, and the Collector’s k8sattributes processor adds it to SDK spans.
7. Add log collection (optional but recommended)
For application logs, run a second Collector instance as a DaemonSet tailing container log files, so stdout/stderr from every pod reaches Dynatrace with full Kubernetes context. Create otel-logs-values.yaml:
mode: daemonset
presets:
  logsCollection:
    enabled: true
    includeCollectorLogs: false
  kubernetesAttributes:
    enabled: true
config:
  exporters:
    otlphttp/dynatrace:
      endpoint: https://dynakube-activegate.dynatrace.svc.cluster.local:443/e/abc12345/api/v2/otlp
      headers:
        Authorization: "Api-Token ${env:DT_INGEST_TOKEN}"
      tls:
        insecure_skip_verify: true
  service:
    pipelines:
      logs:
        receivers: [filelog]
        processors: [k8sattributes, batch]
        exporters: [otlphttp/dynatrace]
helm upgrade --install otel-logs open-telemetry/opentelemetry-collector \
  --namespace observability \
  -f otel-logs-values.yaml \
  --set-string "extraEnvs[0].name=DT_INGEST_TOKEN" \
  --set-string "extraEnvs[0].valueFrom.secretKeyRef.name=dynakube" \
  --set-string "extraEnvs[0].valueFrom.secretKeyRef.key=dataIngestToken" \
  --atomic
8. Put it under GitOps with Argo CD
Everything above should be declarative and reconciled, not applied by hand in production. Commit dynakube.yaml and the Helm value files, then define an Argo CD Application that points at the repo. The Operator chart and DynaKube live together so Argo CD enforces drift correction.
apiVersion: argoproj.io/v1alpha1
kind: Application
metadata:
  name: dynatrace-observability
  namespace: argocd
spec:
  project: platform
  source:
    repoURL: https://github.com/kloudvin/eks-observability.git
    targetRevision: main
    path: clusters/eks-payments-prod/dynatrace
  destination:
    server: https://kubernetes.default.svc
    namespace: dynatrace
  syncPolicy:
    automated: { prune: true, selfHeal: true }
    syncOptions: [CreateNamespace=true]
The promotion flow is: a pull request changes a value file, GitHub Actions validates it (helm template + kubeconform + a policy check), and on merge Argo CD auto-syncs to the cluster. The Actions runner assumes an AWS role via OIDC, so there are no static AWS credentials in CI. If you prefer Jenkins or Terraform/Ansible for the surrounding cluster lifecycle, the same DynaKube manifest applies unchanged — the Operator is the contract.
Validation
Confirm the full stack is live end to end:
# 1. OneAgent injected and reporting
kubectl -n dynatrace get pods -l app.kubernetes.io/name=oneagent -o wide
kubectl -n dynatrace logs ds/dynakube-oneagent | grep -i "connected to"

# 2. ActiveGate reachable as the egress proxy
kubectl -n dynatrace get svc dynakube-activegate

# 3. Collector pipelines healthy (check the internal metrics endpoint)
kubectl -n observability port-forward deploy/otel-collector-opentelemetry-collector 8888:8888 &
curl -s localhost:8888/metrics | grep otelcol_exporter_sent_spans
# otelcol_exporter_sent_spans{exporter="otlphttp/dynatrace"} > 0 means traces are flowing
Then in the Dynatrace UI (logged in via Okta/Entra SSO): open Kubernetes and confirm the eks-payments-prod cluster with its nodes and namespaces; open Distributed traces and trigger a checkout request — you should see a PurePath that crosses checkout → ledger; open Smartscape and verify the live service-to-service topology. The acceptance test is a single trace showing both an OneAgent-captured span and an SDK span on the same PurePath.
Rollback and teardown
Because the stack is declarative, removal is clean and ordered — tear down the data producers before the Operator that owns the CRDs:
# 1. Stop sending new data
helm uninstall otel-logs       -n observability
helm uninstall otel-collector  -n observability

# 2. Remove the DynaKube CR (Operator deletes OneAgent DaemonSet + ActiveGate)
kubectl delete -f dynakube.yaml
kubectl -n dynatrace wait --for=delete daemonset/dynakube-oneagent --timeout=120s

# 3. Remove the Operator and its CRDs last
helm uninstall dynatrace-operator -n dynatrace
kubectl delete namespace dynatrace observability
If you manage this via Argo CD, disable auto-sync first (argocd app set dynatrace-observability --sync-policy none) or revert the Git commit so self-heal does not immediately re-create what you just deleted. To roll back a bad config rather than remove everything, helm rollback otel-collector or git revert the offending PR and let Argo CD reconcile.
Common pitfalls
- Skipping the CSI driver. Without
csidriver.enabled=true,cloudNativeFullStackfalls back to copying the code module into every pod, inflating memory and slowing pod start. Install the CSI driver on EKS. - OTLP exporter bypassing the ActiveGate. Exporting directly to
*.live.dynatrace.comworks but puts the data-ingest token on every Collector egress and adds a public hop per pod. Route through the in-cluster ActiveGate endpoint as shown — one egress point, one token surface. - Missing
k8sattributesprocessor. Without it, SDK spans lackk8s.pod.name, so Dynatrace cannot correlate them with OneAgent data and the Smartscape topology looks broken. Always include thekubernetesAttributespreset. - Webhook race on first install. If application pods start before the Operator webhook is ready, they launch un-instrumented. Roll the affected deployments (
kubectl rollout restart) after the Operator isRunning. - TLS verification failures to the ActiveGate. The in-cluster ActiveGate presents a self-signed cert; either trust its CA or set
insecure_skip_verify: trueon the internal hop (acceptable because it stays inside the cluster network). - Tolerations omitted. If you want host metrics from control-plane or tainted nodes, the OneAgent tolerations in the DynaKube must match the taints, or those nodes silently go unmonitored.
Security notes
Tokens are the crown jewels here: keep the operator and data-ingest tokens separate and least-scoped (step 1), source them from HashiCorp Vault with a short TTL and Kubernetes-auth binding rather than committing them, and never embed them in Helm values in Git. Human access to the Dynatrace tenant flows through Okta federated to Entra ID with SCIM-provisioned groups mapped to Dynatrace management zones, so an engineer who leaves loses access on de-provisioning, not on a manual cleanup. For runtime threat detection on the same EKS nodes, CrowdStrike Falcon sensors run alongside OneAgent — Falcon watches for malicious process behavior while OneAgent watches performance; they are complementary, not redundant. Pair this with Wiz (and Wiz Code in the pipeline) for cloud-posture and IaC scanning so a misconfigured ActiveGate Service or an over-scoped token is flagged before it ships. Restrict the Collector’s OTLP receiver to in-cluster traffic with a NetworkPolicy so nothing outside the mesh can inject spans.
Cost notes
Dynatrace bills primarily on Host Units (driven by per-node OneAgent memory) and Davis Data Units / ingest volume for metrics, logs, and traces. Three levers keep the bill predictable: set OneAgent host groups (step 4) so you can scope monitoring modes and even disable deep monitoring on low-value batch nodes; use the OTel Collector’s tail_sampling or probabilistic_sampler processor to drop a percentage of high-volume, low-signal traces before they are billed; and apply log-ingest processing rules in the Collector to filter chatty DEBUG lines rather than paying to store them. Because the Collector sits in the path, sampling and filtering are a config change in Git, reviewed and rolled out through Argo CD — not a vendor support ticket. Right-size the ActiveGate (the requests/limits in step 4) to the cluster’s egress volume; one or two replicas handle a forty-service cluster comfortably.
Going deeper
How auto-injection actually works (the webhook + code module)
When you install the Operator, it registers a mutating admission webhook. From then on, every time the API server is about to create a pod in a monitored namespace, it calls the webhook, which rewrites the pod spec before it is scheduled. In cloudNativeFullStack and applicationMonitoring modes the webhook adds an init container and a volume: the init container places (or, with the CSI driver, bind-mounts) the OneAgent code module into the container filesystem, and the webhook sets environment variables — notably LD_PRELOAD for native/JVM processes — so that when your application process starts, it loads the OneAgent library first. That library hooks the runtime (the JVM’s bytecode, the Node.js event loop, the .NET CLR) and begins emitting PurePath spans. This is why there is no manual instrumentation: the injection happens at pod admission, the attach happens at process start, and your source code never mentions Dynatrace.
You control the blast radius with the namespace selector on the DynaKube (or by opting a namespace out with the label dynatrace.com/inject: "false"). A pod that was already running when the webhook came up is not retroactively injected — the webhook only fires on creation — which is exactly why the “webhook race” pitfall tells you to kubectl rollout restart after the Operator is Running.
# restrict auto-injection to specific namespaces
spec:
  oneAgent:
    cloudNativeFullStack:
      namespaceSelector:
        matchLabels:
          dynatrace-inject: "true"
cloudNativeFullStack vs applicationMonitoring — the real tradeoff
Both inject the code module via the webhook, so both give you PurePath traces. The difference is the host DaemonSet:
cloudNativeFullStackalso runs the node-level OneAgent, so you get host CPU/memory/disk/network, per-process metrics, log collection from the node, and the deep infrastructure layer of Smartscape. It bills as full-stack (host units scale with node RAM).applicationMonitoringskips the DaemonSet entirely. You get application/service traces and service-level metrics, but no host signals from OneAgent — infrastructure visibility then comes only from the ActiveGate’s Kubernetes API monitoring. It is dramatically lighter (no privileged DaemonSet, no full-stack host units) and is the only option on Fargate.
The decision rule: if you own the nodes and want infrastructure root-cause (noisy-neighbour CPU, disk-full, kernel), use cloudNativeFullStack. If you run serverless nodes (Fargate), or a security policy forbids privileged host DaemonSets, or you only care about application performance and want to minimise spend, use applicationMonitoring.
# applicationMonitoring — the EKS Fargate / no-DaemonSet choice
spec:
  apiUrl: https://abc12345.live.dynatrace.com/api
  tokens: dynakube
  oneAgent:
    applicationMonitoring:
      useCSIDriver: true   # cache code modules on writable ephemeral storage
ActiveGate: one egress, plus the Kubernetes API monitor
The ActiveGate earns its keep two ways. As a routing proxy it collapses N agent egress connections into one — important on EKS where a per-pod egress to the public internet multiplies NAT-gateway cost and security-group surface. As the kubernetes-monitoring worker it authenticates to the API server with the ActiveGate service account and scrapes cluster state on an interval: events, workload status, node conditions, and resource metrics. That is the data feeding the Dynatrace Kubernetes app — without this capability you would see traces but no cluster/namespace/workload view. On a large cluster you scale ActiveGate replicas horizontally; one or two handle a forty-service cluster, but a thousand-pod cluster pushing heavy OTLP through the routing path wants more, right-sized against the requests/limits from step 4.
Davis AI and Smartscape — why one root cause, not forty alarms
Smartscape is the topology model OneAgent builds continuously: a vertical stack (applications → services → processes → hosts → cloud) and the horizontal call relationships between services. It is a live dependency graph, not a static diagram. Davis AI is the causal engine that runs on top of it. When metrics deviate from their automatically-learned baselines, Davis does not just fire an alert per metric — it walks the Smartscape graph, correlates the anomalies in time and topology, and collapses them into a single Problem with an identified root cause and the dependent services it impacts. That is the difference between “checkout latency up, ledger CPU up, ledger GC up, DB connections up” as four pages and “root cause: ledger pod GC-thrashing; impact: checkout” as one. Davis is deterministic and causal (it reasons over the dependency graph) rather than purely statistical, which is why the k8sattributes correlation and host groups you set earlier matter — they give Davis a clean topology to reason over.
OpenTelemetry ingest, and running the Collector next to OneAgent
Dynatrace ingests OTLP directly at /api/v2/otlp (OTLP/HTTP), which is why the Collector’s exporter is otlphttp/dynatrace pointed at the ActiveGate. Two design notes for production: put a memory_limiter processor first so a telemetry spike cannot OOM the Collector, and put batch last so you ship efficiently. For cost control at the source, add tail-based sampling on the gateway Collector so you keep the interesting traces (errors, slow) and drop the boring ones before they are billed:
processors:
  tail_sampling:
    decision_wait: 10s
    policies:
      - name: keep-errors
        type: status_code
        status_code: { status_codes: [ERROR] }
      - name: keep-slow
        type: latency
        latency: { threshold_ms: 500 }
      - name: sample-the-rest
        type: probabilistic
        probabilistic: { sampling_percentage: 10 }
Because OneAgent already traces everything automatically, a common pattern is to run OTel only for what OneAgent cannot see — custom business spans (“coupon applied,” “fraud-check score”), third-party OTLP sources, and browser/RUM beacons — and let OneAgent own the infrastructure and code-level PurePaths. They stitch together in the same tenant via shared resource attributes.
Querying with DQL and building dashboards
The modern Dynatrace platform stores data in Grail and queries it with DQL (Dynatrace Query Language), a pipe-based language that will feel familiar if you have used other log query languages. Dashboards and Notebooks are built on DQL tiles. A couple of examples you would actually run after this deploy:
// error logs from the payments namespace, most recent first
fetch logs
| filter k8s.namespace.name == "payments" and loglevel == "ERROR"
| sort timestamp desc
| limit 100

// span count per service for the checkout flow, last hour
fetch spans
| filter k8s.namespace.name == "payments"
| summarize spans = count(), by:{ service.name }
| sort spans desc
Classic metric selectors (builtin:host.cpu.usage, builtin:kubernetes.pods) still work through the Metrics API for alerting and the older dashboards; DQL is where the newer Grail-backed analysis lives.
Licensing: Host Units, DDUs, and consumption
Two pricing models exist and it is worth knowing which you are on. In the classic model, full-stack monitoring is billed in Host Units — one Host Unit covers 16 GiB of host RAM, so an m5.2xlarge (32 GiB) node consumes 2 Host Units of full-stack, and a fleet of them adds up fast; metric/log/event ingestion is metered in Davis Data Units (DDUs). In the newer Dynatrace Platform Subscription (DPS), everything is consumption-based per capability — full-stack and infrastructure monitoring per GiB-hour of memory, Kubernetes monitoring per pod-hour, logs and traces per GiB ingested and queried in Grail. The practical levers are the same either way: use applicationMonitoring (no host-unit-heavy DaemonSet) where you do not need host metrics, set host groups so you can disable deep monitoring on low-value batch nodes, and sample/filter in the Collector so you are not paying to store DEBUG chatter. The subtle trap is that turning on cloudNativeFullStack across a large autoscaling node group can multiply host-unit consumption the moment Karpenter scales out — model the cost against your peak node count, not your average.
EKS, IRSA, and the two tokens
On EKS you almost never want static AWS keys in the cluster. IRSA (IAM Roles for Service Accounts) lets a pod assume an IAM role through the cluster’s OIDC provider by annotating its service account. For Dynatrace, the case that matters is the ActiveGate monitoring AWS supporting services (RDS, ELB, SQS) via CloudWatch — grant it a read-only role through IRSA instead of an access key:
# annotate the ActiveGate service account for CloudWatch read via IRSA
apiVersion: v1
kind: ServiceAccount
metadata:
  name: dynatrace-activegate
  namespace: dynatrace
  annotations:
    eks.amazonaws.com/role-arn: arn:aws:iam::111122223333:role/dynatrace-cloudwatch-read
Keep this separate in your head from the two Dynatrace tokens (step 1): the operator/API token lets the Operator talk to the Dynatrace deployment API and pull OneAgent images; the data-ingest token lets OneAgent, the ActiveGate, and the Collector push metrics/traces/logs. IRSA is AWS-side authorization; the Dynatrace tokens are Dynatrace-side authorization; they solve different problems and both should be least-scoped. If you are new to IRSA and where it is heading, see EKS: from IRSA to Pod Identity.
Full-auto (OneAgent) vs OTel-manual — when to reach for which
| Dimension | OneAgent (full-auto) | OpenTelemetry (manual) |
|---|---|---|
| Setup effort | Install Operator; zero app changes | Add and maintain SDKs, config per service |
| Coverage | Every supported runtime, automatically | Only what you instrument |
| Portability | Dynatrace-specific | Vendor-neutral; swap backends |
| Control | Opinionated, captures broadly | You choose spans, attributes, sampling |
| Custom business spans | Limited | First-class |
| Licensing | Host units / full-stack consumption | Ingest volume only |
| Best when | You want breadth fast, own the infra | You want portability and precise, custom telemetry |
The honest answer for most platform teams is “both,” which is exactly what this lesson builds: OneAgent for the automatic 80% (infra + code-level PurePaths), OpenTelemetry for the deliberate 20% (business spans, portable pipelines, non-Dynatrace consumers). Contrast this with a fully OTel-native, vendor-neutral stack like SigNoz on Kubernetes or an agent-based competitor like the Datadog Agent and Cluster Agent — same telemetry problem, different points on the automatic-versus-portable spectrum.
Common beginner mistakes
- “I’ll just pick
classicFullStack, it sounds the most complete.” On EKS the right default iscloudNativeFullStack, because the CSI driver stores the code module once per node instead of copying it into every pod. PickingclassicFullStack(or forgettingcsidriver.enabled=true) inflates per-pod memory and slows pod start. And on Fargate, any full-stack mode simply cannot run — there are no DaemonSets — so the correct choice isapplicationMonitoring. The mode is not cosmetic; it decides what you can see and what you pay. - “The ActiveGate is optional, it’s just a proxy.” Skip it and two things break: every agent opens its own egress to the public tenant (more NAT cost, more token surface), and — because the
kubernetes-monitoringcapability lives on the ActiveGate — you lose the entire Kubernetes cluster/namespace/workload view. You would have traces but no cluster map. The ActiveGate is load-bearing, not a nicety. - “Full-stack on every node, of course — more monitoring is better.” Full-stack bills in host units (16 GiB RAM each). Turning
cloudNativeFullStackon across a large, autoscaling node group can multiply the bill the instant Karpenter scales out. The fix is intent: full-stack where you need infrastructure root-cause,applicationMonitoringor host groups with deep monitoring disabled on low-value batch nodes. Model cost against peak node count. - “One token for everything is simpler.” The operator/API token and the data-ingest token exist on purpose and carry different scopes. A single over-scoped token means a leaked ingest credential can also manage your tenant. Keep them separate and least-scoped (step 1), and source them from Vault, not a committed manifest.
- “Now I need to add the Dynatrace SDK to my services.” No — that is the whole point of OneAgent. The webhook injects the code module and the process auto-attaches at start, so PurePath traces appear with zero code change. You add OpenTelemetry SDKs only for custom spans OneAgent cannot know about (business events, third-party OTLP) — not to get basic tracing working.
- “Traces aren’t showing, the agent must be broken.” More often the pod started before the webhook was ready and launched un-injected. Auto-injection only happens at pod creation;
kubectl rollout restartthe workload after the Operator is Running.
Practice challenges
Work these in order; each has a solution you can expand. They assume the stack from steps 1–8.
1. (Beginner) Read the DynaKube status. Without opening the Dynatrace UI, confirm from the CLI that the DynaKube is healthy and find how many OneAgent pods are running.
<details> <summary>Solution</summary>
kubectl -n dynatrace get dynakube dynakube -o jsonpath='{.status.phase}'   # -> Running
kubectl -n dynatrace get daemonset dynakube-oneagent
phase: Running means the Operator reconciled successfully; the DaemonSet’s DESIRED count equals your node count (one OneAgent per node).
</details>
2. (Beginner) Choose the mode. For each cluster, name the correct OneAgent mode: (a) a standard EKS managed node group where you want host and app monitoring; (b) an EKS Fargate-only profile; © a node group where you only want CPU/memory/disk and no tracing.
<details> <summary>Solution</summary>
(a) cloudNativeFullStack — full-stack with the CSI driver, the EKS default. (b) applicationMonitoring — Fargate has no DaemonSets, so host modes are impossible; app injection via the webhook still works. © hostMonitoring — infrastructure metrics only, no code injection.
</details>
3. (Intermediate) Restrict injection to one namespace. Change the DynaKube so OneAgent only auto-injects into namespaces labelled dynatrace-inject=true, then label the payments namespace.
<details> <summary>Solution</summary>
spec:
  oneAgent:
    cloudNativeFullStack:
      namespaceSelector:
        matchLabels:
          dynatrace-inject: "true"
kubectl label namespace payments dynatrace-inject=true
kubectl -n payments rollout restart deploy   # re-create pods so the webhook injects them
The rollout restart matters — existing pods are not retroactively injected. </details>
4. (Intermediate) Sample traces to cut ingest. Add a processor to the gateway Collector that keeps all error and slow (>500 ms) traces but samples the rest at 10%. Where in the pipeline must it sit, and why can it not run on the per-node DaemonSet?
<details> <summary>Solution</summary>
Add a tail_sampling processor and reference it in the traces pipeline after k8sattributes and before batch:
processors:
  tail_sampling:
    decision_wait: 10s
    policies:
      - name: keep-errors
        type: status_code
        status_code: { status_codes: [ERROR] }
      - name: keep-slow
        type: latency
        latency: { threshold_ms: 500 }
      - name: sample-rest
        type: probabilistic
        probabilistic: { sampling_percentage: 10 }
Pipeline: processors: [memory_limiter, k8sattributes, tail_sampling, batch]. Tail sampling has to buffer the whole trace to make a keep/drop decision, so it must run on the aggregating gateway (where all spans of a trace converge), not the per-node DaemonSet (which only sees the spans from its own node).
</details>
5. (Advanced) Estimate the licensing. Your prod node group is 6 × m5.2xlarge (32 GiB each) at steady state, autoscaling to 12 at peak, all cloudNativeFullStack. How many Host Units at steady state and at peak, and what one change halves the app-tier spend if you do not need host metrics on the batch nodes?
<details> <summary>Solution</summary>
One Host Unit = 16 GiB, so each 32 GiB node = 2 HU. Steady state 6 × 2 = 12 HU; peak 12 × 2 = 24 HU — and you are billed against the peak when the group scales out. Moving the batch nodes to applicationMonitoring (or a separate DynaKube / host group with deep monitoring off) removes their full-stack host-unit consumption while keeping application traces, roughly halving that tier if the batch nodes are about half the fleet.
</details>
6. (Advanced) Prove the two streams reconcile. Explain, and verify with one attribute, why an SDK span from the OTel Collector and a OneAgent PurePath end up on the same service in Smartscape.
<details> <summary>Solution</summary>
Both carry the same k8s.pod.name (plus namespace/workload) resource attribute — OneAgent stamps it natively; the Collector’s k8sattributes processor adds it to SDK spans. Dynatrace correlates on that shared entity. Verify the Collector side is enriching:
kubectl -n observability port-forward deploy/otel-collector-opentelemetry-collector 8888:8888 &
curl -s localhost:8888/metrics | grep otelcol_processor
If the k8sattributes processor is not enriching, the streams will not merge and Smartscape looks fragmented — the classic “missing k8sattributes” symptom from the pitfalls list.
</details>
Glossary
- Dynatrace Operator — the Kubernetes controller you install once; it watches the DynaKube CR and deploys/reconciles OneAgent, ActiveGate, the webhook, and RBAC.
- DynaKube — the custom resource that declares your entire Dynatrace setup for a cluster (tenant URL, token Secret, OneAgent mode, ActiveGate capabilities). One object, GitOps-friendly.
- OneAgent — Dynatrace’s monitoring agent. In full-stack modes it runs as a per-node DaemonSet and auto-injects a code module into app containers for zero-code tracing.
- Code module — the small OneAgent library injected into an application container; the process loads it at start (via
LD_PRELOAD) and it emits traces automatically. - PurePath — Dynatrace’s name for a complete distributed trace, end to end across services, captured by OneAgent without manual instrumentation.
- Deployment mode — which key under
spec.oneAgentyou set:classicFullStack,cloudNativeFullStack,applicationMonitoring, orhostMonitoring. Decides what is monitored and how it is billed. - ActiveGate — a proxy/worker between cluster and tenant.
routing= single egress for all agents;kubernetes-monitoring= scrapes the Kubernetes API for cluster/workload topology. - CSI driver — the Container Storage Interface component the Operator installs so
cloudNativeFullStackstores the code module once per node (shared, read-only) instead of per pod. - Mutating webhook — the admission webhook the Operator registers; it rewrites new pods to add the OneAgent init container and injection env vars at creation time.
- Smartscape — Dynatrace’s live topological dependency map (applications → services → processes → hosts) built automatically from OneAgent data.
- Davis AI — Dynatrace’s causal AI engine; it reasons over Smartscape to collapse many correlated anomalies into a single Problem with a root cause.
- OpenTelemetry (OTel) — the vendor-neutral CNCF standard for traces, metrics, and logs; the OTLP protocol and the Collector are its ingest path here.
- OTel Collector — a configurable pipeline (receivers → processors → exporters) that receives OTLP from your SDKs, enriches/batches/samples it, and exports to Dynatrace via the ActiveGate.
- OTLP — OpenTelemetry Protocol, the wire format (gRPC on 4317, HTTP on 4318) services use to send telemetry to the Collector.
- DQL — Dynatrace Query Language, the pipe-based language for querying Grail-stored logs, spans, events, and metrics; powers the newer dashboards and notebooks.
- Grail — Dynatrace’s data lakehouse that stores logs/events/traces for DQL querying.
- Host Unit (HU) — the classic full-stack licensing unit; one HU covers 16 GiB of host RAM.
- Davis Data Unit (DDU) — the classic metering unit for ingested metrics, logs, and events.
- DPS — Dynatrace Platform Subscription, the newer consumption-based pricing (per GiB-hour, per pod-hour, per GiB ingested).
- IRSA — IAM Roles for Service Accounts on EKS; lets a pod assume an AWS IAM role via the cluster OIDC provider, e.g. so the ActiveGate reads CloudWatch without static keys.
- Host group — a OneAgent tag (
--set-host-group) that scopes hosts for management zones, monitoring modes, and cost control.