In a nutshell
Kubernetes can add capacity for you automatically, in a few different ways — and the thing that trips most people up is that these are separate tools doing separate jobs, not one setting you flip.
Picture a restaurant during a dinner rush:
- HPA (Horizontal Pod Autoscaler) hires more waiters when the floor gets busy — more copies of your app (more pods) to share the load. This is the one you reach for first.
- VPA (Vertical Pod Autoscaler) gives each waiter a bigger tray. It doesn’t change how many pods you run — it right-sizes the CPU and memory each pod asks for.
- Karpenter (or Cluster Autoscaler) opens more of the dining room. When there are more waiters than the floor can hold, it adds nodes — the machines your pods actually run on.
- KEDA is a smarter maître d’ bolted onto the HPA. A plain HPA can only watch CPU and memory and always keeps at least one pod running. KEDA lets you scale on anything — a queue backlog, Kafka lag, a cron window — and, uniquely, lets a workload drop all the way to zero pods when there’s no work, then wake on the first event.
| Scaler | Changes | Reacts to | Can idle to zero? |
|---|---|---|---|
| HPA | pod count | CPU / memory / custom / external metrics | No (min 1) |
| KEDA | pod count (drives an HPA) | queues, streams, events, cron, 70+ sources | Yes |
| VPA | pod size (requests) | historical usage | n/a |
| Karpenter / CA | node count & shape | pods that can’t be scheduled | n/a (nodes) |
The mental model that ties them together: metrics scale pods, and pods that don’t fit scale nodes. A signal crosses a threshold → HPA or KEDA adds pods → if the cluster is full those pods sit Pending → the node autoscaler notices and adds a machine → the pods finally run. Three loops in a chain. The diagram further down traces exactly that path.
Level: Intermediate → Advanced · Time: ~28 min · You’ll wire up: custom-metric HPAs, KEDA event-driven and scale-to-zero workloads, and Karpenter node provisioning — then tune the three so they cooperate instead of fight.
Prerequisites & what you’ll be able to do
Assumed knowledge. You can create a Deployment and a Service, read kubectl get/describe output, and you know what a pod’s CPU/memory request is (the reserved amount the scheduler uses to place it). If requests are fuzzy, skim the VPA right-sizing lesson first — every autoscaler in this guide keys off requests. For the HPA algorithm and the HPA↔VPA relationship studied in isolation, the companion HPA & VPA deep dive goes slower over that ground.
One hard prerequisite: metrics-server must be running for any CPU/memory HPA. On AKS/GKE/EKS it ships managed; verify with kubectl top nodes returning numbers, not an error.
After this lesson you will be able to:
- Explain which of HPA, KEDA, VPA, and Karpenter to reach for, and why they run as separate loops.
- Write an
autoscaling/v2HPA that scales on CPU, memory, a custom per-pod metric, or an external metric. - Build a KEDA
ScaledObjectthat scales a queue/stream worker — including all the way to zero — and aScaledJobfor batch. - Tune HPA
behavior(stabilization windows and policies) so pods stop flapping. - Choose Cluster Autoscaler vs Karpenter deliberately, and run Karpenter consolidation and Spot safely with disruption budgets and PodDisruptionBudgets.
- Run HPA and VPA together without them fighting, and load-test the whole stack to read the end-to-end scaling timeline.
Autoscaling on Kubernetes is three independent control loops stacked on top of each other, and most outages happen at the seams between them. This guide wires up all three — pod-level HPA on custom/external metrics, KEDA for event-driven and scale-to-zero workloads, and node autoscaling with both Cluster Autoscaler and Karpenter — then tunes them so they cooperate instead of fight.
The three layers, and why the order matters
| Layer | Controller | Scales | Reacts to |
|---|---|---|---|
| Pod replicas | HPA / KEDA | replica count of a Deployment | CPU, memory, custom, external metrics |
| Pod requests | VPA | per-pod CPU/memory requests | historical usage |
| Nodes | Cluster Autoscaler / Karpenter | the node count / shape | unschedulable (Pending) pods |
The causal chain runs top-down: a metric crosses a threshold, the HPA (or KEDA-managed HPA) adds replicas, those replicas go Pending because the cluster is full, and only then does the node autoscaler add capacity. Your end-to-end scale-up latency is the sum of all three loops — typically HPA sync (15s default) + scheduler + node provisioning (30s–several minutes). Internalizing that sum is the whole game.
Prerequisite:
metrics-servermust be running for any CPU/memory HPA. On AKS/GKE/EKS it ships managed; verify withkubectl top nodesreturning numbers, not an error.
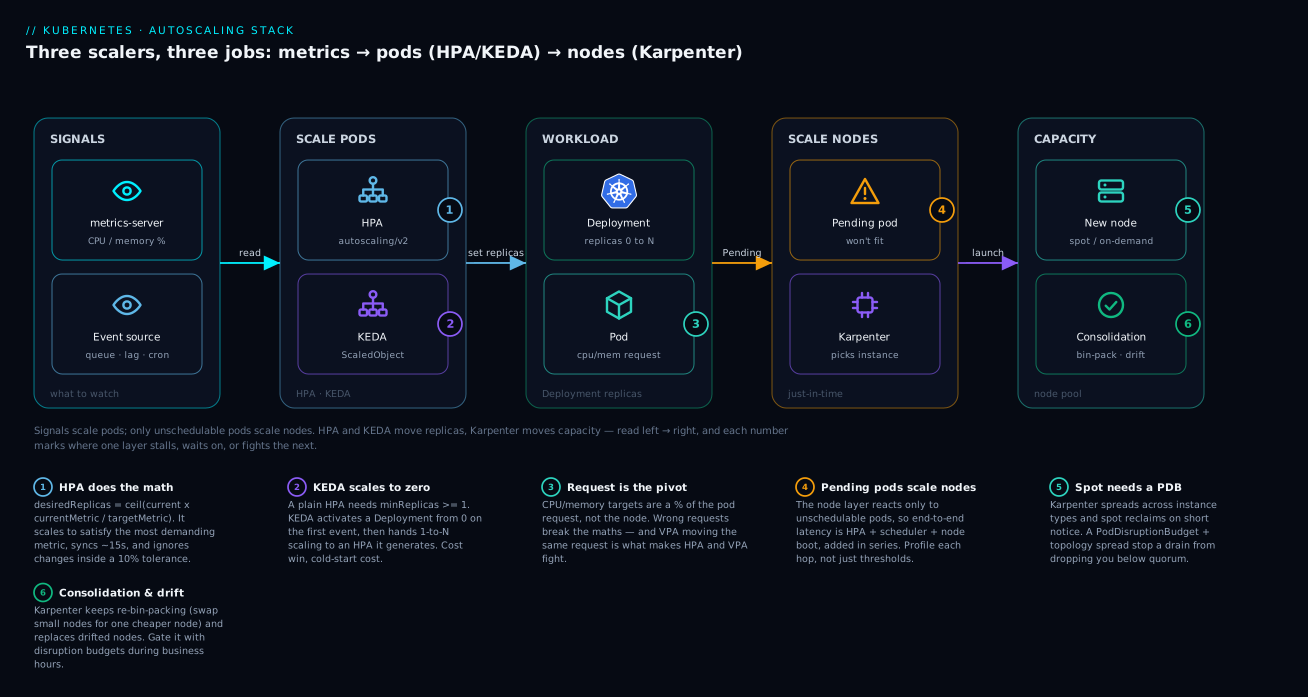
Read the diagram left → right as one causal chain. Signals (CPU/memory from metrics-server, or a queue/stream/cron event source) feed the pod scalers: the HPA runs its ceil() formula on the metric, and KEDA drives an HPA of its own — the only path that can idle a workload to zero (badge 2). Scaling the Deployment changes replica count, but every target is measured against the pod’s request (badge 3), the same number the VPA wants to move — which is why those two can fight. When new pods can’t fit they go Pending (badge 4), and only that unschedulable state makes Karpenter provision a just-in-time node; once capacity lands, consolidation (badge 6) keeps re-packing the fleet onto the cheapest nodes that still satisfy your PodDisruptionBudgets. Every number marks a seam where one layer stalls, waits on, or fights the next.
1. HPA beyond CPU: memory, custom, and external metrics
The v2 HPA API (autoscaling/v2) takes a list of metrics and scales to satisfy the most demanding one. Start with the two built-in resource metrics:
apiVersion: autoscaling/v2
kind: HorizontalPodAutoscaler
metadata:
  name: checkout
  namespace: shop
spec:
  scaleTargetRef:
    apiVersion: apps/v1
    kind: Deployment
    name: checkout
  minReplicas: 3
  maxReplicas: 40
  metrics:
    - type: Resource
      resource:
        name: cpu
        target:
          type: Utilization        # % of the pod's CPU *request*
          averageUtilization: 65
    - type: Resource
      resource:
        name: memory
        target:
          type: AverageValue        # absolute, not %, for memory
          averageValue: 600Mi
Utilization targets are a percentage of the resource request, not the limit. If your requests are wrong, your HPA math is wrong. This is the single most common HPA misconfiguration.
CPU and memory rarely correlate with what users actually feel. To scale on a real signal — requests-per-second, p95 latency, queue depth — you need the custom metrics or external metrics API, served by an adapter. The canonical choice is the Prometheus Adapter.
helm repo add prometheus-community https://prometheus-community.github.io/helm-charts
helm upgrade --install prometheus-adapter prometheus-community/prometheus-adapter \
  -n monitoring --create-namespace \
  --set prometheus.url=http://prometheus-server.monitoring.svc \
  --set prometheus.port=80
The adapter exposes a rule-defined PromQL series as a Kubernetes metric. Scale on per-pod RPS:
# adapter rule (values.yaml -> rules.custom)
rules:
  custom:
    - seriesQuery: 'http_requests_total{namespace!="",pod!=""}'
      resources:
        overrides:
          namespace: { resource: namespace }
          pod: { resource: pod }
      name:
        matches: "http_requests_total"
        as: "http_requests_per_second"
      metricsQuery: 'sum(rate(<<.Series>>{<<.LabelMatchers>>}[2m])) by (<<.GroupBy>>)'
# the HPA consuming it
  metrics:
    - type: Pods
      pods:
        metric: { name: http_requests_per_second }
        target:
          type: AverageValue
          averageValue: "50"          # aim for ~50 rps per pod
Use type: Pods when the metric is per-replica (HPA divides total by replica count for you). Use type: External for a metric that is not attached to your pods — a cloud queue length, a third-party SLO — where the adapter (or KEDA, below) talks to the source directly.
The four metric shapes
autoscaling/v2 accepts four metric types, and knowing which is which is most of the battle:
type |
Where the number comes from | HPA divides by replicas? | Typical use |
|---|---|---|---|
Resource |
metrics-server (CPU/memory of the pods) |
yes, for Utilization |
the default; CPU/memory |
Pods |
custom-metrics API, a value per pod | yes | RPS/pod, connections/pod |
Object |
custom-metrics API, one value on another object | no | Ingress requests, a queue CR |
External |
external-metrics API, unattached to any pod | no | cloud queue length, an SLO |
A worked example makes the algorithm concrete. Say the checkout HPA targets 65% CPU utilization, you currently run 4 replicas, and the average pod is sitting at 91% of its CPU request. The HPA computes ceil(4 × 91/65) = ceil(5.6) = 6 and scales to 6. Next sync it re-reads: the same load spread over 6 pods lands near ~61%, inside the tolerance band, so it holds. That ceil(currentReplicas × currentMetric / targetMetric) is the entire HPA — the Going deeper section below unpacks the tolerance and stabilization that wrap it.
2. Event-driven scaling with KEDA
HPA is a closed loop on a steady-state metric. KEDA is the right tool when work arrives as discrete events — a queue backlog, Kafka consumer lag, a cron window — and especially when you want scale-to-zero, which a plain HPA cannot do (HPA minReplicas is >= 1).
KEDA installs an operator plus a metrics adapter. Under the hood it creates and manages an HPA for you from a ScaledObject; you do not write the HPA by hand.
helm repo add kedacore https://kedacore.github.io/charts
helm upgrade --install keda kedacore/keda -n keda --create-namespace
A queue-driven worker that idles at zero and bursts on backlog (Azure Service Bus shown; the pattern is identical for SQS, Pub/Sub, RabbitMQ):
apiVersion: keda.sh/v1alpha1
kind: ScaledObject
metadata:
  name: order-worker
  namespace: shop
spec:
  scaleTargetRef:
    name: order-worker            # the Deployment
  minReplicaCount: 0              # scale to zero when idle
  maxReplicaCount: 100
  pollingInterval: 15            # how often KEDA checks the source (s)
  cooldownPeriod: 120            # wait before scaling back to zero (s)
  triggers:
    - type: azure-servicebus
      metadata:
        queueName: orders
        messageCount: "20"        # target backlog per replica
      authenticationRef:
        name: sb-auth             # TriggerAuthentication (workload identity / secret)
Kafka consumer lag is the other workhorse trigger:
  triggers:
    - type: kafka
      metadata:
        bootstrapServers: kafka.svc:9092
        consumerGroup: order-consumers
        topic: orders
        lagThreshold: "100"       # desired max lag per replica
Two more KEDA patterns worth knowing:
crontrigger to pre-warm before a known peak (market open, batch window) instead of reacting after latency already spiked.ScaledJobinstead ofScaledObjectwhen each message should map to a finite Job run rather than a long-lived Deployment replica — ideal for non-idempotent batch processing.
Scalers and authentication
KEDA ships 70+ scalers — each knows how to query one kind of source and report a metric the generated HPA can act on. The workhorses:
| Scaler | Metric it reads | Common metadata |
|---|---|---|
azure-servicebus / aws-sqs-queue / gcp-pubsub |
queue backlog | messageCount / queueLength per replica |
kafka |
consumer-group lag | lagThreshold per replica |
prometheus |
any PromQL result | query, threshold |
cron |
wall-clock window | start, end, desiredReplicas |
rabbitmq |
queue length / message rate | queueLength, mode |
Every non-trivial trigger needs credentials, and you never put them inline. A TriggerAuthentication (namespaced) or ClusterTriggerAuthentication points KEDA at a secret or, better, at cloud workload identity:
apiVersion: keda.sh/v1alpha1
kind: TriggerAuthentication
metadata:
  name: sb-auth
  namespace: shop
spec:
  podIdentity:
    provider: azure-workload      # federated identity — no secret stored in the cluster
The ScaledObject above then references it via authenticationRef: { name: sb-auth }, exactly as shown.
ScaledObject vs ScaledJob
ScaledObject |
ScaledJob |
|
|---|---|---|
| Targets | an existing Deployment / StatefulSet | creates Kubernetes Jobs |
| Model | long-lived replicas share the queue | one Job per batch of messages |
| Best for | idempotent stream/queue workers | non-idempotent or long-running batch items |
| Scale to zero | yes (minReplicaCount: 0) |
yes (no Jobs run when idle) |
Scale-to-zero cuts cost but adds cold-start latency: the first event must wait for a node (maybe), a pull, and app start. For latency-sensitive paths keep
minReplicaCount: 1. Reserve zero for genuinely bursty, latency-tolerant work.
3. Tuning behavior: stabilization, policies, no flapping
Default HPA behavior scales up fast and down slow (a 300s downscale stabilization window). That asymmetry is deliberate — over-provisioning briefly is cheap; thrashing is expensive. Tune it explicitly via spec.behavior:
spec:
  behavior:
    scaleUp:
      stabilizationWindowSeconds: 0     # react immediately on the way up
      policies:
        - type: Percent
          value: 100                    # at most double
          periodSeconds: 30
        - type: Pods
          value: 8                      # ...or +8 pods
          periodSeconds: 30
      selectPolicy: Max                 # take the more aggressive of the two
    scaleDown:
      stabilizationWindowSeconds: 300   # consider the last 5 min of recommendations
      policies:
        - type: Percent
          value: 20                     # shed at most 20% per minute
          periodSeconds: 60
The downscale stabilization window makes the HPA pick the highest recommendation it computed over the window before acting — that is what kills flapping. If your traffic is spiky and pods still oscillate, widen scaleDown.stabilizationWindowSeconds and lower the per-period Percent before you touch thresholds. KEDA passes a advanced.horizontalPodAutoscalerConfig.behavior block straight through to the HPA it manages, so the same knobs apply to event-driven workloads.
4. Node autoscaling: Cluster Autoscaler vs Karpenter
Both react to the same trigger — Pending pods the scheduler cannot place — but they differ fundamentally in how they pick capacity.
| Cluster Autoscaler (CA) | Karpenter | |
|---|---|---|
| Unit of scaling | a node group (ASG / VMSS / MIG) you pre-define | individual nodes, instance type chosen at provision time |
| Instance selection | fixed per group | from a flexible set; picks cheapest that fits |
| Speed | slower (group scale, then schedule) | faster (provisions the node the pod needs) |
| Bin-packing | limited | active consolidation built in |
| Availability | every managed K8s | EKS first-class; expanding to others |
Cluster Autoscaler is the universal default. On AKS it’s a cluster toggle; the autoscaler watches your node pools’ min/max:
az aks nodepool update -g rg-shop --cluster-name aks-shop -n apps \
  --enable-cluster-autoscaler --min-count 3 --max-count 30
CA only scales node groups it owns and assumes all nodes in a group are interchangeable, so it works best with a handful of well-sized, single-instance-type pools. For node consolidation it removes a node only when its pods can be rescheduled elsewhere and it has sat under-utilized past --scale-down-unneeded-time.
Karpenter discards the node-group abstraction. You declare constraints (a NodePool) and a provisioning template (EC2NodeClass on AWS); Karpenter computes the cheapest instance(s) that satisfy pending pods and launches them directly.
apiVersion: karpenter.sh/v1
kind: NodePool
metadata:
  name: default
spec:
  template:
    spec:
      requirements:
        - key: karpenter.sh/capacity-type
          operator: In
          values: ["spot", "on-demand"]      # prefer spot, fall back
        - key: kubernetes.io/arch
          operator: In
          values: ["amd64", "arm64"]          # let it pick Graviton when it fits
        - key: karpenter.k8s.aws/instance-category
          operator: In
          values: ["c", "m", "r"]
      nodeClassRef:
        group: karpenter.k8s.aws
        kind: EC2NodeClass
        name: default
  limits:
    cpu: "1000"                               # hard ceiling across this pool
  disruption:
    consolidationPolicy: WhenEmptyOrUnderutilized
    consolidationAfter: 1m
For the full EKS setup — controller install, EC2NodeClass, interruption handling, and consolidation tuning — see the dedicated Karpenter on EKS deep dive; here we focus on how it composes with the pod layer.
5. Bin-packing, consolidation, and Spot safety
Karpenter’s real value is consolidation: it continuously re-evaluates whether the current fleet is the cheapest way to host current pods, and will replace several small nodes with one larger node, or swap an on-demand node for a cheaper instance, draining the old one safely. That is bin-packing as a live process, not a one-time placement.
Two guardrails make this safe in production:
  disruption:
    consolidationPolicy: WhenEmptyOrUnderutilized
    budgets:
      - nodes: "10%"                # never voluntarily disrupt >10% of nodes at once
      - nodes: "0"                  # ...and zero during business hours
        schedule: "0 9 * * mon-fri"
        duration: 8h
And on the workload side, a PodDisruptionBudget is non-negotiable once you run Spot or enable consolidation — it is what stops a node drain from taking your service below quorum:
apiVersion: policy/v1
kind: PodDisruptionBudget
metadata: { name: checkout, namespace: shop }
spec:
  minAvailable: 2
  selector: { matchLabels: { app: checkout } }
Spot capacity can be reclaimed with ~30s notice (interruption) or evaporate (no capacity). Mitigate by: spreading across many instance types (let Karpenter choose), keeping critical singletons on on-demand, setting PDBs, and using topology spread so a single AZ/instance-type pull can’t drain a whole tier.
6. Combining VPA with HPA safely
The Vertical Pod Autoscaler right-sizes requests; the HPA scales replica count. They collide when both act on the same resource: VPA raises the CPU request, which lowers CPU utilization (same usage / bigger request), which tells the HPA to scale down — a feedback loop that defeats both. (The VPA’s own internals — recommender, updater, admission controller, and its update modes — get a full treatment in the companion HPA & VPA deep dive linked above; the rule that matters for composition is simpler.)
Rules that keep them from fighting:
- Never let VPA and HPA control the same metric. If the HPA scales on CPU, do not let VPA manage CPU.
- The clean split: HPA scales horizontally on a custom/external metric (RPS, queue depth); VPA right-sizes CPU and memory underneath it. No shared dimension, no loop.
- The narrower split: HPA on CPU; VPA on memory only, in
recommendation/automode for memory while leaving CPU to the HPA. - Run VPA in
updateMode: "Off"first to observe recommendations before letting it evict pods.
apiVersion: autoscaling.k8s.io/v1
kind: VerticalPodAutoscaler
metadata: { name: checkout, namespace: shop }
spec:
  targetRef:
    apiVersion: apps/v1
    kind: Deployment
    name: checkout
  updatePolicy:
    updateMode: "Initial"          # set requests at pod creation; don't evict running pods
  resourcePolicy:
    containerPolicies:
      - containerName: "*"
        controlledResources: ["memory"]   # HPA owns CPU; VPA owns memory only
7. Load-test the whole stack and read the timeline
A config that looks right on paper means nothing until you watch all three loops fire under load. Drive synthetic traffic and observe.
# generate load (k6 is convenient; hey/wrk/vegeta all work)
kubectl run k6 --rm -it --image=grafana/k6 -- run - <<'EOF'
import http from 'k6/http';
export const options = { stages: [
  { duration: '2m', target: 200 },   // ramp
  { duration: '5m', target: 800 },   // sustained peak
  { duration: '3m', target: 0 },     // drain -> watch scale-down
]};
export default function () { http.get('https://checkout.shop.svc/health'); }
EOF
In separate panes, watch each loop and timestamp the transitions:
kubectl get hpa checkout -n shop -w                # metric vs target, replica deltas
kubectl get pods -n shop -w                        # Pending -> ContainerCreating -> Running
kubectl get nodes -w                               # new nodes joining
kubectl get events -n shop --sort-by=.lastTimestamp | tail -30
kubectl describe hpa checkout -n shop              # the why behind each decision
Reading the timeline end to end, you should be able to attribute every second: metric crossed at T+0 → HPA bumped replicas at T+~15s → pods Pending at T+18s → node autoscaler reacted → node Ready → pods Running → metric back under target. If a stage is slow, you now know exactly which loop to tune.
Enterprise scenario
A payments platform ran KEDA scale-to-zero on its settlement-batch workers (SQS-driven) backed by a Karpenter Spot pool. Every weekday at 17:00 a fan-out job dumped ~40k messages into the queue. KEDA correctly scaled the Deployment from 0 to ~120 replicas, but p99 settlement time blew past the SLA on the first few thousand messages. The cause was additive cold-start, not throughput: 0→1 forced a Karpenter node launch, a 1.2 GB image pull, JVM warmup, and SQS ApproximateNumberOfMessages lags ~20–30s, so KEDA itself reacted late. The Spot pool made it worse — diversified instance types meant variable boot times, and one launch hit InsufficientInstanceCapacity.
The fix was to stop reacting and start pre-warming. They added a second KEDA trigger with a cron schedule so capacity was in place before the 17:00 dump, while keeping the queue trigger for actual backlog:
  minReplicaCount: 0
  triggers:
    - type: cron
      metadata:
        timezone: America/New_York
        start: "55 16 * * 1-5"   # warm up at 16:55
        end:   "30 18 * * 1-5"
        desiredReplicas: "30"     # floor during the window
    - type: aws-sqs-queue
      metadata:
        queueURL: https://sqs.us-east-1.../settlements
        queueLength: "50"
They also pinned the first 30 replicas to on-demand via a separate NodePool (Spot only above the floor) and pre-pulled the image with a DaemonSet. End-to-end p99 dropped back under SLA, and Spot still covered the long tail.
Going deeper
Everything above is enough to ship. This section is the layer underneath — the exact algorithm, the KEDA wiring, the Karpenter engine, and the one rule that lets all three run at once. Reach for it when a scaler behaves in a way the surface docs don’t explain.
The HPA algorithm, exactly
Every sync period (default 15s, --horizontal-pod-autoscaler-sync-period on the controller manager) the HPA recomputes:
desiredReplicas = ceil( currentReplicas × ( currentMetricValue / desiredMetricValue ) )
Four details separate a stable HPA from a flapping one:
- Tolerance. If the ratio
currentMetricValue / desiredMetricValueis within ±10% of 1.0 (--horizontal-pod-autoscaler-tolerance=0.1), the HPA does nothing. This dead-band is why a target of 65% doesn’t thrash when utilization wobbles between 60% and 70%. Recent releases also let you set the tolerance per-HPA underbehavior, so a noisy workload can widen it without touching the cluster default. - Most-demanding wins. With multiple metrics the HPA computes a desired replica count for each and takes the maximum. Your CPU metric and your RPS metric can’t both be satisfied — the more demanding one sets the floor. This is why adding a memory metric can only ever scale you up, never down, relative to CPU alone.
- Readiness and missing metrics. Pods that are not yet
Ready, or still inside--horizontal-pod-autoscaler-initial-readiness-delay, are excluded from the average so a cold pod doesn’t drag the number down and trigger a runaway scale-up. Missing metrics are treated conservatively: assumed at 100% of target when scaling down and 0% when scaling up, so a broken metric pipeline can’t spike or collapse you on its own. - Stabilization window. Before acting the HPA looks back over
behavior.scaleDown.stabilizationWindowSeconds(default 300s) and picks the highest recommendation in that window. That backward-lookingmaxis the single most important anti-flap knob: a brief dip in load never immediately sheds pods. The scale-up window defaults to 0 (act immediately).
Put together, the HPA is a proportional controller with a dead-band, a max-over-metrics rule, and an asymmetric memory (fast up, slow down). Nothing about it is predictive — it always reacts to current load, which is exactly why event-driven and scheduled scaling exist alongside it.
KEDA architecture: it feeds the HPA, it doesn’t replace it
KEDA is two components running in the keda namespace:
- The operator — watches
ScaledObject/ScaledJobresources and, for each one, creates and owns a normalautoscaling/v2HPA. It also handles the 0↔1 activation a plain HPA cannot: when replicas are at zero and a scaler reports work, the operator scales the Deployment to 1 directly, then hands ongoing 1→N scaling to that HPA. - The metrics adapter — registers as an
external.metrics.k8s.ioAPI service. The HPA KEDA created asks that API for the metric each sync; the adapter answers by polling the actual source (queue, Kafka, Prometheus) onpollingInterval.
So the causal chain is source → KEDA adapter → external metrics API → KEDA-owned HPA → /scale. Two consequences fall out of that architecture:
cooldownPeriodonly governs the scale-to-zero step. Ordinary 1→N→1 movements are driven by the HPA’sbehavior, which you set underadvanced.horizontalPodAutoscalerConfig.behavior. The N→0 transition waitscooldownPeriodafter the last active trigger.- Activation and scaling are different thresholds. Many scalers expose an
activationThreshold(orminMetricValue): the metric must exceed that to wake from zero, while the ordinarymessageCount/lagThresholdgoverns 1→N. Set activation low and the steady-state target higher and you avoid waking a whole Deployment for a single stray message.
Because KEDA is an HPA underneath, you never run a hand-written HPA and a ScaledObject against the same Deployment — two controllers patching one /scale subresource fight. Delete the manual HPA and let KEDA own it.
Karpenter internals vs Cluster Autoscaler
Cluster Autoscaler simulates the scheduler against pre-defined node groups: for each group it asks “if I added one node here, would the Pending pods fit?” and scales the group whose template fits — its expander breaks ties by least-waste, priority, or price. It never chooses an instance type; the ASG/VMSS/MIG already did.
Karpenter throws that away and works from the raw pending-pod requirements:
- Just-in-time bin-packing. It batches pending pods, combines their CPU/memory/architecture/zone constraints, and solves for the cheapest single instance (or few) that packs them, launching directly. With no group templates it can pick a
c6g.4xlargetoday and anm7i.2xlargetomorrow. - Consolidation. Continuously it re-solves the current fleet: can these pods be re-packed onto fewer or cheaper nodes? If yes it cordons, drains, and replaces.
WhenEmptyremoves only empty nodes;WhenEmptyOrUnderutilizedalso replaces under-used ones. This is bin-packing as a live, ongoing process. - Drift. If a node no longer matches its
NodePool/EC2NodeClass(you changed the AMI, labels, or requirements), Karpenter marks it drifted and rolls it — how a fleet stays in spec without a blue/green dance. - Disruption budgets. All voluntary disruption (consolidation, drift, expiry) is gated by
disruption.budgets, so you cap how many nodes churn at once and black out business hours. Spot interruptions are involuntary (~2 min notice on AWS) and bypass budgets — Karpenter just starts a replacement early on the interruption signal.
The trade-off: Karpenter is faster and cheaper and needs almost no pool pre-planning, but it churns nodes far more than CA. That churn is only safe with PodDisruptionBudgets and topology spread — which is why those aren’t optional once consolidation or Spot is switched on.
Making all three cooperate
Compose the loops by giving each one a dimension the others don’t touch:
- HPA/KEDA own replica count, keyed on an app-level metric (RPS, queue depth) rather than CPU where you can — the signal users actually feel.
- VPA owns pod size, ideally memory only if the HPA is on CPU, or both CPU and memory if the HPA is on a custom metric. Never let HPA and VPA both control CPU: VPA raises the CPU request → utilization (usage ÷ request) drops → the HPA scales down → a feedback loop that defeats both. The clean fix is a non-shared dimension, not clever tuning.
- Karpenter owns nodes, reacting to the
Pendingpods the first two loops produce.
Read top-down, the loops form a pipeline with no shared control variable — the only safe way to stack three controllers. Where they do share a variable (the pod request, which HPA-utilization, VPA, and bin-packing all read), that variable becomes the thing you must get right first, because an error in it corrupts every layer at once.
Practice challenges
Work these against a scratch cluster (kind / minikube / AKS / EKS). Each has a marked solution — try before you peek.
1 · Beginner — read the formula. An HPA targets 50% CPU utilization, currently runs 3 replicas, and its pods average 80% of their CPU request. How many replicas will it scale to on the next sync, and what happens the sync after?
<details><summary>Solution</summary>
ceil(3 × 80/50) = ceil(4.8) = 5. After scaling to 5, the same load spread over 5 pods lands near 80% × 3/5 = 48%, inside the ±10% tolerance of 50%, so it holds at 5. Why: desiredReplicas = ceil(currentReplicas × current/target), then the tolerance dead-band stops it oscillating.
</details>
2 · Beginner — the missing-requests trap. You apply a CPU-Utilization HPA and its TARGETS column shows <unknown>/65% forever. Name the two most likely causes and the one-command check for each.
<details><summary>Solution</summary>
(a) The Deployment’s pods declare no CPU request, so utilization (a % of the request) is undefined — check kubectl describe pod for a Requests: block. (b) metrics-server isn’t serving — check kubectl top pods returns numbers. A Utilization HPA needs both. Why: the HPA divides usage by the request; with no request there is nothing to divide by.
</details>
3 · Intermediate — event-driven with a floor. Write a KEDA ScaledObject for a Deployment mailer that idles at zero, bursts to at most 50 replicas on an AWS SQS queue, targets 30 messages per replica, and waits 5 minutes before scaling back to zero.
<details><summary>Solution</summary>
apiVersion: keda.sh/v1alpha1
kind: ScaledObject
metadata: { name: mailer, namespace: shop }
spec:
  scaleTargetRef: { name: mailer }
  minReplicaCount: 0
  maxReplicaCount: 50
  cooldownPeriod: 300
  triggers:
    - type: aws-sqs-queue
      metadata:
        queueURL: https://sqs.us-east-1.amazonaws.com/1234567890/mail
        queueLength: "30"
        awsRegion: us-east-1
      authenticationRef: { name: sqs-auth }
Why: minReplicaCount: 0 enables scale-to-zero, cooldownPeriod: 300 is the N→0 delay, and queueLength is the per-replica backlog target.
</details>
4 · Intermediate — stop the flapping. A CPU HPA on spiky traffic oscillates between 6 and 14 replicas every couple of minutes. You’ve confirmed requests are correct. Which behavior knobs do you change, and in which direction — before touching the CPU target?
<details><summary>Solution</summary>
Widen scaleDown.stabilizationWindowSeconds (e.g. 300 → 600) and lower the scale-down Percent policy (e.g. 20% → 10% per minute); optionally add a small scaleUp.stabilizationWindowSeconds. Why: the downscale stabilization window makes the HPA act on the highest recommendation over the window, damping the dips that cause flapping — a tuning problem, not a threshold problem.
</details>
5 · Advanced — compose HPA + VPA without a loop. A latency-sensitive API already runs an HPA on a custom RPS metric. You want VPA to right-size it too. Give a VPA spec that won’t fight the HPA and won’t evict pods mid-spike, and state the rule you’re applying.
<details><summary>Solution</summary>
apiVersion: autoscaling.k8s.io/v1
kind: VerticalPodAutoscaler
metadata: { name: api, namespace: shop }
spec:
  targetRef: { apiVersion: apps/v1, kind: Deployment, name: api }
  updatePolicy: { updateMode: "Initial" }   # set at creation, never evict running pods
  resourcePolicy:
    containerPolicies:
      - containerName: "*"
        controlledResources: ["cpu", "memory"]
Because the HPA scales on RPS (not CPU/memory), VPA may safely own both CPU and memory — no shared control variable, no feedback loop. updateMode: Initial sets requests at pod creation and never evicts a running pod, so a spike can’t be disrupted. Why: the conflict only exists when HPA and VPA share a resource; move the HPA off CPU and the shared dimension disappears.
</details>
6 · Advanced — Spot-safe Karpenter. You enable Karpenter consolidation on a Spot-backed pool hosting a 3-replica quorum service. List the three objects/settings that keep a consolidation or Spot reclaim from taking the service below quorum.
<details><summary>Solution</summary>
(1) A PodDisruptionBudget with minAvailable: 2 (or maxUnavailable: 1) on the service; (2) topologySpreadConstraints across zones/instance types so one pull can’t drain a whole tier; (3) disruption.budgets on the NodePool capping voluntary churn (e.g. nodes: "10%", plus nodes: "0" during business hours). Why: consolidation and Spot both drain nodes — the PDB is the workload-side floor, topology spread limits blast radius, and node-side budgets throttle voluntary disruption.
</details>
Common beginner mistakes
- “I set an HPA, why isn’t it scaling?” — no resource requests. A CPU/memory Utilization target is a percentage of the pod’s request. With no request there is no denominator, so the HPA reports
<unknown>and never acts. The right model: requests aren’t optional metadata — they are the unit every autoscaler measures against. Set them (use VPA in observe mode to find them) before you trust any HPA. - Letting HPA and VPA both manage CPU. It feels natural to “autoscale everything,” but VPA raising the CPU request drops utilization, which tells the HPA to scale down, which loops. The right model: one controller per dimension. HPA on CPU or VPA on CPU, never both — split them (HPA on a custom metric + VPA on CPU/mem, or HPA on CPU + VPA on memory only).
- Scaling on CPU when users actually feel latency or backlog. CPU is convenient, not correct. A queue can be 10,000 messages deep while CPU sits at 30%, and your HPA happily does nothing. The right model: scale on the signal your users experience — requests-per-second, p95 latency, or queue depth — via custom/external metrics or KEDA. CPU is a proxy, and often a poor one.
- Turning on Karpenter consolidation (or Spot) with no disruption budgets. Consolidation is designed to drain and replace nodes; Spot reclaims them out from under you. With no
PodDisruptionBudgetand nodisruption.budgets, the node layer will cheerfully drain you to zero healthy replicas. The right model: PDBs and topology spread are prerequisites for consolidation and Spot, not nice-to-haves you bolt on later. - Chasing responsiveness with a tiny stabilization window. Setting
scaleDown.stabilizationWindowSeconds: 0to “react faster” makes pods thrash — every metric dip sheds pods that the next spike immediately re-adds, and each cycle costs a scheduling round and maybe a node launch. The right model: scale up fast, scale down slow. Keep the downscale window wide (≥300s); brief over-provisioning is cheap, flapping is expensive. - Forgetting the latency is additive. Beginners tune the HPA threshold when scale-up feels slow, but the delay is often downstream: HPA sync + scheduler + node boot. The right model: three loops in series means end-to-end latency is their sum — profile each hop (
kubectl get hpa/pods/nodes -w) before touching any single knob.
Verify
kubectl top nodes                                  # metrics-server returns data
kubectl get apiservices | grep metrics             # custom/external metrics API registered
kubectl get hpa -A                                 # TARGETS column shows current/target, not <unknown>
kubectl get scaledobject -A                        # KEDA objects; READY/ACTIVE = True
kubectl get hpa -n keda -A                         # the HPAs KEDA generated exist
kubectl get nodepool,nodeclaim                     # Karpenter intent + provisioned nodes
kubectl get pdb -A                                 # disruption budgets present for critical apps
A <unknown> in the HPA TARGETS column means the metrics pipeline is broken (adapter down, bad PromQL, or wrong label overrides) — fix that before tuning anything else, because the HPA is flying blind.
Production checklist
Pitfalls
- Wrong requests poison everything. Utilization HPAs and bin-packing both key off requests. Get them right (use VPA in observe mode to find them) before trusting any autoscaler.
- Forgetting the latency is additive. Three loops in series. If scale-up feels slow, profile each hop rather than blindly lowering thresholds.
- No PDB + Spot/consolidation = self-inflicted outage. The node layer will happily drain you to zero healthy replicas if nothing stops it.
maxReplicasas a silent ceiling. Hitting the cap looks identical to “scaling is broken.” Alert on it.- VPA evicting under load.
updateMode: Autocan evict pods mid-spike. PreferInitial/Offfor anything user-facing until you trust the recommendations.
Glossary
- HPA (Horizontal Pod Autoscaler) — built-in controller that changes a Deployment’s replica count based on metrics.
autoscaling/v2is the current API. - VPA (Vertical Pod Autoscaler) — add-on controller that right-sizes a pod’s CPU/memory requests. Not built in; installed from the autoscaler repo.
- KEDA — Kubernetes Event-Driven Autoscaling. An add-on that scales on 70+ event sources and enables scale-to-zero by generating and driving an HPA for you.
- Karpenter — a node autoscaler that provisions individual nodes just-in-time to fit pending pods, choosing the instance type itself. Alternative to Cluster Autoscaler.
- Cluster Autoscaler (CA) — the universal node autoscaler that scales pre-defined node groups (ASG / VMSS / MIG) up and down.
- Replica — one running copy of your app (one pod managed by a Deployment/ReplicaSet).
- Request — the CPU/memory a pod reserves; the scheduler uses it for placement and the HPA measures utilization against it. The pivot every autoscaler shares.
- Utilization — current usage as a percentage of the request (not the limit, not node capacity).
metrics-server— cluster add-on that serves live CPU/memory (metrics.k8s.io); required for any CPU/memory HPA.- Custom / external metrics API —
custom.metrics.k8s.io(metrics on cluster objects) andexternal.metrics.k8s.io(metrics from outside the cluster), served by an adapter, that let the HPA scale on non-CPU signals. ScaledObject/ScaledJob— KEDA CRDs: the former scales a Deployment/StatefulSet, the latter creates Jobs per batch.- Scale-to-zero — dropping a workload to 0 replicas when idle, then waking on the first event. KEDA only; a plain HPA’s
minReplicasis ≥ 1. - Stabilization window — the look-back period over which the HPA takes the highest (for scale-down) recommendation, damping flapping.
- Tolerance — the ±10% dead-band around the target inside which the HPA does nothing.
- Consolidation — Karpenter continuously re-bin-packing pods onto fewer/cheaper nodes and replacing under-used ones.
- Drift — a node no longer matching its
NodePool/EC2NodeClass; Karpenter rolls drifted nodes back into spec. - Bin-packing — placing pods onto the fewest/cheapest nodes that satisfy their requests; the core of node-cost efficiency.
- PodDisruptionBudget (PDB) — a floor on how many replicas must stay available during voluntary disruption (drains, consolidation). Essential before Spot/consolidation.
- Spot / interruption — discounted reclaimable capacity; the provider can take it back on short notice (~2 min on AWS). Mitigated with instance diversity, PDBs, and topology spread.
- Topology spread — constraints that distribute replicas across zones/nodes so one failure or drain can’t take a whole tier.
Pendingpod — a pod the scheduler can’t place (no node fits); the only trigger for node autoscaling.
Get the three loops cooperating and the cluster becomes self-managing: it absorbs traffic spikes, drains queues to zero cost, and packs nodes tightly — without a human in the loop. The work is almost entirely in the tuning and the testing, not the YAML.