In a nutshell
Level: Advanced, with a beginner on-ramp · Time: ~31 min
Every container you run declares two numbers per resource (CPU and memory): a request and a limit. Beginners set them by copying whatever the last team used, and that single habit is why most clusters are both expensive and fragile. This lesson teaches you to set them by measurement instead of by guesswork — and the tool that measures for you is the Vertical Pod Autoscaler (VPA).
Picture a Kubernetes node as a shipping container and each pod as a box you load into it:
- The request is the shelf space you reserve. The loader (the scheduler) holds exactly that much room for your box — even if the box turns out half-empty. Reserve too much and the container fills up “on paper” while it is really half air, and you pay for the air. Reserve too little and boxes get crammed in, then thrown out when the container runs short.
- The limit is the hard line your box may never cross. For memory, crossing it means your box is ejected mid-shipment — that is an OOMKill (Out Of Memory kill). For CPU, crossing it just means you are forced to work slower — that is throttling — and nobody gets ejected.
- The VPA is the dock worker who watches how full your box actually gets over a whole week, then tells you the right shelf space to reserve: big enough that it never overflows, small enough that you stop paying for air.
That is the entire game. Set requests too high and you waste money (typical clusters idle at 25-35% utilization). Set them too low and you get OOMKilled or throttled. VPA measures real usage and hands you the right number; correct requests then let the scheduler bin-pack pods densely, so you run the same work on fewer nodes.
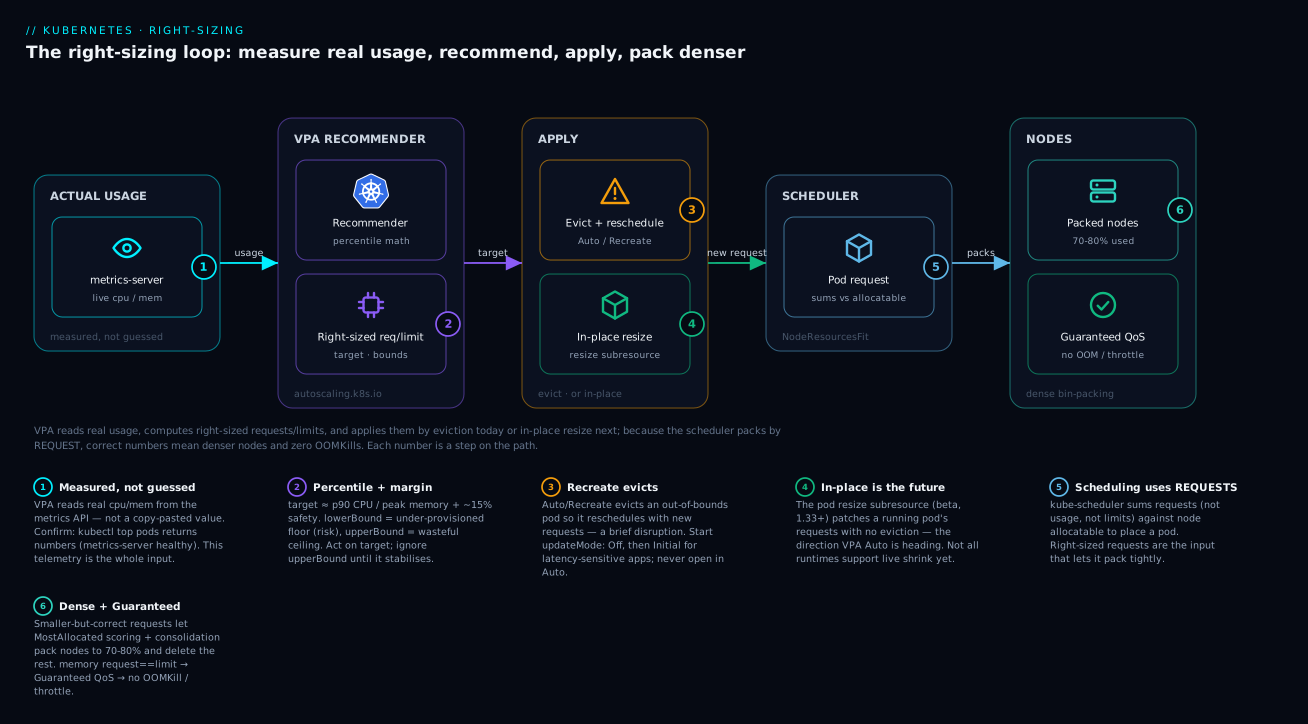
Read the diagram left to right: (1) the metrics API supplies real usage, (2) the recommender turns it into a right-sized request/limit, (3-4) the updater applies it by evicting-and-rescheduling today or by in-place resize next, (5) the scheduler places the pod using its request (never its usage), and (6) correct requests let nodes pack to 70-80% with Guaranteed QoS and no OOMKills.
Prerequisites and what you will be able to do
Know this first: how a Pod and a Deployment work and what a container is (see Pods, Deployments, and Services), basic kubectl, and ideally how the Horizontal Pod Autoscaler scales replicas (see the companion HPA and VPA deep dive). You do not need a running cluster to follow the reasoning — every manifest here is real and schema-correct.
After this lesson you will be able to:
- Explain the difference between a request and a limit, and predict which one causes OOMKills vs throttling.
- Determine any pod’s QoS class from its spec, and know why it matters at eviction time.
- Deploy VPA safely in
Offmode and read itstarget,lowerBound, andupperBoundrecommendations correctly. - Choose the right
updateModeand avoid the number-one VPA footgun: running it against an HPA on the same metric. - Combine HPA and VPA on different signals so they never fight.
- Turn right-sized requests into a smaller bill by fixing scheduler scoring, node shape, and consolidation.
Most Kubernetes clusters are simultaneously over-provisioned and unreliable: aggregate node utilization sits at 25-35% on a typical billing dashboard, yet pods still get OOMKilled and throttled. Both symptoms have the same root cause — requests and limits set by copy-paste, never by measurement. This guide fixes that with the Vertical Pod Autoscaler (VPA): how to gather recommendations safely, how to read the three numbers it produces, where it conflicts with the HPA, and how right-sizing feeds directly into better bin-packing and a smaller bill.
1. Requests vs limits, QoS, and the two failure modes
Before touching VPA, internalize what the scheduler and kubelet actually do with these numbers, because VPA only ever changes one of them.
First, the units, because a mis-read here causes real incidents:
| Unit | Means | Gotcha |
|---|---|---|
1000m (millicores) |
1 whole vCPU/core; 250m = a quarter core |
CPU is fractional and time-based, not a fixed slot |
Mi / Gi (mebi/gibibyte) |
1 Mi = 1024×1024 bytes; 1 Gi = 1024 Mi |
This is what tools report |
M / G (mega/gigabyte) |
1 M = 1,000,000 bytes (smaller than Mi) |
256M ≠ 256Mi; mixing them under-sizes memory by ~5% |
- Requests are a scheduling contract.
kube-schedulersums pod requests against each node’s allocatable capacity and places the pod where it fits. Requests reserve capacity whether or not the pod uses it. - Limits are an enforcement ceiling, applied by the kernel via cgroups. CPU over a limit is throttled (CFS throttling — the pod is slowed, not killed). Memory over a limit is OOMKilled — the kernel terminates the container, the kubelet restarts it, and you see a
CrashLoopBackOffif it repeats.
The deep reason the two resources behave so differently: CPU is compressible, memory is incompressible. You can always give a process less CPU by making it wait — it just runs slower. You cannot give a process less memory it has already allocated; the only way to reclaim it is to kill the process. That single fact is why a low CPU limit is merely a latency problem while a low memory limit is a reliability problem.
That asymmetry produces the two failure modes:
| Mis-set value | Consequence | Who pays |
|---|---|---|
| Requests too high | Capacity reserved but idle; nodes fill on paper at 30% real use | The bill |
| Requests too low | Pods crammed onto nodes, then evicted under node pressure | Reliability |
| Memory limit too low | OOMKill, restart, CrashLoopBackOff | Reliability |
| CPU limit too low | Silent CFS throttling, latency spikes | Latency SLOs |
QoS class is derived from these values and decides eviction order when a node runs out of memory:
| QoS class | Condition | Eviction priority |
|---|---|---|
Guaranteed |
requests == limits for every container, CPU and memory | Evicted last |
Burstable |
at least one request set, but not Guaranteed | Middle |
BestEffort |
no requests or limits at all | Evicted first |
Worked example — read the QoS class straight off the spec. A pod with two containers, where the app sets requests: {cpu: 250m, memory: 512Mi} and limits: {cpu: 250m, memory: 512Mi}, but a logging sidecar sets no resources at all, is Burstable, not Guaranteed — because Guaranteed requires every container to have requests == limits for both resources. One unset sidecar demotes the whole pod. Under node memory pressure the kubelet ranks that pod above a Guaranteed neighbour for eviction, and the Linux OOM killer gives its processes a higher oom_score_adj. This is why “we set requests on the main container” is not enough.
The single most important rule on this page: set memory requests == memory limits for anything you care about. It pins the pod to
Guaranteedfor memory, removes the burst headroom that lures you into OOMKills, and makes scheduling deterministic. For CPU, leave the limit off or set it generously — CPU is compressible, and a low CPU limit throttles you for no capacity benefit. VPA’s job is to find the right request number; you decide the request/limit relationship.
2. VPA architecture: recommender, updater, admission controller
VPA is not built into Kubernetes. You install it from the autoscaler repo, and it ships as three independent components plus a CRD:
- Recommender — watches live usage via the metrics API and historical samples, and writes
target,lowerBound, andupperBoundnumbers into the VPA object’sstatus. This component does the math and is safe to run alone. - Updater — reads recommendations and, in
Auto/Recreatemode, evicts pods whose requests are out of bounds so they get rescheduled with new values. It does not patch running pods in place (in-place resize is a separate, newer KEP). - Admission controller — a mutating webhook that rewrites a pod’s resource requests at creation time to match the recommendation. Without it, evicted pods would just come back with the same old requests.
Install the released manifests:
git clone https://github.com/kubernetes/autoscaler.git
cd autoscaler/vertical-pod-autoscaler
# Generates webhook TLS certs and applies recommender + updater + admission controller
./hack/vpa-up.sh

kubectl get pods -n kube-system | grep vpa
# vpa-recommender-...           1/1   Running
# vpa-updater-...               1/1   Running
# vpa-admission-controller-...  1/1   Running
Prerequisite:
metrics-servermust be healthy —kubectl top podshas to return numbers. The recommender also benefits from a Prometheus history source for cold-start accuracy, but the default in-cluster checkpoint store works out of the box.
3. Run VPA in Off mode first — recommendation only
Never start with Auto. Deploy the VPA object in updateMode: "Off" so the recommender observes and reports, but nothing evicts or mutates your pods. This is pure, zero-risk telemetry.
apiVersion: autoscaling.k8s.io/v1
kind: VerticalPodAutoscaler
metadata:
  name: checkout
  namespace: shop
spec:
  targetRef:
    apiVersion: apps/v1
    kind: Deployment
    name: checkout
  updatePolicy:
    updateMode: "Off"          # recommend only; do not touch pods
Let it run across at least one full traffic cycle — a week is sensible so it sees weekday peaks, the weekend trough, and any batch jobs. The recommender keeps a decaying histogram of usage, so longer is strictly better for the first pass.
4. Reading target, lowerBound, upperBound
After it has data, the recommendation lives in status:
kubectl describe vpa checkout -n shop
status:
  recommendation:
    containerRecommendations:
    - containerName: checkout
      lowerBound:
        cpu: 110m
        memory: 262144k
      target:
        cpu: 250m
        memory: 410Mi
      uncappedTarget:
        cpu: 250m
        memory: 410Mi
      upperBound:
        cpu: 1200m
        memory: 980Mi
Read these precisely — they are not min/typical/max of raw usage, they are percentile estimates with safety margin:
target— what VPA would set the request to right now. This is the number you act on. Internally it tracks roughly the 90th percentile of CPU and the peak of memory, plus a safety margin (about 15% by default).lowerBound— the floor below which VPA considers the pod under-provisioned. If your current request is belowlowerBound, you are at OOMKill/eviction risk. InAutomode, dropping below this triggers an eviction to scale up.upperBound— the ceiling above which the pod is wastefully over-provisioned. If your current request sits aboveupperBound, you are burning money. Early in the data windowupperBoundis huge and shrinks as confidence grows — do not act on it until it stabilizes.uncappedTarget— whattargetwould be ignoring anyminAllowed/maxAllowedcaps you set. The gap betweenuncappedTargetandtargettells you your cap is binding.
The decision rule for a manual first pass: set your request to target, set memory limit == memory request, drop the CPU limit.
A quick way to read the sample above: the recommender is confident memory sits around 410Mi (target and uncappedTarget agree, so no cap is binding), but the wide CPU spread — lowerBound 110m against upperBound 1200m — says CPU is spiky and the window is still young. Act on the 250m/410Mi target, pin memory limit to 410Mi, and let the CPU upperBound keep shrinking before you trust it.
You can constrain the recommender with a resourcePolicy so it never proposes something absurd — essential for sidecars and JVMs that need a memory floor:
spec:
  targetRef:
    apiVersion: apps/v1
    kind: Deployment
    name: checkout
  updatePolicy:
    updateMode: "Off"
  resourcePolicy:
    containerPolicies:
    - containerName: checkout
      minAllowed:
        cpu: 100m
        memory: 256Mi
      maxAllowed:
        cpu: "2"
        memory: 2Gi
      controlledResources: ["cpu", "memory"]
    - containerName: istio-proxy
      mode: "Off"               # never right-size the sidecar
Tune the target percentile only if you have evidence. The recommender’s defaults (memory target near peak, CPU near p90) are deliberately conservative because under-sizing memory kills pods. Lowering the memory target percentile to save money is how teams reintroduce the OOMKills they just fixed.
5. Update modes — and the hard HPA conflict
VPA supports four updateMode values:
| Mode | Behavior |
|---|---|
Off |
Recommend only. Never mutates pods. |
Initial |
Applies recommendations only at pod creation. No eviction of running pods. |
Recreate |
Evicts and recreates pods whenever requests drift out of [lowerBound, upperBound]. |
Auto |
Currently behaves like Recreate; intended to use in-place resize as it matures. |
Initial is the underrated safe default for production: new pods get right-sized requests, but you never suffer surprise mid-day evictions. You pick up correct values naturally on every rollout.
Now the rule you cannot violate:
Do not run VPA in
Auto/Recreatemode and an HPA on the same resource metric for the same workload. If the HPA scales replicas on CPU utilization while VPA simultaneously rewrites the CPU request, they enter a feedback loop — VPA raises the request, which lowers measured utilization, which makes the HPA scale down, and the controllers fight. The official guidance is explicit: VPA must not be used with the HPA on CPU or memory.
This is the most common way teams break themselves with VPA. Memorize it.
6. Combining VPA and HPA correctly
You can absolutely use both — just keep them on different signals. Let the HPA scale replicas on a custom or external metric (queue depth, requests-per-second, p95 latency) and let VPA own CPU/memory requests. They no longer overlap.
HPA on a custom metric (replicas only — no CPU/memory resource metric here):
apiVersion: autoscaling/v2
kind: HorizontalPodAutoscaler
metadata:
  name: checkout
  namespace: shop
spec:
  scaleTargetRef:
    apiVersion: apps/v1
    kind: Deployment
    name: checkout
  minReplicas: 3
  maxReplicas: 30
  metrics:
    - type: Pods
      pods:
        metric:
          name: http_requests_per_second
        target:
          type: AverageValue
          averageValue: "200"
VPA owning requests, scoped to CPU and memory only:
apiVersion: autoscaling.k8s.io/v1
kind: VerticalPodAutoscaler
metadata:
  name: checkout
  namespace: shop
spec:
  targetRef:
    apiVersion: apps/v1
    kind: Deployment
    name: checkout
  updatePolicy:
    updateMode: "Initial"
  resourcePolicy:
    containerPolicies:
    - containerName: checkout
      controlledResources: ["cpu", "memory"]
The HPA decides how many pods; VPA decides how big each one is — orthogonal axes, no feedback loop.
7. Right-sizing is half the battle: fix bin-packing too
Correct requests only pay off if the scheduler can pack them densely. Three levers:
Scheduler scoring. The default kube-scheduler NodeResourcesFit plugin uses LeastAllocated scoring, which spreads pods for resilience. For cost-driven node pools, switch to MostAllocated so the scheduler fills nodes before opening new ones — this is what makes the autoscaler able to drain and remove a node:
apiVersion: kubescheduler.config.k8s.io/v1
kind: KubeSchedulerConfiguration
profiles:
  - schedulerName: default-scheduler
    pluginConfig:
      - name: NodeResourcesFit
        args:
          scoringStrategy:
            type: MostAllocated
            resources:
              - name: cpu
                weight: 1
              - name: memory
                weight: 1
Node sizing. Bin-packing is a geometry problem. If your largest pod requests 6 GiB and your nodes are 8 GiB, you waste the remainder on every node. Match node shape to the request distribution you measured in step 4. On Karpenter, let it choose instance types from the actual pending-pod requirements rather than pinning one family:
apiVersion: karpenter.sh/v1
kind: NodePool
metadata:
  name: general
spec:
  template:
    spec:
      requirements:
        - key: karpenter.k8s.aws/instance-category
          operator: In
          values: ["c", "m", "r"]
        - key: karpenter.k8s.aws/instance-cpu
          operator: In
          values: ["4", "8", "16"]
  disruption:
    consolidationPolicy: WhenEmptyOrUnderutilized
    consolidateAfter: 1m
Consolidation. Karpenter’s WhenEmptyOrUnderutilized policy actively recomputes whether the current pods would fit on fewer or cheaper nodes and replaces them when they would. Right-sized requests are the input that makes consolidation aggressive — shrink the requests and Karpenter discovers it can delete nodes. Cluster Autoscaler offers a weaker version via --scale-down-utilization-threshold.
Verify
Prove the change end to end rather than trusting the dashboard.
# 1. Recommendations exist and have stabilized (upperBound no longer huge)
kubectl describe vpa checkout -n shop | sed -n '/Recommendation/,/Events/p'

# 2. Pods actually picked up the new requests after a rollout
kubectl get pods -n shop -l app=checkout \
  -o custom-columns=NAME:.metadata.name,\
CPU_REQ:.spec.containers[0].resources.requests.cpu,\
MEM_REQ:.spec.containers[0].resources.requests.memory

# 3. QoS is Guaranteed for memory-sensitive pods
kubectl get pod -n shop -l app=checkout \
  -o jsonpath='{.items[*].status.qosClass}{"\n"}'

# 4. No new OOMKills since the change
kubectl get events -n shop --field-selector reason=OOMKilling

# 5. Real allocation vs capacity per node (the bin-packing payoff)
kubectl describe nodes | grep -A6 "Allocated resources"
A successful right-sizing shows: requests near target, qosClass: Guaranteed, zero fresh OOMKilling events, and node “Allocated resources” climbing toward 70-80% of allocatable while node count drops.
Enterprise scenario
A payments platform team ran ~140 microservices on EKS, every Deployment copied from one Helm template with requests.cpu: 1 and requests.memory: 2Gi. Cluster cost was roughly 38,000 USD/month at 22% average CPU utilization — and despite that slack, three JVM services OOMKilled nightly because 2Gi was below their actual heap-plus-metaspace peak. Classic dual failure: massively over-provisioned on aggregate, under-provisioned where it mattered.
The constraint: those same services already ran HPAs on CPU utilization, so they could not simply flip VPA to Auto — that would have pitted the two controllers against each other on the CPU metric.
The fix, staged over three weeks:
- Deployed VPA in
updateMode: "Off"fleet-wide for one week to collect recommendations with zero production risk. - Re-platformed the HPAs off CPU onto a Prometheus custom metric (in-flight requests per pod via the Prometheus Adapter), freeing CPU/memory for VPA to own.
- Switched VPA to
updateMode: "Initial"so requests right-sized on each rollout without surprise evictions, with aminAllowed.memoryfloor on the JVM services so the recommender never proposed below their measured heap peak. - Set the cost node pool’s scheduler profile to
MostAllocatedand enabled KarpenterWhenEmptyOrUnderutilizedconsolidation.
The result over the next billing cycle: average CPU utilization rose from 22% to 61%, node count fell by 44%, monthly spend dropped from ~38,000 to ~21,000 USD, and the nightly OOMKills went to zero because the JVM services finally got Guaranteed memory at their real footprint. The custom-metric HPA snippet that unblocked everything:
metrics:
  - type: Pods
    pods:
      metric:
        name: http_inflight_requests
      target:
        type: AverageValue
        averageValue: "50"
The non-obvious lesson: the savings did not come from VPA alone. VPA produced correct requests, but the money only materialized once
MostAllocatedscheduling plus Karpenter consolidation could act on those smaller requests and physically delete nodes. Right-sizing without consolidation just leaves the freed capacity stranded.
Going deeper
Everything above is enough to right-size safely. This section is for the reader who wants to know why the numbers come out the way they do, and where the edges are.
How the recommender actually computes the numbers
The recommender does not average raw usage. For each container it maintains exponentially-decaying histograms of CPU and memory samples, scraped from the metrics API (every ~1 minute by default) and persisted to VerticalPodAutoscalerCheckpoint objects so a restart does not lose history. Two properties matter:
- Decay / half-life. Older samples are weighted down with a half-life of roughly 24 hours, so the recommendation tracks recent behaviour but is not whipsawed by a single spike. This is why a week of data is better than a day — the histogram has seen a full weekly shape before its oldest samples fade.
- Different statistics per resource. CPU
targetis taken near the p90 of the usage histogram (you want headroom for spikes but a few busy moments are fine), while memorytargetis driven by the peak over a sliding window (roughly 8 days) because exceeding memory is fatal, not slow. Both then get a safety margin (~15% by default via--recommendation-margin-fraction).
lowerBound and upperBound are the same target computed at lower and higher confidence. Early in the window, confidence is low, so a confidence multiplier inflates upperBound dramatically — that is the “upperBound is huge at first” behaviour, not a bug. As samples accumulate, the multiplier shrinks and the band [lowerBound, upperBound] tightens around target. The practical rule stands: act on target, watch lowerBound for risk, ignore upperBound until it settles.
Why Auto evicts — and where in-place resize changes that
Historically a running pod’s resources.requests were immutable — you could not change them without recreating the pod. That is why VPA Auto/Recreate works by eviction: the updater deletes an out-of-bounds pod, the Deployment controller makes a replacement, and the admission-controller webhook rewrites the new pod’s requests on the way in. The disruption is real, which is exactly why you stage Off → Initial before ever considering Auto.
The direction of travel is in-place pod vertical scaling (KEP-1287). Kubernetes added a resize subresource that patches a running pod’s CPU/memory requests without recreating it; the feature reached beta and is on by default in v1.33 (InPlacePodVerticalScaling). CPU changes apply live; memory increases apply live, while memory decreases may require a container restart depending on the resizePolicy. VPA is wiring this in through an alpha InPlaceOrRecreate update mode that tries an in-place resize first and falls back to eviction. When that matures, “VPA in production” stops meaning “accept surprise evictions” — which is the last real objection to Auto.
Requests drive scheduling: allocatable, scoring, and bin-packing
Two subtleties trip up even experienced engineers:
- Allocatable, not capacity. The scheduler packs against a node’s
allocatable, which iscapacityminuskube-reserved,system-reserved, and the eviction threshold. A “16 GiB” node might expose only ~14.5 GiB allocatable. Bin-packing math that uses the marketing size over-commits and triggers evictions. - Scoring is a spectrum.
NodeResourcesFitsupports three scoring strategies:LeastAllocated(default — spreads pods, good for resilience and burst headroom),MostAllocated(packs tightly, good for cost so the autoscaler can drain empty nodes), andRequestedToCapacityRatio(a tunable curve between them). Bin-packing is only NP-hard in the abstract; in practiceMostAllocatedplus correct requests plus consolidation gets you most of the win.
The efficiency you are chasing is requests / allocatable per node trending to 70-80%. You cannot safely target 100%: you need slack for the kubelet, daemonsets, and rollout surge. Push node “Allocated resources” too high and a single node loss cannot be absorbed by the survivors.
The HPA × VPA conflict, formally
The conflict is not a bug, it is a shared variable. HPA’s core formula is desiredReplicas = ceil(currentReplicas × currentUtilization / targetUtilization), where currentUtilization is measured as a percentage of the CPU request. VPA changes that request. So the instant VPA raises the request, the denominator grows, measured utilization falls, and HPA computes fewer replicas — while the extra per-pod capacity VPA just added was never needed. Two controllers, one feedback loop, no stable point.
The clean decoupling: put HPA on a signal that does not involve the request — requests-per-second, queue depth, p95 latency, an external SQS depth — and scope VPA to controlledResources: ["cpu", "memory"]. Now HPA owns the count axis and VPA owns the size axis with no shared term. (A future Kubernetes “multidimensional” autoscaler aims to coordinate both, but as of today the safe answer is separate signals.) For the full HPA internals, see the HPA and VPA deep dive.
The cost signal: slack, utilization, and what actually saves money
Two “utilization” numbers get confused, and the difference is the whole FinOps conversation:
- Requests efficiency =
usage / requests. Low here means your requests are wrong (VPA fixes this). - Node efficiency =
requests / allocatable. Low here means your bin-packing is wrong (scheduler scoring + consolidation fix this).
The gap requests − usage is slack: reserved-but-idle capacity you pay for. Right-sizing shrinks per-pod slack; consolidation converts that shrunk slack into deleted nodes. Miss either half and you save nothing — VPA without consolidation just strands the freed capacity, and consolidation without VPA has no slack to reclaim. Tools like OpenCost / Kubecost quantify both numbers per namespace; pair this lesson with cost allocation and right-sizing with Kubecost to close the loop with dollars, not just cores.
Practice challenges
Work these in order — they escalate from reading a spec to reasoning about cluster economics. Try each before opening the solution.
Challenge 1 (beginner): name the QoS class. A pod has one container with requests: {cpu: 200m, memory: 256Mi} and limits: {cpu: 500m, memory: 256Mi}. What is its QoS class, and is its memory protected from OOMKill under node pressure?
<details> <summary>Solution</summary>
Burstable. For Guaranteed, every resource must have request == limit. Here memory matches (256Mi == 256Mi) but CPU does not (200m ≠ 500m), so the pod is Burstable. Its memory is well-protected in practice — it can never exceed its 256Mi request-equals-limit, so it will not be OOMKilled for overshooting its own limit — but at the node level a Burstable pod is still evicted before a Guaranteed one. The CPU limit here also risks throttling; dropping it would remove that risk at no capacity cost.
</details>
Challenge 2 (beginner): read the recommendation. VPA reports target: {cpu: 300m, memory: 512Mi}, lowerBound: {cpu: 280m, memory: 500Mi}, upperBound: {cpu: 340m, memory: 540Mi}. Your Deployment currently requests cpu: 1, memory: 2Gi. What do you change, and how confident is the recommendation?
<details> <summary>Solution</summary>
Set requests to the target: cpu: 300m, memory: 512Mi, and set the memory limit to 512Mi (== request) for Guaranteed memory; drop or loosen the CPU limit. Confidence is high — the [lowerBound, upperBound] band is tight around target (within ~10%), meaning the histogram has enough data. Your current 2Gi request sits far above upperBound (540Mi), which is the textbook signal of memory over-provisioning: you are paying for ~1.5Gi of idle reservation per replica.
</details>
Challenge 3 (intermediate): write a safe Off-mode VPA. Write a VerticalPodAutoscaler for a Deployment api in namespace prod, in recommendation-only mode, that (a) controls both CPU and memory on container api, (b) never recommends below memory: 512Mi (a JVM floor), and © completely ignores an otel-agent sidecar.
<details> <summary>Solution</summary>
apiVersion: autoscaling.k8s.io/v1
kind: VerticalPodAutoscaler
metadata:
  name: api
  namespace: prod
spec:
  targetRef:
    apiVersion: apps/v1
    kind: Deployment
    name: api
  updatePolicy:
    updateMode: "Off"
  resourcePolicy:
    containerPolicies:
    - containerName: api
      minAllowed:
        memory: 512Mi
      controlledResources: ["cpu", "memory"]
    - containerName: otel-agent
      mode: "Off"
updateMode: "Off" makes it pure telemetry; minAllowed.memory protects the JVM heap floor; the per-container mode: "Off" on the sidecar stops VPA from ever touching it.
</details>
Challenge 4 (intermediate): find and fix the conflict. A team runs this pair on the same Deployment. What breaks, and what is the minimal fix?
# HPA
metrics:
  - type: Resource
    resource:
      name: cpu
      target: { type: Utilization, averageUtilization: 70 }
---
# VPA
updatePolicy: { updateMode: "Auto" }
resourcePolicy:
  containerPolicies:
  - containerName: web
    controlledResources: ["cpu", "memory"]
<details> <summary>Solution</summary>
They fight on CPU. The HPA scales replicas on CPU utilization (a percentage of the CPU request) while VPA in Auto mode rewrites that CPU request — the classic feedback loop where a bigger request lowers utilization and makes the HPA scale down. Two minimal fixes, pick one: (a) move the HPA onto a non-request metric (RPS, queue depth) and keep VPA owning CPU/memory; or (b) if you must keep the HPA on CPU, scope VPA to memory only with controlledResources: ["memory"] so the two never share a dimension. Option (a) is preferred in production.
</details>
Challenge 5 (advanced): bin-packing geometry. Nodes expose 14.5 GiB allocatable memory (16 GiB minus reservations). Each pod requests memory: 3Gi. (a) How many pods fit per node and how much is wasted? (b) You right-size the request to 2Gi. Now how many fit, and what is the memory efficiency? © Which scheduler scoring strategy turns this into fewer nodes?
<details> <summary>Solution</summary>
(a) floor(14.5 / 3) = 4 pods per node (12 GiB used), wasting 2.5 GiB per node (~17%). (b) At 2Gi: floor(14.5 / 2) = 7 pods per node (14 GiB used), efficiency 14 / 14.5 ≈ 97% on the nodes that are full. Right-sizing from 3Gi to 2Gi raised density from 4 to 7 pods — a 75% increase in pods per node, so the same fleet needs far fewer nodes. © MostAllocated (or a RequestedToCapacityRatio curve favouring high utilization) packs nodes full so the autoscaler/Karpenter can drain and delete the now-empty ones. Without a packing strategy, LeastAllocated would spread the pods thin and strand the savings.
</details>
Challenge 6 (advanced): where do the dollars come from? After VPA, per-pod requests drop from cpu: 1, memory: 2Gi to cpu: 300m, memory: 700Mi across 200 pods, but your monthly bill is unchanged. Node count and cost are flat. What single thing is missing, and how do you confirm it?
<details> <summary>Solution</summary>
Consolidation is missing. VPA shrank the requests (slack per pod fell), but nothing repacked the pods onto fewer nodes, so the freed capacity is stranded — requests / allocatable per node is now low but node count did not change. Confirm with kubectl describe nodes | grep -A6 "Allocated resources": you will see allocation percentages well below 70-80%. Fix: set the cost node pool’s scheduler profile to MostAllocated and enable Karpenter WhenEmptyOrUnderutilized (or Cluster Autoscaler’s --scale-down-utilization-threshold) so the smaller requests actually translate into deleted nodes. Right-sizing sets up the saving; consolidation banks it.
</details>
Common beginner mistakes
- Setting no requests at all. “It scheduled fine, so it’s fine.” A pod with no requests is
BestEffort— first in line for eviction under node pressure and invisible to the scheduler’s packing math (it counts as zero, so nodes get over-committed). Right mental model: requests are not optional tuning, they are the pod’s declared footprint. Always set at least memory and CPU requests on the main container. - Believing
Guaranteedneedslimits == requestson both CPU and memory to be worth it. Half-true, half-trap.GuaranteedQoS does require request == limit for every resource — but the goal is aGuaranteed-for-memory outcome, and a tight CPU limit to achieve it usually hurts by adding throttling. Right mental model: pin memory request == limit forGuaranteed-grade memory safety; leave CPU limit off or generous because CPU is compressible. You do not need a CPU limit to be safe. - Adding CPU limits “to be safe.” A CPU limit does not protect the node (requests already reserve capacity) — it only caps your own pod and causes CFS throttling: your latency-sensitive service gets periodically frozen even while the node has idle cores. Right mental model: CPU limits are a latency footgun, not a safety belt. Reserve with the request; only add a CPU limit when you have a hard multi-tenant isolation requirement and have measured the throttling cost.
- Running VPA
Autoand an HPA on the same CPU/memory metric. They enter a feedback loop and thrash. Right mental model: HPA owns how many pods, VPA owns how big — but only if they read different signals. Put HPA on a custom/external metric, or scope VPA to memory only. - Right-sizing once and never again. Traffic patterns, code paths, and dependencies drift; last quarter’s
targetis this quarter’s over- or under-provisioning. Right mental model: right-sizing is a control loop, not a one-time cleanup. Leave a VPA inOff(orInitial) running permanently so the recommendation stays live, and revisit when it diverges from the deployed request. - Acting on
upperBoundearly. Beginners see a scary-largeupperBoundright after deploying VPA and provision to it. Right mental model:upperBoundis inflated by low confidence and shrinks with data — it is a risk ceiling, not a target. Act ontarget; ignoreupperBounduntil the band settles.
Glossary
- Request — the amount of CPU/memory a container reserves. The scheduler sums requests to place pods; reserved whether used or not.
- Limit — the hard ceiling the kernel enforces via cgroups. Over the CPU limit → throttled; over the memory limit → OOMKilled.
- Millicore (
m) — CPU unit;1000m= 1 vCPU/core. CPU is fractional and time-shared. MivsM—Mi= mebibyte (1024² bytes), what tools report;M= megabyte (10⁶ bytes), smaller.256Mi≠256M.- Compressible vs incompressible — CPU is compressible (you can give less by making a process wait); memory is incompressible (the only way to reclaim it is to kill the process). This is why CPU is throttled and memory is killed.
- OOMKilled — the kernel’s Out-Of-Memory killer terminates a container that exceeds its memory limit (or the node runs out); the kubelet restarts it, and repeated kills show as
CrashLoopBackOff. - CFS throttling — the Linux Completely Fair Scheduler enforces a CPU limit by pausing the container when it exhausts its quota in a period; shows up as latency spikes, not restarts.
- QoS class —
Guaranteed(request == limit for every resource),Burstable(some requests set, not Guaranteed),BestEffort(nothing set). Decides eviction order under node pressure;BestEffortgoes first. - VPA (Vertical Pod Autoscaler) — an add-on that measures real usage and recommends/sets right-sized CPU/memory requests. Three components: recommender, updater, admission controller.
- Recommender / Updater / Admission controller — VPA’s three parts: the recommender computes the numbers, the updater evicts out-of-bounds pods (in
Auto/Recreate), the admission webhook rewrites requests at pod creation. target/lowerBound/upperBound/uncappedTarget— the recommendation:targetis the number to use;lowerBoundis the under-provisioned floor (risk);upperBoundis the wasteful ceiling (inflated early);uncappedTargetistargetignoring your min/max caps.updateMode—Off(recommend only),Initial(apply at pod creation),Recreate(evict when out of bounds),Auto(currently == Recreate, moving toward in-place).- In-place pod resize (KEP-1287) — changing a running pod’s requests via the
resizesubresource without recreating it; beta and on by default in Kubernetes v1.33. resourcePolicy/minAllowed/maxAllowed/controlledResources— VPA constraints: floor, ceiling, and which resources (cpu/memory) VPA is allowed to manage per container.- Allocatable vs capacity —
capacityis the node’s total;allocatableis what pods can use afterkube-reserved,system-reserved, and the eviction threshold. The scheduler packs against allocatable. - Bin-packing — fitting pods (by their requests) onto the fewest nodes. Denser packing → fewer nodes → lower cost.
NodeResourcesFit/LeastAllocated/MostAllocated— the scheduler plugin and its scoring strategies:LeastAllocatedspreads (default, resilient),MostAllocatedpacks (cost-efficient).- Consolidation — a cluster-autoscaler/Karpenter action that repacks pods onto fewer/cheaper nodes and deletes the emptied ones (Karpenter
WhenEmptyOrUnderutilized). - HPA (Horizontal Pod Autoscaler) — scales the number of replicas on a metric; conflicts with VPA when both key off the same CPU/memory request.
- Slack —
requests − usage: reserved-but-idle capacity you pay for. Right-sizing shrinks it; consolidation converts it to deleted nodes. - metrics-server — the cluster add-on that serves live CPU/memory via
metrics.k8s.io; powerskubectl topand feeds the VPA recommender.