In a nutshell
Kubernetes was built to pack many workloads onto shared machines — that density is what makes it efficient. But the same packing is what makes its cost impossible to read. Your cloud provider bills you for a node (a virtual machine), yet a single node runs dozens of pods that belong to different teams, products, and features. So when the invoice says “₹40 lakh of compute this month,” nobody can tell you how much of it was the checkout service, how much was the nightly batch job, and how much was simply reserved and never used.
Picture a cloud invoice as the bill for a restaurant table of forty where the receipt just reads “Food: ₹40,000.” Fine for the restaurant; useless to the forty people trying to work out who ordered what. Kubecost and OpenCost are the itemized bill. They take that one big number and split it back out — this namespace, this deployment, this team=payments label cost this many rupees this hour, broken into CPU, memory, GPU, storage, and network — and they flag the dishes nobody touched: the idle reserved capacity you paid for anyway.
OpenCost is the open-source engine and specification (a CNCF project); Kubecost is the product built on top of it, adding a polished UI, multi-cluster views, and automated rightsizing advice. Both answer the two questions every platform team eventually has to answer: “who owes what?” (cost allocation) and “where are we paying for capacity we don’t use?” (rightsizing). Answer those and you can bill costs back to the teams that caused them and shrink the bill without slowing anything down.
By the end of this lesson you will be able to install either tool, read an allocation and spot the waste inside it, understand how the numbers are actually computed, and turn a single “compute” line into a per-team, per-product number a CFO will trust.
Level: Beginner → Advanced · Time: ~38 min read · You’ll need: basic kubectl, and the ideas of pods, namespaces, requests/limits, and labels (earlier lessons cover these).
A direct-to-consumer health-insurance carrier finishes a year of aggressive migration onto Kubernetes — claims adjudication, member portal, a fraud-scoring service, and a quoting engine all now run as namespaces on a handful of large EKS, AKS, and GKE clusters — and the CFO opens the consolidated cloud bill to a single, useless number: ₹4.1 crore a month of “compute,” with no idea which product line, which team, or which feature drove it. Worse, the platform team’s own dashboards show cluster CPU averaging 19% utilization, which means the company is paying for roughly five nodes’ worth of capacity to do one node’s worth of work. The actuarial side of an insurer lives and dies by unit economics — cost per policy, cost per claim — and right now the single largest variable cost in the business is a black box. The mandate from the CFO and the VP of Engineering is blunt: “Tell me what each product costs to run, stop paying for idle, and bill it back to the P&L that caused it.” This article is the reference architecture for doing exactly that — a Kubernetes cost-allocation, rightsizing, and chargeback platform built around Kubecost that a FinOps lead, a platform engineer, and a finance controller will all trust.
The pressures here are the FinOps pressures, and they stack the way they always do once Kubernetes adoption crosses a threshold. Opacity is the first: a cloud provider bills you per node, per disk, per load balancer — but a node runs forty pods from six teams, so the provider’s invoice can never tell you who spent what. Waste is the second: developers set CPU and memory requests by guessing high “to be safe,” the scheduler reserves that capacity whether or not it is used, and idle reservation is invisible on any utilization graph that only shows actual usage. Accountability is the third: until a cost lands on a team’s own budget, no one has a reason to fix it. Kubecost is the pattern that addresses all three at once — it reconstructs the cloud bill at the pod, namespace, and label level, attributes shared and idle cost honestly, and turns “compute” into a per-team, per-product line item that a chargeback process can act on.
Why not the obvious shortcuts
The naive fixes each fail predictably, and naming why matters because someone on the project will propose all three in the first week.
Reading the cloud provider’s cost console (Cost Explorer, Azure Cost Management, GCP Billing) gets you cost per node, never cost per namespace. The provider has no idea that node ip-10-2-4-9 ran the claims service and the fraud scorer side by side; it sees an EC2 instance. You can tag the node, but you cannot tag the forty pods sharing it, so the granularity you actually need does not exist at that layer.
Tagging Kubernetes resources and hoping the bill follows breaks because the unit of billing (the node) and the unit of work (the pod) are different objects with different lifetimes. A node lives for days; a pod lives for minutes. No tag on the node can follow the churn of pods scheduled onto it through the day.
Eyeballing utilization dashboards and resizing by hand ignores the single most expensive number in the system — the gap between what pods request (and the scheduler therefore reserves and you pay for) and what they actually use. A pod requesting 2 CPU and burning 0.2 is 90% waste, but a usage graph showing 0.2 CPU looks healthy. Without request-vs-usage accounting, you optimize the wrong thing.
Kubecost threads the needle. It joins three streams the other approaches keep separate — the cloud provider’s actual billing data (so on-demand, Spot, Savings Plans, and committed-use discounts are reflected at real prices), Prometheus metrics for what each pod requested and used, and the Kubernetes API for the labels and ownership that map a pod back to a team and a product. From that join it produces an allocation: this namespace, with these labels, cost this many rupees this hour, broken into CPU, memory, GPU, storage, network, and load-balancer components, with idle and shared cost attributed rather than hidden.
Install it yourself: Kubecost or OpenCost
Before the big enterprise topology, it helps enormously to run one of these tools on a scratch cluster and watch it produce a number. There are two doors into the same room, and knowing which is which saves a lot of confusion.
OpenCost is the open-source core: a Go engine plus a community-owned specification for how to measure and attribute Kubernetes cost. Kubecost originally built it, donated it to the CNCF in June 2022, and it advanced to CNCF Incubating status in October 2024. It is Apache-2.0 licensed, free, vendor-neutral, and it is the allocation engine that runs inside every version of Kubecost. Kubecost is the product wrapped around that engine — a rich UI, multi-cluster federation, savings/rightsizing recommendations, alerts, and chargeback reporting — free for a single cluster and paid at enterprise scale (it is now an IBM/Apptio product). Pick OpenCost when you want a lightweight, embeddable, DIY cost signal; pick Kubecost when you want turnkey allocation, a dashboard finance can log into, and multi-cluster rollups.
| OpenCost | Kubecost | |
|---|---|---|
| What it is | CNCF open-source engine + specification | Product built on OpenCost (IBM/Apptio) |
| License / cost | Apache 2.0, free | Free tier (single cluster); paid for multi-cluster/enterprise |
| Interface | Minimal UI + HTTP API + Prometheus metrics | Full dashboards, savings, budgets, alerts |
| Prometheus | Bring your own | Bundled (or bring your own) |
| Multi-cluster | Single cluster (aggregate externally) | Federated, single cross-cluster view |
| Rightsizing | Raw allocation data via API | Built-in request rightsizing + automation |
| Best when | Vendor-neutral, embed in your own tooling | Turnkey allocation, chargeback, and UI |
Install Kubecost (bundles its own Prometheus, so it works on a fresh cluster with one command):
# Kubecost — the product. Bundles Prometheus + UI. Free for a single cluster.
helm install kubecost cost-analyzer \
  --repo https://kubecost.github.io/cost-analyzer/ \
  --namespace kubecost --create-namespace

# Open the dashboard
kubectl port-forward --namespace kubecost deployment/kubecost-cost-analyzer 9090
# browse http://localhost:9090
Install OpenCost (you point it at a Prometheus you already run — the standalone manifests were retired, so Helm is the supported path):
helm install opencost \
  --repo https://opencost.github.io/opencost-helm-chart opencost \
  --namespace opencost --create-namespace \
  -f opencost-values.yaml
# opencost-values.yaml — point OpenCost at an existing in-cluster Prometheus
opencost:
  prometheus:
    internal:
      enabled: true
      serviceName: prometheus-server
      namespaceName: monitoring
      port: 80
  ui:
    enabled: true
Either way, the fastest way to read an allocation from the terminal is the kubectl cost plugin (installed through krew), which talks to either backend:
kubectl krew install cost
kubectl cost namespace --window 7d --show-efficiency=true
# Representative output — not a live run from this machine.
+--------------------+-------------+----------------+-------------------+
| NAMESPACE          | CPU (7d)    | MEMORY (7d)    | TOTAL   EFFICIENCY|
+--------------------+-------------+----------------+-------------------+
| claims             | ₹1,10,300   | ₹58,900        | ₹2,60,000   0.55  |
| member-portal      | ₹52,400     | ₹41,200        | ₹1,20,000   0.60  |
| fraud-scoring      | ₹61,800     | ₹22,700        | ₹95,000     0.30  |
| quoting            | ₹41,300     | ₹22,100        | ₹80,000     0.09  |
| batch-reprocessing | ₹18,900     | ₹11,400        | ₹40,000     0.20  |
+--------------------+-------------+----------------+-------------------+
Two commands and you have gone from “compute: one number” to “here is each namespace, and here is how efficiently each spends.” The next section is about reading that efficiency column honestly.
Reading your first cost allocation
The atomic object in both tools is an allocation: a slice of spend attributed to a set of pods over a time window, then aggregated by a key you choose — namespace, controller (Deployment/StatefulSet), pod, or any label. It is fundamentally a group-by over the same underlying pod-hours. You query it in the UI, through kubectl cost, or straight from the HTTP API (/allocation on OpenCost, /model/allocation on Kubecost). Here is a representative namespace aggregate, trimmed to the fields that matter:
// GET /model/allocation?window=7d&aggregate=namespace  (representative, trimmed)
{
  "code": 200,
  "data": [
    {
      "quoting": {
        "name": "quoting",
        "cpuCoreRequestAverage": 2.0,
        "cpuCoreUsageAverage": 0.18,
        "cpuCost": 41.30,
        "cpuEfficiency": 0.09,
        "ramByteRequestAverage": 4294967296,
        "ramByteUsageAverage": 1181116006,
        "ramCost": 22.10,
        "ramEfficiency": 0.275,
        "gpuCost": 0.0,
        "pvCost": 3.40,
        "networkCost": 1.20,
        "loadBalancerCost": 6.00,
        "sharedCost": 4.90,
        "totalCost": 78.90,
        "totalEfficiency": 0.15
      }
    }
  ]
}
Read it top to bottom and the whole model reveals itself:
cpuCoreRequestAverage2.0 vscpuCoreUsageAverage0.18 — the quoting namespace reserves two CPU cores but actually burns under a fifth of one. That gap is the money.cpuEfficiency0.09 — usage divided by request: 9%. Ninety-one percent of the CPU you are paying for inside this namespace sits idle within its own reservation.cpuCost41.30 — the allocated CPU cost. Crucially, allocation prices the greater of request and usage (max(request, usage)), because the scheduler holds the request out of the node whether or not the pod uses it, and that reserved capacity is what you pay for. Efficiency, by contrast, isusage / request. Confusing the two is the most common misread of this data.ramCost/ramEfficiency— the same story for memory: 4 GiB requested, ~1.1 GiB used, 27.5% efficient.pvCost,networkCost,loadBalancerCost— the non-compute components almost everyone forgets. Persistent-volume storage, cross-zone/egress network, and the load balancer fronting the service all cost real money and all belong to this namespace.sharedCost4.90 — this namespace’s slice of shared overhead (kube-system, monitoring, a shared ingress) distributed onto it.totalEfficiency0.15 — the headline number: roughly 15 paise of compute value for every rupee of compute spend. That single figure tells you where to point the rightsizing effort.
Change one query parameter and the same pod-hours regroup for a different audience. aggregate=namespace answers “who owns what?” at the org level. aggregate=controller drills into which Deployment inside a namespace is the culprit. aggregate=label:team or aggregate=label:cost-center cuts across namespaces to produce the exact unit finance charges back against. Allocation is not a fixed report; it is a lens you rotate.
Turning a reading into a rightsizing. The quoting namespace requests 2.0 CPU but has, say, a 30-day p99 usage of 0.42 CPU. A safe rightsizing rule sets the request to the high-percentile usage plus headroom — p99 × ~1.2 ≈ 0.5 CPU — a four-fold cut in reserved CPU. To size the prize in rupees rather than ratios, multiply the wasted fraction by the cost: (1 − 0.09) × ₹41.30 ≈ ₹37.6 of CPU per week is reclaimable on this one namespace, plus (1 − 0.275) × ₹22.10 ≈ ₹16.0 of RAM. This is precisely what the Vertical Pod Autoscaler computes from the workload side: VPA’s target recommendation and Kubecost’s request recommendation are the same idea — requests should track real usage — but Kubecost attaches the price tag and rolls it up across the whole fleet.
Where idle hides. None of the fields above is idle in the strict sense; idle is a cluster-level quantity — the cost of node capacity that no pod reserved at all. Kubecost computes it as node cost − Σ(pod allocations). If your nodes cost ₹100 for the window and pods accounted for ₹60, then ₹40 is idle: bought, powered, and doing nothing. You choose whether to show it on its own line (a brutal first reckoning) or distribute it back to the teams whose over-requests created it (accountability). The next sections build the enterprise machinery around exactly these primitives.
Architecture overview
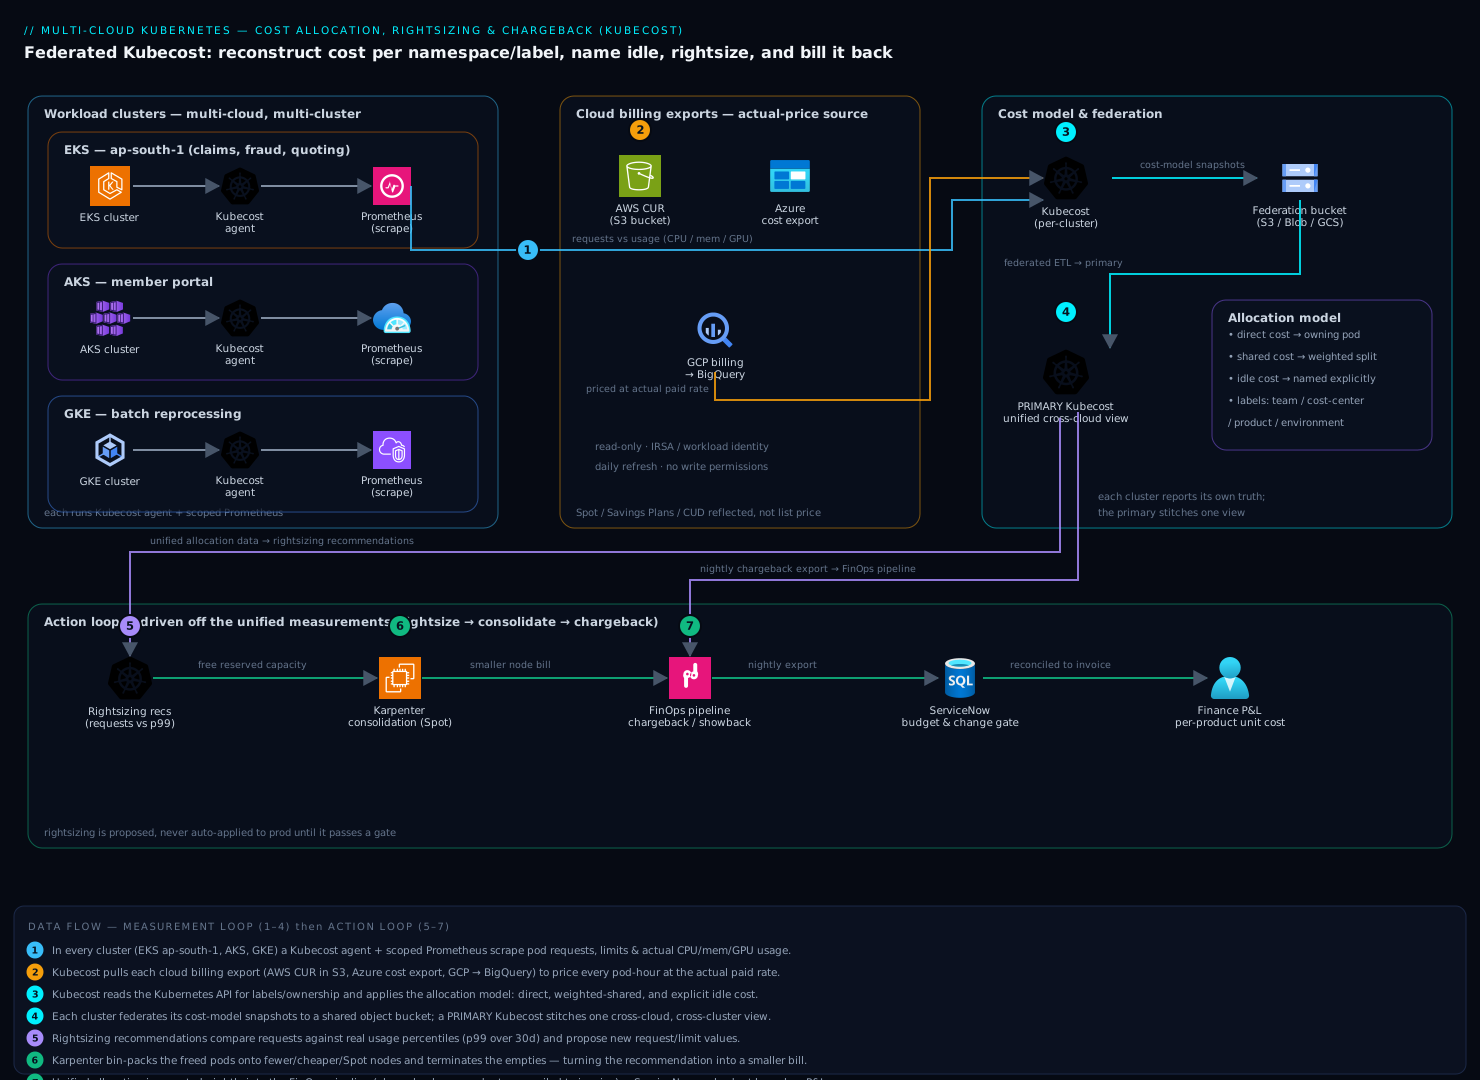
The platform runs two distinct loops that share data but live on different schedules: a measurement loop that continuously reconstructs cost from metrics and billing, and an action loop that turns those measurements into rightsizing changes, node consolidation, and a chargeback report. Keeping them separate in your head is the first step to operating this well — measurement must be trustworthy and read-only before anyone lets the action loop touch a workload.
The defining property of the topology is that Kubecost runs as a workload inside each cluster but federates its allocation data up to a single primary, so a multi-cluster, multi-cloud estate produces one coherent cost model rather than three disconnected ones. Each cluster reports its own truth; the primary stitches them into the number finance sees.
Measurement loop, following the data flow:
- In every cluster — the EKS clusters in
ap-south-1, the AKS cluster, and the GKE cluster — a Kubecost agent plus a scoped Prometheus scrape pod resource requests, limits, and actual CPU/memory/GPU usage at short intervals. This is the raw signal for “requested versus used.” - Kubecost pulls the cloud billing export for each provider — the AWS Cost and Usage Report (CUR) in S3, the Azure cost export, the GCP billing export to BigQuery — so it prices each pod-hour at the actual rate paid, honoring Spot/preemptible discounts, Savings Plans, and committed-use discounts rather than list price. Allocating at list price overstates discounted workloads and is the most common way these numbers lose finance’s trust.
- Kubecost reads the Kubernetes API for labels, annotations, namespaces, and controller ownership, and applies an allocation model: direct costs go to the owning pod; shared costs (the cluster’s control plane overhead, monitoring,
kube-system, a shared ingress) are split by a configured key — even, weighted, or proportional to each tenant’s usage; and idle cost (reserved-but-unused node capacity) is computed explicitly and either shown on its own or distributed to the teams whose over-requests caused it. - Each cluster’s Kubecost federates its allocation data — written as cost-model snapshots to an object-storage bucket (S3/Blob/GCS) — up to a primary Kubecost instance, which presents the unified, cross-cluster, cross-cloud view.
Action loop, independent and driven off those measurements:
- Kubecost’s rightsizing recommendations compare each workload’s requests against its real usage percentiles and propose new request/limit values — “this pod requests 2 CPU, has never exceeded 0.4 at p99 over 30 days, recommend 0.5.” These surface in the UI, via the API, and as Kubernetes events.
- At the node layer, Karpenter (on the EKS/AKS clusters) consolidates: as rightsized pods free up reserved capacity, Karpenter bin-packs them onto fewer, cheaper, often Spot nodes and terminates the now-empty ones — turning a rightsizing recommendation into an actual smaller bill.
- The unified allocation data is exported nightly into the company’s FinOps pipeline — a chargeback/showback report per product line, reconciled against the provider invoice, that finance loads into the P&L and that drives a ServiceNow request whenever a team’s spend breaches its budget.
Component breakdown
| Component | Service / tool | Role in the platform | Key configuration choices |
|---|---|---|---|
| Cost model | Kubecost | Joins billing + metrics + labels into per-namespace/label allocation | Federated multi-cluster; CUR/Azure/GCP cloud integration; idle split policy |
| Usage metrics | Prometheus | Scrapes pod requests, limits, actual CPU/mem/GPU usage | Short scrape interval; retention sized for percentile windows; per-cluster |
| Node provisioning | Karpenter | Consolidates pods onto fewer/cheaper nodes after rightsizing | Consolidation enabled; Spot-first with on-demand fallback; instance diversity |
| Identity / SSO | Okta + Entra ID | Workforce SSO into the Kubecost UI; team/cost-center claims | OIDC to Kubecost; group claims map to cost-center filters; conditional access |
| Secrets | HashiCorp Vault | Cloud billing-export creds, DB credentials, API tokens for the FinOps job | Dynamic leases; Vault Agent sidecar injection; no static keys in cluster |
| Cloud billing | AWS CUR / Azure export / GCP export | Actual-price source so discounts are reflected | CUR to S3; Azure cost export; GCP billing → BigQuery; daily refresh |
| ITSM / approvals | ServiceNow | Budget-breach tickets, rightsizing change requests, monthly chargeback record | Auto-ticket on threshold breach; change gate before prod rightsizing applies |
| Observability | Dynatrace / Datadog | Correlates cost spikes with deploys, traffic, and SLOs | Kubecost metrics scraped in; cost-vs-performance dashboard; anomaly alerts |
| CSPM / posture | Wiz / Wiz Code | Verifies Kubecost’s footprint is least-privilege and not publicly exposed | Agentless scan of the namespace + IAM; Wiz Code checks the Helm/Terraform |
| Runtime security | CrowdStrike Falcon | Runtime threat detection on the cluster nodes Kubecost observes | Sensor on node pools; detections to the SOC |
| CI / IaC | GitHub Actions / Jenkins + Argo CD + Terraform | Deploys Kubecost via GitOps; provisions billing exports and IAM | OIDC to cloud (no stored creds); Argo CD syncs the Helm release; policy gate |
| Config mgmt | Ansible | Bootstraps agents/exporters on legacy VM and virtual-appliance estate | Idempotent playbooks; same cost tags as the Kubernetes estate |
| Edge | Akamai | Fronts the internal Kubecost portal for distributed FinOps reviewers | TLS, WAF, access control to the dashboard origin |
A few of these choices deserve the why, because they are the ones teams get wrong.
Why actual-price billing integration, not list price. Kubecost can estimate cost from public on-demand rates with no cloud integration at all, and many teams stop there — then finance notices the Kubecost total does not reconcile with the invoice, because half the fleet runs on Spot at a 70% discount and a chunk is covered by a Savings Plan. Once the numbers disagree with the bill, every allocation is suspect. Wiring the CUR, the Azure export, and the GCP BigQuery export in means Kubecost prices each pod-hour at the real negotiated rate, and the sum of allocations reconciles to the provider invoice. That reconciliation is what earns the platform a seat in the actual P&L conversation.
Why idle cost must be named, not hidden. The single most expensive and least visible number in a Kubernetes estate is reserved-but-unused capacity. If a team requests 2 CPU and uses 0.2, the other 1.8 is paid for and doing nothing — and it appears nowhere on a usage graph. Kubecost computes idle explicitly as the difference between what nodes cost and what pods actually consumed, and lets you choose where it lands: shown as its own line (good for a first reckoning — “we are paying ₹70 lakh a month for nothing”), or distributed back to the teams whose over-requests created it (good for accountability — it makes the team that guessed high feel the cost). For this insurer we start with idle visible to shock the org, then switch to distributing it so the incentive to rightsize lands on the right desk.
Why allocate on labels, not just namespaces. Namespace-level allocation is the easy 80%, but an insurer’s claims namespace contains both the adjudication engine and a batch reprocessing job that belong to different cost centers, and the member portal serves three products. Kubecost allocates on any label or annotation, so the real unit of accounting is a label convention — team, cost-center, product, environment — enforced on every workload. The architecture is only as good as that labeling discipline; without it, cost lands in an “unallocated” bucket that finance will not accept.
Implementation guidance
Provision with Terraform and deploy with GitOps; treat the billing integration as the first deliverable. The order matters because allocation without real prices is worse than useless — it is confidently wrong.
- Terraform creates the cloud billing exports and the least-privilege read roles Kubecost needs: the CUR to an S3 bucket with an IAM role Kubecost assumes via IRSA, the Azure cost export with a scoped reader identity, and the GCP billing export to BigQuery with a service account. No write permissions anywhere — Kubecost reads cost, it never moves money.
- Terraform stands up the Prometheus/agent prerequisites and the federation object-storage bucket the primary reads from.
- Argo CD syncs the Kubecost Helm release into each cluster from a Git repo, so the cost platform’s own configuration is version-controlled, reviewable, and revertable — the same GitOps discipline as everything else on the cluster. The CI that lints and bumps that chart runs in GitHub Actions (or Jenkins on the teams that still standardize on it), authenticating to the cloud via OIDC so there is no stored service-principal secret to leak.
- Designate one cluster’s Kubecost as the primary and point the others at the shared bucket for federation.
A minimal values shape for a federated agent cluster communicates the intent — read-only billing, federated up, idle made explicit:
# kubecost-values.yaml (agent cluster)
kubecostProductConfigs:
  clusterName: "eks-claims-aps1"
  shareCostsWithAggregator: true          # federate to the primary
federatedETL:
  federatedCluster: true
  primaryCluster: false
  federatedStorageConfigSecret: "kubecost-federated-store"  # S3/Blob/GCS
prometheus:
  server:
    retention: "32d"                      # cover the 30d percentile window
serviceAccount:
  annotations:
    eks.amazonaws.com/role-arn: "arn:aws:iam::...:role/kubecost-cur-read"  # IRSA, read-only
And the allocation policy that decides where idle and shared cost go — the most consequential lines in the whole config:
sharedNamespaces: "kube-system,monitoring,kubecost"
idle: true                 # compute idle explicitly
idleByNode: true           # attribute idle to the node, then to over-requesting tenants
shareTenancyCosts: true    # spread control-plane/shared cost across tenants
sharingStrategy: "weighted" # proportional to each tenant's usage
Identity: federate the humans, kill the static keys. The Kubecost UI is gated by Okta as the workforce IdP (brokered to Entra ID for the teams whose Azure resources expect a native Entra token), so a FinOps reviewer logs in with corporate SSO and conditional-access policies, and the group claims map them to the cost centers they are allowed to see — a product owner sees their product’s spend, not the whole estate. The few secrets Kubecost and the nightly FinOps job genuinely need — the database credential for Kubecost’s durable store, the token the export job uses to push the chargeback report — live in HashiCorp Vault, leased dynamically and injected by the Vault Agent sidecar, so they are short-lived and never written to a Kubernetes Secret or a Helm value. The cloud billing reads themselves use IRSA / workload identity, so there is no static cloud key in the cluster at all.
Labeling discipline is the real prerequisite. Before the first allocation is trustworthy, every workload must carry the cost labels. Enforce them at admission with a policy engine (an OPA/Kyverno rule that rejects a Deployment lacking team and cost-center), and bootstrap the legacy estate the same way: Ansible playbooks stamp the equivalent cost tags onto the VM and virtual-appliance fleet (the still-on-VM quoting components, the network virtual appliances fronting the clusters) so finance gets one cost taxonomy across containerized and non-containerized infrastructure, not two that never reconcile.
Enterprise considerations
Security & least privilege. A cost tool is a tempting target precisely because it has read access to billing and to the whole cluster’s metadata — so scope it hard. Kubecost gets read-only cloud billing roles via IRSA/workload identity (never a key), a read-mostly Kubernetes RBAC role, and no ability to mutate workloads in the measurement loop. The action loop’s rightsizing is proposed, not auto-applied to production, until it passes a gate (below). Wiz / Wiz Code runs continuous posture scanning across the Kubecost namespace and its IAM, alerting the moment the dashboard drifts to public exposure or the billing role widens beyond read — and Wiz Code checks the Helm values and Terraform in the pull request, before the misconfiguration ever ships. CrowdStrike Falcon sensors on the node pools provide runtime threat detection for the nodes Kubecost observes, feeding the SOC. The internal Kubecost portal sits behind Akamai for TLS, WAF, and access control, so the dashboard is not directly internet-exposed.
Cost optimization — the whole point, applied to itself and the estate.
| Lever | Mechanism | Typical effect |
|---|---|---|
| Rightsizing requests | Set requests to p95–p99 of real usage, not a guess | Reclaims the request-vs-usage gap; often 40–60% of “compute” |
| Karpenter consolidation | Bin-pack freed pods onto fewer/cheaper/Spot nodes, terminate empties | Turns reclaimed requests into a smaller node bill |
| Spot / preemptible | Run interruptible workloads (batch reprocessing) on Spot | ~60–80% off those node-hours |
| Idle attribution | Distribute idle to over-requesting teams | Creates the incentive that drives rightsizing |
| Commitment coverage | Use Kubecost’s reservation data to size Savings Plans/CUDs | Discounts the steady baseline the fleet always runs |
The sequence matters: rightsize first, then let Karpenter consolidate. Rightsizing alone only changes a number in a manifest — the bill does not move until the freed capacity lets Karpenter pack workloads onto fewer nodes and delete the empty ones. Run them out of order and you will report “savings” finance never sees on the invoice. (The mechanics of consolidation, Spot diversification, and disruption budgets are the subject of Deploy Karpenter on EKS.)
Scalability. Each piece scales independently. Prometheus is the usual ceiling — high pod churn and short scrape intervals across many clusters generate serious cardinality — so size retention to exactly the percentile window you need (32 days for a 30-day p99, no more) and federate rather than centralizing one giant Prometheus. Kubecost’s federated-ETL model scales to dozens of clusters because each cluster does its own heavy lifting and only ships compact cost snapshots to the primary. The FinOps export job is nightly batch, so it scales trivially.
Failure modes, and what each one looks like. Name them before they mislead finance.
- Allocations that do not reconcile with the invoice — the cloud integration is missing or misconfigured, so Kubecost prices at list while the bill reflects Spot and Savings Plans. Mitigation: wire the CUR/Azure/GCP export on day one and assert reconciliation (Kubecost total vs invoice within a few percent) as a monitored check.
- A flood of “unallocated” cost — workloads are missing the cost labels, so spend lands in a bucket finance rejects. Mitigation: admission-policy enforcement of
team/cost-center, and an alert when unallocated exceeds a threshold. - Prometheus gaps — the scrape pod restarts or runs out of retention, and the usage percentiles that drive rightsizing are computed on incomplete data, producing dangerously low recommendations. Mitigation: retention sized to the window, and rightsizing that requires a minimum data-completeness before it recommends.
- An over-aggressive rightsizing applied to prod — requests cut to p95 leave no headroom for a traffic spike, and pods get OOM-killed or CPU-throttled mid-incident. Mitigation: recommend to p99 with a safety margin, never auto-apply to prod, and gate changes through ServiceNow (below).
- Karpenter consolidating a workload that cannot tolerate disruption — a stateful or singleton pod gets evicted during bin-packing. Mitigation: PodDisruptionBudgets and
do-not-disruptannotations on the workloads that need them.
Reliability. Kubecost being down does not take production down — it is an observability and accounting plane, not in the request path — but a gap in its data is a gap in the chargeback record, which finance treats as a real problem at month-end. Run Kubecost’s durable store (its database/object-storage ETL) with the same backup posture as any system of record, and keep the cloud billing exports (CUR in S3, the BigQuery export) as the geo-durable source of truth from which the cost model can always be rebuilt. A pragmatic target: the dashboard can be down for hours without business impact, but no calendar day of allocation data may be permanently lost, because the monthly chargeback depends on every day.
Observability — and closing the loop with the rest of the stack. Kubecost exposes its allocation and efficiency metrics on a Prometheus endpoint, so scrape them into Dynatrace or Datadog and build the dashboard the business actually argues over: cost per namespace and per product, request-vs-usage efficiency, idle as a share of total, cost per claim / per policy (the unit economics the actuaries care about), and cost-per-deploy delta so a release that doubles a service’s spend is caught the day it ships, correlated against the trace and traffic data Dynatrace/Datadog already hold. That correlation — cost spike next to the deploy and the traffic that caused it — is what turns FinOps from a monthly autopsy into a same-day signal.
Governance and chargeback. The output of the whole platform is a monthly chargeback report, reconciled to the invoice, that finance loads into the P&L. Wrap it in process: a team breaching its budget auto-raises a ServiceNow request so there is a ticket and an owner, not just a red number on a dashboard; a production rightsizing change passes through a ServiceNow change gate before Argo CD applies it, giving the platform team a documented approval; and the chargeback figures themselves are version-controlled artifacts so a finance controller can audit how last quarter’s number was produced. Showback (visibility only) is the right first phase to build trust in the numbers; chargeback (the cost actually hits the team’s budget) is the phase that changes behavior — graduate from one to the other deliberately, once allocations reconcile and the teams believe them.
Explicit tradeoffs
Accept these or do not build it. Cost allocation in Kubernetes is genuinely hard because the billing unit (node) and the work unit (pod) are different objects, and Kubecost’s accuracy is bounded by two things you must invest in: a working cloud billing integration (without it, list-price estimates that will not reconcile) and disciplined labeling (without it, an unallocated bucket finance rejects). The idle and shared-cost attribution involves modeling choices — how you split shared cost, where idle lands — that are defensible but not objective, and you will defend them to a controller. Rightsizing trades cost against headroom: cut requests too close to observed usage and you save money right up until the traffic spike that OOM-kills the pod, so the safety margin is a real and permanent cost of the savings. And Karpenter consolidation trades cost against churn — fewer, cheaper nodes mean more pod rescheduling, which workloads that hate disruption will feel. None of this is free; it is cheaper than the black box.
The alternatives, and when they win. If you are a single small cluster with one team, the cloud provider’s own cost console plus node tags may be enough — the namespace granularity Kubecost provides only pays off once a cluster is genuinely multi-tenant. If you are all-in on one cloud and want a vendor-managed option, the provider’s native tooling (AWS Split Cost Allocation for EKS, GCP’s GKE cost allocation) covers the basic namespace split without running another workload, though with less cross-cloud reach and weaker rightsizing than Kubecost. If your goal is purely node-level savings and you do not need per-team chargeback, a Karpenter-plus-Spot strategy alone will cut the bill without any allocation layer at all. Kubecost earns its place specifically when you are multi-cluster and/or multi-cloud, genuinely multi-tenant, and need a chargeback number finance will load into the P&L — which is precisely the insurer’s situation.
The shape of the win
For the insurer, the payoff is not “a cost dashboard.” It is that the CFO opens a report showing claims adjudication costs ₹X per thousand claims, the quoting engine ₹Y per ten thousand quotes, and the fraud scorer ₹Z — each reconciled to the actual invoice, each billed back to the product P&L that owns it — and that the same month the platform team rightsized the over-provisioned services and let Karpenter consolidate, the ₹4.1 crore “compute” line dropped by a third with no product slowed down. That last sentence is the one that funds the platform. Everything upstream — the federated Kubecost agents, the real-price billing integration, the Vault-held credentials, the Wiz posture checks, the Dynatrace cost-vs-deploy correlation, the ServiceNow chargeback gate — exists to turn an opaque, wasteful “compute” number into a per-product unit cost that an actuary, a product owner, and a CFO can each act on. The architecture here is the destination; start with showback on one multi-tenant cluster if you must, but this is where Kubernetes cost accountability at scale has to land.
Going deeper
The essay above is the destination. This section is the machinery underneath it — the parts an experienced platform or FinOps engineer needs to defend the numbers and push them further.
How an allocation is actually computed. Both engines follow the OpenCost specification: for each pod, over each sample window, cost = cpuCoreHours × $/core-hr + ramGiBHours × $/GiB-hr + gpuHours × $/gpu-hr + pvGiBHours × $/GiB-hr + networkCost + loadBalancerCost. The per-resource hourly rates come from splitting the node’s price into a CPU portion and a RAM portion (the spec derives separate CPU and RAM rates from the node’s total cost rather than treating the node as one blob), so a pod on an expensive GPU node is charged the GPU node’s CPU rate, not some cluster average. The core-hours term uses max(request, usage) — you are billed for what the scheduler reserved on your behalf, even at zero utilization — while efficiency reports usage / request. Multiply those two facts together and you have the entire waste story: high allocated cost, low efficiency, big reclaimable gap.
On-demand vs Spot vs RI/SP amortization. With no cloud integration, the engine prices every node-hour at public on-demand list rates — simple, and wrong for any fleet with discounts. Wire the billing export (CUR/Athena on AWS, the Azure cost export, the GCP BigQuery export) and it prices at what you actually paid: Spot/preemptible at its real 60–90% discount, and — the subtle one — Reserved Instances, Savings Plans, and Committed-Use Discounts amortized across their commitment window rather than dumped as a lump on the day you were billed. There are three number conventions you will be asked about, so know them: blended (average rate across the org), unblended/net (the line-item rate actually charged), and amortized (upfront commitments spread evenly over the term). Kubecost’s amortized view is the one that reconciles cleanly to a monthly P&L, and “does the Kubecost total match the invoice within a few percent?” is the single check that decides whether finance trusts the platform.
Network, PV, and load-balancer cost — the components people drop. Storage is the easy one: PV cost is provisioned or used PVC bytes × the storage class price. Load-balancer cost is the cloud LB’s hourly + data-processing charge, split across the services behind it. Network is the genuinely hard one — accurate cross-AZ, egress, and cross-region traffic attribution needs the optional network-costs daemonset reading conntrack/eBPF data, and without it network cost is estimated rather than measured. On a chatty microservice mesh the cross-AZ traffic bill can rival a service’s compute, so if network dominates your invoice, budget for the daemonset and do not trust the estimate.
Shared and idle distribution — the modeling choices. Shared cost (kube-system, monitoring, an ingress, or a manually declared overhead like a Datadog license) is spread across tenants three ways: even (each namespace pays the same slice — simple, unfair to small teams), weighted (a fixed proportion you set), or proportional to usage (the big consumers pay more — usually the right default). Idle is node cost − Σ(allocations) and lands either as its own line or distributed, and idleByNode: true matters: it attributes idle to the specific node type where it occurred before pushing it onto the tenants over-requesting on that node type, which keeps a team that over-requested GPU from being blamed for idle CPU. Every one of these is a defensible-but-not-objective choice you will justify to a controller — write them down and version them.
OpenCost, the spec, and vendor neutrality. Because OpenCost is a specification as much as an implementation — CNCF Incubating since October 2024, Apache-2.0, engine-inside-Kubecost — your allocation logic is not locked to one vendor. Cloud-native cost tools and the hyperscalers’ own dashboards increasingly conform to it, which means the definitions of “efficiency,” “idle,” and “allocation” are portable across tools and across the AWS/Azure/GCP/on-prem estates it supports. If you want the numbers without a vendor relationship, OpenCost plus your own Prometheus and Grafana is a complete, free stack; Kubecost is what you pay for when you want the federation, the automation, and the UI on top.
Rightsizing as requests-vs-usage, and its relationship to VPA. Kubecost’s request recommendation is a percentile of observed usage plus headroom (commonly p95–p99 × a margin), computed over a window long enough to see your traffic cycles — which is exactly why Prometheus retention must cover the percentile window. This is the same computation the Vertical Pod Autoscaler performs; the practical division of labor is that VPA can enact the change (in Auto mode) or merely recommend (in Off/recommender mode), while Kubecost prices the recommendation and rolls it fleet-wide so you can see the rupee impact before applying anything. Beyond pods, Kubecost also does cluster rightsizing — recommending node shapes and counts — which is the input you feed Karpenter. The permanent tension is headroom: rightsize to p99 with margin, never to the mean, and never auto-apply to production without a gate.
Efficiency metrics and the definition of waste. Efficiency is cost-weighted: totalEfficiency blends CPU and RAM efficiency by their share of cost, so a workload that is CPU-efficient but memory-wasteful reports the honest blended figure. Waste is the money form of the same idea: wasted cost = allocated cost − usage-based cost, i.e. what you would not be paying if requests equalled usage. Track efficiency as a FinOps SLO (say, “no production namespace below 40% for two weeks without a ticket”) and waste as the rupee backlog you burn down.
Showback vs chargeback, budgets, and alerts. Showback shows a team its cost; chargeback moves that cost onto the team’s budget so it hits their P&L. The behavior change comes from chargeback, but showback first is how you earn the trust to get there. Wrap both in budgets and alerts: Kubecost fires on budget-percentage thresholds, spend anomalies (a sudden day-over-day jump), and efficiency dips, routed to Slack/email/PagerDuty/webhook — and an alert without an owner is just noise, so pair every budget with a ServiceNow ticket and a named accountable team.
FinOps practice and unit economics. This platform is one instrument inside the FinOps Foundation framework’s three phases — Inform (allocation, showback), Optimize (rightsizing, commitments, Spot), Operate (chargeback, budgets, governance). The mature end of it is unit economics: dividing cost not by namespace but by a business denominator — cost per customer, per claim, per thousand transactions, per model inference. That is the number a CFO can compare to revenue per customer, and it is where FinOps stops being an infra concern and becomes a margin conversation.
Multi-cluster and multi-cloud aggregation. OpenCost is single-cluster by design; to get one number across an estate you either aggregate its exports yourself or use Kubecost’s federated ETL, where each cluster computes locally and ships compact cost snapshots to a shared bucket that a primary reads. This scales to dozens of clusters precisely because the heavy per-pod computation stays distributed and only summaries travel — and it is what lets a mixed EKS/AKS/GKE estate reconcile to one cross-cloud figure instead of three that never add up.
GPU and AI cost — the most expensive idle there is. GPU node-hours can cost 10–40× a comparable CPU node, so a half-idle GPU is the single most expensive waste in the building. Kubecost allocates GPU cost by GPU request and tracks GPU utilization, but fractional sharing complicates it: time-slicing and MIG (Multi-Instance GPU) let several pods share one physical GPU, and attributing cost fairly across them is harder than whole-GPU allocation. AI/ML platforms routinely run at low GPU utilization because a training or inference pod holds the whole card while using a fraction of it — which makes GPU rightsizing and bin-packing the highest-leverage cost work in an AI-heavy cluster.
Practice challenges
Work these in order; each builds on the last. Solutions are collapsed — try first, then check.
1. Beginner — get a number out of an empty cluster. On a scratch cluster, install a cost tool and print per-namespace cost for the last week.
<details><summary>Solution</summary>
helm install kubecost cost-analyzer \
  --repo https://kubecost.github.io/cost-analyzer/ \
  --namespace kubecost --create-namespace
kubectl krew install cost
kubectl cost namespace --window 7d --show-efficiency=true
Kubecost bundles Prometheus, so it produces estimated (list-price) numbers immediately; wiring the cloud billing export comes later to make them reconcile. </details>
2. Beginner — read the allocation. Using the representative JSON from “Reading your first cost allocation,” state (a) how many CPU cores the quoting namespace reserves vs uses, and (b) its total efficiency in plain words.
<details><summary>Solution</summary>
Reserves cpuCoreRequestAverage = 2.0 cores, uses cpuCoreUsageAverage = 0.18 — under a fifth of one core. totalEfficiency = 0.15, i.e. about 15 paise of compute value per rupee of compute spend. Roughly 85% of what you pay for this namespace is reserved-but-unused headroom.
</details>
3. Intermediate — fix the biggest rupees, not the worst ratio. Given this weekly allocation, which namespace do you rightsize first?
| Namespace | Total efficiency | Total cost (7d) |
|---|---|---|
| claims | 0.55 | ₹2,60,000 |
| quoting | 0.09 | ₹80,000 |
| fraud-scoring | 0.30 | ₹95,000 |
| member-portal | 0.60 | ₹1,20,000 |
| batch-reprocessing | 0.20 | ₹40,000 |
<details><summary>Solution</summary>
Rank by reclaimable rupees = (1 − efficiency) × cost, not by efficiency alone:
- claims: 0.45 × ₹2,60,000 = ₹1,17,000 ← fix first
- quoting: 0.91 × ₹80,000 = ₹72,800
- fraud-scoring: 0.70 × ₹95,000 = ₹66,500
- member-portal: 0.40 × ₹1,20,000 = ₹48,000
- batch-reprocessing: 0.80 × ₹40,000 = ₹32,000
quoting looks worst by ratio (9%), but claims — despite a respectable 55% — holds the most money in its waste because it is so much larger. Chase rupees, not ratios.
</details>
4. Intermediate — size a new request. A Deployment requests 2.0 CPU; its 30-day p99 usage is 0.42 CPU. Pick a new request with ~20% headroom and state the resulting efficiency.
<details><summary>Solution</summary>
New request = p99 × 1.2 = 0.42 × 1.2 ≈ 0.5 CPU (a 4× cut in reserved CPU). Resulting efficiency ≈ usage/request = 0.42/0.5 ≈ 0.84. The 20% margin is deliberate insurance against a spike above p99 — do not cut to the mean, and never auto-apply to prod without a gate. </details>
5. Advanced — reconcile to the invoice. Kubecost’s monthly total comes in 30% below the AWS invoice. Give two likely causes and the fix for each.
<details><summary>Solution</summary>
(a) Missing/incomplete cloud billing integration — Kubecost is estimating at list price and missing charges it cannot see (data-transfer, some managed-service and cross-AZ network cost). Fix: wire the CUR/Athena integration and use the amortized view so RIs/Savings Plans are spread correctly. (b) Uncounted shared/idle or out-of-cluster cost — idle or shared components not enabled, or spend that simply is not on the cluster (RDS, S3). Fix: enable explicit idle/shared, and scope the reconciliation to in-cluster compute so you compare like with like. The monitored assertion “Kubecost total vs invoice within a few percent” should be a standing check. </details>
6. Advanced — where should idle land? You run idle: true with idleByNode: true and sharingStrategy: weighted. Team A over-requests CPU 3× more than Team B on the same node type. Who absorbs most of that node type’s idle, and why is that the point?
<details><summary>Solution</summary>
With idle attributed by node and distributed proportionally to requests, Team A absorbs roughly three-quarters of that node type’s idle, because idle there is mostly their over-reservation. That is deliberate: distributing idle to the over-requesters puts the cost — and therefore the incentive to rightsize — on exactly the desk that created it. Showing idle as its own line is better only for the first org-wide shock; distributing it is what changes behavior. </details>
Common beginner mistakes
“Utilization looks healthy, so we’re not wasting money.” A usage graph showing 0.2 CPU looks fine — but you are billed for the 2.0 CPU the pod requested and the scheduler reserved. The waste is the gap between request and usage, and it is invisible on any usage-only chart. Right mental model: you pay for requests, not usage; efficiency = usage/request is the number that matters.
“The tool bills us for what we consume.” No — allocation prices max(request, usage), because reserved capacity is held out of the node whether or not you touch it. A pod requesting 2 CPU at zero load still costs two cores’ worth. Over-requesting is not free; it is the most common way a Kubernetes bill inflates.
“We’ll add cost labels later.” Without team/cost-center labels on every workload, spend lands in an “unallocated” bucket that finance will not accept, and retrofitting labels across a live estate is painful. Enforce them at admission (OPA/Kyverno) from day one, and alert when unallocated crosses a threshold. No labels, no allocation.
“The Kubecost number is close enough.” Without the cloud billing integration, the engine prices at list on-demand rates, ignoring your Spot discounts and Savings Plans — so the total will not reconcile with the invoice, and the moment it disagrees with the bill, every allocation is suspect. Wire the CUR/Azure/GCP export and use the amortized view. Reconciliation is what earns the platform its seat in the P&L conversation.
“We built beautiful showback dashboards — done.” Visibility is not accountability. Showback that nobody is charged for and no alert fires on changes nothing. Graduate to chargeback (cost hits the team’s budget), attach budgets and alerts, and give every red number a ServiceNow ticket and an owner. The dashboard is the start of the work, not the end of it.
“Rightsize to exactly observed usage.” Cutting requests to the mean — or even to p99 with no margin — saves money right up until the traffic spike that OOM-kills or CPU-throttles the pod mid-incident. Always leave headroom (p99 × a safety margin), recommend rather than auto-apply in production, and gate the change.
Glossary
- Allocation — a slice of cloud spend attributed to a set of pods over a time window, grouped by a key (namespace, controller, pod, or label). The atomic unit both tools produce.
- Cost allocation — the practice of attributing shared cluster cost down to the team/product that caused it.
- Request / Limit — the CPU/memory a container asks the scheduler to reserve (request, what you pay for) and the ceiling it may burst to (limit). Requests, not usage, drive cost.
- Efficiency —
usage / request, cost-weighted across CPU and RAM intototalEfficiency. Low efficiency = money reserved and unused. - Waste — the money form of low efficiency:
allocated cost − usage-based cost, i.e. what you would not pay if requests equalled usage. - Idle cost —
node cost − Σ(pod allocations): reserved-but-unused (or entirely unreserved) node capacity. Shown separately or distributed to over-requesters. - Shared cost — cost of shared namespaces/overhead (kube-system, monitoring, ingress) split across tenants — even, weighted, or proportional to usage.
- Rightsizing — setting requests to a high percentile of real usage plus headroom, cutting the reserved-vs-used gap.
- Showback / Chargeback — showback shows a team its cost for visibility; chargeback moves that cost onto the team’s budget. Chargeback changes behavior.
- Amortization — spreading an upfront commitment (RI/Savings Plan/CUD) evenly across its term rather than as a lump, so monthly cost reconciles to a P&L.
- CUR (Cost and Usage Report) — AWS’s detailed billing export (to S3); the actual-price source Kubecost reads. Azure and GCP have equivalents.
- Spot / preemptible — deeply discounted, interruptible cloud capacity (~60–90% off) for disruption-tolerant workloads.
- RI / Savings Plan / CUD — reserved/committed-use pricing that discounts a steady baseline in exchange for a commitment.
- On-demand / list price — the undiscounted public rate; what the engine assumes without a billing integration.
- Blended / unblended / amortized — three billing conventions: org-average rate, line-item rate charged, and commitments-spread-over-term. Amortized reconciles cleanest.
- OpenCost — the CNCF (Incubating) open-source engine and specification for Kubernetes cost monitoring; the allocation core inside Kubecost.
- Kubecost — the product built on OpenCost, adding UI, multi-cluster federation, rightsizing, alerts, and chargeback (an IBM/Apptio product).
- Federation / federated ETL — each cluster computes cost locally and ships compact snapshots to a shared store that a primary aggregates into one cross-cluster view.
- FinOps — the discipline of cloud financial management; the FinOps Foundation framework runs Inform → Optimize → Operate.
- Unit economics — cost divided by a business denominator (per customer, per claim, per transaction, per inference) — the number a CFO compares to revenue.
- VPA (Vertical Pod Autoscaler) — the Kubernetes component that recommends (and optionally applies) right-sized requests from observed usage.
- Karpenter — a node autoscaler that bin-packs pods onto fewer, cheaper (often Spot) nodes and terminates empties — turning rightsizing into a smaller bill.
- Bin-packing — scheduling pods densely onto as few nodes as possible to minimize idle capacity.
- PV cost / network cost / load-balancer cost — the non-compute allocation components: persistent storage, cross-zone/egress traffic, and the cloud LB, each attributed back to the owning workload.
- GPU allocation / MIG / time-slicing — attributing GPU node cost to workloads; MIG and time-slicing let multiple pods share one physical GPU, complicating fair attribution. Idle GPU is the most expensive idle there is.
- p95 / p99 — usage percentiles: the value below which 95% / 99% of samples fall. Rightsizing targets a high percentile plus headroom, not the mean.
- Prometheus — the metrics system both tools scrape for pod requests, limits, and actual usage; its retention must cover the rightsizing percentile window.