There is a moment every engineer meets. The code works. The tests pass. You ship it. And then it meets production — real load, real network, real users doing things you never imagined — and it falls over. Not because it was wrong, but because “correct” and “production-ready” are different properties, and nobody taught you the second one. This lesson is the second one. It’s built on three pillars that separate a hobby script from code you can run a business on: Performance (is it fast enough, and do you actually know where the time goes?), Reliability (when a dependency fails — and it will — does your service survive?), and Maintainability (when it breaks at 3 a.m., can someone fix it before the coffee’s cold?).
Everything below targets Python 3.12+ and — this is the whole point — every single number is from a real run on a 3.12.3 machine. There are no invented benchmarks here. When you read “~1,900x” or “2.347 seconds” or “the breaker spared a dying dependency 2 of 7 calls,” those came out of a terminal, not my imagination, and because timings depend on your hardware the rule throughout is the same one the async & profiling lesson drilled: trust the ratios, not the absolute milliseconds. The stdlib carries almost all of it — cProfile, timeit, tracemalloc, functools, logging, threading — with one optional pip install mypy for the maintainability section.
Here’s the shape of what “production-ready” actually decomposes into, and how you measure each one — because a property you can’t measure is a property you can’t manage:
| Pillar | The question it answers | You measure it with | The production symptom of getting it wrong |
|---|---|---|---|
| Performance | Is it fast enough, and where does the time go? | Profilers (cProfile), latency percentiles (p50/p95/p99) |
Slow responses, timeouts, a cloud bill that scales with users |
| Reliability | Does it survive a dependency failing? | Error rate, uptime/SLO, MTBF (mean time between failures) | Cascading outages, 500s, one slow service taking down five |
| Maintainability | Can a human change it safely and fast? | MTTR (mean time to recovery), review time, defect rate | A one-line fix takes a day; every change breaks something else |
Notice the last column. These aren’t academic virtues — each one has a failure mode that wakes someone up. And notice MTTR in the maintainability row: the single most underrated production metric. When (not if) something breaks, the time to recover is dominated by how readable and observable your code is. Maintainability isn’t a nicety you get to after the “real” work; it’s the thing that decides whether an incident lasts four minutes or four hours.
Why this matters
Most performance advice you’ll ever hear is folklore, and folklore is expensive. Someone tells you “list comprehensions are faster than loops” or “never use + on strings” or “functions are slow, inline everything,” you sprinkle these tips across your code, you make it uglier and harder to read — and you move the total runtime by nothing, because the slow part was somewhere else entirely. Donald Knuth’s line is quoted so often it’s become wallpaper, but read it fresh: “premature optimization is the root of all evil.” The evil isn’t optimizing. The evil is optimizing before you’ve measured, which means optimizing the wrong thing, which means paying in complexity and bugs for a speedup no user will ever feel.
So the golden rule, the one that is never wrong, is: measure, don’t guess. Human intuition about “the slow part” is genuinely, provably unreliable — the bottleneck is routinely a function you’d never suspect, and the one you’re sure is slow is often 2% of the runtime. In this lesson a profiler will point at a single function eating 2.347 of 2.357 seconds, and once you can see that, the fix is obvious and the payoff is a measured ~1900x. You will not get there by staring at the code and having a good idea.
Then reliability flips the frame entirely. Performance asks “how do I go faster?” Reliability asks “what happens when the thing I depend on goes down?” — and at any real scale, something is always down. A dependency that’s up 99.9% of the time is down for 43 minutes a month; string five of those together in a request path and your theoretical uptime is already 99.5% before you’ve written a bug. The engineers who build systems that survive don’t do it by making each piece perfect. They do it by assuming every piece will fail and designing the call between pieces to absorb it: a timeout so you never wait forever, a retry so a blip doesn’t become an error, a circuit breaker so a dead dependency doesn’t drag you down with it. We’ll build all three from scratch and watch them work against a dependency that fails on purpose.
And maintainability is the quiet one that decides everything else. Code is read far more often than it is written — you write a function once and then you, and everyone after you, read it dozens of times while debugging, extending, and reviewing. Optimizing for the writer (clever, terse, dense) at the reader’s expense is a false economy you pay interest on forever. The whole reason maintainability belongs in a lesson next to performance and reliability is that it’s not separate from them: unreadable code is slow to fix (bad MTTR), un-instrumented code fails invisibly (bad reliability), and un-profiled code gets optimized blindly (bad performance). It’s the substrate the other two grow in.
Performance, part 1: the tools that tell you the truth
Before any optimization, you answer one of three questions, and each has exactly one right first tool. Reaching for the wrong tool — or worse, no tool — is how the folklore wins.
| Your question | Reach for | What it gives you | ⚠️ Don’t use it for |
|---|---|---|---|
| How long does this tiny snippet take? | timeit |
Best-of-N timing, GC disabled, noise-resistant | Whole programs (use a profiler) |
| Which function eats the runtime? | cProfile + pstats |
Per-function call counts and time | A true wall-clock number (it adds overhead) |
| Where does the memory go? | tracemalloc |
Allocations by line, snapshots to compare | CPU time (it tracks memory, not time) |
| Which line inside one function is hot? | line_profiler (pip) |
Per-line timing in a chosen function | A first pass — narrow with cProfile first |
| A running production process is pegged — why? | py-spy (pip) |
Sampling profiler, attaches live, no restart | Micro-benchmarks (it samples) |
| CPU and memory, line-level, one tool | scalene (pip) |
Separates Python vs native, low overhead | When stdlib-only is a hard requirement |
Two distinctions matter before we run anything. First, wall time versus CPU time. Wall time (time.perf_counter) is the clock on the wall — it includes time spent waiting on I/O, on the network, on a lock. CPU time (time.process_time) is only time the CPU actually spent computing your code. The gap between them is the tell for what kind of problem you have: if wall ≫ CPU, you’re I/O-bound (waiting), and the fix is concurrency; if wall ≈ CPU, you’re CPU-bound (computing), and the fix is a better algorithm or more processes. Measuring the wrong one sends you down the wrong road — the async lesson is the whole story of that fork.
| Clock | Python call | Counts | Use it to |
|---|---|---|---|
| Wall / elapsed | time.perf_counter() |
Real time, including waiting on I/O, network, locks | ✅ Measure end-to-end latency as a user feels it |
| CPU / process | time.process_time() |
Only time the CPU spent on your code | Confirm work is compute-bound, not waiting |
| Thread CPU | time.thread_time() |
CPU time of the current thread only | Isolate one thread’s compute in a pool |
| wall ≫ cpu | (the ratio) | You’re I/O-bound — mostly waiting | Reach for async/threads (concurrency) |
| wall ≈ cpu | (the ratio) | You’re CPU-bound — mostly computing | Reach for a better algorithm / processes |
Second, cProfile measures relative, not absolute. It instruments every function call, which adds real overhead, so absolute times under cProfile run slower than reality — and function-heavy code inflates most. That’s fine, because you use it to find the relative hot spot and to compare before/after; you never quote a cProfile millisecond as your program’s true speed. For a true number, timeit the fixed function on its own.
timeit: micro-benchmarks done right
Timing a fast operation by hand with perf_counter() is a trap — one run is dominated by noise, import costs, and whatever else the OS was doing. timeit runs the snippet many times, reports the best, and disables the garbage collector so runs don’t interfere. The CLI form is the cleanest, and it doubles as the most important performance lesson in the language:
python3 -m timeit -s "data = list(range(10000)); target = 9999" "target in data"
python3 -m timeit -s "data = set(range(10000));  target = 9999" "target in data"
5000 loops, best of 5: 45.4 usec per loop
20000000 loops, best of 5: 14.5 nsec per loop
The -s setup runs once; the last argument runs in the timed loop. And read that result twice: membership in a 10,000-element list took 45.4 microseconds (it scans, worst case all 10,000 elements — O(n)); the same test on a set took 14.5 nanoseconds — about 3,100x faster — because a set is a hash table and membership is O(1). The same gulf opens between a list.index() scan and a dict key lookup:
python3 -m timeit -s "d = {i:i for i in range(10000)}" "d.get(9999)"
python3 -m timeit -s "L = list(range(10000))" "L.index(9999)"
20000000 loops, best of 5: 19.3 nsec per loop     # dict.get
5000 loops, best of 5: 47 usec per loop           # list.index -> ~2400x slower
No micro-tuning on earth beats picking the right data structure — this is O(1) versus O(n), and it’s the whole reason Algorithms: search, sort & complexity exists. Keep this in your pocket:
| Operation | List | Set / dict | Winner | Why |
|---|---|---|---|---|
Membership (x in c) |
O(n) — 45.4 µs |
O(1) — 14.5 ns |
✅ set/dict, ~3,100x | Hash table vs linear scan |
| Key lookup | .index() O(n) — 47 µs |
.get() O(1) — 19.3 ns |
✅ dict, ~2,400x | Same reason |
| Append / add | O(1) amortized |
O(1) |
Tie | Both are cheap |
| Keep insertion order | ✅ Yes | dict ✅ (3.7+), set ❌ | Depends | Sets are unordered |
| Duplicates allowed | ✅ Yes | ❌ No | Depends on need | Sets dedupe for free |
⚠️ Report the minimum, not the average. A slow run means something else stole the CPU — it tells you nothing about your code. The fastest run is the one with the least interference, the closest to your code’s true cost. timeit.repeat(..., repeat=5) gives you a list; take min().
Performance, part 2: profile a slow function, for real
timeit is for code you can already point at. cProfile is for when you can’t — when you have a slow program and no idea which function is guilty. Here’s a deliberately slow log-scrubber. It filters a stream of hostnames against a threat-intel blocklist. It’s slow. Where, exactly?
# slow_filter.py
"""A deliberately slow log-scrubber. Where does the time REALLY go? cProfile answers."""

def load_blocklist(n):
    # Pretend these came from a threat-intel feed. Stored as a LIST.
    return [f"host-{i}.evil.example" for i in range(n)]

def is_blocked(host, blocklist):
    return host in blocklist            # O(n) scan of a list, worst case every element

def scrub(events, blocklist):
    kept = []
    for host in events:
        if not is_blocked(host, blocklist):
            kept.append(host)
    return kept

def build_report(n_block, n_events):
    blocklist = load_blocklist(n_block)
    events = [f"host-{i}.good.example" for i in range(n_events)]
    kept = scrub(events, blocklist)
    return {"blocked_entries": n_block, "events": n_events, "kept": len(kept)}

if __name__ == "__main__":
    print(build_report(20000, 20000))
Run it under cProfile, sorted by self-time so the true culprit floats up:
python3 -m cProfile -s tottime slow_filter.py
{'blocked_entries': 20000, 'events': 20000, 'kept': 20000}
         40008 function calls in 2.357 seconds

   Ordered by: internal time

   ncalls  tottime  percall  cumtime  percall filename:lineno(function)
    20000    2.347    0.000    2.347    0.000 slow_filter.py:8(is_blocked)
        1    0.004    0.004    2.352    2.352 slow_filter.py:11(scrub)
        1    0.002    0.002    2.356    2.356 slow_filter.py:18(build_report)
        1    0.002    0.002    0.002    0.002 slow_filter.py:4(load_blocklist)
    20000    0.002    0.000    0.002    0.000 {method 'append' of 'list' objects}
        1    0.000    0.000    2.357    2.357 slow_filter.py:1(<module>)
        1    0.000    0.000    0.000    0.000 {method 'disable' of '_lsprof.Profiler' objects}
        1    0.000    0.000    0.000    0.000 {built-in method builtins.print}
        1    0.000    0.000    2.357    2.357 {built-in method builtins.exec}
        1    0.000    0.000    0.000    0.000 {built-in method builtins.len}
There it is, unambiguous: is_blocked was called 20,000 times and its tottime is 2.347 seconds — out of 2.357 total. That one function is essentially the entire runtime; everything else rounds to zero. You didn’t guess, you didn’t stare hopefully at the code — the profile handed you the culprit. The four columns:
| Column | Means | Read it to find |
|---|---|---|
ncalls |
How many times the function was called | Surprising call counts (“called 20k times?!”) |
tottime |
Time in this function itself, excluding sub-calls | ✅ The hot function — where CPU actually burns |
cumtime |
Time in this function plus everything it calls | ✅ The expensive path — which high-level call is costly |
percall |
tottime/ncalls (or cumtime/ncalls) |
The cost of a single call |
The mental model: sort by cumtime to see which top-level operation is expensive; sort by tottime to see which leaf function to actually fix. In this report build_report and scrub show cumtime ≈ 2.35 — they look expensive, but only because they call is_blocked. Their own tottime is a rounding error. The tottime column cuts through the call chain and names the real work: is_blocked, doing an O(n) list scan 20,000 times.
The fix writes itself. A list membership test scans; a set membership test hashes. Change the data structure, measure with a real wall clock (not under the profiler):
# optimize_filter.py
import time

def build(n_block, n_events):
    block_list = [f"host-{i}.evil.example" for i in range(n_block)]
    events = [f"host-{i}.good.example" for i in range(n_events)]
    return block_list, events

def scrub_list(events, blocklist):          # blocklist is a LIST -> `in` is O(n)
    return [h for h in events if h not in blocklist]

def scrub_set(events, blocklist_set):       # blocklist is a SET  -> `in` is O(1)
    return [h for h in events if h not in blocklist_set]

block_list, events = build(20000, 20000)
block_set = set(block_list)                 # one-time O(n) build, then O(1) lookups

t = time.perf_counter(); a = scrub_list(events, block_list); slow = time.perf_counter() - t
t = time.perf_counter(); b = scrub_set(events, block_set);   fast = time.perf_counter() - t

assert a == b                               # SAME result -- correctness preserved
print(f"{len(a)} events kept")
print(f"  list membership O(n) : {slow:.3f}s")
print(f"  set membership  O(1) : {fast:.5f}s")
print(f"  speedup              : {slow/fast:.0f}x")
20000 events kept
  list membership O(n) : 2.300s
  set membership  O(1) : 0.00120s
  speedup              : 1913x
~1900x, from a one-line change — blocklist was a list, now it’s a set. Not a clever trick, not a rewrite: the right data structure. The assert a == b is non-negotiable — an optimization that changes the answer isn’t an optimization, it’s a bug, and the assert catches it the instant it happens. This is the entire discipline of performance work in five steps, and it never changes:
- Profile the real workload (
cProfile), don’t guess. - Read the
tottimecolumn — that’s the leaf to fix. - Fix the algorithm or data structure first (biggest lever by far).
assertthe optimized result equals the original.- Re-measure with
timeit/perf_counter, and stop when it’s fast enough.
You can also profile programmatically and keep just the top offenders, which is handy in tests or when you want the profile of one function rather than a whole script:
import cProfile, pstats, io
pr = cProfile.Profile()
pr.enable()
build_report(20000, 20000)
pr.disable()
s = io.StringIO()
pstats.Stats(pr, stream=s).sort_stats("tottime").print_stats(5)
print(s.getvalue())
pstats sort key |
Orders by | Use to find |
|---|---|---|
"tottime" |
Self-time — the function’s own work | ✅ The leaf to optimize |
"cumulative" |
Including sub-calls | ✅ The expensive high-level path |
"ncalls" |
Call count | Something called far too often |
"nfl" |
name / file / line | A stable diff between two runs |
Performance, part 3: the wins that actually pay (and the ones that don’t)
Once the profile names the hot spot, you have a menu — and the order matters enormously, because the levers differ in payoff by orders of magnitude. Work top to bottom, stop when you’re fast enough, and never skip to the bottom because a listicle told you to.
Lever 1 — a better algorithm or data structure. This is where the real wins live, and you just saw one: list→set was ~1900x. Complexity dominates everything; a smaller constant factor can’t rescue a worse Big-O once n grows. Fix this first, always.
Lever 2 — caching (memoization). If a function is pure (same inputs → same output, no side effects) and gets called with repeated inputs, cache it. functools.lru_cache (or its no-limit alias functools.cache, 3.9+) memoizes results with one decorator. The canonical demonstration is the naive recursive Fibonacci, which recomputes the same subproblems an exponential number of times:
# cache_fib.py
import time
from functools import lru_cache, cache

def fib_slow(n):
    if n < 2:
        return n
    return fib_slow(n - 1) + fib_slow(n - 2)   # recomputes fib(n-2) twice, etc.

@lru_cache(maxsize=None)
def fib_cached(n):
    if n < 2:
        return n
    return fib_cached(n - 1) + fib_cached(n - 2)

N = 35
t = time.perf_counter(); a = fib_slow(N);   slow = time.perf_counter() - t
t = time.perf_counter(); b = fib_cached(N); fast = time.perf_counter() - t
assert a == b
print(f"fib({N}) = {a}")
print(f"  naive recursion  : {slow:.3f}s")
print(f"  @lru_cache       : {fast:.6f}s")
print(f"  speedup          : {slow/fast:.0f}x")
print(f"  cache_info       : {fib_cached.cache_info()}")
fib(35) = 9227465
  naive recursion  : 0.814s
  @lru_cache       : 0.000013s
  speedup          : 61233x
  cache_info       : CacheInfo(hits=33, misses=36, maxsize=None, currsize=36)
Tens of thousands of times faster — because caching collapsed an exponential O(2ⁿ) into a linear O(n): each fib(k) is computed once (36 misses) and reused (33 hits), and .cache_info() proves the hit rate. (⚠️ The exact speedup ratio is unstable — it swung from ~32,000x to ~61,000x across my runs — because the cached time is measured in microseconds, a tiny and noisy denominator. That’s this lesson’s “trust the ratios, not the absolute number” rule at its most extreme: what’s rock-solid here is the complexity change and the stable cache_info, not the last two digits of the multiplier.) That last point is the discipline: a cache with a low hit rate is pure overhead, and cache_info() is how you check instead of assume. The caching toolkit:
| Tool | What it caches | Reach for it when |
|---|---|---|
@functools.lru_cache(maxsize=N) |
A function’s return, keyed by args, LRU-evicted | Pure function, repeated args, bounded memory |
@functools.cache (3.9+) |
Same, unbounded (maxsize=None) |
✅ Pure fn, finite input domain (like fib) |
@functools.cached_property |
A computed attribute, once per instance | Expensive property read many times on one object |
| Manual dict (cache-aside) | Whatever you put in it | You need control — TTL, external cache, custom key |
⚠️ Caching has three sharp edges, and each is a real production bug. (1) Only cache pure functions. Cache a function that reads a file or the clock or a database and you’ll serve stale answers forever — the cache happily returns yesterday’s value. (2) @cache/lru_cache(maxsize=None) is unbounded — every distinct argument is remembered forever. On a finite domain like fib(n) that’s fine; on user IDs or request payloads it’s a memory leak that grows until the OOM killer arrives. Use a bounded maxsize for anything open-ended. (3) lru_cache keys on arguments, which must be hashable — pass a list or dict and you get TypeError: unhashable type. And the honest caveat: caching helps when reads dominate and data is stable; it hurts when the hit rate is low (overhead with no payoff) or the data changes faster than you invalidate (correctness bugs). “There are only two hard things in computer science” is a joke about cache invalidation for a reason.
Lever 3 — vectorization. For bulk numeric work, push the loop out of Python and into C with NumPy, which measures 10–50x routinely on array-shaped math. It adds a dependency and only fits array-shaped work, not branchy business logic, so it’s lever 3, not lever 1.
Lever 4 — micro-optimizations. Local-variable binding, avoiding attribute lookups in a hot loop, ''.join() over +=. These are real but small, and they often cost readability. Take string building — the folklore says += in a loop is catastrophic O(n²); measure it on CPython and the truth is more interesting:
# string_build.py  (N = 200_000)
def with_concat():
    s = ""
    for i in range(N):
        s += str(i)          # folklore says O(n^2)...
    return s

def with_join():
    parts = [str(i) for i in range(N)]
    return "".join(parts)     # one allocation at the end
  += concatenation : 0.0215s
  ''.join()        : 0.0146s
  join is          : 1.5x faster
Only ~1.5–2.6x across runs, not the O(n²) apocalypse the folklore promises — because CPython has a special-case optimization that resizes a string in place when it’s the only reference. ''.join() is still the right habit (it’s clearly faster, it’s cleaner, and the optimization vanishes on PyPy or when the string has other references), but the measured reality is a reminder: even “everyone knows” optimizations should be measured, because “everyone knows” is often wrong by an order of magnitude. Here’s the whole menu with the numbers this lesson (and its sibling) measured, in strict priority order:
| Lever | Measured payoff | When it applies | ⚠️ The catch |
|---|---|---|---|
| 1. Algorithm / data structure | ✅ ~1900x (list→set), 126x (O(n)→O(√n)) |
Almost always the biggest win | Must preserve the result — assert it |
2. Caching (lru_cache) |
~10,000s of x (fib, exponential→linear) |
Pure fn, repeated inputs, good hit rate | ⚠️ Purity, unbounded memory, hashable keys |
| 3. Vectorization (NumPy) | 10–50x (bulk numeric) | Array-shaped math over big data | Adds a dependency; not for branchy logic |
4. Micro-tuning (join, local bind) |
~1.5–2x, ~8% | Proven hot loops only | A rounding error; often hurts readability |
| 5. Concurrency (async/threads/procs) | I/O ~20x, CPU ~1.9x (procs) | Throughput, not single-op latency | See the concurrency note below |
Concurrency is a throughput lever, and which kind depends on why you’re slow. This is a whole subject on its own — the async lesson and the threading/multiprocessing/GIL lesson cover it in depth — but the one-line decision is: I/O-bound (waiting on network/disk) → threads or async (measured ~20x for 100 concurrent HTTP waits), CPU-bound (computing) → multiprocessing (measured ~1.9x on 4 cores), because the GIL means threads don’t parallelize Python bytecode. Reaching for the wrong one gives you nothing — async on CPU work measured a flat 1.00x.
And the meta-lever above all of them: is it even fast enough? Optimization is driven by an SLA, not by aesthetics. If a function runs once at startup and takes 3ms, making it 10x faster saves 2.7ms that nobody will ever perceive — you spent complexity for zero. The two failure modes the profile guards against are optimizing a cold path (feels slow, is gnarly, but runs once and costs nothing) and micro-optimizing before fixing the algorithm (polishing lever 4 while lever 1 sits untouched). Fast enough is a real, definable target. Past it, you’re spending complexity you’ll pay interest on forever.
Reliability: failures are normal at scale
Switch frames completely. Performance was about your code in isolation; reliability is about your code’s relationships — every place it calls something that can fail. And at scale, failure is not an exception, it’s the weather. Networks drop packets, dependencies hit capacity, a deploy on someone else’s service browns yours out for ninety seconds. You cannot prevent this. You can only decide whether one dependency’s bad day becomes your bad day too. The tools for that decision are a small, composable set of patterns, and this is the map of the whole territory:
| Pattern | What it does | When to use it | ⚠️ The risk if you get it wrong |
|---|---|---|---|
| Timeout | Bounds how long you’ll wait for a call | ✅ Every network/IO call, no exceptions | Too short → false failures; none → hung threads |
| Retry + backoff | Re-attempts a transient failure, spacing tries out | Idempotent ops, transient errors (503, timeout) | Retry storm if no backoff/jitter; double side-effects if not idempotent |
| Circuit breaker | Stops calling a dependency that’s clearly down | A dependency with sustained failures | Tuned wrong → trips too eager or too late |
| Bulkhead | Isolates resources so one pool can’t sink the ship | Multiple dependencies sharing a thread/conn pool | Under-partitioned → one slow dep starves the rest |
| Rate limiting | Caps the request rate you send or accept | Protecting yourself or a downstream from overload | Too strict → throttle good traffic |
| Fallback | Returns a degraded-but-useful default on failure | Anywhere a stale/partial answer beats an error | Fallback that itself calls the failing dep |
| Idempotency | Makes a repeated call safe (no duplicate effect) | Any operation that retries might double-run | Missing key → retries create duplicate charges |
We’ll build the three load-bearing ones — timeout, retry, circuit breaker — and watch them compose. Here’s the call path they form, which is the diagram to hold in your head for the rest of this section:
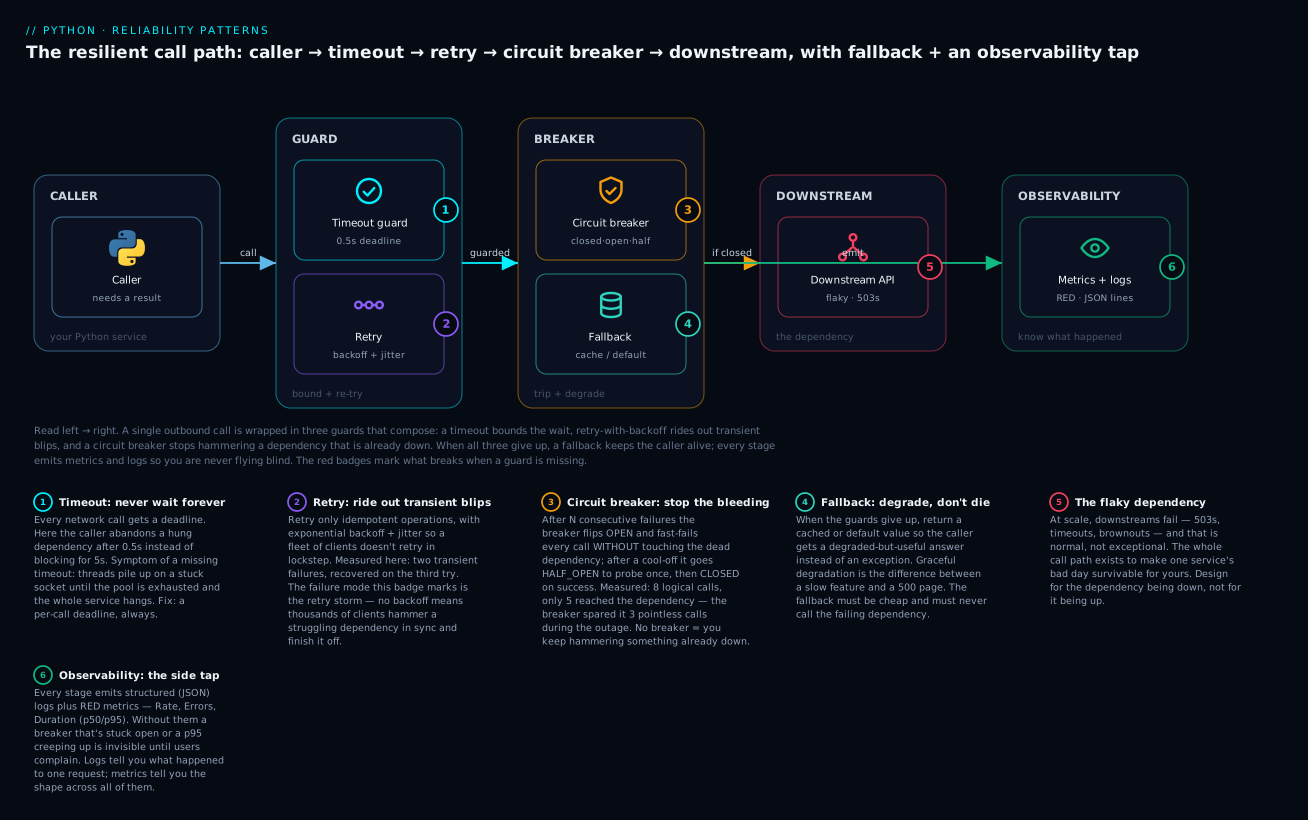
Follow it left to right and the design falls out: the caller never touches the dependency directly. Its call is wrapped in a timeout (so it can’t hang forever), inside a retry (so a blip doesn’t surface as an error), inside a circuit breaker (so a sustained outage stops the retries from making things worse), with a fallback for when all three give up and an observability tap so none of it is invisible. The red badges mark the failure mode of removing each guard — that’s the argument for why each one earns its place.
Timeouts: never wait forever
The single cheapest reliability win, and the one most often forgotten: every network call gets a timeout. A call with no timeout doesn’t fail when the dependency hangs — it waits, holding a thread and a connection, forever. Do that under load and your thread pool fills with stuck calls until the whole service stops accepting work. The dependency’s hang becomes your outage. Here’s a cross-platform client-side timeout — run the call in a daemon thread, wait at most timeout seconds, and abandon it if it overruns:
# timeout_demo.py
import time, threading

def call_with_timeout(fn, timeout, *args, **kwargs):
    box = {}
    def worker():
        try:
            box["value"] = fn(*args, **kwargs)
        except Exception as exc:               # capture, re-raise in the caller
            box["error"] = exc
    t = threading.Thread(target=worker, daemon=True)   # daemon: won't block exit
    t.start()
    t.join(timeout)                            # wait AT MOST `timeout` seconds
    if t.is_alive():                           # still running -> abandon it
        raise TimeoutError(f"call exceeded {timeout}s")
    if "error" in box:
        raise box["error"]
    return box["value"]

def fast_service():  time.sleep(0.1);  return "fast reply"
def slow_service():  time.sleep(5);    return "reply that arrives far too late"

t = time.perf_counter()
print("fast call :", call_with_timeout(fast_service, timeout=1.0),
      f"({time.perf_counter() - t:.2f}s)")
t = time.perf_counter()
try:
    call_with_timeout(slow_service, timeout=0.5)
except TimeoutError as e:
    print(f"slow call : {type(e).__name__}: {e} "
          f"-- caller gave up after {time.perf_counter() - t:.2f}s (not 5s)")
fast call : fast reply (0.11s)
slow call : TimeoutError: call exceeded 0.5s -- caller gave up after 0.51s (not 5s)
The caller abandoned the hung call after 0.51s instead of blocking for 5 seconds. ⚠️ The honest caveat this pattern teaches: Python cannot force-kill a running thread — the daemon thread keeps running time.sleep(5) in the background; what changed is that the caller stopped waiting. That’s exactly what a client-side timeout is: a decision to stop waiting, not a guarantee the other side stopped working. In real code you have better options depending on the layer, and you should always prefer the native timeout of whatever you’re calling:
| Timeout mechanism | Layer it bounds | Cross-platform? | Note |
|---|---|---|---|
requests.get(url, timeout=5) / httpx |
✅ The HTTP call itself | Yes | Always pass this — the library does it right |
socket.settimeout(s) |
A raw socket op | Yes | Under most network libraries |
async with asyncio.timeout(s): (3.11+) |
An async block | Yes | ✅ The async-native answer |
concurrent.futures future.result(timeout=s) |
A pooled call | Yes | Caller-side; thread keeps running (as above) |
signal.alarm(s) + SIGALRM |
A blocking call | ❌ Unix only, main thread only | Can interrupt C calls; fiddly |
thread.join(timeout) (above) |
Any callable | Yes | Client-side abandonment; thread not killed |
The rule is blunt: there is no such thing as a call with no timeout. If the library has a timeout= parameter, pass it. Every time.
Retries with exponential backoff and jitter
Many failures are transient — a momentary 503, a dropped connection, a lock contention that clears in 20ms. Failing the whole operation for a blip that would’ve cleared on the next try is wasteful. A retry re-attempts. But a naive retry (for _ in range(3): try...) is a loaded gun, and the danger has a name: the retry storm. When a dependency slows down, every client retries at once; those retries pile more load onto the already-struggling dependency; that makes it slower; which triggers more retries — a feedback loop that turns a brown-out into a full outage. The two defenses are backoff (wait longer between each try, so you back off as things stay bad) and jitter (randomize the wait, so a thousand clients don’t retry in perfect lockstep). Here’s a retry decorator that does both:
# retry_backoff.py
import time, random, functools

def retry(attempts=4, base=0.02, factor=2.0, max_delay=1.0,
          exceptions=(Exception,), jitter=True):
    def decorator(fn):
        @functools.wraps(fn)
        def wrapper(*args, **kwargs):
            delay = base
            for attempt in range(1, attempts + 1):
                try:
                    return fn(*args, **kwargs)
                except exceptions as exc:
                    if attempt == attempts:
                        print(f"  [retry] attempt {attempt} failed ({exc}); giving up")
                        raise                        # exhausted -> re-raise the last error
                    sleep_for = min(delay, max_delay)
                    if jitter:
                        sleep_for = random.uniform(0, sleep_for)   # full jitter
                    print(f"  [retry] attempt {attempt} failed ({exc}); "
                          f"sleeping {sleep_for:.3f}s then retrying")
                    time.sleep(sleep_for)
                    delay *= factor                  # exponential growth
        return wrapper
    return decorator

class FlakyService:
    """Fails the first `fail_times` calls with ConnectionError, then succeeds."""
    def __init__(self, fail_times):
        self.fail_times, self.calls = fail_times, 0
    def __call__(self):
        self.calls += 1
        if self.calls <= self.fail_times:
            raise ConnectionError(f"transient error (call {self.calls})")
        return f"OK on call {self.calls}"

random.seed(7)                                       # reproducible jitter for the demo
dep = FlakyService(fail_times=2)                     # 2 transient failures, then OK

@retry(attempts=4, base=0.02, exceptions=(ConnectionError,))
def call_dependency():
    return dep()

print("Calling a dependency that fails twice, then recovers:")
print(f"  RESULT: {call_dependency()}  (took {dep.calls} calls total)")
Calling a dependency that fails twice, then recovers:
  [retry] attempt 1 failed (transient error (call 1)); sleeping 0.006s then retrying
  [retry] attempt 2 failed (transient error (call 2)); sleeping 0.006s then retrying
  RESULT: OK on call 3  (took 3 calls total)
The dependency failed twice and the retry rode straight through it — attempt 3 succeeded, and the caller never saw an error. Point it at a dependency that’s fully down and it correctly gives up after exhausting its attempts (re-raising the last ConnectionError) rather than retrying forever. But retries have one iron precondition, and violating it is how retries cause data corruption instead of resilience:
| Retry design choice | Do | ⚠️ Don’t | Why |
|---|---|---|---|
| What to retry | Idempotent ops (GET, PUT, safe writes) | POST-that-charges-a-card, “send email”, “increment” | A retry runs it again — double side-effect |
| Which errors | Transient (timeout, 503, connection reset) | 400, 401, 404, ValueError |
Retrying a permanent error just wastes time |
| Spacing | Exponential backoff (0.02, 0.04, 0.08…) |
Fixed, tight interval | Fixed intervals synchronize into a storm |
| Randomness | Full/decorrelated jitter | No jitter | Lockstep retries hammer the dependency in sync |
| Ceiling | Cap attempts and max delay | Retry forever | Unbounded retries never surface the real failure |
The spacing strategy is not a detail — it’s the whole difference between a retry that heals and a retry that kills. Here’s the ladder from worst to best:
| Backoff strategy | Delay sequence | Verdict |
|---|---|---|
| None (immediate) | 0, 0, 0… |
❌ Hammers a struggling dependency instantly |
| Fixed | 1s, 1s, 1s… |
⚠️ Better, but clients sync into a storm |
| Exponential | 1s, 2s, 4s, 8s… |
🙂 Backs off as trouble persists; still synced |
| Exponential + full jitter | rand(0,1), rand(0,2), rand(0,4)… |
✅ The default — backs off and desynchronizes |
| Decorrelated jitter | rand(base, prev×3), capped |
✅ AWS’s recommendation; spreads load smoothest |
Only retry idempotent operations. An operation is idempotent if doing it twice has the same effect as doing it once — reading a value, setting a key to X, deleting a record by ID. Retrying those is safe. Retrying “charge $50” or “send the notification” is how a customer gets billed twice or emailed five times, because the first attempt may have succeeded on the server and only the response got lost. When you must retry a non-idempotent op, make it idempotent first with an idempotency key — a unique token the server uses to dedupe repeats — which is why every serious payments API requires one.
| Operation | Idempotent? | Safe to retry blindly? |
|---|---|---|
HTTP GET / read a row |
✅ Yes | ✅ Yes |
HTTP PUT (set to a value) / DELETE by id |
✅ Yes | ✅ Yes |
Set a config key to X |
✅ Yes | ✅ Yes |
HTTP POST (create) / “charge card” |
❌ No | ❌ No — use an idempotency key |
| “Send email/SMS” / publish an event | ❌ No | ❌ No — dedupe downstream |
counter += 1 / append to a log |
❌ No | ❌ No — double-counts on retry |
The circuit breaker: stop hammering a corpse
Retries handle a blip. But what about a dependency that’s been down for two minutes? Retrying every request against it is pointless — you’re spending your own threads and latency to get failures you already know are coming, and your retries are part of the load keeping it down. The circuit breaker is the pattern that notices “this dependency is clearly down” and stops calling it for a while. It’s a small state machine with three states, named after an electrical breaker that trips to stop a fire:
| State | Behavior | Transitions to | On… |
|---|---|---|---|
| CLOSED | ✅ Calls pass through normally; count failures | OPEN | failure_threshold consecutive failures |
| OPEN | ❌ Fast-fail immediately without calling the dependency | HALF_OPEN | The recovery_timeout cool-off elapses |
| HALF_OPEN | ⚠️ Allow one trial call to probe | CLOSED (on success) / OPEN (on failure) | The probe’s outcome |
The magic is the OPEN state: while open, the breaker refuses to call the dependency at all and fails instantly, which (a) gives your caller a fast, predictable failure instead of a slow timeout, and (b) takes your load off the struggling dependency so it can recover. After a cool-off it cautiously probes once (HALF_OPEN); if that works, it closes and normal service resumes. Here’s a minimal but complete implementation:
# circuit_breaker.py
import time

class CircuitOpenError(Exception):
    """Raised when the breaker is OPEN and refuses to call the dependency."""

class CircuitBreaker:
    def __init__(self, failure_threshold=3, recovery_timeout=0.5):
        self.failure_threshold = failure_threshold
        self.recovery_timeout = recovery_timeout
        self.state, self.failures, self.opened_at = "CLOSED", 0, 0.0

    def call(self, fn, *args, **kwargs):
        if self.state == "OPEN":
            if time.perf_counter() - self.opened_at >= self.recovery_timeout:
                self.state = "HALF_OPEN"                 # time to probe
                print("  breaker -> HALF_OPEN (probing once)")
            else:
                raise CircuitOpenError("circuit is OPEN; fast-failing")
        try:
            result = fn(*args, **kwargs)
        except Exception:
            self._on_failure()
            raise
        else:
            self._on_success()
            return result

    def _on_success(self):
        if self.state == "HALF_OPEN":
            print("  breaker -> CLOSED (probe succeeded, recovered)")
        self.failures, self.state = 0, "CLOSED"

    def _on_failure(self):
        self.failures += 1
        if self.state == "HALF_OPEN":
            self.state, self.opened_at = "OPEN", time.perf_counter()   # probe failed
            print("  breaker -> OPEN (probe failed, backing off again)")
        elif self.failures >= self.failure_threshold:
            self.state, self.opened_at = "OPEN", time.perf_counter()
            print(f"  breaker -> OPEN (hit {self.failures} failures)")
Drive it against a dependency that starts DOWN and later recovers, and watch the state machine earn its keep:
class Dependency:
    def __init__(self): self.up, self.real_calls = False, 0
    def __call__(self):
        self.real_calls += 1
        if not self.up:
            raise ConnectionError("dependency down")
        return "OK"

dep = Dependency()                       # starts DOWN
cb = CircuitBreaker(failure_threshold=3, recovery_timeout=0.5)

def attempt(label):
    try:
        print(f"{label}: {cb.call(dep)}   [state={cb.state}]")
    except CircuitOpenError as e:
        print(f"{label}: FAST-FAIL ({e})   [state={cb.state}]  (dependency NOT called)")
    except ConnectionError as e:
        print(f"{label}: error ({e})   [state={cb.state}]")

print("Phase 1 - dependency is DOWN. Watch the breaker trip after 3 failures:")
for i in range(1, 6):
    attempt(f"  call {i}")
print(f"\n  (real calls that reached the dead dependency so far: {dep.real_calls})")

print("\nPhase 2 - wait out the recovery timeout; dependency comes back UP:")
time.sleep(0.55)
dep.up = True
attempt("  call 6"); attempt("  call 7")
print(f"\n  total real calls to the dependency: {dep.real_calls} "
      f"(without a breaker it would have been 7)")
Phase 1 - dependency is DOWN. Watch the breaker trip after 3 failures:
  call 1: error (dependency down)   [state=CLOSED]
  call 2: error (dependency down)   [state=CLOSED]
  breaker -> OPEN (hit 3 failures)
  call 3: error (dependency down)   [state=OPEN]
  call 4: FAST-FAIL (circuit is OPEN; fast-failing)   [state=OPEN]  (dependency NOT called)
  call 5: FAST-FAIL (circuit is OPEN; fast-failing)   [state=OPEN]  (dependency NOT called)

  (real calls that reached the dead dependency so far: 3)

Phase 2 - wait out the recovery timeout; dependency comes back UP:
  breaker -> HALF_OPEN (probing once)
  breaker -> CLOSED (probe succeeded, recovered)
  call 6: OK   [state=CLOSED]
  call 7: OK   [state=CLOSED]

  total real calls to the dependency: 5 (without a breaker it would have been 7)
Read the payoff in the last line: 7 logical calls, but only 5 reached the dead dependency. After 3 failures the breaker tripped, and calls 4 and 5 fast-failed without touching the dependency — no wasted thread, no added load, an instant predictable failure. Then after the cool-off, one HALF_OPEN probe confirmed recovery and normal service resumed. Scale “2 calls saved out of 7” up to a fleet of servers doing thousands of requests a second against a dependency that’s down for two minutes, and the breaker is the difference between “the dependency recovers on its own” and “our retries kept it pinned down until an engineer intervened.” That’s why it’s the third guard in the diagram: retries handle the blip, the breaker handles the outage.
Fallbacks, bulkheads, and the rest
Three more patterns round out the toolkit. A fallback is graceful degradation: when the guards give up, return something useful — a cached value, a sensible default, a partial result — instead of an exception. A product page that can’t reach the recommendations service should show the page without recommendations, not a 500; a currency converter that can’t reach the live-rate API should fall back to the last cached rate with a “prices may be slightly stale” note. The one rule: the fallback must be cheap and must never call the failing dependency — a fallback that retries the thing that’s already down is just the outage wearing a hat.
A bulkhead partitions resources — separate thread pools or connection pools per dependency — so that one slow dependency saturating its pool can’t starve calls to a healthy one. It’s named for a ship’s watertight compartments, which stop one flooded section from sinking the whole vessel. The failure it prevents is subtle and common: without bulkheads, a single shared thread pool means that when dependency A hangs, its stuck calls consume every thread in the pool, and now calls to the perfectly-healthy dependency B can’t get a thread either — one slow dependency has taken down features that don’t even use it. Give A and B their own pools and A’s bad day stays A’s.
And rate limiting caps the request rate you send or accept — a token bucket that refills at a fixed rate is the usual implementation. It protects a downstream from your traffic spike (be a polite client) and protects you from a client’s (shed load before it tips you over). All of these share the breaker’s philosophy: they assume failure is normal and contain its blast radius rather than pretending they can prevent it. That mental shift — from “make each piece perfect” to “make the whole survivable when a piece fails” — is the entire difference between code that works in a demo and code that works at 3 a.m. under real load.
Observability: you can’t fix what you can’t see
Build all the resilience in the world and you’re still blind if you can’t see what your system is doing. Observability is the property of being able to ask arbitrary questions about your running system from the outside — and it rests on three distinct kinds of signal that people constantly confuse:
| Signal | Answers | Granularity | Cost / cardinality | Example |
|---|---|---|---|---|
| Logs | “What happened to this one request?” | Per-event, detailed | High volume, cheap per line | {"event":"order.failed","order_id":42,"error":"503"} |
| Metrics | “What’s the shape across all requests?” | Aggregated numbers over time | Low, cheap to store & query | error_rate = 0.017, p95_latency = 240ms |
| Traces | “Where did this request spend its time across services?” | Per-request, across service hops | Medium; sampled in practice | Span: gateway 5ms → auth 12ms → db 180ms |
The rule of thumb: logs are for one request, metrics are for all of them, traces are for one request across many services. You reach for logs when you know which request went wrong (“show me order 42”); metrics when you want to know if something is wrong at all (“is the error rate climbing?”); traces when a request is slow and you need to know which hop ate the time. The first two are stdlib-cheap, so let’s make them concrete.
Structured logging means logging machine-parseable objects (usually JSON), not prose sentences. logging.info(f"user {uid} failed after {ms}ms") is unparseable at scale — you can’t query it, aggregate it, or alert on it. Emit a JSON object with named fields and every log aggregator can filter, group, and graph it.
| Unstructured (prose) | Structured (JSON) | |
|---|---|---|
| Line | User 42 failed after 21ms: 503 |
{"event":"order.failed","user":42,"ms":21,"code":503} |
| Query “all 503s” | ❌ Regex-scrape, fragile | ✅ code == 503 |
| Aggregate “p95 by user” | ❌ Effectively impossible | ✅ Group by user, percentile ms |
| Alert on error rate | ❌ Grep heuristics | ✅ Count event == "*.failed" |
| Correlate a request | ❌ Manual | ✅ Filter request_id / trace_id |
Here’s structured logging plus RED metrics — the three numbers that describe any request-serving system: Rate (requests/sec), Errors (error rate), Duration (latency percentiles):
# observability.py  (abridged -- full version in the scratchpad)
import json, logging, time, random

class JsonFormatter(logging.Formatter):
    def format(self, record):
        payload = {"level": record.levelname, "event": record.getMessage(),
                   **getattr(record, "fields", {})}
        return json.dumps(payload)

logger = logging.getLogger("orders"); logger.setLevel(logging.INFO)
_h = logging.StreamHandler(); _h.setFormatter(JsonFormatter())
logger.addHandler(_h); logger.propagate = False

def log(level, event, **fields):
    logger.log(level, event, extra={"fields": fields})

class RED:                                       # Rate, Errors, Duration
    def __init__(self): self.requests = self.errors = 0; self.durations = []
    def record(self, ok, seconds):
        self.requests += 1
        if not ok: self.errors += 1
        self.durations.append(seconds)
    def report(self, window_s):
        ds = sorted(self.durations)
        return {"rate_per_s": round(self.requests / window_s, 1),
                "error_rate": round(self.errors / self.requests, 3),
                "p50_ms": round(ds[len(ds)//2] * 1000, 1),
                "p95_ms": round(ds[min(int(len(ds)*0.95), len(ds)-1)] * 1000, 1)}
Running it over 40 requests against a handler with a built-in 15% error rate emits queryable log lines and a RED summary:
{"level": "INFO", "event": "order.processed", "order_id": 0, "duration_ms": 12.9, "status": "ok"}
{"level": "ERROR", "event": "order.failed", "order_id": 2, "duration_ms": 21.6, "error": "downstream 503"}
{"level": "ERROR", "event": "order.failed", "order_id": 10, "duration_ms": 22.7, "error": "downstream 503"}
--- RED summary over 0.77s ---
{
  "rate_per_s": 51.9,
  "error_rate": 0.175,
  "p50_ms": 18.4,
  "p95_ms": 27.9
}
Those four RED numbers are what you put on a dashboard and alert on: rate 51.9/s tells you throughput, error_rate 0.175 is the health signal (alert if it crosses a threshold), and p50/p95 are your latency story. Note why percentiles, not the average: an average latency hides the tail, and the tail is where users suffer. A p50 of 18ms with a p95 of 28ms is healthy; the same average with a p95 of 3000ms means one request in twenty is agonizing — and the mean would never show it. Alert on p95/p99, never the mean. This connects straight back to Logging & Debugging: structured logs are that lesson’s logging module used the way production needs it.
RED isn’t the only metric framework — pick by what you’re monitoring. RED describes request-serving work from the caller’s side; USE describes resources from the machine’s side; the four golden signals are Google’s superset:
| Framework | Stands for | Best for | The three-to-four numbers |
|---|---|---|---|
| RED | Rate, Errors, Duration | ✅ Request-driven services (APIs, workers) | req/s · error % · p50/p95 latency |
| USE | Utilization, Saturation, Errors | Resources (CPU, disk, pool, queue) | % busy · queue depth · error count |
| Four golden signals | Latency, Traffic, Errors, Saturation | Google SRE — a superset of both | the union of the above |
One more essential: health checks. A production service exposes an endpoint (conventionally /healthz) that orchestrators poll to decide if it’s alive. Two flavors, and conflating them causes outages: a liveness check answers “is the process wedged and in need of a restart?” (keep it dumb — just “am I running?”), while a readiness check answers “can I serve traffic right now?” (checks dependencies — DB reachable, cache warm). ⚠️ The classic mistake is making liveness check the database: the DB blips, every instance reports “unhealthy,” the orchestrator kills them all, and you’ve turned a dependency hiccup into a total outage. Liveness = “am I alive?”; readiness = “should you send me traffic?”
| Health check | Answers | Should check | ⚠️ Must NOT |
|---|---|---|---|
Liveness (/healthz) |
“Restart me?” | Only “is my event loop running?” | Check external deps — a blip → mass restart |
Readiness (/readyz) |
“Route traffic to me?” | DB, cache, downstream reachability | Be so strict it flaps on every minor blip |
| Startup | “Am I done booting?” | One-time init complete | Be confused with liveness (different timeout) |
Maintainability: code is read far more than it’s written
Here’s the truth that reframes everything: you will spend far more time reading code than writing it — debugging it, extending it, reviewing it, understanding it at 3 a.m. during an incident. So the reader, not the writer, is the customer of your code, and maintainability is the discipline of optimizing for that reader. It’s not separate from production concerns — it is one, because it directly sets your MTTR (mean time to recovery). When code is readable, well-typed, small-functioned, and documented, a fix that would take four hours takes four minutes. That gap is the entire business case.
The concrete levers, in rough order of bang-for-buck:
| Lever | What it buys | Tool / practice | The cost of skipping it |
|---|---|---|---|
| Readable names & small functions | Fast comprehension | Descriptive names; one job per function | Every read costs minutes; bugs hide |
| Type hints | Bugs caught before runtime; self-documenting | def f(x: int) -> str, mypy/pyright |
Whole class of TypeErrors ship to prod |
| Docstrings | The why and the contract | """One line, then details.""" |
The next reader reverse-engineers intent |
| Low cyclomatic complexity | Testable, understandable branches | radon, flake8-mccabe; extract methods |
Untestable tangles; missed edge cases |
| Tests | Confidence to change | pytest; refactor behind green tests |
Every change is a gamble |
| Consistent style | No cognitive tax on formatting | black, ruff (auto-format + lint) |
Bikeshedding; noisy diffs |
Type hints plus a checker is the highest-leverage habit for a growing codebase, because it moves a whole category of bugs from runtime in production to your editor before you commit. The hints alone do nothing at runtime — Python ignores them — but a static checker like mypy reads them and catches mismatches without running a line of code. Watch it catch a real bug:
# typed_bug.py
def apply_discount(price: float, pct: float) -> float:
    return price * (1 - pct / 100)

def checkout(cart: dict[str, float]) -> float:
    total = sum(cart.values())
    return apply_discount(total, "10")   # BUG: "10" is a str, not a float
mypy typed_bug.py
typed_bug.py:7: error: Argument 2 to "apply_discount" has incompatible type "str"; expected "float"  [arg-type]
Found 1 error in 1 file (checked 1 source file)
mypy found the bug — a string passed where a float was required — without executing the code. At runtime "10" would sail through pct / 100 and blow up with a TypeError deep inside apply_discount, probably in production, probably on a Friday. The type checker caught it at author time, pointed at the exact line, and named the exact problem. Multiply that across a codebase and hints pay for themselves many times over — which is why every large Python shop (Dropbox, Instagram, and the typeshed project itself) runs one.
Cyclomatic complexity is a number worth knowing: it counts the independent paths through a function — essentially one plus the number of branches (if, for, and, except). A function with complexity 3 needs 3 tests to cover its paths and fits in your head; a function with complexity 25 is a bug farm nobody can fully test or reason about. The fix is almost always extract: pull a branchy block into a well-named helper, and both functions become simple. A rough reading:
| Cyclomatic complexity | Verdict | Action |
|---|---|---|
| 1–5 | ✅ Simple, easily testable | Ship it |
| 6–10 | 🙂 Fine, watch it | Fine for now |
| 11–20 | ⚠️ Getting risky | Consider extracting methods |
| 21+ | ❌ A bug farm | Refactor before adding to it |
Small functions and docstrings are the two cheapest readability wins, and they reinforce each other. A function should do one thing — the moment you find yourself writing a comment like # now validate the input halfway down a function, that block wants to be a function called validate_input. Small, single-purpose functions are easier to name (a function that does one thing has an obvious name; a function that does five has a vague one like process or handle), easier to test (one behavior, a handful of cases), easier to reuse, and — the underrated part — easier to read past: a well-named call like total = apply_discounts(cart) lets a reader skip the how and trust the what, which is most of what reading code for comprehension actually is. The docstring then carries the contract and the why, the two things the code itself can’t tell you: the code shows what it does, the docstring says what it promises (inputs, outputs, raised exceptions, edge cases) and why it exists. """Return the cart total after applying active discounts. Raises ValueError on a negative price.""" is worth more than ten inline comments, because it survives refactors and shows up in help(), IDEs, and generated docs. The rule of thumb: comment the why, let clear names carry the what, and reserve docstrings for the public contract of every function, class, and module a teammate might call.
Then there’s technical debt — the concept that ties maintainability to real engineering judgment. The metaphor is a loan: taking a shortcut now (skipping a test, hardcoding a value, copy-pasting instead of abstracting) borrows speed today against interest paid on every future change. Debt isn’t automatically bad — sometimes shipping Tuesday matters more than perfect code, and that’s a legitimate business call. What matters is which kind it is, per Martin Fowler’s quadrant:
| Prudent (a considered choice) | Reckless (avoidable) | |
|---|---|---|
| Deliberate | “Ship now, refactor next sprint” — ✅ fine if you actually do | “No time for design” — ❌ the dangerous one |
| Inadvertent | “Now we know how it should’ve been structured” — ✅ learning | “What’s a layered architecture?” — ❌ fix by learning |
The debt that sinks teams is deliberate-reckless (“we don’t have time to do it right”) and unpaid prudent-deliberate (the “next sprint” that never comes). The antidotes are two habits. The boy-scout rule: leave every file a little cleaner than you found it — a better name here, a broken-out function there — so the codebase improves continuously instead of decaying. And refactoring behind tests: you can only safely restructure code that has tests pinning its behavior, because the tests tell you the instant a “harmless” change broke something. Refactoring without tests isn’t refactoring, it’s just changing code and hoping. The sequence is always: green tests → change the structure → tests still green → commit. Do that and maintainability compounds; skip it and every change is a coin flip.
Hands-on lab
You’ll do the three things this whole lesson is about, for real: profile a slow function and fix it, build a retry decorator and a circuit breaker and demonstrate them against a flaky dependency, and add a timeout. Everything is stdlib — no accounts, no paid APIs.
Step 1 — Set up
mkdir prod-lab && cd prod-lab
python3 -m venv .venv
source .venv/bin/activate            # Windows: .venv\Scripts\activate
python --version                     # want 3.11+; 3.12 ideal
⚠️ Use a real 3.12 (/usr/local/bin/python3.12 on macOS, since the system python3 is 3.9). What just happened: an isolated environment — the reliability code is pure stdlib, so nothing to install yet.
Step 2 — Profile a slow function and fix it
Save slow_filter.py from the profiling section, then profile it:
python -m cProfile -s tottime slow_filter.py
Read the report: is_blocked dominates tottime (2.347 of 2.357s), called 20,000 times. That’s an O(n) list-membership scan. Now save and run optimize_filter.py (also from above) to swap the list for a set:
python optimize_filter.py
20000 events kept
  list membership O(n) : 2.300s
  set membership  O(1) : 0.00120s
  speedup              : 1913x
What just happened: you let the profiler point at the hot function instead of guessing, changed the data structure (not micro-tuned), verified the answer was identical with assert a == b, and measured ~1900x. That four-step loop — profile, fix the top line, verify correctness, re-measure — is the whole discipline.
Step 3 — A retry decorator and a circuit breaker vs a flaky dependency
Save retry_backoff.py and circuit_breaker.py from the reliability section and run each:
python retry_backoff.py        # rides out 2 transient failures, recovers on call 3
python circuit_breaker.py      # trips OPEN after 3 failures, fast-fails, then recovers
# circuit_breaker.py
Phase 1 - dependency is DOWN. Watch the breaker trip after 3 failures:
  call 1: error (dependency down)   [state=CLOSED]
  ...
  breaker -> OPEN (hit 3 failures)
  call 4: FAST-FAIL (circuit is OPEN; fast-failing)   [state=OPEN]  (dependency NOT called)
Phase 2 - wait out the recovery timeout; dependency comes back UP:
  breaker -> HALF_OPEN (probing once)
  breaker -> CLOSED (probe succeeded, recovered)
  total real calls to the dependency: 5 (without a breaker it would have been 7)
What just happened: the retry rode through transient failures without the caller ever seeing an error; the breaker detected a sustained outage, stopped calling the dead dependency (saving 2 of 7 calls), and auto-recovered via a HALF_OPEN probe. Retries handle blips; breakers handle outages.
Step 4 — Add a timeout, and compose all three
Save timeout_demo.py and run it — the caller abandons a 5-second hang after 0.5s. Then, for the capstone, compose timeout + retry + breaker into one resilient client with a fallback (the resilient_client.py pattern):
Dependency DOWN -- resilient calls fall back, breaker eventually opens:
  call 1: FALLBACK (cache) [ConnectionError]  [breaker=OPEN, real_calls=3]
  call 2: FALLBACK (cache) [CircuitOpenError]  [breaker=OPEN, real_calls=3]
  ...
Recovery -- wait out the breaker, bring the dependency UP:
  call 7: payload  [breaker=CLOSED, real_calls=4]
  call 8: payload  [breaker=CLOSED, real_calls=5]
What just happened: eight logical calls, only five reached the dependency — the first call’s retries tripped the breaker (3 real calls), then calls 2–6 fast-failed to the fallback without touching the dead dependency (real_calls frozen at 3), and after recovery the breaker closed. This is the diagram, running: timeout → retry → breaker → fallback, each guard doing its job, the caller always getting an answer even when the dependency is down.
⚠️ Clean up. deactivate && cd .. && rm -rf prod-lab (⚠️ rm -rf is irreversible — check the directory first).
Common mistakes and troubleshooting
| Symptom / mistake | Cause | Fix |
|---|---|---|
| Optimized a function, total runtime unchanged | Optimized a non-hot function (guessed instead of profiling) | Read the cProfile tottime — fix the top line, not a hunch |
| Micro-tuned a function that runs once at startup | Optimized a cold path — 10x faster than nothing is still nothing | Only optimize hot paths a profile identifies |
x in big_list slow inside a loop |
O(n) membership repeated n times → O(n²) |
Convert to a set/dict once → O(1) lookups |
| Process memory grows until OOM-killed | Unbounded @cache/lru_cache(maxsize=None) on open-ended inputs |
Bound it: lru_cache(maxsize=10_000); only unbounded on finite domains |
TypeError: unhashable type: 'list' from a cached fn |
lru_cache keys on args, which must be hashable |
Pass a tuple, not a list; or a custom key |
| Cache returns stale data | Cached an impure function (reads clock/DB/file) | Only cache pure functions; add TTL/invalidation if not |
| A thread hangs forever; pool exhausts | A network call with no timeout | Pass timeout= to every network call |
| A customer charged twice after a retry | Retried a non-idempotent op; first attempt succeeded, response lost | Retry only idempotent ops; use an idempotency key |
| A brown-out became a full outage | Retry storm — no backoff/jitter, all clients retry in lockstep | Exponential backoff + jitter + a circuit breaker |
| Errors vanish; failures are invisible | Swallowed exceptions (except: pass) |
Log with context and re-raise, or handle explicitly |
| Async service handles one request at a time | A blocking call in a coroutine froze the loop | Async client or asyncio.to_thread (see the async lesson) |
| Latency “looks fine” but users complain | Watching the mean, which hides the tail | Alert on p95/p99, never the average |
| A DB blip restarted every instance at once | Liveness check probed the database | Liveness = “am I running?”; deps go in readiness |
cProfile says fast; the app is slow |
Profiled a warm path, or the slow part is I/O wait | Profile the real (cold vs warm) path; compare wall vs CPU time |
Three of these deserve more than a row.
Optimizing without profiling is the cardinal sin, and it’s seductive precisely because it feels productive. You read the code, a function looks slow — it’s long, it’s nested, it’s ugly — and you spend an afternoon making it 10x faster. Then the total runtime doesn’t move, because that function was 0.5% of it and the real cost was an O(n) membership test three files over that you never looked at. You added complexity, risk, and a subtle bug, and bought nothing. The profiler is not optional busywork before the “real” optimization; it is the optimization’s most important step, because it’s the only thing that stops you solving the wrong problem. Every hour you spend optimizing without a profile in front of you is an hour gambled on intuition that the research says is a coin flip.
Swallowing exceptions is how failures become invisible, and invisible failures are the worst kind. except Exception: pass feels like defensive coding — you’re “handling” the error — but what you’ve actually done is delete the evidence. The operation failed, nobody knows, the data is now subtly wrong, and three weeks later someone spends two days tracing a corruption back to a pass that ate the exception that would’ve told them instantly. If you catch an exception, do something real with it: log it with enough context to act on, convert it to a domain error, or re-raise it. “Handling” an error by discarding it is the reliability equivalent of unplugging the smoke detector because the beeping is annoying.
The retry storm is the failure that turns a small problem into a catastrophe, and it’s counterintuitive because retries are supposed to help. Here’s the trap: a dependency slows down under load. Every client’s naive retry fires — with no backoff, immediately; with no jitter, all at once. Those retries are additional load on the already-struggling dependency, so it slows further, so more requests fail, so more retries fire. The system has built itself a positive feedback loop that drives the dependency straight into the ground, and it does so fastest exactly when the dependency is most fragile. The three defenses must all be present: backoff (space retries out, exponentially), jitter (desynchronize the fleet), and a circuit breaker (stop retrying entirely once it’s clearly down). Any one alone is insufficient. This is why “just add a retry” is one of the most dangerous three-word phrases in distributed systems.
Cheat-sheet
| Profiling & performance | What it does |
|---|---|
python -m timeit -s "setup" "stmt" |
✅ Micro-benchmark a one-liner; report the min |
timeit.repeat(stmt, setup, repeat=5) |
List of timings — take min(...) |
python -m cProfile -s tottime app.py |
✅ Find the leaf hot function (self-time) |
python -m cProfile -s cumtime app.py |
Find the expensive path (includes sub-calls) |
pstats.Stats(pr).sort_stats("tottime").print_stats(10) |
Post-process a cProfile.Profile() in code |
tracemalloc.start() → take_snapshot() → compare_to() |
Find the line allocating memory (⚠️ start first) |
time.perf_counter() vs time.process_time() |
Wall time (incl. waiting) vs CPU time (computing) |
@functools.lru_cache(maxsize=N) |
✅ Memoize a pure fn; .cache_info() for hit rate |
@functools.cache (3.9+) |
Unbounded memoize — ⚠️ finite input domains only |
set / dict membership |
O(1) vs list’s O(n) — ~3,000x measured |
''.join(parts) |
Build strings once, not with += in a loop |
| Reliability decorators & patterns | What it does |
|---|---|
t.join(timeout) / future.result(timeout=s) |
Client-side timeout — caller stops waiting |
requests.get(url, timeout=5) |
✅ Native timeout — always pass it |
async with asyncio.timeout(s): (3.11+) |
Async-native block timeout |
@retry(attempts, base, factor, jitter=True) |
Retry transient errors; exponential backoff + jitter |
| Retry only idempotent ops | Or a retry double-charges / double-sends |
CircuitBreaker(failure_threshold, recovery_timeout) |
CLOSED → OPEN → HALF_OPEN; stops hammering a dead dep |
| Fallback (cached/default value) | Graceful degradation — degrade, don’t 500 |
| Idempotency key | Makes a repeated write safe to retry |
| Observability & maintainability | What it does |
|---|---|
| Structured (JSON) logs | Machine-parseable; queryable and alertable at scale |
| RED metrics (Rate, Errors, Duration) | The three numbers for any request-serving system |
| p95 / p99 latency, not the mean | The tail is where users suffer; the mean hides it |
| Liveness vs readiness checks | “Am I running?” vs “should you route to me?” |
mypy file.py / pyright |
Catch type bugs before runtime, at author time |
Type hints: def f(x: int) -> str: |
Self-documenting; enables the checker |
Cyclomatic complexity (radon cc) |
Keep functions ≤ 10; extract branchy blocks |
| Boy-scout rule + refactor behind tests | Leave it cleaner; change structure only under green tests |
Interview and exam questions
Q: What’s the single most important rule of performance optimization, and why?
A: Measure, don’t guess — profile before you optimize. Human intuition about “the slow part” is unreliable; the real bottleneck is routinely a function you’d never suspect. Optimizing without a profile means optimizing the wrong thing, which adds complexity and bugs while moving the runtime by nothing. In this lesson cProfile fingered one function eating 2.347 of 2.357 seconds — obvious once measured, invisible by inspection. “Premature optimization is the root of all evil” is really a warning against optimizing before measuring.
Q: In a cProfile report, what’s the difference between tottime and cumtime, and which do you sort by?
A: tottime is time spent in the function itself, excluding calls it makes; cumtime is time in the function plus everything it calls. Sort by cumtime to find which high-level operation is expensive (the costly path); sort by tottime to find the actual leaf function to fix. In the lesson’s profile, build_report and scrub showed high cumtime — but only because they called is_blocked, whose tottime was 2.347s. The tottime column names the real culprit. ⚠️ cProfile adds overhead, so its absolute times are inflated — use it for relative hot spots, then timeit the fix for a true number.
Q: Rank the performance-optimization levers by payoff, with numbers.
A: (1) Algorithm / data structure — biggest by orders of magnitude: list→set membership was ~1,900x here, O(n)→O(√n) is 126x. (2) Caching for pure functions with repeated inputs — memoizing fib(35) was tens of thousands of times faster (~32,000–61,000x across runs; the huge, stable part is turning exponential into linear). (3) Vectorization with NumPy for bulk numeric work — 10–50x. (4) Micro-tuning like ''.join() or local binding — ~1.5–2x, a rounding error that often hurts readability. Work top-down, assert the result is unchanged, and stop when it’s fast enough. The top lever routinely beats everything below it combined.
Q: When does caching help, and when does it actively hurt?
A: It helps when the function is pure (same input → same output, no side effects) and gets repeated inputs with a good hit rate — cache_info() proves it (my fib run: 33 hits, 36 misses). It hurts three ways: caching an impure function serves stale data (it returns yesterday’s clock/DB value forever); an unbounded cache on open-ended inputs (user IDs, payloads) is a memory leak that OOM-kills the process; and a low hit rate is pure overhead with no payoff. Rules: only cache pure functions, bound maxsize for anything open-ended, and check the hit rate instead of assuming.
Q: Why does every network call need a timeout, and what happens without one?
A: Because a call with no timeout doesn’t fail when the dependency hangs — it waits, holding a thread and connection indefinitely. Under load, your thread pool fills with stuck calls until the service stops accepting work: the dependency’s hang becomes your outage. A timeout converts an unbounded hang into a fast, predictable failure you can handle. ⚠️ Note that a client-side timeout means the caller stops waiting — Python can’t force-kill the worker thread, which keeps running. Always prefer the library’s native timeout= (e.g. requests.get(url, timeout=5)) over a bolt-on.
Q: Walk through a circuit breaker’s three states and what problem it solves. A: CLOSED — calls pass through, failures are counted; after N consecutive failures it trips to OPEN. OPEN — it fast-fails every call without touching the dependency, which gives the caller an instant predictable failure and, crucially, removes your load from the struggling dependency so it can recover; after a cool-off it moves to HALF_OPEN. HALF_OPEN — it allows one probe call: success → back to CLOSED (recovered), failure → back to OPEN. It solves the “hammering a corpse” problem: retrying a dependency that’s been down for minutes wastes your resources and keeps it down. Measured: against a down dependency, only 5 of 7 calls reached it — the breaker fast-failed the rest.
Q: What are the rules for retrying safely, and what’s a “retry storm”?
A: Retry only idempotent operations (safe to run twice — GET, PUT, delete-by-ID), only transient errors (503, timeout, connection reset — never a 400/404/ValueError), with exponential backoff (space tries out) and jitter (randomize so clients don’t sync). Retrying a non-idempotent op like “charge a card” double-charges when the first attempt succeeded but its response was lost. A retry storm is the feedback loop where a dependency slows, all clients retry at once (no backoff/jitter), those retries add load, it slows more, more retries fire — driving it into a full outage. The defenses are backoff + jitter + a circuit breaker, all three.
Q: Logs vs metrics vs traces — what’s each for? A: Logs answer “what happened to this one request?” — per-event, detailed, high-volume (a JSON line per event). Metrics answer “what’s the shape across all requests?” — aggregated numbers over time, cheap to store and alert on (error rate, p95 latency). Traces answer “where did this request spend its time across services?” — a per-request timeline of hops. Rule of thumb: logs for one request, metrics for all of them, traces for one request across many services. The RED method (Rate, Errors, Duration) is the standard metric set for a request-serving system.
Q: Why alert on p95/p99 latency instead of the average? A: Because the average hides the tail, and the tail is where users suffer. A p50 of 18ms with a p95 of 28ms is healthy; the same mean can coexist with a p95 of 3000ms, meaning one request in twenty is agonizingly slow — and the average would never reveal it. Percentiles describe the distribution; the mean flattens it into a single number that can look fine while a meaningful fraction of users have a terrible experience. Alert on p95/p99.
Q: What is technical debt, and is it always bad? A: It’s the metaphor of a loan — a shortcut now (skip a test, hardcode a value, copy-paste) borrows speed today against interest paid on every future change. It’s not always bad: shipping Tuesday sometimes matters more than perfect code, and taking prudent, deliberate debt with a plan to repay it is legitimate engineering. What’s dangerous is reckless debt (“no time to do it right”) and unpaid prudent debt (the “next sprint” refactor that never comes). The antidotes: the boy-scout rule (leave each file cleaner than you found it) and refactoring only behind green tests.
Q: Why is maintainability a production concern, not just an aesthetic one?
A: Because it sets your MTTR — mean time to recovery. When something breaks at 3 a.m. (and it will), how fast you can fix it is dominated by how readable, well-typed, and observable the code is. Unreadable code is slow to diagnose (bad MTTR); un-instrumented code fails invisibly (bad reliability); un-typed code ships TypeErrors to prod. A one-line fix in clean code takes minutes; the same fix in a tangled, untested mess takes hours. Maintainability is the substrate performance and reliability grow in — it’s the difference between a four-minute incident and a four-hour one.
Q (coding): Write a retry decorator with exponential backoff and jitter that only retries chosen exceptions. A:
import time, random, functools

def retry(attempts=4, base=0.1, factor=2.0, max_delay=10.0, exceptions=(Exception,)):
    def decorator(fn):
        @functools.wraps(fn)
        def wrapper(*args, **kwargs):
            delay = base
            for attempt in range(1, attempts + 1):
                try:
                    return fn(*args, **kwargs)
                except exceptions as exc:
                    if attempt == attempts:
                        raise                          # exhausted -> surface the error
                    sleep_for = random.uniform(0, min(delay, max_delay))  # full jitter
                    time.sleep(sleep_for)
                    delay *= factor                    # exponential backoff
        return wrapper
    return decorator
The points tested: functools.wraps to preserve the wrapped function’s identity; a specific exceptions tuple so you don’t retry permanent errors (a ValueError shouldn’t be retried); exponential growth (delay *= factor); jitter (random.uniform) to desynchronize a fleet; a max_delay cap; and re-raising the last exception once attempts are exhausted so the real failure surfaces instead of vanishing.
Key takeaways
- Measure, don’t guess — it’s the one performance rule that’s never wrong. Profile before you optimize; intuition about “the slow part” is a coin flip.
cProfilefor the hot function (tottime= the leaf to fix,cumtime= the expensive path),timeitfor micro-benchmarks (report the min),tracemallocfor memory. In this lesson the profile pointed at a function eating 2.347 of 2.357s — invisible by inspection. - Fix the algorithm and data structure first. The levers descend by orders of magnitude: list→set membership was ~1,900x, memoizing
fibwas tens of thousands of x (exponential→linear), vectorization 10–50x, micro-tuning ~1.5–2x. Alwaysassertthe optimized result equals the original — a faster wrong answer is a bug, not an optimization. - ⚠️ Caching is a loaded tool. Only memoize pure functions with repeated inputs and a good hit rate (
cache_info()proves it); boundmaxsizeon open-ended inputs or@cachebecomes a memory leak; keys must be hashable. Caching an impure function serves stale data forever. - Failures are normal at scale — design for them. Every network call gets a timeout (or a hang becomes your outage). Retry only idempotent ops on transient errors, with exponential backoff + jitter to avoid a retry storm. A circuit breaker (CLOSED→OPEN→HALF_OPEN) stops you hammering a dependency that’s already down — measured, it spared a dead dependency 2 of 7 calls and auto-recovered.
- Compose the guards, and always have a fallback. Timeout inside retry inside breaker, with a cached/default value when all give up — graceful degradation means a degraded feature, not a 500. Eight logical calls in the capstone reached the dependency only five times, and the caller always got an answer.
- ⚠️ Never swallow exceptions.
except: passdeletes the evidence and turns a loud failure into a silent corruption someone debugs for days. Log with context and re-raise, or handle explicitly. - Observability is three signals: logs (one request), metrics (all requests), traces (one request across services). Emit structured (JSON) logs and RED metrics (Rate, Errors, Duration), and alert on p95/p99, never the mean — the mean hides the tail where users suffer.
- Maintainability is a production concern because it sets MTTR. Code is read far more than written: readable names, small low-complexity functions, type hints checked with
mypy(it caught astr-for-floatbug without running the code), docstrings, and refactoring only behind green tests. Take debt prudently and pay it down — the boy-scout rule keeps the codebase from decaying.