Here is the moment this lesson is about. Your service works. It has a clean API, tests pass, the pricing rules are a pure core behind injected adapters, and it serves a few hundred users without breaking a sweat. Then something good happens — a launch, a link on the front page, a big customer — and traffic goes up a hundredfold overnight. The database that answered in 3 ms now takes 3 seconds. Requests pile up behind a slow email-send. One box is at 100% CPU while you have no obvious way to add a second. The thing that worked is now down, and “make it faster” is not a plan.
Designing for that day is a distinct skill from writing the service, and it is mostly not about clever code. It is about a handful of structural decisions — where state lives, what sits on the read path, what runs off the request — that you make (or fail to make) long before the traffic arrives. This lesson teaches those decisions as a repeatable method, and grounds every one of them in code you can run. The design reasoning is the point; the executed snippets are there so that “a cache is faster” and “statelessness lets you add boxes” stop being slogans and become things you have watched happen. Everything labelled executed below was run on Python 3.12.3 with the standard library only — real timings, real output. Everything labelled sketch is a design drawing, and I will say so every time.
Why this matters
The reason system design is worth learning as its own topic is that the failure it prevents is structural and expensive to fix late. A slow function you can profile and speed up in an afternoon. A service whose scaling story is “there is one process and all the state is inside it” cannot be sped up at all — it has to be re-architected, usually under pressure, usually while it is on fire. The cost of the wrong shape is not paid in milliseconds; it is paid in the weekend you spend rewriting the thing to add a second server.
So the mental model to hold for the whole lesson is this: scalability is a property of the architecture, not the code. Two services can have identical Python and completely different scaling ceilings, because one keeps its user sessions in a module-level dict and the other keeps them in Redis. Same language, same framework, same speed per request — but the first one can never run as more than one process, and the second one can run as five hundred. The difference is a design decision, and this lesson is a catalogue of the decisions that matter and how to reason about them.
There is a discipline that keeps this from becoming architecture-astronautics, and it runs through everything here: design for the load you can see coming, not the load you can imagine. The same judgment that stops you under-building — one box, all state local — also stops you over-building a globally-sharded, multi-region, event-sourced cathedral to serve four hundred requests a day. Scalability is the ability to grow without a rewrite; it is emphatically not the obligation to build for Google’s traffic when you have a startup’s. The method below is as much about knowing which levers to leave alone as which to pull.
What “scalable” actually means
“Scalable” gets used as a synonym for “fast” or “good,” which drains it of meaning. The precise definition: a system is scalable if it can handle growth by adding resources, without a redesign. The load 10x-es and you respond by adding boxes (and money), not by rewriting. A system that requires a fundamental rework to handle more is not scalable — it is merely currently-sufficient.
And “growth” has more than one axis. A design that scales beautifully on one can fall over on another, so name which one you mean:
| Axis of growth | What increases | What tends to break first | The usual lever |
|---|---|---|---|
| Request load | Requests per second (RPS) | CPU on the app tier; the database | Horizontal app scaling; caching |
| Data volume | Rows / bytes stored | Query latency; index size; disk | Indexing; partitioning; archiving |
| User count | Concurrent users, sessions | Memory; connection counts | Statelessness; connection pooling |
| Traffic spikes | Peak-to-average ratio | Everything, all at once | Queues (buffering); autoscaling |
| Geography | Users across continents | Round-trip latency (physics) | CDN; regional replicas |
| Team / features | Engineers, service surface | Merge conflicts; deploy risk | Modularity; service boundaries |
Most of this lesson targets the first row — request load — because it is the most common and the most instructive, but keep the table in mind: “will it scale?” is not a yes/no question until you say scale along what.
Vertical versus horizontal — the fork every design reaches
There are exactly two ways to give a system more capacity, and the choice between them shapes everything else.
| Vertical scaling (scale up) | Horizontal scaling (scale out) | |
|---|---|---|
| Move | Bigger box — more CPU, RAM | More boxes — many instances |
| Analogy | A stronger horse | More horses |
| Simplicity | Simple — no code change | Needs stateless design + a balancer |
| Ceiling | Hard — the biggest box that exists | Soft — add more, almost linearly |
| Failure mode | The one box dies → total outage (SPOF) | One box dies → the rest carry on |
| Cost curve | Super-linear (top-end hardware is priced cruelly) | Roughly linear (commodity boxes) |
| Where it applies | Anything, especially stateful databases | Stateless app tiers; sharded data |
Vertical scaling is the tempting first move because it needs no new thinking — you pay for a bigger machine and the problem goes away for a while. It is a completely legitimate first step, and for a database it is often the right one for a long time. But it has a wall: there is a biggest machine, and when you hit it there is nowhere to go. Horizontal scaling has no such wall — you keep adding commodity boxes — but it demands something in return, and that something is the master key of this entire lesson: the app tier must be stateless. Almost everything else here (the load balancer, externalised sessions, the shared cache) exists to make horizontal scaling possible.
The triangle you cannot cheat: latency, throughput, cost
Every scaling decision trades among three quantities, and you rarely improve one without spending another. Get the vocabulary exact, because interviews and incident reviews both turn on the distinction between the first two:
| Quantity | Definition | Measured in | Improve it by | It costs you |
|---|---|---|---|---|
| Latency | Time for one request | ms (and its percentiles) | Caching; closer data; less work per request | Often money or freshness |
| Throughput | Requests handled per unit time | RPS / QPS | More parallelism; more boxes | Money (more hardware) |
| Cost | Money + complexity to run it | $/month, and eng-hours | Fewer/smaller boxes; simpler design | Latency or throughput |
Latency and throughput are not the same thing, and conflating them is the classic beginner error. A checkout line makes it concrete: latency is how long you wait; throughput is how many customers get served per minute. Open more registers and throughput rises — but if each register is slow, your personal latency is still bad. You can have high throughput and terrible latency (a batch system chewing millions of records, each waiting hours), or low latency and terrible throughput (one blazing-fast box that can only do one thing at a time). Scaling out buys throughput. Buying latency is a different job — usually caching, or moving data closer to the user.
One more precision that separates people who have run production systems from people who have not: latency is a distribution, not a number. Report it as percentiles — p50 (median), p95, p99 — never as an average, because averages hide the tail and the tail is what your users feel. If p50 is 20 ms but p99 is 4 s, one request in a hundred is miserable, and at scale “one in a hundred” is a constant stream of angry users. The average might read a comfortable 60 ms and tell you nothing.
The physics you’re up against
You cannot design well against costs you cannot feel, so calibrate on the canonical orders of magnitude — the “latency numbers every programmer should know” (popularised by Jeff Dean). These are approximate and hardware-dependent; memorise the ratios, not the digits:
| Operation | Rough time | Relative to RAM |
|---|---|---|
| L1 cache reference | ~1 ns | 0.01x |
| Main memory (RAM) reference | ~100 ns | 1x (the baseline) |
| Read 1 MB sequentially from RAM | ~10 µs | 100x |
| SSD random read | ~100 µs | ~1,000x |
| Round trip within a datacenter | ~500 µs | ~5,000x |
| Read 1 MB from SSD | ~1 ms | ~10,000x |
| HDD seek | ~10 ms | ~100,000x |
| Round trip across a continent | ~150 ms | ~1,500,000x |
Read that table as the justification for half of system design. A cache hit in RAM is ~100 ns; the database call it replaces is a network round trip plus a disk read — easily 1–10 ms, four to five orders of magnitude slower. That gap is why caching is the highest-leverage tool you have. The cross-continent row is why a CDN exists: no amount of clever code beats the speed of light, so you move the data to the user instead of moving the user’s request across an ocean. Design is largely the art of avoiding the expensive rows of this table.
The design method
System design in an interview or a design doc is not a feat of memory; it is a method you can run every time. Here is the loop, and it is deliberately boring — boring is repeatable:
| Step | Question it answers | Concrete output |
|---|---|---|
| 1. Clarify requirements | What must it do? What are the limits? | Functional + non-functional requirements; scope cuts |
| 2. Estimate the load | How big is this, in numbers? | RPS, data size, read/write ratio (back-of-envelope) |
| 3. Define the API | What are the operations? | A handful of endpoints/signatures |
| 4. Sketch the components | What are the moving parts? | A box diagram: LB, app, cache, queue, DB |
| 5. Find the bottleneck | What breaks first under the estimate? | The one component that saturates |
| 6. Address it, then iterate | How do we relieve it? What breaks next? | A scaling lever applied; back to step 5 |
The two steps beginners skip are 1 and 2, and they are the two that matter most. Requirements separate functional (“shorten a URL, redirect it”) from non-functional — the -ilities that actually drive the architecture: how many requests, how much data, how consistent, how available, how fast. A URL shortener that must never lose a link is a different design from one where the occasional loss is fine. Pin those down before drawing a single box.
Back-of-the-envelope estimation
Step 2 is a superpower precisely because it is so cheap. Two minutes of arithmetic tells you whether you are designing for 40 requests per second or 40,000 — and those are completely different systems. You are not after precision; you are after the order of magnitude, because that is what decides whether a single Postgres box is laughably sufficient or hopelessly inadequate. The quantities worth a napkin:
| Estimate | How to get it | Why it decides the design |
|---|---|---|
| Requests/sec | daily requests ÷ 86,400; then ×2–3 for peak | Sets app-tier box count and cache need |
| Read:write ratio | reads per write (often 10:1 to 1000:1) | Read-heavy → cache + replicas; write-heavy → sharding |
| Data size (5 yr) | records/day × bytes/record × 365 × 5 | One box or many? Fits in RAM? |
| Working set | how much data is hot (recently used) | How big the cache must be to matter |
| Bandwidth | RPS × payload size | Network limits, CDN need |
| Peak factor | peak RPS ÷ average RPS | How much burst headroom / queue buffering |
A couple of reference numbers make the arithmetic fast: a day is 86,400 seconds (round to ~100k), a month is ~2.6 million seconds, and a year is ~31.5 million seconds. So “one million requests a day” is about 12 RPS — a single modest box. “One million requests a minute” is ~17,000 RPS — a genuinely distributed system. Same headline word (“million”), three orders of magnitude apart in what you must build. We run this arithmetic for real in the worked design near the end.
The shape of a scalable service
Run the method on almost any read-heavy web service and you converge on the same topology. It is worth seeing the destination before we tour the parts, because every section that follows is a zoom-in on one box of this picture. Read it left to right: a client’s request crosses a load balancer to one of N stateless app instances; that instance serves reads through a cache (falling back to the database on a miss) and offloads slow work to an async queue that background workers drain; the database, with a read replica, sits behind it all.
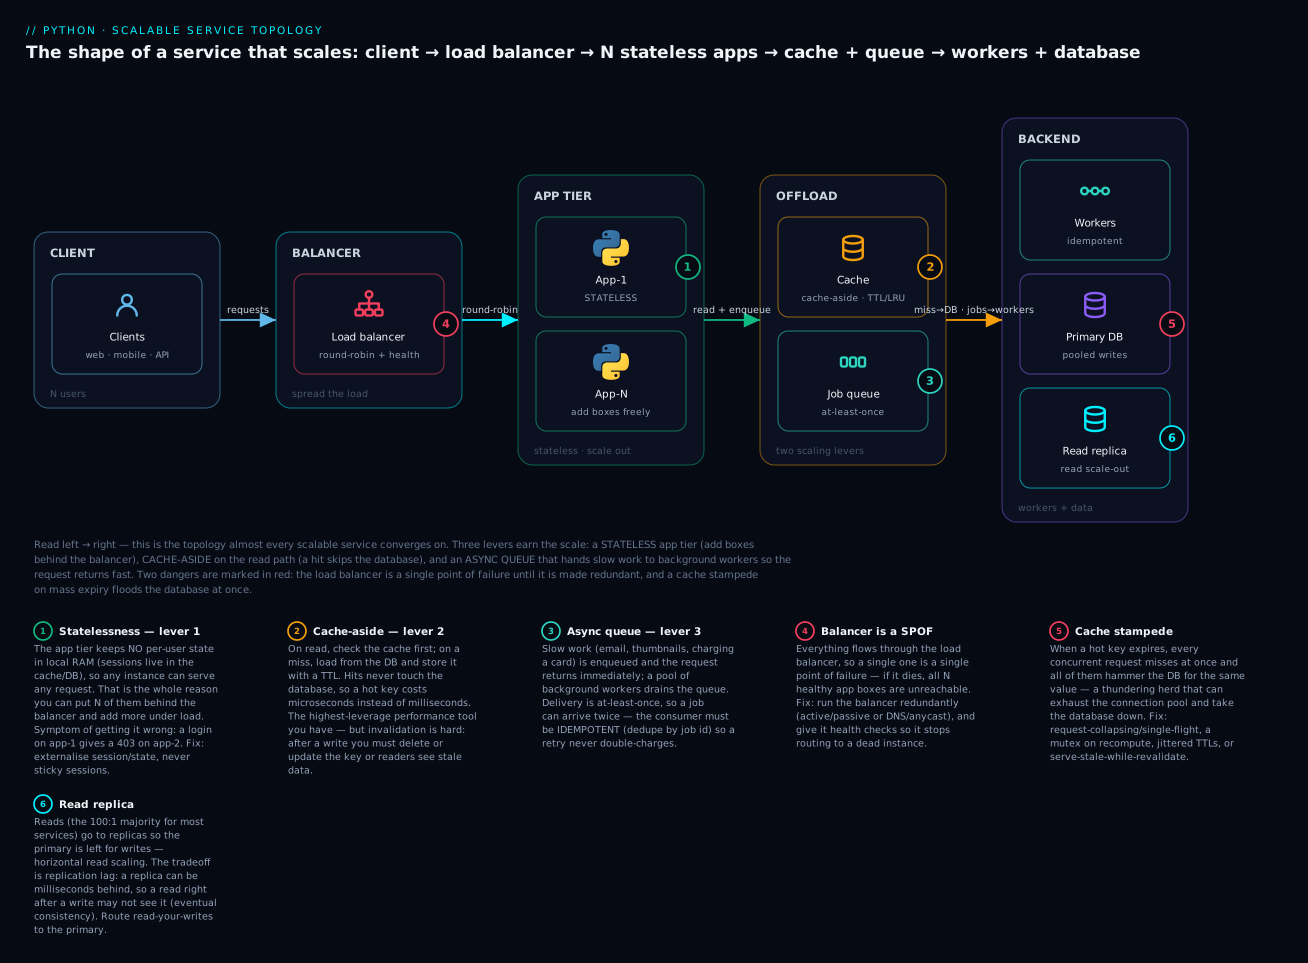
The three coloured badges are the three levers that make this shape scale, and they are the spine of this lesson:
| # | Lever | What it unlocks | Section |
|---|---|---|---|
| 1 | Stateless app tier | Horizontal scaling — add boxes behind the balancer | Statelessness |
| 2 | Cache on the read path | Cuts read latency ~1000x; shields the database | Caching |
| 3 | Async queue offload | Fast responses; absorbs spikes; slow work runs elsewhere | Queues |
The two red badges are the dangers this shape introduces — a load balancer that is itself a single point of failure, and a cache stampede that floods the database when hot keys expire together. A scalable design is not just the levers; it is the levers plus an honest accounting of what each one can break. We will pull each lever and then name its failure mode.
Before the parts, the layering that keeps it maintainable. The topology above is the physical shape (boxes and wires); inside each app instance is a logical layering you already met in the SOLID and architecture lesson:
| Layer | Responsibility | Depends on | Must not contain |
|---|---|---|---|
| API / handler | Parse the request, serialise the response, auth | The service layer | Business rules; SQL |
| Service / domain | Business logic, orchestration, the pure core | Ports (abstractions) | HTTP or SQL details |
| Data access | Talk to the database; map rows ↔ objects | The driver / ORM | Business rules |
| Storage | The database, cache, queue themselves | — | — |
Layering is not bureaucracy; it is what lets you swap the storage row (SQLite → Postgres, add a cache) without touching the business row, which is exactly the freedom you need when the bottleneck moves. The physical topology scales the service; the logical layering keeps it changeable while it scales.
Here are the components of that topology as a reference, each with its role, a concrete Python-world example, and the scaling property that earns its place:
| Component | Role | Python-world example | Scaling property |
|---|---|---|---|
| Load balancer | Spread requests over app instances | nginx, HAProxy, cloud LB | Enables horizontal app scaling |
| App instance | Run your code, one of N | gunicorn/uvicorn workers | Stateless → add freely |
| Cache | Fast key-value store on the read path | Redis, Memcached | Cuts read latency & DB load |
| Message queue | Buffer + hand off async work | Redis, RabbitMQ, SQS, Kafka | Decouples; absorbs spikes |
| Background worker | Process queued jobs | Celery, RQ, Dramatiq, queue.Queue |
Scale workers independently |
| Primary database | Durable source of truth (writes) | PostgreSQL, MySQL | Pooling, indexing, sharding |
| Read replica | Serve reads, offload the primary | Postgres streaming replica | Horizontal read scaling |
| Object store / CDN | Static assets, big blobs, edge cache | S3 + CloudFront | Offloads bytes to the edge |
Statelessness: the master key to horizontal scaling
If you take one idea from this lesson, take this one. A stateless app tier is what makes horizontal scaling possible, and horizontal scaling is what makes a service scalable at all. Everything else is technique; this is the hinge.
“Stateless” does not mean the system has no state — a service with no state does nothing useful. It means the app tier — the boxes running your request-handling code — keeps no per-client state in local memory between requests. Every request carries or looks up everything it needs; nothing important lives only inside one process. The state absolutely still exists — it has simply been moved out of the app tier into shared stores designed to hold it.
Why does this unlock scale-out? Because if any request can be served by any instance, a load balancer can send request 1 to box A and request 2 to box B and it makes no difference. You can add a tenth box and it is immediately useful; you can lose a box and no user’s data goes with it. But the moment an instance holds something a request depends on — a login session in a dict, a shopping cart in memory, an upload half-assembled on local disk — that request is now chained to that specific box, and the whole scale-out story collapses. Let’s watch it collapse, then watch statelessness fix it.
This is executed. Two “app instances” sit behind a round-robin load balancer. A user logs in (request 1) and then loads their dashboard (request 2) — and the balancer, doing its job, sends the two requests to different instances:
import itertools

# STATEFUL: each instance keeps sessions in its own local memory
class StatefulInstance:
    def __init__(self, name):
        self.name = name
        self.sessions = {}                       # local RAM - NOT shared

    def login(self, user):
        self.sessions[user] = "logged-in"
        return f"{self.name}: logged {user} in"

    def dashboard(self, user):
        if self.sessions.get(user) == "logged-in":
            return f"{self.name}: welcome back, {user}"
        return f"{self.name}: 403 - who are you? (no local session)"

# STATELESS: sessions live in ONE shared store (stand-in for Redis/DB)
SHARED_SESSIONS = {}                             # state lives OUTSIDE the app tier

class StatelessInstance:
    def __init__(self, name):
        self.name = name

    def login(self, user):
        SHARED_SESSIONS[user] = "logged-in"      # write to shared store
        return f"{self.name}: logged {user} in"

    def dashboard(self, user):
        if SHARED_SESSIONS.get(user) == "logged-in":   # read from shared store
            return f"{self.name}: welcome back, {user}"
        return f"{self.name}: 403 - who are you?"

def round_robin(instances):
    return itertools.cycle(instances)            # the load balancer

lb = round_robin([StatefulInstance("app-1"), StatefulInstance("app-2")])
print("STATEFUL:")
print("  login    ->", next(lb).login("alice"))       # hits app-1
print("  dashboard->", next(lb).dashboard("alice"))   # hits app-2

lb = round_robin([StatelessInstance("app-1"), StatelessInstance("app-2")])
print("STATELESS:")
print("  login    ->", next(lb).login("alice"))       # hits app-1
print("  dashboard->", next(lb).dashboard("alice"))   # hits app-2
STATEFUL:
  login    -> app-1: logged alice in
  dashboard-> app-2: 403 - who are you? (no local session)
STATELESS:
  login    -> app-1: logged alice in
  dashboard-> app-2: welcome back, alice
There it is, in output. The stateful tier logs Alice in on app-1 and then rejects her on app-2, because the session lived only in app-1’s memory and app-2 never saw it. The stateless tier writes the session to a shared store on login, so any instance can read it back — Alice is welcomed no matter which box the balancer picked. The only difference between the two classes is where the session dict lives, and that one difference is the entire difference between a service that can run on one box and a service that can run on five hundred.
Where state actually lives
If the app tier holds no state, the state has to go somewhere. “Somewhere” is a small number of purpose-built homes, each suited to a kind of state:
| Kind of state | Example | Where it belongs | Why not in the app |
|---|---|---|---|
| Session / auth | “who is logged in” | Cache (Redis) or a signed cookie/JWT | Any box must read it |
| Durable business data | orders, users, quotes | The database | Must survive restarts |
| Cached / derived | rendered page, hot lookups | The cache | Rebuildable; shared |
| Uploads / blobs | images, files | Object store (S3) | Big; must outlive one box |
| Background work | “send this email” | The queue | Survives a worker crash |
| In-flight request scope | a request ID, current user | Local memory (fine!) | Dies with the request — OK |
That last row matters: statelessness does not forbid local variables. Per-request state — the stuff that lives and dies inside one handle() call — is completely fine in local memory, because it never needs to be seen by another request or another box. The rule is specifically about state that must persist across requests or be visible to other instances. Keep that, and only that, out of the app tier.
The sticky-sessions anti-pattern
There is a tempting shortcut that lets you keep local session state and run multiple boxes: configure the load balancer to always send a given user to the same instance — “sticky sessions” or session affinity. Resist it. It is a patch over a design flaw, and it re-introduces the very coupling statelessness removed:
| Sticky sessions (affinity) | Stateless + shared store | |
|---|---|---|
| Session lives in | One instance’s local RAM | Shared cache / signed token |
| Add a box | New box gets no existing users | Immediately serves everyone |
| A box dies | Its users are logged out | Any box serves them; no loss |
| Deploys / restarts | Drop sessions or drain slowly | Restart anything, anytime |
| Load spread | Uneven — hot boxes stay hot | Even — any box, any request |
| Autoscaling | Fights it (state pins users) | Works cleanly |
Sticky sessions look like they scale — there are N boxes — but each box is a little island of state, so a deploy logs people out, a crash loses carts, and the load never spreads evenly. It is horizontal scaling in appearance and vertical fragility in fact. The honest fix is always the same: move the session out of the app tier (Redis, or a stateless signed token the client carries), and let the balancer route freely.
Load balancing
The load balancer is the box that makes N app instances look like one service to the client. It accepts every request and forwards it to one of the healthy instances behind it. That forwarding decision follows an algorithm, and the choice has real consequences under uneven load:
| Algorithm | Picks the instance by | Good when | Watch out |
|---|---|---|---|
| Round-robin | Next in rotation, in order | Requests are uniform; instances equal | Ignores that one request may be 100x heavier |
| Least connections | Fewest in-flight requests | Request cost varies a lot | Slightly more bookkeeping |
| Weighted | Rotation biased by capacity | Mixed instance sizes | You must set the weights |
| IP hash | Hash of client IP | You need affinity (rare) | Re-hashes when the pool changes; uneven |
| Least response time | Fastest recent responses | Latency-sensitive; heterogeneous | Needs live latency tracking |
Round-robin is the sensible default and what our demo used — it is simple, needs no per-request state, and is fair when requests are roughly equal. Least-connections is the upgrade when request costs are wildly uneven (some hit the cache and return in a millisecond, some do heavy work for a second), because it steers new work toward boxes that are actually free rather than blindly rotating. Notice that IP hash is how you’d implement sticky sessions — and the previous section is why you almost never want to.
Health checks: the other half of the balancer’s job
Spreading load is only half of what a balancer does; the other half is not sending requests to a box that can’t serve them. It does this by polling each instance’s health endpoint and pulling failing boxes out of the rotation. There are two distinct questions it can ask, and conflating them causes outages:
| Check | Asks | Fails when | If it fails |
|---|---|---|---|
| Liveness | “Are you alive?” | Process hung/deadlocked | Restart the instance |
| Readiness | “Can you serve right now?” | Still warming up; a dependency is down | Stop routing to it (don’t kill it) |
| Startup | “Have you finished booting?” | During slow initial startup | Wait before liveness applies |
The subtlety that bites people: liveness and readiness are different questions. A box can be perfectly alive (process running, answering the health port) yet not ready (its database connection just dropped, or it is still loading a model into memory). If you wire a failed dependency into your liveness check, the orchestrator will kill and restart a healthy box for a problem a restart won’t fix — and if the dependency is shared, it will kill all your boxes at once, turning a degraded dependency into a total outage. Readiness says “take me out of rotation until I recover”; liveness says “I am broken, restart me.” Keep them separate.
Caching: the highest-leverage performance tool
Caching is the single highest-leverage thing you can do for a read-heavy service, and the latency table earlier is why: a cache hit is a memory lookup (~100 ns to a local process, tens of microseconds to Redis over the network), while the database read it replaces is milliseconds. When most of your traffic is reads of a small hot set — and for most services it is — a cache turns the majority of requests from “milliseconds and a database round trip” into “microseconds and no database at all.” Let’s measure exactly that.
This is executed. A cache_aside decorator wraps a function that stands in for a slow (50 ms) database read; on a hit it returns from memory, on a miss it calls through and stores the result, evicting least-recently-used entries past a size bound and honouring a TTL:
import functools, time
from collections import OrderedDict

def cache_aside(maxsize=128, ttl=None):
    """Cache-aside: check the cache; on a miss, call the real function and store it.
    LRU-bounded, optional TTL in seconds."""
    def decorator(func):
        store = OrderedDict()          # key -> (timestamp, value)
        hits = misses = 0
        @functools.wraps(func)
        def wrapper(*args):
            nonlocal hits, misses
            now = time.monotonic()
            if args in store:
                ts, value = store[args]
                if ttl is None or now - ts < ttl:
                    store.move_to_end(args)          # mark most-recently-used
                    hits += 1
                    return value
                del store[args]                      # expired -> treat as a miss
            misses += 1
            value = func(*args)                      # the slow path (a "DB call")
            store[args] = (now, value)
            store.move_to_end(args)
            if len(store) > maxsize:
                store.popitem(last=False)            # evict least-recently-used
            return value
        def clear():
            nonlocal hits, misses
            store.clear(); hits = misses = 0
        wrapper.cache_clear = clear
        wrapper.cache_stats = lambda: {"hits": hits, "misses": misses,
            "hit_rate": round(hits / (hits + misses), 3) if hits + misses else 0,
            "size": len(store)}
        return wrapper
    return decorator

@cache_aside(maxsize=100, ttl=30)
def get_user(user_id: int) -> dict:
    time.sleep(0.05)                                 # simulate 50 ms of I/O
    return {"id": user_id, "name": f"user-{user_id}"}

def timed(fn, *a):
    t0 = time.perf_counter(); fn(*a); return (time.perf_counter() - t0) * 1000

cold = timed(get_user, 42)                           # MISS: pays the 50 ms
warm = sum(timed(get_user, 42) for _ in range(1000)) / 1000   # HIT: memory only
print(f"cold (miss): {cold:8.3f} ms")
print(f"warm (hit) : {warm:8.5f} ms  (mean of 1000 hits)")
print(f"speedup    : {cold / warm:8.0f}x on a hit")
cold (miss):   60.094 ms
warm (hit) :  0.00026 ms  (mean of 1000 hits)
speedup    :   231710x on a hit
The cold call pays the full ~50 ms (60 ms here with scheduling overhead); the warm call is a dict lookup at a quarter of a nanosecond on average. The headline ratio (~230,000x) is real but noisy — once a hit is sub-microsecond you are mostly measuring how close to zero it is, and a second run gave ~130,000x. Do not quote the exact multiplier; the durable, honest statement is “a hit is a memory lookup, four-to-five orders of magnitude faster than the miss.” The number that actually matters for capacity planning is what a cache does to a realistic mixed workload, so drive 500 requests across a handful of hot users:
import random
random.seed(7)
ids = [random.choice([1, 1, 1, 2, 2, 3, 4, 5, 6, 7]) for _ in range(500)]
get_user.cache_clear()                               # reset stats for a clean count
t0 = time.perf_counter()
for uid in ids:
    get_user(uid)
elapsed = (time.perf_counter() - t0) * 1000
print(f"500 requests over 7 hot users: {elapsed:8.2f} ms total")
print(f"cache stats: {get_user.cache_stats()}")
500 requests over 7 hot users:   407.70 ms total
cache stats: {'hits': 493, 'misses': 7, 'hit_rate': 0.986, 'size': 7}
That is the caching argument in one line: 493 of 500 reads never touched the “database.” Only 7 requests — the first hit on each of the 7 distinct users — paid the 50 ms; the other 493 were free. The same 500 requests with no cache would be 500 × ~50 ms ≈ 25–30 seconds of database time; with the cache it is ~0.4 s. A 98.6% hit rate is not unusual for real traffic, because real traffic is Zipfian — a small hot set gets most of the reads. That skew is the cache’s best friend.
The four caching strategies
“Add a cache” hides a real design choice: how do the cache and the database stay in sync? There are four canonical patterns, and they trade freshness, latency, and complexity differently:
| Strategy | Read path | Write path | Consistency | Use when |
|---|---|---|---|---|
| Cache-aside (lazy) | App checks cache; miss → load DB → fill cache | App writes DB, invalidates cache | Can go stale between write & invalidation | The default. Read-heavy, tolerant of brief staleness |
| Read-through | Cache library loads from DB on miss | Same as cache-aside | Same as cache-aside | You want the cache to own the load logic |
| Write-through | Read from cache | Write cache and DB synchronously | Strong; cache never stale | Reads need freshness; writes can be slower |
| Write-behind (write-back) | Read from cache | Write cache now, DB later (async) | Weak; risk of loss if cache dies first | Write-heavy, can tolerate some loss/lag |
Cache-aside is the one you will use 90% of the time, and it is what the demo implements: the application code owns the logic (“look in the cache; on a miss, fetch and fill”), the cache stays out of the write path, and a write to the database is followed by invalidating the cached key so the next read reloads it. Its weakness is a window: between “write the DB” and “invalidate the cache,” a reader can get a stale value. Write-through closes that window by writing both stores together, at the cost of slower writes. Write-behind is the fastest for writes and the most dangerous — an unflushed cache that dies takes your writes with it — so reach for it only when you genuinely can lose a little.
Eviction: a cache is a bounded space
A cache is deliberately smaller than the database — that is the point; it holds the hot subset in fast memory. So when it fills, something must go. The eviction policy decides what:
| Policy | Evicts | Best for | Weakness |
|---|---|---|---|
| LRU (least-recently-used) | The longest-untouched entry | General purpose — recency predicts reuse | A big scan can flush the hot set |
| LFU (least-frequently-used) | The least-often-used entry | Stable hot sets | Slow to adapt; old favourites linger |
| FIFO | Oldest inserted | Rarely the right answer | Ignores usage entirely |
| TTL (time-to-live) | Anything past its age | Data that goes stale (prices, sessions) | Not really eviction; a freshness bound |
| Random | A random entry | Surprisingly OK; cheap | Unpredictable |
LRU is the sensible default, and it is what our decorator implements with OrderedDict.move_to_end (touch = move to the back) and popitem(last=False) (evict the front). Python hands you a production-grade LRU for free as functools.lru_cache — reach for that in real code; we hand-rolled one only to see the machinery. TTL is orthogonal to the eviction policy and often used with it: LRU decides what to drop when full, TTL decides what is too stale to trust regardless of space. Our decorator does both — a bounded LRU with a per-entry TTL — because real caches need both a size bound and a freshness bound.
Where to cache, and the two hard problems
Caching is not one layer; it is a series of them, and a request can be answered at the first one that has the data:
| Layer | Caches | Latency | Invalidation difficulty |
|---|---|---|---|
| Client / browser | Static assets, API responses | ~0 (local) | Hardest — you don’t control the client |
| CDN / edge | Static + cacheable responses, near the user | ~10 ms | Hard — purge across many POPs |
| Application (in-process) | Hot objects, computed values | ~100 ns | Easy — it’s your memory |
| Distributed (Redis/Memcached) | Shared across all app boxes | ~0.5 ms | Medium — one store to invalidate |
| Database | Query results, buffer pool | ~1 ms | The DB handles it |
There is an old joke that there are only two hard things in computer science: cache invalidation, naming things, and off-by-one errors. The joke is really about the first one. Cache invalidation — knowing when a cached value has become wrong and getting rid of it — is genuinely hard because the cache and the source of truth are two copies, and any write to one opens a window where the other is stale. The strategies are a spectrum from simple-but-stale to fresh-but-costly:
| Invalidation approach | How | Trade-off |
|---|---|---|
| TTL expiry | Let entries die after N seconds | Simple; but stale for up to N seconds |
| Write-invalidate | Delete the key on every write | Fresh; but you must find every write |
| Write-update | Overwrite the key on every write | Fresh; more work per write |
| Versioned keys | Bake a version/hash into the key | New version = new key; old just ages out |
| Event-driven | A change event purges the key | Freshest; needs an event bus |
The thundering herd
The second cache failure mode is the one that takes services down, and it is marked in red on the diagram: the cache stampede (or thundering herd). Picture a very hot key — the homepage, a popular product — served happily from cache. Its TTL expires. Now, in the same instant, every concurrent request for that key misses at once, and all of them stampede to the database to recompute the identical value. The database, sized for the cached load, is suddenly hit by thousands of simultaneous identical queries, exhausts its connection pool, and falls over — and because it is down, nothing can refill the cache, so the herd keeps coming. A cache that was protecting the database becomes the trigger that kills it.
| Mitigation | How it works | Cost |
|---|---|---|
| Request collapsing / single-flight | First miss recomputes; concurrent misses wait for it | A lock/coordination per key |
| Early / probabilistic recompute | Refresh before expiry, staggered | Some wasted refreshes |
| Jittered TTL | Add randomness so keys don’t expire together | Trivial; do this always |
| Serve-stale-while-revalidate | Return the old value; refresh in the background | Briefly stale, but no stampede |
| Locking / mutex | One recompute holds a lock; others read the result | Contention on the lock |
The cheapest and most universally applicable is jittered TTLs — never expire a whole class of keys at exactly the same second; spread their expiries over a window so misses trickle instead of stampede. For genuinely hot single keys, single-flight (let one request recompute while the rest wait for its result) is the surgical fix. Either way, the lesson is that a naive cache doesn’t just fail to help under a stampede — it actively causes the outage, so the mitigation is part of the design, not an afterthought.
Asynchronous processing with queues
The third lever answers a different question: not “how do I serve reads fast?” but “what do I do about slow work?” Some things a request triggers are inherently slow — sending an email, resizing an image, charging a card, generating a report, calling a sluggish third-party API. If you do them inside the request, the user waits for all of it, and worse, a worker process (there are only so many) is tied up for the whole duration, so a burst of slow requests starves everyone. The fix is to not do the slow work during the request. Instead, the request drops a job onto a queue and returns immediately; a separate pool of background workers picks jobs off the queue and does the slow work out of band.
This is executed. A queue.Queue (thread-safe by design) holds jobs; three worker threads drain it; the “request” side just enqueues and returns. Crucially, one job (id=3, charging a card) is submitted twice — a duplicate delivery — and the consumer is idempotent, so it processes each id at most once:
import queue, threading, time

jobs = queue.Queue()
processed_ids = set()          # de-dup ledger for idempotency
results = []
lock = threading.Lock()        # guards the shared ledger + results
SENTINEL = None                # poison pill to stop workers

def handle(job):
    """The slow work we refuse to do inside the request (200 ms each)."""
    with lock:
        if job["id"] in processed_ids:                 # idempotency guard
            print(f"  [{threading.current_thread().name}] skip dup job {job['id']}")
            return
        processed_ids.add(job["id"])
    time.sleep(0.2)                                    # slow work, off-request
    with lock:
        results.append(job["id"])
    print(f"  [{threading.current_thread().name}] done job {job['id']} ({job['task']})")

def worker():
    while True:
        job = jobs.get()
        if job is SENTINEL:
            jobs.task_done(); return
        handle(job); jobs.task_done()

pool = [threading.Thread(target=worker, name=f"worker-{i}") for i in range(3)]
for t in pool: t.start()

incoming = [
    {"id": 1, "task": "send-welcome-email"}, {"id": 2, "task": "resize-avatar"},
    {"id": 3, "task": "charge-card"},        {"id": 3, "task": "charge-card"},  # dup!
    {"id": 4, "task": "build-thumbnail"},    {"id": 5, "task": "index-search"},
]
t0 = time.perf_counter()
for job in incoming:
    jobs.put(job)                                      # the "request" returns here
enqueue_ms = (time.perf_counter() - t0) * 1000
print(f"6 jobs enqueued in {enqueue_ms:.4f} ms total (work happens later)\n")

jobs.join()                                            # wait for the backlog to drain
for _ in pool: jobs.put(SENTINEL)
for t in pool: t.join()
print(f"\ndistinct jobs processed: {sorted(results)}")
print(f"charge-card (id=3) ran exactly once: {results.count(3) == 1}")
6 jobs enqueued in 0.0081 ms total (work happens later)

  [worker-0] done job 1 (send-welcome-email)
  [worker-0] skip dup job 3
  [worker-1] done job 2 (resize-avatar)
  [worker-2] done job 3 (charge-card)
  [worker-0] done job 4 (build-thumbnail)
  [worker-1] done job 5 (index-search)

distinct jobs processed: [1, 2, 3, 4, 5]
charge-card (id=3) ran exactly once: True
(The exact order of the worker lines varies run to run — thread scheduling is nondeterministic — but the final counts do not.) Two things happened, both load-bearing. First, enqueuing six jobs took ~0.01 ms total — the “request” side does essentially no work and returns instantly, even though 200 ms of processing per job is coming. That is the whole point: the user is not made to wait for the slow part. Second, the duplicate charge-card was caught and skipped — one worker grabbed the duplicate and the idempotency guard rejected it (skip dup job 3), while another ran the real one, so the card was charged exactly once despite being submitted twice.
That second property is not optional, and here is why. Almost every real queue guarantees at-least-once delivery, not exactly-once — because exactly-once is extraordinarily hard in a distributed system (the classic “two generals” problem). At-least-once means: if a worker crashes after doing the work but before acknowledging the job, the queue redelivers it, and the work runs again. Redeliveries are a when, not an if. So the consumer must be idempotent — safe to run twice with the same effect as running once — which usually means a de-dup ledger keyed by a stable job ID, exactly as above. A non-idempotent consumer plus at-least-once delivery equals double-charged cards.
| Delivery guarantee | Means | Cost | Reality |
|---|---|---|---|
| At-most-once | Never redelivered; may be lost | Cheapest | Fire-and-forget metrics, maybe |
| At-least-once | Never lost; may be duplicated | Moderate | The practical default — demands idempotent consumers |
| Exactly-once | Once, guaranteed | Very high / often illusory | Usually “at-least-once + idempotency” wearing a disguise |
The other gift a queue gives you is spike absorption. When traffic surges past what the workers can process, jobs simply accumulate in the queue and drain when the surge passes — the queue is a shock absorber between a bursty producer and a steady consumer. (With one caveat we will get to in troubleshooting: a queue that fills faster than it drains forever is its own failure.) Here is the landscape of real queue technologies, from our in-process toy to the industrial options:
| Technology | Kind | Durable? | Reach for it when |
|---|---|---|---|
queue.Queue |
In-process, threads | No (in RAM) | One process, background threads — our demo |
| Redis (lists/streams) | Networked, simple | Optional | Lightweight cross-process jobs; you already run Redis |
| Celery / RQ / Dramatiq | Python task frameworks | Via a broker | The standard Python answer for background jobs |
| RabbitMQ | Message broker (AMQP) | Yes | Complex routing, acks, priorities |
| Kafka | Distributed log | Yes (retained) | High-throughput streaming, event sourcing, replay |
| SQS | Managed cloud queue | Yes | AWS; zero-ops at-least-once delivery |
In Python, Celery (or the lighter RQ / Dramatiq) is the default you will actually deploy — a decorator turns a function into a task, and a .delay() call enqueues it — but the concepts are exactly the ones the queue.Queue demo made concrete: a producer that returns fast, workers that drain, at-least-once delivery, and an idempotent consumer. The streaming side of this — Kafka, consumer groups, backpressure — is developed further in the data-engineering pipelines lesson.
Databases at scale
The database is where most services actually hit their wall, because it is the one component that is genuinely hard to scale horizontally: it is stateful by definition. You will exhaust several cheaper levers before you ever shard, and in roughly this order:
| Lever | What it does | Buys you | Cost / limit |
|---|---|---|---|
| Indexing | B-tree on queried columns | O(log n) lookups instead of O(n) scans | Slower writes; disk; the biggest single win |
| Connection pooling | Reuse a fixed set of connections | Avoids per-request connect overhead & exhaustion | A pool must be sized and shared |
| Read replicas | Copies that serve reads | Horizontal read scaling | Replication lag (eventual consistency) |
| Caching | Answer reads without the DB | Removes load entirely | Invalidation; staleness |
| Vertical scaling | A bigger DB box | Simple, buys time | A ceiling; still a SPOF |
| Partitioning | Split one table by a key/range | Smaller indexes; parallel scans | Cross-partition queries get harder |
| Sharding | Split data across DBs by a key | Horizontal write scaling | Big complexity jump — last resort |
The ordering is the lesson: exhaust the cheap levers before the expensive ones. A missing index is the most common scaling “problem” and the easiest fix — it turns a table scan into a tree lookup. Read replicas are the standard next move for read-heavy load (route reads to replicas, writes to the primary), accepting replication lag: a replica can be milliseconds behind, so a read immediately after a write may not see it. Sharding — splitting writes across multiple databases by a shard key — is genuinely powerful and genuinely painful (cross-shard joins and transactions get hard, rebalancing is a project), so it is the last lever, not the first. Which brings us to a warning we will return to in tradeoffs: do not shard before you must.
The N+1 query problem
Long before you need replicas, one anti-pattern quietly wastes most database scaling: the N+1 query problem. It is subtle because the code looks innocent — a loop that fetches related data — and an ORM makes it invisible, since each .books access silently fires a query. Here it is, counted for real against sqlite:
import sqlite3
conn = sqlite3.connect(":memory:")
conn.executescript("CREATE TABLE author(id INTEGER PRIMARY KEY, name TEXT);"
                   "CREATE TABLE book(id INTEGER PRIMARY KEY, author_id INT, title TEXT);")
conn.executemany("INSERT INTO author VALUES (?,?)", [(i, f"a{i}") for i in range(1, 51)])
conn.executemany("INSERT INTO book VALUES (?,?,?)",
                 [(i, (i % 50) + 1, f"b{i}") for i in range(1, 201)])

count = 0
def trace(_sql):
    global count; count += 1

# N+1: one query for authors, then one MORE per author for their books
count = 0; conn.set_trace_callback(trace)
authors = conn.execute("SELECT id, name FROM author").fetchall()          # 1
for aid, _ in authors:
    conn.execute("SELECT title FROM book WHERE author_id=?", (aid,)).fetchall()  # +N
conn.set_trace_callback(None)
print(f"N+1 strategy : {count} queries for {len(authors)} authors")

# Fixed: ONE join pulls everything
count = 0; conn.set_trace_callback(trace)
conn.execute("SELECT a.name, b.title FROM author a "
             "LEFT JOIN book b ON b.author_id = a.id").fetchall()          # 1
conn.set_trace_callback(None)
print(f"JOIN strategy: {count} query")
N+1 strategy : 51 queries for 50 authors
JOIN strategy: 1 query
Fifty authors cost fifty-one queries the naive way — one to list them, then one per author for their books — versus one join. At 50 rows it is a rounding error; at 50,000 it is 50,001 network round trips to the database for data one query could return, and it will be the mystery behind a page that is “slow for no reason.” The fix is to fetch related data in one query (a JOIN, or the ORM’s eager-loading — select_related/joinedload in Django/SQLAlchemy). The habit to build: whenever you loop over query results and touch a related object inside the loop, count the queries.
SQL versus NoSQL — an access-pattern decision
The SQL-vs-NoSQL choice is not about which is “modern”; it is about matching the store to your access pattern. The honest comparison:
| Relational (SQL) | NoSQL (document / KV / wide-column) | |
|---|---|---|
| Data shape | Structured, related, normalized | Flexible, denormalized, nested |
| Query flexibility | High — ad-hoc joins, aggregates | Limited — fast on the designed access path |
| Consistency | Strong (ACID transactions) | Often eventual (tunable) |
| Scaling writes | Harder (sharding is manual) | Often built-in horizontal scaling |
| Best when | Relationships & integrity matter | Huge scale, simple lookups, flexible schema |
| Examples | PostgreSQL, MySQL | MongoDB, DynamoDB, Cassandra, Redis |
The pragmatic default is start with PostgreSQL. A relational database with proper indexes, connection pooling, a cache in front, and read replicas will carry you astonishingly far — further than most teams who reach for a “web-scale” NoSQL store on day one ever actually need. Choose NoSQL when your access pattern genuinely fits it: enormous scale with simple key lookups (DynamoDB), a naturally document-shaped model with no cross-document joins (MongoDB), or write-heavy time-series (Cassandra). “We might need to scale” is not that reason; a measured access pattern that SQL serves badly is.
Partitioning and sharding, briefly
When one database truly cannot hold the write load or the data size, you split it. Partitioning splits one table within one database (by range — months of data — or by hash), keeping indexes small and enabling parallel scans. Sharding splits the data across separate databases by a shard key, so each shard takes a fraction of the writes — the only real lever for horizontal write scaling:
| Strategy | Split by | Strength | Weakness |
|---|---|---|---|
| Range partitioning | Value ranges (dates, IDs) | Great for range/time queries | Hot spots if data skews to one range |
| Hash sharding | hash(key) % N |
Even distribution | Range queries hit every shard; resharding is painful |
| Directory / lookup | A lookup table maps key → shard | Flexible placement | The directory is itself a SPOF to manage |
| Geographic | Region / locality | Data near users; compliance | Cross-region queries are slow |
The reason sharding is the last lever is the weaknesses column: pick the wrong shard key and you get hot spots; need a query across shards and you are doing a scatter-gather and joining in the app; need to add a shard and you are rebalancing live data. It is real engineering, and the correct time to do it is when the cheaper levers are genuinely exhausted — not before.
Reliability basics
Scaling and reliability are two sides of one coin: the moment you have N boxes, you have N things that can fail, so a scalable design must also be a survivable one. This lesson only sets the foundations — the deep treatment (retries, timeouts, circuit breakers, backpressure, observability, SLOs) belongs to the performance, reliability & maintainability lesson — but three ideas are inseparable from the design decisions above:
| Concept | The problem | The design response |
|---|---|---|
| Single point of failure (SPOF) | One component whose death = total outage | Redundancy — run ≥2, remove the single |
| Redundancy | You need survivors when one dies | N+1 instances; replicas; multi-AZ |
| Graceful degradation | A dependency is down; don’t take everything with it | Serve stale cache; shed load; a partial page |
| Blast radius | One failure cascading into many | Isolation, bulkheads, timeouts |
The single point of failure is the first thing to hunt in any design: walk the request path and ask “if this one box dies, is the whole service down?” Our topology has an obvious one, marked red on the diagram — the load balancer. Ironically, the box that enables redundancy in the app tier is itself a single point of failure until it is made redundant (active/passive pairs, or DNS/anycast across several). A single database is another. The discipline is to make every element on the critical path either redundant or non-critical.
Graceful degradation is the reliability mindset that pairs with caching and queues: when a dependency fails, degrade instead of collapsing. If the database is struggling, serve slightly-stale data from the cache rather than erroring. If the recommendations service is down, show the page without recommendations rather than showing no page. If the queue is backed up, accept the job and be honest that it will be slow. A well-designed service under partial failure gets worse, not dead — and the levers that make it scale (a cache that can serve stale, a queue that can buffer) are the same ones that let it degrade gracefully. Scaling and reliability are built from the same parts.
The tradeoffs: nothing is free
Every lever in this lesson costs something, and the mark of an engineer rather than a cargo-culter is being able to name the cost of each choice. If you cannot say what a design gives up, you do not yet understand it.
The deepest tradeoff is captured by the CAP theorem, which you only need as intuition: in a distributed system, when the network partitions (messages between nodes are lost — a when, not an if), you must choose between consistency (every read sees the latest write) and availability (every request gets an answer). You cannot have both during a partition, because the only way to guarantee a node returns the latest write is to refuse to answer when it might be stale.
| During a network partition | CP (consistency + partition-tolerance) | AP (availability + partition-tolerance) |
|---|---|---|
| On the losing side, a read | Refuses (error) rather than risk staleness | Answers, possibly with stale data |
| You keep | Correctness | Uptime |
| You sacrifice | Availability | Freshness (eventual consistency) |
| Fits | Payments, inventory, bookings | Feeds, timelines, product catalogs, likes |
| Examples | Traditional RDBMS, ZooKeeper | Cassandra, DynamoDB (tunable) |
The practical reading: choose consistency where being wrong is worse than being down (you would rather a bank transfer fail than double-spend), and choose availability where being down is worse than being briefly stale (a social feed a few seconds behind is fine; a feed that is offline is not). Most systems are a mix — strong consistency for the money, eventual consistency for the counters. Every read replica, every cache, every async queue in this lesson is a small, deliberate step toward availability and speed and away from strict consistency. That is the trade you are making each time; make it on purpose.
And the meta-tradeoff, the one that governs whether to pull a lever at all: complexity versus scale. Each component you add — a cache, a queue, replicas, shards — buys capacity and charges operational complexity: another thing to deploy, monitor, secure, and debug at 3 a.m. That charge is only worth paying when the scale is real.
| Signal | Do it | Don’t (yet) |
|---|---|---|
| Cache in front of the DB | Reads dominate; the DB is the bottleneck now | You have no measured read load |
| A message queue | Real slow work is blocking requests now | Everything is already fast |
| Read replicas | Read load measurably exceeds one box | You’re guessing about future reads |
| Sharding | One DB genuinely can’t hold the writes | Almost ever — it’s the last resort |
| Microservices | Team/scale boundaries genuinely demand it | You have three engineers and one product |
The failure mode this table guards against is premature optimization / over-engineering — the globally-distributed, sharded, microserviced architecture built to serve traffic that never arrives, which is slower to build, harder to run, and more likely to fail than the boring single-database service it replaced. The discipline cuts both ways: under-building leaves you with a rewrite when success comes, but over-building spends your scarcest resource (engineering time) buying capacity you do not need against a scale you cannot predict. Design for the next order of magnitude, not the next six. You will know when to pull the next lever because you will measure the bottleneck — which is exactly what the worked design does now.
A worked design: a URL shortener
Let’s run the whole method on one concrete system — a URL shortener (think bit.ly): you POST a long URL and get a short code back; a GET on the code redirects to the original. It is the canonical exercise because it is simple enough to hold in your head and rich enough to exercise every lever.
Step 1 — requirements. Functional: shorten a URL to a code; redirect a code to its URL. Non-functional, and these drive everything: read-heavy (people follow links far more than they create them), low-latency redirects (a slow redirect is a broken-feeling link), highly available (a down shortener breaks every link ever made), and codes that are short. We explicitly scope out analytics, custom aliases, and expiry for v1.
Step 2 — estimate the load. This is the arithmetic that decides the shape, run for real:
sec_per_month = 30 * 24 * 3600                 # 2,592,000
writes_per_month = 100_000_000                 # assume 100M new links/month
w = writes_per_month / sec_per_month
print(f"writes/s          : {w:.0f}")
print(f"reads/s  (100:1)  : {w * 100:,.0f}")
print(f"peak reads/s (x3) : {w * 100 * 3:,.0f}")
print(f"5-year records    : {writes_per_month * 60:,} ({writes_per_month*60/1e9:.0f}B)")
print(f"storage @500B     : {writes_per_month * 60 * 500 / 1e12:.1f} TB")
print(f"base62^7 keyspace : {62**7:,}")
writes/s          : 39
reads/s  (100:1)  : 3,858
peak reads/s (x3) : 11,574
5-year records    : 6,000,000,000 (6B)
storage @500B     : 3.0 TB
base62^7 keyspace : 3,521,614,606,208
Those seven numbers are the design brief. ~39 writes/s is nothing — a single database absorbs it without noticing. ~3,900 reads/s average, ~11,600 at peak is the real workload, and it is read-heavy exactly as predicted, which screams cache. 3 TB over five years fits comfortably on one beefy database box (with replicas), so we do not need to shard — a conclusion we reached by arithmetic, not by fashion. And a 7-character base-62 code gives 3.5 trillion combinations — vastly more than 6 billion links need — so 7 characters is plenty and even 6 (57 billion) would nearly do.
Step 3 — define the API. Two operations:
POST /shorten     {"url": "https://..."}      -> {"code": "aX9bK2q"}
GET  /{code}                                  -> 301 redirect to the long URL
Step 4 — components, and the code-generation decision. The topology is our standard diagram, specialised. The one genuinely interesting design choice is how to generate the short code:
| Approach | How | Pro | Con |
|---|---|---|---|
| Random + check | Random 7-char code; retry on collision | Simple; unguessable | Collision checks cost a read (rare at this fill) |
| Auto-increment + base62 | Encode a DB sequence ID | No collisions ever; tiny | Codes are sequential/guessable (enumerable) |
| Hash the URL | base62 of a hash of the URL | Same URL → same code | Truncation collisions; still need a check |
| Pre-generated keys (KGS) | A service hands out unused codes | Fast, no collision at write time | A new component to run |
For most shorteners, auto-increment + base62 is the elegant default — a database sequence guarantees uniqueness for free, and base-62 encoding the integer ID yields a compact code — with the honest caveat that codes become enumerable (fine for public links, not for secrets). If unguessability matters, random-plus-check is the move; at 6 billion links in a 3.5-trillion keyspace, collisions are astronomically rare, so the check almost always passes first try.
Step 5 & 6 — find the bottleneck, apply a lever, iterate. Now walk the estimate through the components and let each bottleneck name its own fix:
| Iteration | Bottleneck under the estimate | Lever applied | Result |
|---|---|---|---|
| 1 | One app box can’t do 11,600 RPS reliably | Stateless app tier + load balancer | Scale out to N boxes; add more at peak |
| 2 | 11,600 reads/s all hitting the DB | Cache-aside (code → URL in Redis) | ~99% of redirects never touch the DB |
| 3 | The one DB is a SPOF; reads still spike on miss | Read replicas | Reads survive a primary failure; read scale-out |
| 4 | Creating a link does slow work (safe-browsing check, analytics) | Async queue | POST returns the code instantly; checks run in workers |
| 5 | Global users, redirect latency is physics | CDN / geo cache at the edge | Redirects served near the user |
That table is system design in miniature: you never design the “final” architecture up front; you start simple, run the estimate, find the one thing that breaks first, apply the cheapest lever that relieves it, and ask what breaks next. The URL shortener lands on our exact standard topology — LB, stateless apps, a cache, a queue, a primary with replicas — not because we drew it first, but because each lever was justified by a bottleneck the numbers exposed. And critically, the numbers told us where to stop: no sharding, because 3 TB and 39 writes/s never demanded it.
Hands-on lab
You’ll assemble the three levers into one runnable slice: a stateless request handler fronted by a cache-aside decorator, guarded by a token-bucket rate limiter, offloading slow work to a queue + background worker. It runs on the standard library only — Python 3.10+ (we use X | None syntax); I write python3.12, substitute your interpreter. No pip install is required, though real deployments would use cachetools, redis, and celery for the production-grade versions of these toys.
Step 1 — the rate limiter (the one new piece). You already built the cache-aside decorator and the queue+worker in the sections above; the third guardrail is a token-bucket rate limiter, which protects a service from being overwhelmed (and enforces per-client quotas). The bucket holds tokens up to a capacity (the burst), refills at a steady rate, and each request spends one — when the bucket is empty, the request is rejected (a 429). Save this as bucket.py:
import time
from dataclasses import dataclass

@dataclass
class TokenBucket:
    rate: float          # tokens added per second (steady-state allowance)
    capacity: float      # max tokens (the burst size)
    tokens: float = 0.0
    updated: float = 0.0

    def __post_init__(self):
        self.tokens = self.capacity              # start full
        self.updated = time.monotonic()

    def allow(self, cost: float = 1.0) -> bool:
        now = time.monotonic()
        # Refill: tokens accrue continuously at `rate`, capped at capacity.
        self.tokens = min(self.capacity, self.tokens + (now - self.updated) * self.rate)
        self.updated = now
        if self.tokens >= cost:
            self.tokens -= cost
            return True
        return False

if __name__ == "__main__":
    bucket = TokenBucket(rate=5, capacity=5)     # 5 burst, refill 5/s
    for i in range(1, 11):                        # hammer with 10 instant requests
        print(f"req {i:2d}: {'ALLOW' if bucket.allow() else 'THROTTLE (429)'}")
Run it:
python3.12 bucket.py
req  1: ALLOW
req  2: ALLOW
req  3: ALLOW
req  4: ALLOW
req  5: ALLOW
req  6: THROTTLE (429)
req  7: THROTTLE (429)
req  8: THROTTLE (429)
req  9: THROTTLE (429)
req 10: THROTTLE (429)
What just happened: the bucket allowed exactly its capacity of 5 as an instantaneous burst, then throttled the rest, because no time passed for it to refill. Wait a second and ~5 tokens return. This is the same shape a real API rate-limiter uses (and why you see 429 Too Many Requests with a Retry-After header) — it permits bursts up to a limit while capping the sustained rate.
Step 2 — wire all three levers into one stateless handler. This is the payoff: a handle_request that rate-limits, reads through the cache, and offloads an audit job — holding no state locally (the cache, the bucket, and the queue are all passed-in/shared). Save as service.py:
import functools, queue, threading, time
from collections import OrderedDict
from bucket import TokenBucket

# --- cache-aside decorator (from the caching section) ---
def cache_aside(maxsize=128, ttl=None):
    def decorator(func):
        store, hits, misses = OrderedDict(), 0, 0
        @functools.wraps(func)
        def wrapper(*args):
            nonlocal hits, misses
            now = time.monotonic()
            if args in store and (ttl is None or now - store[args][0] < ttl):
                store.move_to_end(args); hits += 1; return store[args][1]
            misses += 1
            value = func(*args); store[args] = (now, value); store.move_to_end(args)
            if len(store) > maxsize: store.popitem(last=False)
            return value
        wrapper.stats = lambda: {"hits": hits, "misses": misses}
        return wrapper
    return decorator

# --- background queue + idempotent worker (from the async section) ---
jobs, done, lock = queue.Queue(), set(), threading.Lock()
def worker():
    while True:
        job = jobs.get()
        if job is None: jobs.task_done(); return
        with lock:
            if job in done: jobs.task_done(); continue
            done.add(job)
        time.sleep(0.05)                          # slow work, off-request
        jobs.task_done()

# --- shared state (stand-in for a DB) + cached read ---
USER_DB = {i: {"id": i, "name": f"user-{i}"} for i in range(1, 21)}
@cache_aside(maxsize=100, ttl=30)
def load_user(uid):
    time.sleep(0.05)                              # a 50 ms "DB read"
    return USER_DB[uid]

# --- the STATELESS handler wiring all three levers ---
limiter = TokenBucket(rate=20, capacity=10)
def handle_request(req_id, user_id):
    t0 = time.perf_counter()
    if not limiter.allow():                       # lever: rate limit
        return f"user {user_id}: 429 rate-limited"
    user = load_user(user_id)                     # lever: cache-aside read
    jobs.put(("audit", req_id))                   # lever: async offload
    ms = (time.perf_counter() - t0) * 1000
    return f"user {user['id']}: 200 in {ms:6.3f} ms"

if __name__ == "__main__":
    pool = [threading.Thread(target=worker) for _ in range(2)]
    for t in pool: t.start()
    print("Burst of 15 requests for 3 hot users (limiter: 10 burst, 20/s):")
    served = throttled = 0
    for i in range(15):
        out = handle_request(i, (i % 3) + 1)
        served += "200" in out; throttled += "429" in out
        if i < 6 or "429" in out: print("  " + out)
    print(f"  ... ({served} served, {throttled} rate-limited)")
    print(f"  cache: {load_user.stats()}")
    jobs.join()
    for _ in pool: jobs.put(None)
    for t in pool: t.join()
    print(f"  background jobs done off-request: {len(done)}")
Run it:
python3.12 service.py
Burst of 15 requests for 3 hot users (limiter: 10 burst, 20/s):
  user 1: 200 in 57.259 ms
  user 2: 200 in 51.976 ms
  user 3: 200 in 60.106 ms
  user 1: 200 in  0.026 ms
  user 2: 200 in  0.012 ms
  user 3: 200 in  0.004 ms
  user 2: 429 rate-limited
  user 3: 429 rate-limited
  ... (13 served, 2 rate-limited)
  cache: {'hits': 10, 'misses': 3}
  background jobs done off-request: 13
What just happened: all three levers fired in one handler. The first request per user paid the ~55 ms “database” read (3 misses); every repeat was a cache hit at a few microseconds — the ~2000x gap between 57.259 ms and 0.004 ms is the cache earning its place. The limiter allowed the burst then returned 429 twice when the bucket drained. And 13 audit jobs ran off-request — the handler enqueued and returned without ever waiting for them. The handler holds no per-request state between calls; the cache, bucket, and queue are the shared infrastructure — which is exactly why you could run this same handler on twenty boxes behind a load balancer.
Step 3 — the at-scale sketch (design, not executed). The lab runs in one process, so the cache is a local dict, the queue is queue.Queue, and the limiter is one bucket. Here is the labelled mapping from each toy to its production counterpart — this is a design sketch, nothing below runs:
| Lab piece (executed) | Production counterpart (sketch) | Why it changes at scale |
|---|---|---|
cache_aside local dict |
Redis (shared) | All N boxes must share cache + invalidation |
TokenBucket in one process |
Redis-backed counter (e.g. INCR+expiry) |
The limit is per-client across all boxes, not per-box |
queue.Queue + threads |
Celery / RQ + Redis/RabbitMQ | Jobs must survive a worker crash; scale workers separately |
USER_DB dict |
PostgreSQL + read replicas | Durable, pooled, indexed, replicated |
| One process | N stateless boxes + a load balancer | Horizontal scale; the whole point |
Read that table as the bridge from the lab to the topology diagram: swap each in-process toy for its networked, durable equivalent and the single-process slice becomes the scalable service. The shape stays identical — stateless handler, cache on the read path, queue for slow work — which is the deepest point of the lesson: the architecture you validated on one machine is the architecture that runs on a thousand. ⚠️ Note the lab’s local dict cache and queue.Queue are per-process — the very thing statelessness forbids for real state; they are fine here because everything is one process, but in production they must move to Redis and a real broker, or you have rebuilt the stateful anti-pattern.
Try these extensions:
- Give
TokenBucketacostper request and charge expensive endpoints more tokens. Watch cheap requests survive a burst that starves expensive ones. - Make
load_userraise for one user ID and confirm the failure isn’t cached (a common bug — you cache the error and serve it for 30 s). Fix it to cache only successes. - Add a second worker-crash simulation: process a job, then re-enqueue it, and confirm the idempotency ledger stops the double-run.
- Replace the local cache dict with a second process’s dict passed over a
multiprocessing.Managerand feel why people just use Redis.
Common mistakes and troubleshooting
| Symptom | Cause | Fix |
|---|---|---|
Login works, then random 403/logged-out |
Stateful app tier — session in local RAM; the next request hit another box | Externalise sessions (Redis / signed token); never sticky sessions |
| Adding boxes doesn’t help; one is pegged | State pins users to a box (affinity) | Make the tier stateless; balance freely |
| DB CPU spikes to 100% exactly when a cache key expires | Cache stampede — mass simultaneous misses recompute the same value | Single-flight/locking; jittered TTLs; serve-stale-while-revalidate |
| Users see old data right after a write | Stale cache — the write didn’t invalidate the key | Write-invalidate (delete the key on write) or write-through |
TooManyConnections / DB refuses connections under load |
No connection pooling — every request opens a new connection | Add a pooler (pgbouncer / SQLAlchemy pool); cap and share connections |
| A page is “slow for no reason”; the DB log shows a flood of tiny queries | N+1 queries — a loop firing one query per row | Eager-load / JOIN; fetch related data in one query |
| Requests time out during a traffic spike; workers all busy | Synchronous slow work blocking the request threads | Move the slow work to a queue; return fast |
| Global sharded architecture, tiny traffic, constant breakage | Premature sharding / over-engineering | Delete a tier; one Postgres + cache serves far more than you think |
| Whole service down when one box died | Single point of failure (LB, DB, that one box) | Redundancy — run ≥2; health-check and fail over |
| Memory climbs forever; jobs pile up; eventually OOM | Unbounded queue growth — producers outrun consumers | Bound the queue; add workers; apply backpressure/shed load |
| A card charged twice; an email sent twice | Non-idempotent consumer + at-least-once redelivery | De-dup by a stable job ID; make the operation idempotent |
| Tests pass, prod fails only at peak | Load-dependent bug (pool exhaustion, race, stampede) | Load-test to the estimated peak; don’t trust single-request tests |
Four of these are worth more than a table row.
1. The stateful app tier is the mistake that caps your scaling at one box. It is the most important error in the lesson because it is invisible until you try to scale: everything works perfectly on one box (there is only one dict, so every request finds the session), and the design is fine right up to the moment you add the second box, at which point half the requests mysteriously fail. The demo showed it — login on app-1, 403 on app-2. The cause is always the same: something that must persist across requests is living in a local variable, a module global, or on local disk. The fix is always the same: move it to a shared store (Redis, the database, or a stateless token the client carries) so any box can serve any request. Audit for it early, because retrofitting statelessness under load is a rewrite.
2. The cache stampede turns your safety net into the murder weapon. This one is nasty precisely because the cache is working correctly — it just all expires at once. A key everyone reads (the homepage, a viral product) sits happily in cache; its TTL lapses; and in that instant a thousand concurrent requests all miss and all slam the database with the identical query the cache existed to prevent. The database, provisioned for the cached load, tips over — and now nothing can refill the cache, so the herd never stops. The tell is a database CPU graph that spikes on a clean TTL boundary. The cheapest prevention is to jitter every TTL (never expire a class of keys at the same second) and, for genuinely hot single keys, single-flight (one request recomputes while the rest wait on its result). Treat the mitigation as part of adding the cache, not a later patch.
3. Synchronous slow work is the silent request-thread killer. You have a fixed number of worker processes/threads; each can serve one request at a time. If a request does something slow inline — a third-party API that takes two seconds, a report that takes ten — that worker is unavailable to anyone else for the whole duration. A modest burst of slow requests ties up every worker, and now even your instant endpoints time out because there is no thread free to answer them. The symptom is a service that falls over under a load that “should be fine,” with workers all blocked on the same slow dependency. The fix is the third lever: anything slow goes on the queue and the request returns immediately with an acknowledgement. The ~0.01 ms enqueue time in the demo versus 200 ms of work per job is the entire argument — the request pays the enqueue, never the work.
4. Unbounded queue growth is the failure that hides inside the fix. Queues absorb spikes — that is their virtue — but a queue is only a shock absorber if the consumers eventually catch up. If producers persistently outrun consumers (a traffic step-change, or workers that got slower), the backlog grows without bound: latency climbs (jobs wait longer and longer), memory or disk fills, and eventually the broker falls over — taking the “reliable” async path down with it. An unbounded queue converts a load problem into a crash. The fixes are to bound the queue (reject or shed when full, applying backpressure to the producer), scale consumers to match sustained load, and alert on queue depth and age so a growing backlog is a page long before it is an outage. A queue you do not monitor is a memory leak with extra steps.
Cheat-sheet
| Topic | The one-line version |
|---|---|
| Scalable | Handle growth by adding resources, without a rewrite — not “fast” |
| Vertical scaling | Bigger box. Simple; hard ceiling; a SPOF |
| Horizontal scaling | More boxes. Soft ceiling; needs a stateless tier |
| Latency vs throughput | Latency = time for one request; throughput = requests per second. Different! |
| Report latency as | p50/p95/p99, never the average — the tail is what users feel |
| Design method | Requirements → estimate load → API → components → find bottleneck → iterate |
| Estimate first | day = 86,400 s; 1M/day ≈ 12 RPS; 1M/min ≈ 17k RPS |
| Lever 1 — statelessness | No per-client state in app RAM → any box serves any request → scale out |
| Where state lives | Sessions→cache/token; data→DB; blobs→object store; work→queue |
| Sticky sessions | Anti-pattern — affinity fakes scale, keeps fragility. Externalise instead |
| Load balancer | Round-robin by default; least-conn for uneven work; health-check + fail over |
| Lever 2 — cache | Cache-aside is the default: check cache → miss → DB → fill; invalidate on write |
| Eviction | LRU by default (functools.lru_cache); add TTL for staleness |
| Cache invalidation | Hard. TTL (simple/stale) → write-invalidate → event-driven (fresh/complex) |
| Cache stampede | Mass expiry → herd hits DB. Fix: jittered TTL + single-flight |
| Lever 3 — queue | Offload slow work; return fast. At-least-once → idempotent consumers |
| Queue tech | Celery/RQ in Python; RabbitMQ (routing); Kafka (streaming); SQS (managed) |
| DB levers (in order) | Index → pool → cache → replicas → partition → shard (last resort) |
| N+1 | A query per row in a loop. Fix: JOIN / eager-load. Count your queries |
| SQL vs NoSQL | Start with Postgres; NoSQL when the access pattern truly fits |
| CAP | On a partition, pick Consistency or Availability. Money→CP; feeds→AP |
| SPOF | Walk the path; if one box’s death = outage, make it redundant |
| Don’t over-engineer | Design for the next 10x, not the next 10⁶. Measure before you add a tier |
Interview and exam questions
Q: What does “scalable” actually mean — and why isn’t it the same as “fast”? A: Scalable means the system can handle growth by adding resources without a redesign — you 10x the load and respond by adding boxes (and money), not by rewriting. “Fast” is about the latency of one request; scalable is about what happens to throughput as load grows. They are independent: a system can be fast at low load and fall over at high load (unscalable but fast), or handle huge throughput while each request is slow (scalable but not fast). Always ask “scale along which axis?” — request load, data volume, users, and geography stress different parts of the design.
Q: Explain the difference between latency and throughput with an example. A: Latency is the time to handle one request; throughput is how many requests you handle per unit time. A checkout line: latency is how long you personally wait; throughput is customers served per minute. Opening more registers (scaling out) raises throughput but doesn’t necessarily lower your latency if each register is slow. You buy throughput with parallelism/more boxes; you buy latency with caching and moving work/data closer. And report latency as percentiles (p50/p95/p99), never an average — the average hides the tail, and the tail is what users feel.
Q: Why does a stateless app tier enable horizontal scaling, and where does the state go? A: If the app tier holds no per-client state in local memory, then any instance can serve any request, so a load balancer can spread requests freely and you can add or lose boxes without losing data. The moment an instance holds something a request depends on — a session dict, an in-memory cart — that request is chained to that box and scale-out breaks. The state still exists; it moves out of the app tier: sessions to a cache or a signed token, durable data to the database, blobs to an object store, background work to a queue. Per-request local variables are fine — the rule is only about state that must outlive the request or be seen by other boxes.
Q: What are sticky sessions and why are they considered an anti-pattern? A: Sticky sessions (session affinity) configure the load balancer to always route a given user to the same instance, so you can keep session state in that instance’s local memory. It’s an anti-pattern because it re-introduces the coupling statelessness removes: a deploy or crash of that box logs its users out (their state died with it), new boxes don’t help existing users, and load spreads unevenly (hot boxes stay hot). It looks like horizontal scaling but behaves with vertical fragility. The fix is to externalise the session (Redis or a stateless token the client carries) and let the balancer route freely.
Q: Walk me through cache-aside, and name its main risk. A: Cache-aside (lazy loading) puts the application in charge: on a read, check the cache; on a hit, return it; on a miss, load from the database, store it in the cache with a TTL, and return. Writes go to the database and then invalidate (delete) the cached key so the next read reloads fresh. It’s the default because it’s simple, keeps the cache off the write path, and only caches data that’s actually requested. Its main risk is a staleness window: between writing the database and invalidating the cache, readers can get the old value — and if you forget to invalidate on some write path, they get it indefinitely. The other risk is the stampede: a hot key expiring lets every concurrent miss hit the database at once.
Q: What is a cache stampede (thundering herd) and how do you prevent it? A: When a very hot cached key expires, every concurrent request for it misses simultaneously and all of them recompute the same value against the database at once — a thundering herd that can exhaust connections and take the database (and thus the service) down, after which nothing can refill the cache. Prevent it with: jittered TTLs so keys in a class don’t all expire on the same second (cheap, always do it); single-flight / request-collapsing so one request recomputes while the rest wait for its result; early/probabilistic refresh before expiry; or serve-stale-while-revalidate, returning the old value while refreshing in the background. The point is that the mitigation is part of designing the cache, not a patch you add after the first outage.
Q: Why must a queue consumer be idempotent?
A: Because real queues deliver at-least-once, not exactly-once — if a worker does the work but crashes before acknowledging, the job is redelivered and runs again. Exactly-once is effectively impossible to guarantee across an unreliable network, so redeliveries are a when, not an if. An idempotent consumer produces the same result whether it runs once or five times (typically by recording processed job IDs and skipping duplicates, or by making the operation naturally idempotent like an upsert). Without idempotency, at-least-once delivery means double-charged cards and duplicate emails. The demo showed exactly this: a duplicate charge-card job was submitted twice and processed once, because the consumer checked a de-dup ledger.
Q: What’s the N+1 query problem and how do you fix it?
A: It’s firing one query to fetch a list of N items, then one additional query per item to fetch related data — N+1 queries where 1 or 2 would do. ORMs make it invisible: accessing author.books inside a loop silently runs a query each iteration. It’s fine at 10 rows and catastrophic at 10,000 — thousands of network round trips for data one JOIN could return, and it’s the usual cause of a page that’s “slow for no reason.” Fix it by fetching related data in a single query — a JOIN, or the ORM’s eager-loading (select_related/joinedload). The habit: whenever you loop over query results and touch a related object, count the queries.
Q: When would you shard a database, and why is it a last resort? A: Shard when a single database genuinely cannot handle the write volume or data size, and only after exhausting the cheaper levers — indexing, connection pooling, caching, read replicas, vertical scaling, partitioning. It’s the last resort because it’s a large complexity jump: you pick a shard key that (if chosen wrong) creates hot spots, cross-shard queries become app-side scatter-gather-and-join, distributed transactions get hard, and adding a shard means rebalancing live data. Read replicas already give you horizontal read scaling cheaply; sharding is specifically for horizontal write scaling, which most services never need. The estimate usually tells you honestly whether you’re near that wall — in the URL shortener, 39 writes/s and 3 TB said “don’t shard.”
Q (system design): Design a URL shortener. Walk me through it.
A: Clarify requirements (shorten + redirect; read-heavy; low-latency; highly available; short codes; scope out analytics/expiry). Estimate: ~100M links/month ≈ 39 writes/s but ~3,900 reads/s (100:1, ~11,600 at peak), ~3 TB over 5 years, and a 7-char base-62 code gives 3.5 trillion combinations. Those numbers say: one database easily handles the writes and storage (no sharding), but the read load is heavy (cache it). API: POST /shorten returns a code; GET /{code} 301-redirects. Generate codes by base-62-encoding an auto-increment ID (unique for free; note it’s enumerable) or random-plus-check if unguessability matters. Then iterate through bottlenecks: stateless app tier + load balancer for the read RPS, cache-aside (code→URL) so ~99% of redirects skip the DB, read replicas for redundancy and read scale, a queue for slow create-time work (safe-browsing checks), and a CDN/edge cache for global latency. The final shape is the standard topology — and every lever was justified by a number, including the decision not to shard.
Q (system design): Design a rate limiter for a public API (say, 100 requests/minute per API key).
A: Use a token bucket per API key: capacity sets the burst, refill rate sets the sustained limit (100/min ≈ ~1.67/s refill, capacity maybe 100 for a full-minute burst). Each request spends a token; empty bucket → 429 Too Many Requests with a Retry-After. It must be stateless in the app tier and shared, so the counter lives in Redis (e.g. an atomic INCR with an expiring key, or a Lua script implementing the bucket) — otherwise each of your N boxes enforces its own separate limit and the real limit is N× too high. Consider the algorithm choice (token bucket allows bursts; fixed-window is simple but has boundary spikes; sliding-window-log is precise but memory-heavy). Fail open or closed deliberately if Redis is down (open = availability, closed = protection). The demo built the single-process bucket; the production version just moves the counter to Redis so all boxes share it.
Q: A service works fine in testing but falls over at peak traffic. How do you reason about it? A: Single-request tests don’t exercise the load-dependent failure modes, so I’d suspect one of a handful: connection-pool exhaustion (no pooling, or pool too small — every request opening a DB connection), a cache stampede (DB spiking on TTL boundaries), synchronous slow work tying up all request threads under a burst, an unbounded queue backing up, or a race/contention bug that only appears under concurrency. I’d load-test to the estimated peak (not 1x) while watching the golden signals — latency percentiles, error rate, saturation of CPU/connections/queue-depth — to see which resource saturates first. The failing resource names the fix: pool it, cache it (with jitter), queue it, bound it, or add boxes. The meta-point: capacity is found by measuring the bottleneck under realistic load, not by hoping.
Key takeaways
- Scalability is a property of the architecture, not the code. Two services with identical Python can have wildly different scaling ceilings because of where the state lives and what sits on the read path. “Scalable” means handling growth by adding resources without a rewrite — it is not a synonym for “fast,” and latency (time for one request) and throughput (requests per second) are different quantities you buy in different ways.
- Run the method, don’t memorise architectures. Requirements → estimate the load (two minutes of back-of-envelope arithmetic that tells you whether you’re building for 40 or 40,000 RPS) → define the API → sketch components → find the bottleneck under the estimate → apply the cheapest lever → iterate. The architecture emerges from bottlenecks the numbers expose; it is never drawn correct on the first try.
- Three levers carry almost every scalable service. A stateless app tier (state moved to shared stores) makes horizontal scaling possible — the master key. A cache on the read path (cache-aside by default) cuts read latency by orders of magnitude and shields the database — we measured 493 of 500 reads never touching it. An async queue offloads slow work so the request returns fast and spikes get absorbed — enqueue was ~0.01 ms against 200 ms of work.
- Every lever has a failure mode, and knowing it is the job. A stateful tier caps you at one box; sticky sessions fake the fix. A cache stampede on mass expiry floods the database (jitter TTLs, single-flight). At-least-once delivery double-processes non-idempotent consumers (de-dup by job ID). An unbounded queue is a crash in waiting (bound it, monitor depth). A load balancer or lone database is a single point of failure (make it redundant).
- The database is where you actually hit the wall — pull the cheap levers first. Index, pool connections, cache, add read replicas, partition, and only then — as a genuine last resort — shard. Kill N+1 queries early (count your queries in loops), and start with PostgreSQL; reach for NoSQL only when a measured access pattern truly fits it.
- Name the tradeoff or you don’t understand the choice. CAP is the deep one: during a network partition you choose consistency or availability — strong consistency for money and inventory, eventual consistency for feeds and counters. Every cache, replica, and queue trades a little consistency for speed and availability; make that trade on purpose.
- Design for the next order of magnitude, not the next six. Under-building leaves you a rewrite when success comes; over-building spends your scarcest resource — engineering time — on a scale you cannot predict, and a sharded, microserviced cathedral serving four hundred requests a day is more fragile than the boring single-database service it replaced. Measure the bottleneck, then pull the next lever — and know when to stop.
This capstone stands on four other lessons. The layered, injectable structure inside each app instance — the pure core behind ports and adapters that lets you swap SQLite for Postgres or add a cache without touching the business rules — is the whole subject of Modular, Testable Code: SOLID, Layering & Dependency Injection. The database mechanics assumed here — connection pooling, indexing, transactions, and taking an API to production — are covered field by field in Web Part 2 — Databases, Authentication & Taking an API to Production. The streaming half of the queue story — Kafka, consumer groups, backpressure, exactly-once semantics at scale — is developed in Data Engineering with Python: Batch & Streaming Pipelines. And the reliability engineering this lesson only sketches — retries, timeouts, circuit breakers, observability, SLOs and the golden signals — is the focus of Performance, Reliability & Maintainability, the natural next step once your service is shaped to scale.