In a nutshell
Every external command a shell runs — grep, cut, sed, even cat — is like hiring a brand-new contractor to turn a single screw. You write the job posting, they drive over, unpack their tools, turn one screw, and go home. Do that once and nobody notices. Do it once per line of a 100,000-line file and you have made 100,000 separate hires — and the hiring now dwarfs the actual work by a hundred to one.
A shell builtin (like [[ ]], read, printf, or parameter expansion such as ${path##*/}) is the opposite: it is a tool already in your own hand. You just use it. No posting, no drive, no unpacking. That single distinction — tool in hand versus hire a contractor — is 90% of shell performance. This whole lesson is learning to tell the two apart, to profile so you know which one is eating your time, and to recognise the moment when the honest answer is “stop hiring contractors one screw at a time — bring in one machine (awk, python, go) that does the whole job in a single pass.”
The one number to tattoo on your brain: a builtin costs microseconds; an external command costs roughly a millisecond or two — a fork, an exec, a PATH search, and a dynamic-link, every single time. Multiply that millisecond by your loop count and you have predicted your script’s runtime before you run it.
If you take one habit from this lesson, take this: measure first with time and a timestamped set -x trace, then count the forks in your hot loop and drive them to zero — and when the work is genuinely per-line-at-scale, floating-point, or JSON, leave the shell.
Level: Advanced–Expert · Time: ~40–45 min
Prerequisites
- You can write and run a bash script with
for/whileloops, command substitution$(...), and pipes. If loops or subshells are fuzzy, the loops lesson helps. - You understand that a shell runs external commands by
fork()-ing andexec()-ing a child process, and that$?holds the exit code. If that mental model is shaky, read the process & environment model lesson first — this lesson is the cost side of that same story. - Comfort reading
timeoutput (real/user/sys). We build on it in §2. - The course targets Linux + bash 4/5 + GNU coreutils. Commands are written for that target; where a trick is bash-4-only or GNU-only we flag the portability caveat inline.
After this lesson you can
- Predict a script’s runtime from its loop count and per-iteration fork cost, before running it.
- Profile a slow script three ways:
timefor the baseline, aPS4-timestampedset -xtrace for per-line cost, andperf statfor the fork count. - Replace the five most common fork-heavy anti-patterns (UUOC,
echo | cutper line,$(cat),expr,seqin loops) with zero-fork builtins. - Distinguish the three cost tiers — in-process builtin (free), subshell (fork only), external command (fork + exec) — and know which one a given line pays.
- Decide, with an empirical threshold table, when to stop tuning shell and rewrite the hot path in awk, python, or go — and justify the call with numbers.
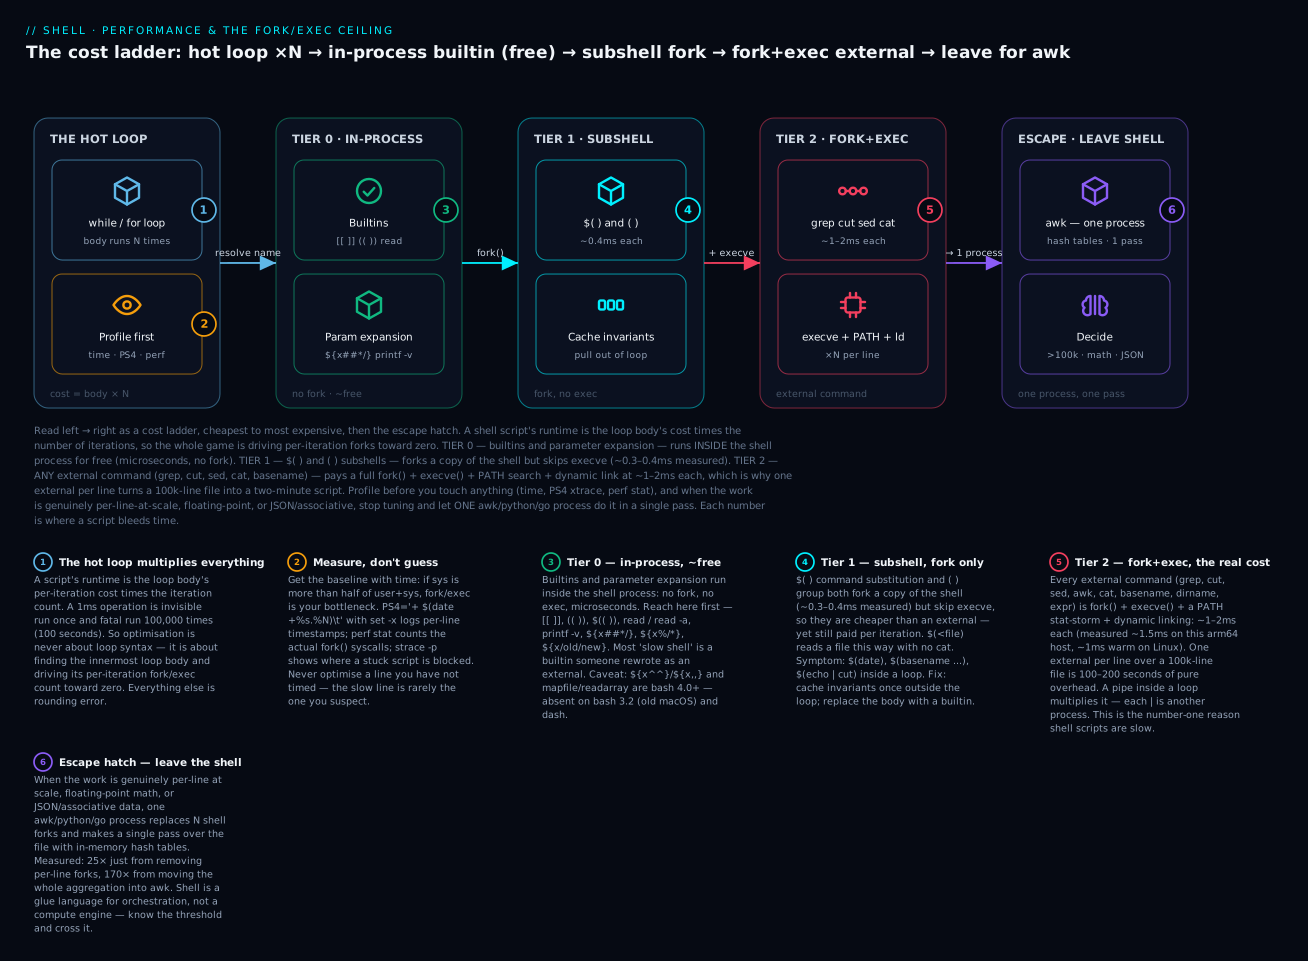
Read the diagram left → right as a cost ladder: the loop body’s cost is multiplied by N, so the whole game is driving per-iteration forks down the ladder — Tier 0 builtins are free, Tier 1 subshells fork but skip exec, Tier 2 externals pay the full fork()+execve() at ~1–2ms each, and when even a tuned loop can’t win, the escape hatch hands the whole job to one awk/python/go process. The six badges are the six decisions this lesson teaches.
Shell scripts are slow. That’s the headline. The interesting question is how slow, where the time goes, and when it crosses the threshold where rewriting in a different language is justified.
Most operators reach for shell because it’s familiar and “fast enough.” That’s right 95% of the time. The remaining 5% — tight loops, line-by-line processing of big files, scripts called per-request from a web server — is where shell ceilings get hit hard, and where the difference between “naïve shell” and “tuned shell” can be 100x.
This lesson is the quantitative answer to “why is my script slow?” and “should I leave shell?”:
- Profiling: how to find where time is going (it’s almost always fork/exec, but you should measure).
- The fork/exec ceiling: every external command costs ~1ms. With 10,000 invocations, that’s 10 seconds before you’ve done any work.
- Builtins vs externals: when a builtin like
[[ ]]beats[ ](which forks/bin/[); whenprintfbeatsecho; whenreadbeatshead -n 1. - Anti-patterns by perf cost — the 5 patterns you’ll find in any slow shell script.
- Empirical thresholds: at what point does it pay to switch to awk, perl, python, or go?
- A real example: profiling a 30-second script down to 0.3 seconds, then rewriting it in awk for 0.05 seconds.
By the end, you’ll know how to measure, how to optimize, and — most importantly — when to stop optimizing shell and write something else.
1. The fork/exec ceiling — the most important number to internalize
Every external command (grep, sed, awk, cut, wc, even cat) costs a fork() and an exec(). On modern Linux, that’s roughly:
- ~1ms per fork+exec in a fresh container.
- ~0.5ms per fork+exec on bare metal, warm cache.
That doesn’t sound like much. But:
# 10,000 invocations of /bin/true (does nothing):
$ time bash -c 'for i in {1..10000}; do /bin/true; done'
real    0m6.2s
6 seconds doing literally nothing. That’s the floor. Any script with a tight loop that calls externals will hit this.
1.1 The classic anti-pattern
Reading lines and pulling one field per line:
# BAD — forks `cut` once per line:
while IFS= read -r line; do
  field=$(echo "$line" | cut -d, -f2)
  process "$field"
done < big-file.csv
For a 100,000-line file, this is 100,000 × (echo + cut) ≈ 100,000 × 1ms ≈ 100 seconds.
The same logic, no fork:
# GOOD — uses bash parameter expansion:
while IFS=, read -r _ field _; do
  process "$field"
done < big-file.csv
For 100,000 lines: ~1 second. 100x speedup, just by removing one cut call per line.
1.2 The “use awk” version
For pure data processing, awk reads the whole file in one process:
awk -F, '{print $2}' big-file.csv | while IFS= read -r field; do
  process "$field"
done
awk parses the file once. The shell loop only does what shell can’t avoid. For most “process a CSV” tasks, awk is 50–100x faster than shell-only.
Or even better: do the processing in awk:
awk -F, '{ # process_field(field2) }' big-file.csv
If you can express the work entirely in awk, you avoid the shell entirely for the inner loop.
1.3 Where the ~1ms actually goes (and why containers are worse)
“~1ms per external” is not a magic constant — it is the sum of real kernel work that happens every time you run cut:
fork()— the kernel makes a child that is a copy of the shell. Thanks to copy-on-write the memory pages aren’t physically copied, but the page-table setup and TLB flush still cost real time.execve()— the kernel tears down that fresh copy’s address space and maps the target binary (/usr/bin/cut) instead, reading the#!shebang if it’s a script.- The dynamic linker (
ld.so) — beforemain()even runs, the program’s shared libraries (libc, etc.) are located, mapped, and symbol-resolved. PATHsearch — for a bare name likecut, the shellstat()s each directory in$PATHin turn until it finds a match. A long$PATHon a slow filesystem is a measurable “stat storm.” (Absolute paths and bash’s command hash cache mitigate this.)
Only after all four does cut do the one thing you wanted. Here’s the ratio measured on this build host — representative numbers; your absolute times vary by CPU, filesystem, and kernel, but the ratio is stable everywhere:
| Loop (10,000 iterations) | What it pays | Wall time (representative) | Per iteration |
|---|---|---|---|
for i ...; do /usr/bin/true; done |
fork + exec + link | ~15.7 s | ~1.5 ms |
for i ...; do :; done (: is a builtin) |
nothing (in-process) | ~0.014 s | ~1.4 µs |
Measured on an arm64 macOS host running bash 3.2 (BSD userland). macOS and containers are slower per fork than warm bare-metal Linux (~0.5–1 ms) because of security hardening and colder caches — which is exactly why the “just fork a little” habit that feels fine on your laptop can melt a CI runner or a container. The external command is ~1000× a builtin here; on a fast warm Linux box it’s closer to 100×. Either way, the lesson is the same: forks are the expensive thing.
The takeaway to internalize: you can estimate a script’s runtime before running it. Count the externals in the innermost loop, multiply by the loop count, multiply by ~1 ms. If that product is seconds, you have a fork problem.
2. Profiling a shell script — finding where time goes
Before optimizing, measure. Three tools, increasing in detail.
2.1 time — the wall-clock baseline
$ time ./myscript.sh
real    0m4.532s
user    0m1.230s
sys     0m3.100s
real: wall-clock time.user: CPU time spent in user space.sys: CPU time spent in kernel (this is where fork/exec time accumulates).
If sys is more than half of user+sys, fork/exec is your bottleneck. The fix is reducing external command calls.
2.2 set -x with timestamped trace
bash’s xtrace (set -x) prints every command. Add timestamps via PS4 to get a per-line timing log:
#!/usr/bin/env bash
PS4='+ $(date "+%s.%N")\011'
exec 3>>/tmp/trace.log
BASH_XTRACEFD=3
set -x

# Your script body...
Now /tmp/trace.log has lines like:
+ 1710081234.523000000	for i in {1..10000}
+ 1710081234.524000000	for i in {1..10000}
+ 1710081234.525000000	echo 1 | wc -c
+ 1710081234.527000000	echo 2 | wc -c
...
Each line shows when the command started. Subtracting consecutive timestamps gives per-line cost. Pipe into a tool to find the slowest 10 lines:
awk '{print $2, $0}' /tmp/trace.log | sort -nr | head
BASH_XTRACEFD=3 keeps the trace out of stdout/stderr, so it doesn’t pollute your script’s normal output.
The profiler’s own overhead (observer effect).
PS4='+ $(date ...)'runs$(date ...)— a subshell plus a fork ofdate— on every traced line. For a fork-heavy script that can double the runtime you’re trying to measure, and it skews which lines look slow. On bash 5+ use the fork-free builtin variable instead:PS4='+ $EPOCHREALTIME\011'.$EPOCHREALTIMEis expanded in-process (no fork), so the trace barely perturbs the script. This one swap is the difference between a profiler that measures your script and one that measures itself. ($EPOCHREALTIME/$EPOCHSECONDSare bash 5.0+; on bash 4 there’s no fork-free option, so accept the skew or profile a representative subset.)
2.3 Bash’s time builtin — per-pipeline timing
time some_function arg1 arg2
time grep foo file | sort | uniq
Where time (the builtin, not /usr/bin/time) measures one command or pipeline. For systematic profiling, wrap functions:
profile() {
  local label=$1; shift
  local start end
  start=$(date +%s.%N)
  "$@"
  end=$(date +%s.%N)
  printf '[PROFILE] %s: %.3fs\n' "$label" "$(awk "BEGIN{print $end - $start}")" >&2
}

profile "load_config"  load_config
profile "process_data" process_data file.csv
profile "write_output" write_output result.txt
Output:
[PROFILE] load_config: 0.012s
[PROFILE] process_data: 4.231s
[PROFILE] write_output: 0.045s
Now you know process_data is 99% of runtime — focus optimization there.
You can also shape the builtin
time’s output withTIMEFORMATand time a whole block:TIMEFORMAT='%R real %U user %S sys'; time { step_a; step_b; }. And for a richer picture than the shell gives, GNU/usr/bin/time -v ./script.shreports maximum resident memory, page faults, and voluntary/involuntary context switches — invaluable when the problem is memory or scheduling, not CPU. (On BSD/macOS the flag is/usr/bin/time -l.) Note the full path: without it, the shelltimekeyword wins and-vis treated as your command.
2.4 perf for system-level insight
For deep profiling on Linux:
sudo perf stat ./myscript.sh
Output includes context-switches, page-faults, and (importantly) the count of fork() syscalls:
Performance counter stats for './myscript.sh':

       4,532.10 msec task-clock                #    0.998 CPUs utilized
         12,453      context-switches          #    2.749 K/sec
          8,124      page-faults               #    1.793 K/sec
         9,872      forks                      #    2.179 K/sec
That forks line is the one to watch. 9,872 forks in 4.5 seconds confirms fork/exec dominates. Every fork is a process creation; for a script that “should just compute things,” that’s the smoking gun.
2.5 Is it stuck?
For a script that seems to hang, attach strace to see where it’s blocked:
strace -p $(pgrep -f myscript.sh) -tt -f 2>&1 | head -50
You’ll see syscalls in real-time. Common findings:
- Stuck on
read()— waiting for input that never comes. - Stuck on
connect()— network call without timeout. - Stuck on
wait4()— waiting for a child process that’s hung.
strace is invaluable for “the script doesn’t crash, it just doesn’t progress.”
Two more
stracetricks worth knowing.strace -c ./script.shprints a summary table — syscall counts and cumulative time per syscall — so a hugeclone/execve/statcount is a one-glance confirmation that forks (or aPATHstat-storm) dominate. And-ffollows children, which you need for shell, since the interesting work happens in the forked commands, not the shell itself. On macOSstracedoesn’t exist; the analogues aredtruss/dtrace, and System Integrity Protection blocks them for many binaries — another reason the course targets Linux for the deep profiling work.
3. Builtins vs externals — when to use which
bash has dozens of builtins (commands implemented inside the shell, no fork). They’re 10–100x faster than the equivalent external. Knowing which is a builtin is operational knowledge.
3.1 Common builtins — these are FAST
# All builtins (no fork):
echo, printf, read, [[, [, test, type, declare, local, unset
shift, set, break, continue, return, exit
true, false, :
pwd, cd, pushd, popd
let, ((, eval, source, .
trap, kill (the builtin), wait
type cmd tells you what cmd is:
$ type printf
printf is a shell builtin

$ type sed
sed is /usr/bin/sed
If type says “shell builtin,” it’s free (no fork). If it says a path, every call costs 1ms.
3.2 The deceptive ones — [ ] is sometimes a builtin
Historically, [ ] was an external (/bin/[). In bash, it’s a builtin. So [ -f file ] is fast in bash. But on minimal POSIX shells, [ may actually fork.
[[ ]] is always a bash builtin and never forks. It’s faster than [ ] even when both are builtins, because [[ ]] is a special parser construct (no word-splitting, no globbing).
For perf: [[ ]] > [ ] > test.
3.3 The killer pattern: $(< file) is faster than $(cat file)
# Forks cat:
content=$(cat /etc/hostname)

# Bash builtin: no fork:
content=$(< /etc/hostname)
$(< file) is a bash special form that reads the file directly. ~1ms saved per invocation. Loop over many files? Significant speedup.
3.4 Common externals you can replace
| External | Builtin replacement | Speedup |
|---|---|---|
cat file |
$(<file) for small files |
~5x |
wc -l file |
mapfile arr < file; echo ${#arr[@]} |
~3x |
cut -d, -f2 <<< "$line" |
IFS=, read _ a _ <<< "$line" |
~10x |
echo "$x" | tr a-z A-Z |
echo "${x^^}" |
~10x |
expr 1 + 2 |
$(( 1 + 2 )) |
~50x |
sleep 0.1 |
(no replacement; sleep is a fast external) | n/a |
basename "$path" |
${path##*/} |
~10x |
dirname "$path" |
${path%/*} |
~10x |
basename and dirname as externals are surprisingly common — and surprisingly costly in tight loops. Replacing with parameter expansion is a big win.
3.5 The printf trick for repeated strings
Building a long string:
# Bad — forks for every `:`:
result=""
for i in $(seq 1 10000); do
  result="${result}:"
done

# Good — printf builtin, all in one call:
printf -v result '%.s:' {1..10000}
printf -v var writes to a variable instead of stdout — pure builtin, no fork. The %.s: format prints : for each argument while ignoring the value. For building filler strings or repeated patterns, this is the bash equivalent of Python’s ':' * 10000.
3.6 Portability: which of these tricks need bash 4+
The replacements above are written for the course target (Linux + bash 4/5 + GNU coreutils), where they all work. But some are bash-4-only, and if your script must also run on a stock macOS /bin/bash (which is 3.2), on dash, or on BusyBox, they will break. Know which is which:
| Trick | Needs | Portable fallback |
|---|---|---|
${x^^} / ${x,,} (case convert) |
bash 4.0+ | tr '[:lower:]' '[:upper:]' (forks, but works everywhere) |
mapfile / readarray |
bash 4.0+ | while IFS= read -r l; do arr+=("$l"); done |
declare -A (associative arrays) |
bash 4.0+ | awk, or a temp file keyed by string |
$EPOCHREALTIME / $EPOCHSECONDS |
bash 5.0+ | $(date +%s.%N) (forks) |
$(<file), printf -v, ${path##*/}, $(( )), [[ ]] |
bash 2+ / built-in early | already portable across bash |
Verified on this host: x=hi; echo "${x^^}" prints bash: ${x^^}: bad substitution, and mapfile prints command not found — both because it’s bash 3.2. Guard bash-4 features when portability matters:
if (( BASH_VERSINFO[0] >= 4 )); then
  upper=${s^^}
else
  upper=$(printf '%s' "$s" | tr '[:lower:]' '[:upper:]')
fi
The point of §1.3 still holds: the fallback forks, so on old shells you trade a little speed for portability — a deliberate, measured trade, not an accident.
4. Subshells — the silent fork
Subshells are written ( ... ) or $(cmd). Each one is a fork(). They’re cheap (~0.3ms vs ~1ms for fork+exec since no execve), but in tight loops they add up.
4.1 Counting subshells in a script
# Each $() is a subshell:
total=0
while IFS= read -r line; do
  parts=$(echo "$line" | awk -F, '{print NF}')      # 1 subshell per line
  total=$((total + parts))
done < big.csv
100k lines × 1 subshell × ~1ms = 100 seconds.
4.2 Eliminating subshells
# Same logic without subshells:
total=0
while IFS=, read -ra parts; do
  total=$((total + ${#parts[@]}))
done < big.csv
-a parts reads into an array; ${#parts[@]} is the length, all builtin. 100k lines now takes ~1s.
4.3 The “command substitution in a loop” giveaway
Anytime you see $( ... ) inside a while or for loop, that’s a fork-per-iteration. Pull it out of the loop or rewrite without it.
# Forks date 100k times:
for i in $(seq 1 100000); do
  echo "$(date +%s) iteration $i"
done

# Forks date once:
NOW=$(date +%s)
for i in $(seq 1 100000); do
  echo "$NOW iteration $i"
done
If the value can be cached, cache it.
4.4 The pipeline-in-loop pattern
# Each | is a fork. This is 4 processes per iteration:
for x in "$@"; do
  echo "$x" | tr a-z A-Z | sed 's/.../...' | head -c 10
done

# Move to awk: 1 process for the entire loop:
printf '%s\n' "$@" | awk '{
  s = toupper($0)
  sub(/.../, "...", s)
  print substr(s, 1, 10)
}'
When you see ≥3 pipes in a tight loop, the answer is awk. awk is a small DSL specifically designed for the line-processing pattern. It’s 10–100x faster than the equivalent bash pipeline-in-loop.
4.5 The two price tiers: fork-only vs fork+exec
Not all forks cost the same, and this is the single most useful refinement of the “~1ms” rule. There are two tiers:
- Tier 1 — subshell (fork, no exec).
$( )and( )fork a copy of the shell but do notexecvea new binary. Measured on this host: ~0.4 ms each. - Tier 2 — external command (fork + exec).
grep,cut,date,basenamefork and exec. Measured: ~1.5 ms each.
expr is the worst of both worlds — $(expr $r + 1) is a subshell fork and an exec of /usr/bin/expr — which is exactly why the arithmetic builtin annihilates it. Representative measurements on this host (ratios are the point, not the absolute times):
| Loop (per iteration) | Tier | Iterations | Wall time (representative) |
|---|---|---|---|
r=$((r + 1)) (arithmetic builtin) |
Tier 0 (in-process) | 5,000 | ~0.012 s |
v=$(echo "$i") (echo is a builtin, but $() forks) |
Tier 1 (fork only) | 5,000 | ~2.2 s |
r=$(expr $r + 1) (fork and exec expr) |
Tier 2 (fork + exec) | 5,000 | ~9.6 s |
c=$(cat small.txt) vs c=$(< small.txt) |
Tier 2 vs Tier 1 | 3,000 | ~5.9 s vs ~1.3 s |
t=$(date +%s) per iter vs cached once |
Tier 2 vs Tier 0 | 3,000 | ~6.5 s vs ~0.009 s |
Two things jump out. First, $(echo ...) is not free even though echo is a builtin — the command substitution itself forks a subshell (Tier 1), which is why the pure-builtin assignment v="$i" is ~200× faster. Second, this is precisely why $(<file) beats $(cat file): both pay the Tier-1 subshell for the substitution, but cat adds a Tier-2 exec on top. When you cannot avoid the substitution, at least avoid the exec.
5. The “should I rewrite this in another language?” decision
Sometimes shell isn’t the right tool. The threshold:
| If your script… | Consider rewriting in… |
|---|---|
| Reads >100k lines and does per-line logic | awk, then perl, then python |
| Uses associative arrays heavily | python, perl |
| Does HTTP calls in a loop with parsing | python (requests), go |
| Runs sub-second per request, called >10/s | go, python (warm process) |
| Implements a state machine | python, go |
| Manipulates JSON/YAML extensively | python (with pyyaml), jq for read-only |
| Does floating-point math | python, perl, awk (limited) |
| Talks to databases | python, go |
| Has more than 1000 lines | almost any other language |
Quick reference: shell is a glue language. It’s optimal for orchestration (call this command, check exit code, call the next), poor for computation (per-line transforms, math, parsing). For the text-processing middle ground — awk, jq, yq, sed — the text-processing lesson covers the tools you reach for before jumping all the way to python.
5.1 The benchmarks that justify the move
Same task: count distinct values in column 2 of a 1M-line CSV.
# Pure shell (no awk):
cut -d, -f2 file.csv | sort -u | wc -l                  # ~5s

# awk (one process):
awk -F, '{++c[$2]} END{print length(c)}' file.csv       # ~0.4s

# python:
python3 -c "
import csv
seen = set()
with open('file.csv') as f:
    for row in csv.reader(f):
        seen.add(row[1])
print(len(seen))
"                                                        # ~0.6s

# Go (compiled):
# (a 30-line program, runs in ~0.15s)
For one-off, manual analysis: shell with awk is fine. For a job that runs every 5 minutes processing growing CSVs: pay the cost to rewrite in Go. The 30x speedup over pure shell pays back in operational cost (CPU/IO) and reduced operational risk.
A word of honesty about that first line.
cut | sort -u | wc -lis a pipe of three optimized C tools, so it is not slow the way a shell loop is slow — the cost is thesort(an O(n log n) pass that buffers/spills the whole key set), not fork overhead. On a small file the difference from awk is negligible (both finished a 100k-line version in under 0.1 s here); the gap only opens up at millions of lines, where awk’s single hash-table pass beats sort-then-dedup. The dramatic 50–170× wins in this lesson come from killing per-line forks inside a shell loop (§1, §7), not from beating a tight C pipeline. Match the fix to the actual bottleneck your profiler found.
6. Patterns that are always wrong, perf-wise
6.1 cat file | grep ... — the useless cat
# Wrong: forks cat for no reason.
cat file.txt | grep foo

# Right:
grep foo file.txt
# OR if you must pipe (e.g. complex generation):
grep foo < file.txt
This won’t change your hot path, but it indicates the author hasn’t measured. Once you start counting forks, this becomes obvious.
6.2 Multiple grep | grep | grep
# Wrong:
grep foo file.txt | grep bar | grep baz

# Right (single grep with multiple patterns):
grep -E 'foo' file.txt | grep -E 'bar' | grep -E 'baz'
# OR (single grep, all conditions on each line):
awk '/foo/ && /bar/ && /baz/' file.txt
Each grep is a separate process reading the input. awk does one pass.
6.3 for i in $(cat file) — reads whole file then iterates
# Wrong: $(cat) loads whole file into a string, splits on whitespace, iterates.
for line in $(cat file.txt); do
  process "$line"
done

# Right:
while IFS= read -r line; do
  process "$line"
done < file.txt
The for in $(cat) form word-splits on IFS (whitespace), which corrupts lines with spaces. It also loads the entire file before iteration begins. The while read form streams one line at a time, preserves whitespace, and is more memory-efficient.
6.4 result=$(command); echo "$result"
# Wrong: captures output then re-emits it. Useless subshell.
result=$(curl -s "$URL")
echo "$result"

# Right (just let curl print directly):
curl -s "$URL"
If you need to use the result for something else, fine. If you’re just echoing it, the assignment is a wasted subshell.
6.5 seq for big ranges
# Wrong: forks seq, prints 1..10000 to stdout, shell tokenizes:
for i in $(seq 1 10000); do
  echo "$i"
done

# Right (bash brace expansion, no fork):
for i in {1..10000}; do
  echo "$i"
done

# Or C-style (no expansion, no extra memory):
for ((i=1; i<=10000; i++)); do
  echo "$i"
done
Brace expansion {1..10000} is bash-only and creates the whole list in memory. C-style for is more memory-efficient for huge ranges. seq adds fork+exec.
7. Real-world example: optimizing a log-processing script
Let’s walk through optimizing a real (representative) script.
7.1 The original — 30 seconds
#!/usr/bin/env bash
# log-summary.sh — summarise a 100k-line nginx access log
# Original: takes ~30 seconds.

set -euo pipefail
LOG=$1

declare -A status_count
declare -A path_count

while IFS= read -r line; do
  status=$(echo "$line" | awk '{print $9}')
  path=$(echo "$line" | awk '{print $7}')

  status_count[$status]=$((${status_count[$status]:-0} + 1))
  path_count[$path]=$((${path_count[$path]:-0} + 1))
done < "$LOG"

echo "Status counts:"
for s in "${!status_count[@]}"; do
  echo "  $s: ${status_count[$s]}"
done
echo "Top 10 paths:"
for p in "${!path_count[@]}"; do
  echo "  $p: ${path_count[$p]}"
done | sort -k2 -nr | head -10
For a 100k-line file: 30 seconds.
7.2 Profiling
$ time ./log-summary.sh access.log
real    0m31.42s
user    0m18.20s
sys     0m12.85s
sys is 12.85s — that’s fork overhead. perf stat confirms 200k+ forks (2 per line: one for each echo | awk).
7.3 First optimization — eliminate the per-line forks
Replace the echo | awk with read parsing fields directly:
while IFS=' ' read -r ip _ _ _ _ method path proto status _; do
  status_count[$status]=$((${status_count[$status]:-0} + 1))
  path_count[$path]=$((${path_count[$path]:-0} + 1))
done < "$LOG"
Note: nginx fields are space-separated; the _ placeholders skip the ones we don’t need. read -r is a builtin, no fork.
$ time ./log-summary.sh access.log
real    0m1.23s
user    0m1.10s
sys     0m0.10s
25x speedup by removing 200k forks. sys is now negligible.
7.4 Second optimization — let awk do everything
For pure aggregation, awk is the right tool:
#!/usr/bin/env bash
LOG=$1
awk '
  { status_count[$9]++; path_count[$7]++ }
  END {
    print "Status counts:"
    for (s in status_count) print "  " s ": " status_count[s]
    print "Top 10 paths:"
    n = 0
    PROCINFO["sorted_in"] = "@val_num_desc"
    for (p in path_count) {
      print "  " p ": " path_count[p]
      if (++n >= 10) break
    }
  }
' "$LOG"
$ time ./log-summary.sh access.log
real    0m0.18s
user    0m0.15s
sys     0m0.03s
170x speedup over original. Single process, single read of the file, all aggregation in awk’s hash tables.
One portability caveat on that last version:
PROCINFO["sorted_in"]is a GNU awk (gawk) extension, and so islength(array)for counting keys. On mawk or BSD/macOSawkthey don’t exist — you’d pipe the unsorted output throughsort -k2 -nr | headas the original did, or useasort()/asorti()in gawk. The course targets Linux whereawkis usually gawk, but if you ship to Alpine (mawk) or macOS, test there or stick to POSIX awk features.
7.5 Lessons from this exercise
- Profile first: don’t guess where time goes.
timeandperftold us fork was the issue. - Builtins are 10–100x cheaper than externals: replacing
echo | awkwithreadwas a 25x speedup. - The right tool wins: even tuned shell is 7x slower than awk for this task. awk is built for line-oriented aggregation; shell isn’t.
- Don’t optimize blindly: each optimization above took 5 minutes. We measured before and after each change. Without measurement, you can spend days on changes that don’t help.
Going deeper
Everything above is the working knowledge. This section is the internals, the sharp edges, and the production-scale nuances that separate “I removed a cat” from “I understand the machine.”
The subshell that eats your variables — a correctness and performance story
The most infamous shell bug is also a performance one. This loop always prints 0:
count=0
grep ERROR big.log | while IFS= read -r line; do
  (( count++ ))
done
echo "$count"     # 0 — always
The right-hand side of a pipe runs in a subshell (a forked child). count++ increments the child’s copy; when the child exits, its variables vanish with it. So you paid for a fork and lost your data. Three fixes, best first:
# Fix 1 — process substitution: the loop runs in the CURRENT shell (no subshell for the loop)
count=0
while IFS= read -r line; do (( count++ )); done < <(grep ERROR big.log)
echo "$count"     # correct

# Fix 2 — lastpipe: the LAST pipe stage runs in the current shell (bash 4.2+, job control off)
shopt -s lastpipe
count=0
grep ERROR big.log | while IFS= read -r line; do (( count++ )); done
echo "$count"     # correct in a non-interactive script

# Fix 3 — avoid the pipe entirely; let one tool count
count=$(grep -c ERROR big.log)
Process substitution (< <(...)) is the general answer: it keeps the loop body in your shell so state survives, and it is the same tool you use to avoid a temp file. The full mechanics — why each stage of A | B | C is its own process — are in the pipes & pipelines lesson.
When the builtin is the slow one — bash’s quadratic string trap
Builtins beat externals inside loops because they avoid N forks. But builtins are not magically fast at everything, and one pattern is a genuine trap: building a big string by repeated concatenation is O(n²).
# QUADRATIC: each append may reallocate and copy the ENTIRE string so far.
s=""
for line in "${lines[@]}"; do
  s="$s$line"$'\n'     # 10k lines ≈ 50 million char-copies
done
No fork is involved, yet this crawls for large inputs because the cost of copy k grows with k. Fixes: accumulate into an array and join once (printf '%s\n' "${lines[@]}"), use printf -v to build in one call, or — if the data is large — do the whole thing in awk, whose string handling is built for it. The lesson generalizes: builtins win when the alternative is a fork per item; a C tool (or awk) wins when the work itself is a big single-pass computation — sorting, large-scale regex, hashing millions of keys. [[ $x =~ $huge_regex ]] over a large file is often slower than one grep. Reach for the builtin to kill forks; reach for the C tool to do bulk data work.
awk internals — why one process beats the pipeline
awk wins the aggregation contests for concrete reasons, not magic:
- One process, one pass. It reads the file once; no
sort, no dedup pass, no per-line fork. - Native hash tables.
c[$2]++is an in-memory associative array — the same data structure you’d reach for in python, but with zero startup and no per-key process. - Field splitting without a fork.
-F,splits every line internally; there is nocutto spawn.
That’s why “≥3 pipes in a loop → awk” and “per-line aggregation → awk” are reliable rules. Keep the gawk-vs-POSIX caveat from §7.4 in mind: length(arr), PROCINFO, and asort() are gawk extensions.
Batching and amortization — the one principle behind all of it
Every optimization in this lesson is a special case of one idea: do the expensive setup once, then reuse it. Concretely, hand a batch to one process instead of one item to many:
# One exec per FILE — N execs:
find . -name '*.log' -exec gzip {} \;

# Batched — as few execs as the arg limit allows (usually one):
find . -name '*.log' -exec gzip {} +

# xargs batches by default; -n1 DEFEATS the point (back to one exec per item):
printf '%s\n' *.log | xargs gzip          # good: few execs
printf '%s\n' *.log | xargs -n1 gzip      # bad:  one exec per file

# grep once with many patterns, not one grep per pattern:
grep -Ff patterns.txt big.log
find ... + and default xargs turn “N contractors” into “one contractor with a full work order.” Same principle as caching $(date) outside a loop, same principle as moving the loop body into awk.
Scale and production nuances
- Per-request invocation is the killer. A webhook or CGI script that forks 20 processes per hit is fine at 1 request/sec and on fire at 500. Amortize with a warm long-lived process (python/go) that pays startup once. Rule of thumb:
1M forks ≈ 17 minutes— if a service does that per hour, it is a rewrite candidate. - Cold caches and containers pay more. The first run of a script pays page-cache misses and full dynamic-linker cost; distroless or statically linked binaries start faster because there is less to map and link. This is why the same script feels snappy on your laptop and sluggish as the first job in a fresh CI container.
- Don’t trade safety for a fork. It is tempting to use
evalor drop quotes to “avoid a subshell.” Don’t. A micro-optimization that reintroduces word-splitting, globbing, or command injection is a bad trade at any speed — correctness and safety outrank a millisecond. The security consequences of that shortcut are the subject of the next lesson (L25).
8. Quick reference card
The “is this slow?” checklist
time ./script.sh                          # baseline
PS4='+ $(date "+%s.%N")\011' bash -x \
  ./script.sh 2>/tmp/trace.log            # per-line timing
sudo perf stat ./script.sh                # forks count
strace -p $PID -tt -f                     # if it's stuck
The “always do this” rules
[[ ]]over[ ]in bash scripts.$(< file)instead of$(cat file).${var^^}instead oftr a-z A-Z.${path##*/}instead ofbasename "$path".$(( ))instead ofexprorlet.{1..10000}instead of$(seq 1 10000).read -rainstead ofcut-in-loop.- awk instead of
cmd | sed | grep | headchains.
The “rewrite in another language” thresholds
| Symptom | Action |
|---|---|
| Reads ≥100k lines per run | Move to awk |
| Has associative arrays nested ≥2 levels | Move to python |
| Does ≥10 HTTP calls per run | Move to python or go |
| Called >10/s in production | Move to go (compiled) |
| Has float math | Move to awk, python, perl |
The fork cost rule of thumb
1 fork = ~1ms
1000 forks = 1 second
100k forks = 100 seconds (visible)
1M forks = 17 minutes (production-killing)
The three cost tiers (memorize this)
Tier 0  in-process   builtin / param-expansion   ~microseconds   [[ ]] $(( )) ${x##*/} read printf -v
Tier 1  fork only    $( )  ( )  subshell          ~0.3–0.4ms      $(<file)  (cd x && ...)  $(fn)
Tier 2  fork + exec  any external command         ~1–2ms          grep cut sed awk cat basename expr
The “where do I look for forks?” pattern
Anything inside a tight loop:
$( ... )            # subshell + maybe exec
| anything | ...    # each pipe is a fork
[ ... ]             # was external, now builtin (in bash)
echo "$x" | cmd     # cat, echo, tr, sed in pipes — all forks
Practice challenges
Work these in order — they escalate from “predict a number” to “make the leave-shell decision with evidence.” Try each before opening the solution. Everything is written for Linux + bash 4/5; where the build host (bash 3.2 / BSD) differs, the solution says so. Absolute timings you get will differ from the representative ones here — the ratios are the lesson.
Challenge 1 — Predict, then measure, a fork-in-loop (beginner)
Before running anything, predict which is faster and by roughly how much: extracting the filename from 5,000 paths with basename versus with parameter expansion. Then measure both.
<details> <summary>Solution</summary>
p=/var/log/app/service.log
time bash -c 'for i in $(seq 1 5000); do b=$(basename "'"$p"'"); done'   # Tier 2: fork+exec basename per iter → seconds
time bash -c 'for i in $(seq 1 5000); do b="${'"p"'##*/}"; done'          # Tier 0: pure builtin → ~hundredths of a second
Why: basename is an external — fork()+execve() every iteration (~1–2 ms each ≈ several seconds for 5,000). ${p##*/} is parameter expansion, done in-process, so it’s ~100–1000× faster. The prediction is the skill: external-in-loop = seconds, builtin = negligible.
</details>
Challenge 2 — Kill the useless cat (beginner)
This works but forks a process for nothing. Rewrite it two ways with no cat, and say which you’d commit.
cat access.log | grep ' 500 '
<details> <summary>Solution</summary>
grep ' 500 ' access.log      # best: grep reads the file itself
grep ' 500 ' < access.log    # also fork-free; use only if a redirect reads clearer
Why: grep opens files directly, so the cat is a pure “useless use of cat” — one wasted fork()+exec(). It won’t fix a hot path by itself, but it’s the tell-tale sign the author hasn’t counted forks. Commit the first form.
</details>
Challenge 3 — Refactor echo | cut out of a loop (intermediate)
This reads a user,email,plan CSV and forks cut twice per line. Rewrite the loop so it forks zero external commands per line, then measure the two on a 20,000-line file.
while IFS= read -r line; do
  user=$(echo "$line" | cut -d, -f1)
  plan=$(echo "$line" | cut -d, -f3)
  printf '%s -> %s\n' "$user" "$plan"
done < users.csv
<details> <summary>Solution</summary>
while IFS=, read -r user _ plan; do
  printf '%s -> %s\n' "$user" "$plan"
done < users.csv
Measure: time ./old.sh vs time ./new.sh. On a 20k-line file the echo|cut version took ~40 s here; the read-split version ~0.15 s.
Why: IFS=, read -r user _ plan splits the line on commas inside the shell (Tier 0) — the _ discards the middle field. That removes 2 forks per line = 40,000 forks for 20k lines, which was the entire cost. ~250× here (bigger than the “100×” rule of thumb because macOS forks are slow — the ratio is host-dependent, the direction is not).
</details>
Challenge 4 — Profile to find the slow line (intermediate)
You’re told a script is slow but not where. Instrument it with a timestamped xtrace, run it, and identify the most expensive line — without editing the script’s logic. Bonus: make your profiler not perturb the measurement.
<details> <summary>Solution</summary>
# bash 5+: fork-free timestamps, minimal perturbation
PS4='+ $EPOCHREALTIME\011'
exec 3>>/tmp/trace.log
BASH_XTRACEFD=3
set -x
# ... run the script body ...
set +x

# Analyse: biggest gaps between consecutive timestamps = slowest lines
awk 'NR>1{printf "%.4f\t%s\n", $2-prev, line} {prev=$2; line=$0}' /tmp/trace.log \
  | sort -rn | head
Why: PS4 with a timestamp turns set -x into a per-line profiler; BASH_XTRACEFD=3 keeps the trace off stdout/stderr. The critical bonus: $EPOCHREALTIME (bash 5+) is a builtin variable, so it adds no fork per traced line — unlike $(date ...), which forks on every line and skews exactly the fork-heavy scripts you’re profiling. On bash 4 there’s no fork-free option, so trace a representative subset.
</details>
Challenge 5 — Fix the counter that stays zero (advanced)
This is meant to count matching lines but always prints 0. Explain why in one sentence, then fix it two different ways — one that works on any bash, one that’s bash-4.2+.
count=0
grep -c '' /dev/null >/dev/null    # (ignore) just to anchor the example
printf 'a\nERROR b\nc\nERROR d\n' | while IFS= read -r l; do
  [[ $l == *ERROR* ]] && (( count++ ))
done
echo "$count"      # prints 0
<details> <summary>Solution</summary>
# Fix A — process substitution (any bash): loop runs in the CURRENT shell
count=0
while IFS= read -r l; do
  [[ $l == *ERROR* ]] && (( count++ ))
done < <(printf 'a\nERROR b\nc\nERROR d\n')
echo "$count"      # 2

# Fix B — lastpipe (bash 4.2+, non-interactive): last pipe stage runs in current shell
shopt -s lastpipe
count=0
printf 'a\nERROR b\nc\nERROR d\n' | while IFS= read -r l; do
  [[ $l == *ERROR* ]] && (( count++ ))
done
echo "$count"      # 2
Why: the right side of a pipe runs in a subshell, so count++ mutates a child that then exits and takes the value with it. Process substitution keeps the loop in your shell; lastpipe moves the last stage into your shell. (And in real life you’d just write count=$(grep -c ERROR file) — no loop, no subshell.)
</details>
Challenge 6 — Make the leave-shell call with evidence (advanced)
You inherit a job that runs every 5 minutes: it reads a growing CSV (now ~2M lines), counts distinct values in column 4, and computes their mean length. It currently uses a pure-shell while read loop and takes ~90 s, occasionally overrunning its window. Decide whether to (a) tune the shell loop or (b) leave the shell, justify with the threshold table, and implement the winner. Measure.
<details> <summary>Solution</summary>
# Leave the shell. Thresholds hit: >100k lines per run, per-line logic, AND float math (mean).
# One awk process: single pass, hash table for distinctness, running sum for the mean.
awk -F, '
  { if (!($4 in seen)) { seen[$4]=1; ndistinct++ }
    total_len += length($4); n++ }
  END {
    printf "distinct=%d  mean_len=%.2f  rows=%d\n", ndistinct, total_len/n, n
  }
' data.csv
# time: ~1–2 s on 2M lines vs ~90 s for the shell loop.
Why: the threshold table says reads ≥100k lines, per-line logic, and float math each independently argue for leaving shell — this job trips all three. Tuning the shell loop (removing per-line forks) might get it from 90 s to a few seconds, but awk does it in one pass with native hash tables and floating-point, is shorter, and leaves comfortable headroom in the 5-minute window. For a scheduled, growing, compute job, cross the threshold rather than tune toward a ceiling. (If throughput ever outgrows awk, the same logic in Go compiles to a sub-second single binary.) </details>
Common beginner mistakes
-
“My loop is slow, so I need a faster loop construct.” The loop syntax (
forvswhilevs C-style) is almost never the cost. The cost is what the loop body forks every iteration. Fix the fork count, not the loop keyword. Right model: runtime ≈ (forks per iteration × ~1 ms) × iterations. -
“Fixing useless
catwill make my script fast.” Removingcat file | grepsaves one fork total — it’s a code-smell fix, not a hot-path fix. The real win is the external you fork per line inside the loop. Fix the loop first; tidy thecatbecause it’s cleaner, not because it’s faster. -
“
$(<file)and$(cat file)are basically the same.” Both pay a Tier-1 subshell for the command substitution, but$(cat)adds a Tier-2execof/bin/caton top.$(<file)is measurably cheaper (~4–5× here) — and neither is truly “free,” because the$()itself forks. Right model: there are two price tiers, and$(<file)skips the more expensive one. -
“
awk/pythonis always faster, so use it for everything.” For a handful of lines, the startup of a fresh process dominates — a 3-lineawkon 5 rows is slower than a bash builtin loop. The external wins only when it replaces many forks or does a big single-pass computation. Right model: match the tool to the scale your profiler measured. -
“
systime doesn’t matter; I only look atreal/user.”sysis CPU time spent in the kernel — andfork()/execve()live there. Highsysrelative touseris the single clearest signal that fork/exec is your bottleneck. Read all three numbers. -
“I’ll profile by adding
echostatements.”echo-debugging tells you the path taken, not the time spent, and eyeballing is unreliable. Usetimefor the baseline and aPS4-timestampedset -xfor per-line cost — and remember the observer effect:$(date)inPS4forks on every line, so use$EPOCHREALTIMEon bash 5+. -
“
${var^^}andmapfileare just bash — they’ll run anywhere.” They’re bash 4.0+. On a stock macOS/bin/bash(3.2),dash, or BusyBox they fail outright (bad substitution,command not found). If your script must be portable, guard them ((( BASH_VERSINFO[0] >= 4 ))) and provide a fallback — the fallback usually forks, which is a deliberate speed-for-portability trade. -
“I’ll drop the quotes / use
evalto avoid a subshell.” Shaving a fork by reintroducing word-splitting, globbing, orevaltrades a millisecond for a correctness and security bug. Never optimize past safety — that’s the subject of the next lesson.
Glossary
- fork() — the syscall that creates a new process as a copy of the caller (the shell). Cheap thanks to copy-on-write, but not free: page-table setup, TLB flush, bookkeeping. Every external command and every subshell begins with a fork.
- exec() / execve() — the syscall that replaces a process’s memory image with a new program (e.g.
/usr/bin/cut). A fork makes a copy of the shell; the exec turns it into the target command. Together, “fork+exec” is the full cost of running one external. - fork+exec (“Tier 2”) — the ~1–2 ms cost of launching any external command: fork + execve + PATH search + dynamic linking. The dominant cost in slow shell scripts.
- builtin (“Tier 0”) — a command implemented inside the shell (
[[ ]],read,printf,cd,test). Runs in-process with no fork — microseconds.type cmdtells you ifcmdis a builtin. - subshell (“Tier 1”) — a child shell created by
( ... )or$( ... ). Forks (a copy of the shell) but does not exec a new binary, so ~0.3–0.4 ms — cheaper than an external, still paid per iteration. Variables set inside it don’t survive. - command substitution —
$(cmd)(or backticks): runcmdin a subshell and capture its stdout. Always forks;$(<file)is the special fork-only form that reads a file withoutexec-ingcat. - process substitution —
<(cmd)/>(cmd): exposes a command’s I/O as a filename, sowhile ... done < <(cmd)keeps the loop in the current shell (fixing the vanishing-counter bug). - copy-on-write (CoW) — the kernel trick that lets
fork()share memory pages between parent and child until one writes, avoiding a physical copy. Why forks are “cheap” but not zero-cost. - parameter expansion — in-shell string operations like
${path##*/}(basename),${path%/*}(dirname),${var^^}(uppercase, bash 4+),${var/old/new}. Tier-0 replacements forbasename,dirname,tr,sed. - brace expansion —
{1..10000}: bash generates the list in memory with no fork (unlike$(seq ...)). Great for small ranges; C-stylefor (( ))is leaner for huge ones. - here-string —
cmd <<< "$var": feeds a string to a command’s stdin withoutecho-ing through a pipe. - PATH search / stat-storm — for a bare command name, the shell
stat()s each$PATHdirectory until it finds the binary. A long$PATHon slow storage adds measurable latency per external; bash’s command hash and absolute paths avoid it. time(keyword vs/usr/bin/time) — the shell keyword printsreal/user/sysfor a command or pipeline; GNU/usr/bin/time -vadds max memory, page faults, and context switches.real= wall clock,user= user-space CPU,sys= kernel CPU (where fork lives).- xtrace /
set -x— bash’s execution trace: prints each command as it runs, prefixed byPS4. TimestampedPS4turns it into a per-line profiler. PS4— the prompt string printed before each xtrace line.PS4='+ $EPOCHREALTIME\t'(bash 5+) adds fork-free timestamps;$(date)inPS4forks per line and skews the measurement.BASH_XTRACEFD— the file descriptor xtrace writes to. Set it (e.g.=3) to send the trace to a log instead of stderr, keeping it out of your script’s real output.$EPOCHREALTIME/$EPOCHSECONDS— bash 5.0+ builtin variables holding the current time (with/without sub-second precision) without forkingdate. The right clock for tight loops and profilers.perf stat— Linux performance tool; itsforks/task-clock/context-switchescounters confirm at a glance whether fork/exec dominates.strace— traces the syscalls a process makes.-tt -fgives a timeline (find where a stuck script blocks);-cgives a per-syscall summary (confirm a fork or stat storm). Linux-only; macOS usesdtruss/dtrace.- UUOC (“useless use of cat”) —
cat file | cmdwherecmdcan read the file itself. One wasted fork; mostly a code smell, not a hot-path fix. lastpipe—shopt -s lastpipe(bash 4.2+, job control off): runs the last stage of a pipeline in the current shell, socmd | while read ...can mutate outer variables.- associative array —
declare -A map(bash 4+): a hash table keyed by string. Heavy use is a signal to consider awk/python, whose hash tables have no per-key process cost. - batching / amortization — handing many items to one process instead of one item to many:
find ... -exec cmd {} +, defaultxargs,grep -f patterns. The single principle behind most shell optimization. - warm process — a long-lived program (python/go service) that pays startup cost once and serves many requests, versus a shell script that forks fresh processes on every invocation. The fix for high-frequency, per-request workloads.
9. Wrap-up
Shell scripts are slow because every external command is a process. The fix is to:
- Measure first —
time, xtrace withPS4,perf stat. Don’t guess. - Reduce forks — replace externals with builtins where they exist (
[[ ]],$(< ),${var^^},$(( ))). - Eliminate per-iteration forks — move computation to awk, or pull invariants outside the loop.
- Know when to leave — if you’re doing computation-heavy work, especially nested data structures or per-request invocation, shell isn’t the right tool. awk for pure data; python for general; go for performance-critical.
The performance ceiling of a tuned shell script is roughly: ~1k operations/sec for fork-heavy code, ~100k operations/sec for builtin-only code. awk is ~1M operations/sec; go is ~10M+. Pick the level that matches your need.
Most importantly: the right tool is the one that solves the problem at the right speed without becoming a maintenance burden. A 100-line shell script that takes 30 seconds is fine if it runs nightly. The same script as a 1000-line shell mess that takes 2 seconds is worse than a 200-line python program that takes 1 second. Measure, optimize where it matters, rewrite when shell hits its ceiling.
Next: L25 — security. We’ll cover command injection, IFS attacks, quoting hardening, and input validation — the security side of “shell is just executing strings,” and exactly why the “drop the quotes to save a fork” shortcut from Going deeper is a trap.