Most “reliability” work I review is redundancy bought on instinct: dual regions for a workload that tolerates an hour of downtime, a single-zone database under a system promising four nines, a retry loop with no backoff that turns a blip into a self-inflicted outage. Both major frameworks — the Azure Well-Architected Framework (WAF) and the AWS Well-Architected Framework (WA) reliability pillars — teach the same discipline: reliability is a number-driven design activity, not a shopping list of “highly available” services. You reverse the instinct and let the numbers drive the design.
This article is the end-to-end process I use. Take a business SLA down to an SLO and an error budget; write down every failure mode and its blast radius; do the availability math so the “we’ll just promise four nines” conversation dies on contact with 0.999^5; choose redundancy per tier (availability set → zone → region, active-active vs active-passive) where the math and the failure analysis agree; pick a DR strategy (backup-restore, pilot light, warm standby, active-active) against a real RTO/RPO; and build self-healing — probes, autoscale, retry/circuit-breaker/backoff/timeout, bulkheads — that closes the loop without paging a human for failures you already understand. Then validate it with chaos engineering, because a failover you have never exercised is a hypothesis, not a control.
By the end you can sit in a design review, name the reliability tier each component needs from first principles, defend it against the cost and performance tradeoffs, and produce a reliability review checklist an auditor can sign. The Azure and AWS vocabularies differ — availability zone/zone-redundant vs Availability Zone/Multi-AZ — but the mechanics are identical, and I map the concrete controls on both clouds throughout.
What problem this solves
The pain is specific and recurring. A team ships a system, calls it “highly available” because every service has an “HA” checkbox they ticked, then discovers during the first real incident that the availability they bought and the availability they need were never connected by any calculation. Symptoms: a four-nines SLA on a single-zone database (a breach waiting to happen); a multi-region deployment at 2.1× the bill protecting a batch report nobody would miss for a day; a retry with no jitter that synchronizes every client into a thundering herd the instant a downstream recovers; a failover runbook nobody has ever run, so when you need it the DNS TTL is 3600 seconds and the standby is four hours behind.
What breaks is rarely the happy path — it is the combination of a partial failure and an untested recovery: a zone browning out (slow, not down) while your health model only checks hard-down; a database “alive but sick” that automatic failover ignores; a dependency returning 503 under load that a client retries three times with no circuit breaker, tripling the load on the failing component.
Who hits this: everyone running production with a customer-facing SLA, hardest on teams that (a) inherited an “HA” architecture nobody costed against an RTO/RPO, (b) run stateful tiers where the reliability engineering lives, and © have never run a game day, so recovery is documentation, not muscle memory. The reliability pillar is the antidote: a repeatable method to decide how much reliability each journey needs, buy exactly that, and prove it works.
To frame the whole field, here is the reliability pillar’s design surface — the decisions you make, on both clouds, and where this article covers each:
| Decision area | The question it forces | Azure control (WAF) | AWS control (WA) | Where covered here |
|---|---|---|---|---|
| Targets | How reliable does this journey need to be? | SLO + error budget per critical flow | SLO + error budget per workload | SLA→SLO→budget |
| Failure analysis | How does each component fail and how bad is it? | Failure Mode Analysis (FMA) | Failure Mode & Effects Analysis (FMEA) | FMEA section |
| Availability math | What ceiling do my dependencies impose? | Composite availability of series/parallel | Same math | Availability math |
| Redundancy | Set, zone, or region — and active-active or passive? | Availability zones, paired regions | Multi-AZ, Multi-Region | Redundancy section |
| Disaster recovery | What RTO/RPO, and which DR strategy? | ASR, geo-replication, failover groups | Backup/Pilot Light/Warm Standby/Active-Active | DR strategies |
| Resiliency in code | How do calls survive partial failure? | Retry, circuit breaker, timeout, bulkhead | Same patterns | Resiliency patterns |
| Health & detection | How do I know a replica is sick? | Health model + golden signals | Health checks + CloudWatch | Health modeling |
| Self-healing | What recovers without a human? | Probes, autoscale, auto-restart | ASG, ECS/EKS health, Auto Scaling | Self-healing |
| Validation | Have I actually proven the failover? | Azure Chaos Studio | AWS FIS | Chaos engineering |
| Tradeoffs | What am I paying in cost and latency? | Reliability vs Cost/Perf pillars | Same pillar tension | Tradeoffs section |
Learning objectives
By the end of this article you can:
- Translate a business SLA into an internal SLO, compute the error budget, and use burn rate to govern release risk.
- Do availability math correctly — multiply series (hard) dependencies, combine parallel (redundant) ones, and reason in
nines— then run a Failure Mode & Effects Analysis, score it with an RPN, and turn the sorted list into an owned remediation backlog. - Choose redundancy per tier (availability set vs zone vs region, active-active vs active-passive) from the math and FMEA, and defend it against cost and latency.
- Pick a DR strategy (backup-and-restore, pilot light, warm standby, active-active) against a specific RTO/RPO, knowing each one’s tradeoff.
- Implement retry+backoff+jitter, circuit breaker, timeout, and bulkhead correctly, and explain how each fails when misused.
- Build a health model on the four golden signals, wire a multi-window burn-rate alert, and design self-healing that is safe under load.
- Validate the design with chaos engineering (Azure Chaos Studio / AWS FIS), score it, and review against a checklist — on both clouds.
Prerequisites & where this fits
You should understand cloud fundamentals: what a region and an availability zone are, the split of IaaS vs PaaS reliability responsibilities, and that managed data services replicate synchronously (zero data loss, latency cost, distance-bound) or asynchronously (non-zero RPO, survives distance). Be comfortable reading az/aws CLI and either Terraform or Bicep, and know basic HTTP/TCP failure semantics (timeouts, resets, 5xx).
This sits at the center of the Well-Architected content. The tactical patterns live in Resiliency Patterns That Actually Work: Retry, Circuit Breaker, and Bulkhead; the RTO/RPO framing in High Availability vs Disaster Recovery: RTO and RPO Explained; the validation discipline as a program in Building a Chaos Engineering Program. Reliability trades against Performance Efficiency and depends on Operational Excellence for the runbooks and game days that make recovery real. The Azure control catalog is Azure Well-Architected: Reliability.
Who owns which reliability decision, so you pull the right person into the review:
| Layer | Reliability concern | Typically owned by | Failure it prevents |
|---|---|---|---|
| Business / product | SLA commitment, journey priority | Product + engineering leadership | Over- or under-investing in reliability |
| Platform / SRE | SLO, error budget, burn-rate policy | SRE / platform team | Releasing blind into a budget breach |
| Application | Retry/breaker/timeout, idempotency | App / dev team | Retry storms, cascading failure, dupes |
| Data | Replication mode, backup, RPO | DBA / data platform | Data loss, split-brain, corrupt restore |
| Infrastructure | Zone/region redundancy, DR runbook | Cloud / infra team | Zone or region loss taking the app down |
| Network | DNS failover, TTL, health probes | Network team | Slow failover from stale DNS |
Core concepts
Six mental models make every later decision obvious. Both Azure WAF and AWS WA are built on these; only the product names differ.
Reliability is measured, not asserted. The unit of reliability is a service-level objective (SLO) on a critical user journey, not a checkbox on a service. You measure a service-level indicator (SLI) — success rate, latency percentile — against the SLO; the gap between the SLO and 100% is the error budget, your permission to fail. Everything downstream is mechanism to defend a target you have made explicit.
Failure is a distribution, not a switch. Components rarely fail cleanly. They brown out — get slow, drop a fraction of requests, or return errors under load while looking “healthy” to a coarse probe. A design that only handles hard-down is half a design. The Failure Mode & Effects Analysis (FMEA) — Azure calls it Failure Mode Analysis (FMA) — enumerates how each component degrades, not just whether it is up.
Availability composes by topology. Dependencies in series (every one required — a hard dependency) multiply their availabilities, so the whole is always less available than the weakest link. Dependencies in parallel (redundant copies) combine so the whole is more available than one copy. This arithmetic decides where redundancy helps and where it is wasted.
Redundancy has tiers with real cost steps. Cheapest to dearest: availability set / fault-and-update domains (anti-affinity within one datacenter), availability zones (isolated datacenters within a region — the modern default), multi-region (survives a whole region; forces you to confront replication lag and split-brain). Buy the smallest tier the SLO and RTO/RPO justify.
Recovery time and data loss are the two DR dials. RTO is how long you can be down; RPO is how much data you can lose. Every DR strategy — backup-and-restore, pilot light, warm standby, active-active — is a point on the cost-vs-RTO/RPO curve. You cannot have zero RPO and survive a region loss on one replica: synchronous replication is distance-bound; asynchronous loses the in-flight tail.
Self-healing needs a governor. Automated recovery is powerful and dangerous. Retry without backoff + jitter is a thundering herd; auto-restart without a circuit breaker turns a dependency outage into a self-inflicted DDoS; no bulkhead lets one poisoned dependency exhaust a shared pool and take everything down. Healing logic and the resiliency patterns are two halves of one control loop.
The vocabulary in one table
Pin every moving part before the deep sections — the glossary repeats these for lookup; this is the mental model side by side:
| Concept | One-line definition | Azure term | AWS term | Why it matters |
|---|---|---|---|---|
| SLA | Contractual promise with penalties | Service SLA | Service SLA | The floor you must not breach |
| SLO | Internal target, tighter than SLA | SLO | SLO | Where you actually design to |
| SLI | Measured indicator vs the SLO | SLI | SLI | Tells you if you’re meeting it |
| Error budget | 1 − SLO; allowed unreliability | Error budget | Error budget | Governs release risk |
| Availability zone | Isolated DC within a region | Availability Zone | Availability Zone (AZ) | Zone-redundant survives a DC loss |
| Region pair | Linked region for DR | Azure paired region | Region (any) | Survives a full region loss |
| Hard dependency | Journey fails without it | Critical dependency | Hard dependency | Series math applies |
| Soft dependency | Journey degrades gracefully | Non-critical dependency | Soft dependency | Can be shed under stress |
| RTO | Max tolerable downtime | RTO | RTO | Drives DR strategy |
| RPO | Max tolerable data loss | RPO | RPO | Drives replication mode |
| Active-active | All regions serve traffic | Active-active | Active-active | Lowest RTO, highest cost/complexity |
| Active-passive | Standby takes over on failure | Active-passive | Warm standby / pilot light | Cheaper, higher RTO |
| Circuit breaker | Stops calling a failing dependency | Retry/breaker policies | Same pattern | Prevents cascading failure |
| Bulkhead | Isolates resource pools | Bulkhead / partitioning | Bulkhead / cell | Contains blast radius |
| Self-healing | Recovers without a human | Probes, autoscale, auto-restart | ASG, ECS health, Auto Scaling | Handles known failures automatically |
| Chaos engineering | Injecting faults to validate | Azure Chaos Studio | AWS FIS | Proves the design, not asserts it |
The design principles of both frameworks
Both frameworks lead with design principles that rhyme almost exactly: define reliability targets (SLOs), recover automatically, test recovery (chaos, DR drills), scale horizontally, stop guessing capacity, manage change safely, observe and respond, and keep it simple. AWS groups its controls into four areas — Foundations (limits/quotas, topology), Workload Architecture (fault isolation), Change Management (deploy/monitor/scale), and Failure Management (backup, FMEA, DR, chaos) — while Azure WAF uses checklist codes (RE:01–RE:10). The concepts here map onto both; I note the code where it helps.
From SLA to SLO to error budget: the numbers that drive design
Three terms get used interchangeably and they are not the same thing. Get them straight and half of reliability planning becomes arithmetic.
- SLA — the contractual promise with financial penalties (credits). Deliberately conservative; a provider’s 99.99% compute SLA is a ceiling on their liability, not a prediction.
- SLO — your internal target, tighter than the SLA so you have margin before breaching contract. If the SLA is 99.9%, run an SLO of 99.95% so a bad week doesn’t immediately cost credits.
- SLI — the measured indicator (success ratio, p99 latency) compared against the SLO. No SLI, no SLO — a target you cannot measure is a wish.
The error budget is the inverse of the SLO and it is the single most useful number you will produce. If your availability SLO is 99.9% over 30 days, the allowed downtime is the budget:
| SLO | Downtime / 30 days | Downtime / 90 days | Downtime / year |
|---|---|---|---|
| 99% | ~7h 18m | ~21h 54m | ~3d 15h |
| 99.5% | ~3h 39m | ~10h 57m | ~1d 19.8h |
| 99.9% | ~43m 49s | ~2h 11m | ~8h 45m |
| 99.95% | ~21m 54s | ~1h 5m | ~4h 22m |
| 99.99% | ~4m 23s | ~13m 8s | ~52m 35s |
| 99.999% | ~26s | ~1m 18s | ~5m 15s |
The budget is a permission slip, not just a threshold. If you have spent only 10% of it this month, you ship faster and take more risk — the SLO explicitly allows it. If you have burned 90% by day ten, you freeze risky changes and the on-call gets to push back on the next feature flag. That cultural contract — the error budget as a shared currency between “move fast” and “keep it up” — is the actual point of the reliability pillar; everything below is mechanism.
Pick the SLO per critical journey, not per service. A 99.99% target on a background report exporter is wasted money; a 99.95% target on checkout is table stakes. Be honest about what the business will actually pay to protect, and write it down. The SLI types you will use most are availability (1 − 5xx/total, for request-driven APIs), latency (fraction faster than a threshold, for user-perceived speed), freshness (fraction of data younger than N, for pipelines/replicas), and correctness/coverage (fraction of outputs valid or records processed, for batch/ETL/billing).
Availability math: nines, series, and parallel
You cannot set a credible SLO without the arithmetic that tells you what your topology can even deliver. Two rules cover most of it.
Series (hard dependencies) multiply. If a journey needs A and B and C, each up with probability a, b, c, availability is a × b × c. Every factor is < 1, so the product is always below the smallest factor — the calculation that kills the “we’ll just promise four nines” conversation:
| Hard dependencies in series (each) | 3 components | 5 components | 8 components |
|---|---|---|---|
| 99.9% each | 99.70% | 99.50% | 99.20% |
| 99.95% each | 99.85% | 99.75% | 99.60% |
| 99.99% each | 99.97% | 99.95% | 99.92% |
| 99.999% each | 99.997% | 99.995% | 99.992% |
Read the middle column: five hard dependencies each at 99.9% ceiling the journey at ~99.5% — below a 99.9% SLO before you write a line of code. Your only levers: reduce hard dependencies, make some redundant (parallel), or convert hard to soft with caching and queues.
Parallel (redundant copies) combine as the complement of the product of failures. Two independent copies each up with probability p give 1 − (1−p)². Redundancy attacks the failure probability, and squaring a small number makes it tiny:
| Single copy availability | 2 copies (redundant) | 3 copies (redundant) |
|---|---|---|
| 99% | 99.99% | 99.9999% |
| 99.9% | 99.9999% | ~99.9999999% |
| 99.95% | 99.999975% | — |
The catch is the word independent. Two web servers in the same zone are not independent for a zone failure — the zone is a shared fate — which is why redundancy has to move up the tiers (host → rack → zone → region) to break correlation. The common trap: multiplying two “redundant” copies that share a single point of failure (same zone, power, or database) and claiming a parallel benefit you never bought. Two more numbers to reason without a calculator:
| Rule of thumb | Value | Use for |
|---|---|---|
| One “nine” ≈ | ~10× less downtime | Every extra nine costs roughly an order of magnitude |
| 99.9% monthly budget | ~43 minutes | The most common SLO; ~1.5 min/day |
| 99.99% monthly budget | ~4.4 minutes | A single failed deploy can blow the month |
| Two independent 99% copies | 99.99% | Redundancy buys two nines from one |
| Cost of the last nine | often 2–4× infra | The tradeoff that justifies “how much” |
Failure Mode & Effects Analysis (FMEA / FMA)
Failure Mode & Effects Analysis is a structured table, and the most useful hour you will spend on reliability. For every component, enumerate how it fails, the effect, how you detect it, and a Risk Priority Number (RPN = Severity × Likelihood × Detectability, each 1–10, higher worse). Sort by RPN and you have a prioritized, owned work list instead of a gut feeling. Azure WAF calls this Failure Mode Analysis (RE:03); AWS puts it in Failure Management. The scoring rubric — make it explicit so two engineers score a failure the same way:
| Score | Severity (impact if it happens) | Likelihood (how often) | Detectability (how hard to catch — higher = harder) |
|---|---|---|---|
| 1–2 | Cosmetic; no user impact | Rare (yearly+) | Instant, automated alert |
| 3–4 | Degraded, non-critical journey | Occasional (quarterly) | Alert within minutes |
| 5–6 | One critical journey partially down | Regular (monthly) | Detected in tens of minutes |
| 7–8 | Critical journey down for a region | Frequent (weekly) | Only via customer reports |
| 9–10 | Data loss / full outage | Constant / expected | Effectively silent until damage done |
A worked FMEA for a checkout journey — rows are examples, the method is the point:
| Component | Failure mode | Effect | Detection | S | L | D | RPN |
|---|---|---|---|---|---|---|---|
| SQL primary | Zone outage (clean) | Writes fail | Failover-group health probe | 9 | 3 | 2 | 54 |
| SQL primary | Storage brownout (slow, not down) | Write timeouts, “looks healthy” | Synthetic write-latency probe | 9 | 3 | 7 | 189 |
| Redis cache | Node eviction | Session loss, re-login | Cache-miss spike | 5 | 4 | 4 | 80 |
| checkout-api | Memory leak / OOM | Pod restarts, 5xx | Liveness probe + RPS drop | 7 | 5 | 3 | 105 |
| Payment provider | API timeout | Checkout stalls | Synthetic + error rate | 9 | 4 | 5 | 180 |
| Service Bus queue | Backlog (consumer down) | Orders delayed, not lost | Queue-depth alert | 4 | 4 | 3 | 48 |
| Front Door / ALB | Config push regression | Global 5xx | Synthetic from outside | 10 | 2 | 3 | 60 |
| DNS | TTL too long on failover | Slow region cutover | DR drill measurement | 8 | 2 | 6 | 96 |
The two highest rows — the SQL brownout (RPN 189) and the payment timeout (180) — are the ones a naive design misses, because both fail softly. That is what detectability captures: a slow storage tier looks healthy to a hard-down probe, so D is high, RPN is high, and it tops the backlog. The cheapest RPN to lower is almost always detectability — a synthetic check that fires in 30 seconds instead of waiting for customer reports drops D from 7 to 2 with near-zero cost, before you spend a rupee on redundancy. What each lever buys when you attack a row:
| Lever | Which RPN factor it lowers | Typical cost | Best when |
|---|---|---|---|
| Synthetic / active probe | Detectability | Very low | The failure is silent or slow |
| Redundancy (zone/region) | Likelihood (of outage) | High | The failure is a hard loss |
| Circuit breaker + timeout | Severity (contains blast radius) | Low (code) | A dependency can drag you down |
| Graceful degradation (soft dep) | Severity | Medium (design) | The feature is non-critical |
| Faster runbook / automation | Reduces time-to-recover (not RPN directly) | Medium | The failure needs a human decision |
| Bulkhead / cell isolation | Severity (blast radius) | Medium–high | One tenant/dep can starve the rest |
Choosing redundancy per tier
Now spend money where the math and the FMEA agree, and only there. Both clouds give three escalating levels, each a real cost and complexity step. Match the tier to the component’s data gravity — stateless front ends go zone-redundant trivially; stateful tiers are where the engineering lives.
- Availability sets / fault-and-update domains — anti-affinity across racks and host-maintenance groups within one datacenter. Protects against a rack failure or a host being patched; the floor for any VM tier, useless against a zone loss.
- Availability zones — physically separate datacenters within a region (independent power, cooling, network). The default I reach for: most managed PaaS enables it with a flag, and sub-2ms intra-region latency keeps synchronous replication feasible.
- Multi-region — survives a full regional loss and forces you to confront replication lag and split-brain. Expensive and operationally heavier; justified only when the SLO and a real RTO/RPO demand it.
The tiers side by side — what each protects against and costs:
| Tier | Protects against | Latency impact | Cost step | Azure mechanism | AWS mechanism |
|---|---|---|---|---|---|
| Single instance | Nothing | None | 1× | One VM / one instance | One instance |
| Availability set / FD-UD | Rack, host patch | None | ~1× | Availability Set (FD/UD) | Placement + spread |
| Availability zones | Datacenter (zone) loss | Sub-ms to ~2ms | ~1.5–2× (N copies) | Zone-redundant / zones [1,2,3] |
Multi-AZ |
| Paired / second region (passive) | Region loss | Async lag (RPO) | ~1.3–1.6× | Geo-replication, ASR | Cross-Region replication |
| Multi-region active-active | Region loss, zero-RTO | Global routing + conflict cost | ~2–2.5× | Front Door + Cosmos multi-write | Global Accelerator + DynamoDB global tables |
Active-active vs active-passive
Within multi-region, the biggest fork is whether the second region serves traffic (active-active) or waits (active-passive) — the decision that most drives cost, complexity, and RTO:
| Dimension | Active-passive (warm standby / pilot light) | Active-active |
|---|---|---|
| Second region serves traffic | No (until failover) | Yes, always |
| RTO | Minutes (warm) to hours (pilot light) | Near-zero (already serving) |
| RPO | Async replication lag | Async or multi-write |
| Cost | Lower — standby is smaller/idle | ~2× — full capacity both sides |
| Data model complexity | Simpler — one writer | Hard — conflict resolution / multi-write |
| Split-brain risk | Low (single writer) | High if not designed carefully |
| Best for | Most workloads with an RTO of minutes | Ultra-low RTO, global latency needs |
| Trap | Untested failover; DNS TTL too long | Write conflicts; “active-active” with a single shared DB (not really A-A) |
A zone-redundant compute tier on Azure (AKS system pool across all three zones):
# Zone-redundant AKS system node pool across 3 zones
resource "azurerm_kubernetes_cluster" "this" {
  name                = "aks-checkout-prod"
  location            = "eastus2"
  resource_group_name = azurerm_resource_group.this.name
  dns_prefix          = "checkout"

  default_node_pool {
    name                 = "system"
    vm_size              = "Standard_D4s_v5"
    zones                = [1, 2, 3]        # spread nodes across all AZs
    auto_scaling_enabled = true
    min_count            = 3                 # at least one node per zone
    max_count            = 9
  }

  identity {
    type = "SystemAssigned"
  }
}
The AWS equivalent — an Auto Scaling group across three AZs (the Multi-AZ default for stateless compute):
# Multi-AZ Auto Scaling group — spread instances across 3 AZs
resource "aws_autoscaling_group" "checkout" {
  name                = "checkout-asg"
  min_size            = 3
  max_size            = 9
  desired_capacity    = 3
  vpc_zone_identifier = [aws_subnet.az_a.id, aws_subnet.az_b.id, aws_subnet.az_c.id]
  health_check_type   = "ELB"              # use the load balancer's health, not just EC2 status
  health_check_grace_period = 90

  launch_template {
    id      = aws_launch_template.checkout.id
    version = "$Latest"
  }
}
For the database tier, zone redundancy and cross-region failover are explicit choices with different RPO — Azure SQL zone-redundant with a geo failover group:
# Zone-redundant Azure SQL database (Business Critical stays synchronous in-region)
az sql db create \
  --resource-group rg-checkout-prod \
  --server sql-checkout-prod \
  --name orders \
  --edition BusinessCritical \
  --compute-model Provisioned \
  --family Gen5 --capacity 4 \
  --zone-redundant true

# Auto-failover group for cross-region DR (async geo-replication → non-zero RPO)
az sql failover-group create \
  --name fg-checkout \
  --resource-group rg-checkout-prod \
  --server sql-checkout-prod \
  --partner-server sql-checkout-dr \
  --failover-policy Automatic \
  --grace-period 1 \
  --add-db orders
The AWS equivalent — Multi-AZ RDS (synchronous, in-region) plus a cross-Region read replica for DR:
# Multi-AZ RDS: synchronous standby in a second AZ (automatic failover, zero data loss in-region)
aws rds create-db-instance \
  --db-instance-identifier orders-prod \
  --engine postgres \
  --multi-az \
  --db-instance-class db.r6g.xlarge \
  --allocated-storage 200

# Cross-Region read replica for regional DR (async → non-zero RPO on promotion)
aws rds create-db-instance-read-replica \
  --db-instance-identifier orders-dr \
  --source-db-instance-identifier arn:aws:rds:ap-south-1:111122223333:db:orders-prod \
  --region ap-southeast-1
The recurring truth on both clouds: synchronous replication (Multi-AZ / Business Critical zone-redundant) gives zero RPO but is distance-bound — it stays in-region. Cross-region replication is asynchronous, so an automatic failover can lose the last few seconds of committed transactions — a non-zero RPO. No zero RPO and region survival on one replica. Pick one per tier, and write the RPO number in the runbook.
The intra-region vs cross-region replication tradeoff, made concrete:
| Property | In-region synchronous (Multi-AZ / BC zone-redundant) | Cross-region asynchronous (geo-replica / read replica) |
|---|---|---|
| RPO | 0 (committed = replicated) | Seconds to minutes (lag-dependent) |
| Survives zone loss | Yes | Yes |
| Survives region loss | No | Yes |
| Write latency cost | Small (commit waits for standby) | None (async) |
| Distance limit | Within region (~same metro) | Any distance |
| Failover data loss | None | The in-flight tail |
| Typical use | HA for a zone event | DR for a region event |
Disaster recovery strategies
DR is where RTO and RPO stop being abstractions and start costing money. AWS names four canonical strategies on a cost-vs-recovery-time curve; Azure builds the same points from ASR, geo-replication, and failover groups. The vocabulary for choosing how much DR to buy:
| Strategy | RTO | RPO | Cost (vs primary) | What runs in DR at steady state | Best for |
|---|---|---|---|---|---|
| Backup & restore | Hours to a day | Hours (last backup) | Lowest (~storage only) | Nothing — restore from backups | Non-critical, cost-sensitive, tolerant workloads |
| Pilot light | Tens of minutes | Minutes (async data) | Low | Core data replicating; app off/minimal | Important workloads, RTO of ~30–60 min |
| Warm standby | Minutes | Minutes | Medium | Scaled-down full stack, always on | Business-critical, RTO of single-digit minutes |
| Active-active (hot / multi-site) | Near-zero | Near-zero to seconds | Highest (~2×) | Full stack serving traffic both sides | Mission-critical, global, zero-downtime |
The intuition: you pay to keep more of the system warm in exchange for a lower RTO. What determines each strategy’s RTO is which recovery steps you pre-pay: backup-restore does everything on failure (provision infra, restore data, start app, redirect traffic — slow); pilot light keeps data replicating and core infra built, so only app-start and traffic-redirect remain; warm standby keeps a scaled-down stack already running (only traffic-redirect and scale-up); active-active is already live and balanced (no recovery steps).
A concrete Azure DR control — the cross-region failover-group flip, and the forced variant that respects RPO by failing to the in-region synchronous secondary first:
# Planned failover to DR region (no data loss — waits for replication to catch up)
az sql failover-group set-primary \
  --name fg-checkout \
  --resource-group rg-checkout-prod \
  --server sql-checkout-dr

# Primary 'sick but alive': fail to the IN-REGION synchronous secondary (BC) —
# zero data loss, no cross-region RPO hit.
az sql db failover \
  --resource-group rg-checkout-prod \
  --server sql-checkout-prod \
  --name orders
The AWS equivalent — Route 53 DNS failover with a low TTL (the number that silently determines your regional RTO):
# Route 53 failover routing: a health check flips traffic to the DR region.
# Keep TTL LOW (e.g. 60s) or DNS caching becomes your real RTO.
aws route53 change-resource-record-sets \
  --hosted-zone-id Z123456ABCDEFG \
  --change-batch '{
    "Changes":[{"Action":"UPSERT","ResourceRecordSet":{
      "Name":"api.example.com","Type":"A","SetIdentifier":"primary",
      "Failover":"PRIMARY","TTL":60,
      "HealthCheckId":"hc-primary-region",
      "ResourceRecords":[{"Value":"203.0.113.10"}]}}]}'
The DNS TTL is the reliability control everyone forgets. A failover-group flip that completes in 90 seconds is worthless if clients cache the old IP for an hour because the record’s TTL is 3600. Set failover records to a low TTL (30–60s), or prefer an anycast front end (Front Door, Global Accelerator) whose health-probe failover doesn’t depend on client DNS caching at all.
Resiliency patterns: retry, backoff, timeout, circuit breaker, bulkhead
Redundancy handles infrastructure loss; resiliency patterns handle partial failure inside the call graph. These live in your code (or a sidecar/mesh) — where a distributed system either degrades gracefully or amplifies its own failure — and each pattern has a correct form and a dangerous misuse. (Tactical deep dive: Resiliency Patterns That Actually Work.) The five patterns, what they defend against, and how they fail when misused:
| Pattern | What it does | Defends against | Failure when misused |
|---|---|---|---|
| Timeout | Caps how long you wait for a response | A slow dependency hanging your threads | Too long → thread exhaustion; too short → false failures |
| Retry + backoff + jitter | Re-attempts transient failures, spaced out | Transient blips, brief resets | No jitter → synchronized thundering herd; retry on non-idempotent → duplicates |
| Circuit breaker | Stops calling a dependency that’s failing | Cascading failure, retry storms | No breaker → you DDoS a failing dependency; too sensitive → flapping |
| Bulkhead | Isolates resource pools per dependency | One bad dependency starving all threads | No bulkhead → one poisoned call pool takes down everything |
| Fallback / graceful degradation | Serves a degraded response instead of failing | Hard dependency being down | Fallback masks a real outage you should alert on |
Timeout first — it is the foundation. Every outbound call needs a timeout shorter than your own request SLO, set from the dependency’s measured p99. Without it, a slow downstream pins your worker threads and the slowness propagates upward until you are down for a reason that was never your fault.
Retry with exponential backoff and jitter, only on idempotent, retriable failures. No backoff hammers a struggling dependency; backoff without jitter synchronizes every client to retry the instant it recovers (a thundering herd); retrying a non-idempotent write without an idempotency key creates duplicates. The schedule that works:
| Attempt | Base delay (exp) | With full jitter (range) | Retry only if… |
|---|---|---|---|
| 1 | immediate | immediate | — |
| 2 | 200 ms | 0–200 ms | Retriable status (429, 503, timeout) |
| 3 | 400 ms | 0–400 ms | AND the call is idempotent |
| 4 | 800 ms | 0–800 ms | AND circuit is closed |
| 5 (cap) | 1600 ms | 0–1600 ms | AND you have retry budget left |
| stop | — | — | Give up → fail fast or fall back |
A .NET example wiring timeout + jittered retry + circuit breaker together (Polly — the standard on .NET):
// Polly v8 resilience pipeline: timeout -> retry (jittered) -> circuit breaker
var pipeline = new ResiliencePipelineBuilder<HttpResponseMessage>()
    .AddTimeout(TimeSpan.FromSeconds(2))                       // fail fast if the call hangs
    .AddRetry(new RetryStrategyOptions<HttpResponseMessage>
    {
        MaxRetryAttempts = 4,
        BackoffType      = DelayBackoffType.Exponential,
        UseJitter        = true,                                // spread retries → no thundering herd
        ShouldHandle     = new PredicateBuilder<HttpResponseMessage>()
            .HandleResult(r => (int)r.StatusCode is 429 or 503) // retriable only
            .Handle<HttpRequestException>()
    })
    .AddCircuitBreaker(new CircuitBreakerStrategyOptions<HttpResponseMessage>
    {
        FailureRatio     = 0.5,          // open if >50% of calls fail
        MinimumThroughput = 20,          // ...over at least 20 calls (avoid flapping)
        SamplingDuration = TimeSpan.FromSeconds(30),
        BreakDuration    = TimeSpan.FromSeconds(15)             // then half-open and probe
    })
    .Build();
Circuit breaker turns a retry storm into a fast failure. When a dependency crosses a failure threshold the breaker opens — calls fail immediately (or fall back) without touching it, giving it room to recover. After a cool-down it goes half-open, probes once, and closes on success. The three states:
| State | Behavior | Transition |
|---|---|---|
| Closed | Calls pass through; failures counted | → Open when failure ratio/threshold exceeded |
| Open | Calls fail fast / fall back immediately | → Half-open after break duration |
| Half-open | One trial call allowed | → Closed on success, → Open on failure |
Bulkhead isolates so one dependency cannot sink the ship. Give each downstream its own bounded thread/connection pool (a “bulkhead,” from a ship’s watertight compartments). If the payment provider hangs, only the payment bulkhead fills; the rest of the app keeps serving. Without it, all your threads pile up on the one slow dependency and the whole service goes down. At the architecture level this becomes cell-based isolation, covered in Cell-Based Architecture: Containing Blast Radius.
Retry, circuit breaker, and bulkhead are one system, not three settings. Retry without a breaker is a retry storm; a breaker without a bulkhead still lets a slow dependency exhaust threads before it opens; auto-restart without any of them turns a downstream outage into a self-inflicted DDoS. Design the outbound call policy as a unit.
Instrument health models and the four golden signals
Redundancy and self-healing are useless if you cannot tell when a replica is sick. Instrument the four golden signals for every tier (the SRE canon, the backbone of both frameworks’ monitoring): latency (split successful vs failed — a fast 500 looks great on a naive average), traffic (requests/sec, the denominator for every rate), errors (5xx and explicit failures, the numerator of your availability SLI), and saturation (how full the constrained resource is — CPU, memory, pool, queue depth — the leading indicator that predicts the other three).
Then build a health model: a layered rollup mapping raw signals to “is this journey healthy.” Resource health rolls into component health, which rolls into journey health — so an alert fires on journey degradation, not a single CPU spike that self-corrected. Azure WAF makes this explicit in RE:09; the layers:
| Layer | Signals it aggregates | “Unhealthy” means | Example |
|---|---|---|---|
| Resource | CPU, memory, disk, connection pool | This instance is degraded | A pod at 95% memory |
| Component | Golden signals across resources | This service is degraded | checkout-api error rate > 1% |
| Journey | Component health along the path | Users can’t complete the flow | Checkout success ratio < SLO |
| Business | Journey health + business KPI | Revenue/impact is affected | Orders/min dropped 40% |
The most important alert you will write is a multi-window burn-rate alert on the error budget, not a static threshold — it pages when you are consuming budget fast enough to exhaust it well before the window closes, and stays quiet on a brief blip. The recommended windows (Google SRE workbook, widely adopted on both clouds):
| Alert severity | Long window | Short window | Burn rate | Budget consumed to fire | Meaning |
|---|---|---|---|---|---|
| Page (fast) | 1 hour | 5 min | 14.4× | ~2% of 30-day budget in 1h | Something is badly broken now |
| Page (medium) | 6 hours | 30 min | 6× | ~5% in 6h | Sustained, serious burn |
| Ticket (slow) | 24 hours | 2 hours | 3× | ~10% in a day | A slow bleed to investigate |
| Ticket (very slow) | 72 hours | 6 hours | 1× | steady drain | Trending toward breach |
The SLO and a fast-burn alert as a Prometheus recording/alerting rule (portable across AKS and EKS):
groups:
- name: checkout-slo
  rules:
  # SLI: fraction of BAD requests over 5m and 1h windows
  - record: job:http_req_error_ratio:rate5m
    expr: |
      sum(rate(http_requests_total{job="checkout-api",code=~"5.."}[5m]))
        / sum(rate(http_requests_total{job="checkout-api"}[5m]))
  - record: job:http_req_error_ratio:rate1h
    expr: |
      sum(rate(http_requests_total{job="checkout-api",code=~"5.."}[1h]))
        / sum(rate(http_requests_total{job="checkout-api"}[1h]))
  # Fast burn: >14.4x budget consumption confirmed on BOTH windows.
  # For a 99.9% SLO the budget is 0.001; 14.4 * 0.001 = 0.0144.
  - alert: CheckoutErrorBudgetFastBurn
    expr: |
      job:http_req_error_ratio:rate5m > (14.4 * 0.001)
      and
      job:http_req_error_ratio:rate1h > (14.4 * 0.001)
    for: 2m
    labels: { severity: page }
    annotations:
      summary: "Checkout burning error budget at >14.4x; page on-call."
The two-window and kills false pages: the 1h window confirms the 5m spike is real before anyone is woken. The 14.4× factor consumes 2% of a 30-day budget in an hour — fast enough to demand a human, real enough not to be noise.
Build self-healing with probes, autoscale, and auto-restart
Self-healing means the platform recovers from common, well-understood failures — the FMEA rows whose remediation is automatable — without a human. Three mechanisms cover most of it, each with a sharp edge:
Health probes that actually gate traffic. On Kubernetes, separate readiness (should I get traffic?) from liveness (should I be killed and restarted?) and add a startup probe so liveness doesn’t kill a pod mid-boot. The dangerous mistake is pointing liveness at a deep check touching the database — a DB blip then restart-storms every pod at once, turning a partial failure into a total one. Keep liveness shallow and local; put dependency checks in readiness.
spec:
  containers:
  - name: checkout-api
    startupProbe:        # don't let liveness fire until the app has booted
      httpGet: { path: /healthz, port: 8080 }
      failureThreshold: 30
      periodSeconds: 5
    livenessProbe:       # SHALLOW: is the process wedged? restart if so
      httpGet: { path: /healthz, port: 8080 }
      periodSeconds: 10
      failureThreshold: 3
    readinessProbe:      # deep-ish: can I serve? pull from the LB if not
      httpGet: { path: /readyz, port: 8080 }
      periodSeconds: 5
      failureThreshold: 2
The probe types and the rule for each — get these wrong and self-healing becomes self-harm:
| Probe | Question | Depth | On failure | Common mistake |
|---|---|---|---|---|
| Startup | Has the app finished booting? | Same as liveness, long threshold | Keeps liveness from firing | Omitting it → liveness kills slow-booting pods |
| Liveness | Is the process wedged/deadlocked? | Shallow, local only | Kill + restart the pod | Making it deep (DB call) → restart storms |
| Readiness | Can this instance serve a real request? | Can check required deps | Remove from LB (no restart) | Hard-failing on optional deps → drains fleet |
Autoscale on the saturation signal that actually constrains you. CPU is the lazy default and often wrong. If the bottleneck is queue depth or in-flight requests, scale on that — via KEDA on Kubernetes or a target-tracking policy on an ASG. A Service Bus consumer scaled on queue length:
apiVersion: keda.sh/v1alpha1
kind: ScaledObject
metadata:
  name: checkout-worker
spec:
  scaleTargetRef:
    name: checkout-worker
  minReplicaCount: 2          # never scale to zero on a hot path
  maxReplicaCount: 30
  triggers:
  - type: azure-servicebus
    metadata:
      queueName: orders
      messageCount: "20"      # target ~20 messages in flight per replica
    authenticationRef:
      name: keda-sb-auth
The AWS target-tracking equivalent on an ASG (keep a custom saturation metric at target):
# Target-track a real saturation metric (e.g. backlog per instance), not just CPU
aws autoscaling put-scaling-policy \
  --auto-scaling-group-name checkout-asg \
  --policy-name track-backlog \
  --policy-type TargetTrackingScaling \
  --target-tracking-configuration '{
    "TargetValue": 20.0,
    "CustomizedMetricSpecification": {
      "MetricName": "BacklogPerInstance",
      "Namespace": "Checkout",
      "Statistic": "Average"
    }
  }'
Auto-restart and platform-level recovery. For PaaS, lean on the platform’s own health gate to stop routing to unhealthy instances and recycle them — Azure App Service health check, or an AWS ASG using ELB health to replace instances the load balancer marks unhealthy:
# Azure App Service: platform stops routing to & recycles instances failing this path
az webapp config set \
  --resource-group rg-checkout-prod \
  --name app-checkout-prod \
  --generic-configurations '{"healthCheckPath": "/healthz"}'
Always pair auto-restart with a backoff and a circuit breaker on outbound calls — self-healing without a breaker turns a dependency outage into a retry storm that takes the dependency down harder. And keep liveness shallow: the most common self-healing anti-pattern is a deep liveness probe that turns a five-second database blip into a cluster-wide restart storm outlasting the blip by ten minutes. Healing logic and the retry/backoff policy are two halves of one control loop.
The self-healing mechanisms across platforms:
| Failure | Self-healing mechanism | Azure | AWS | Guardrail it needs |
|---|---|---|---|---|
| Instance wedged | Restart | Liveness probe / App Service health | ASG ELB health check | Shallow probe; restart backoff |
| Instance can’t serve | Remove from LB | Readiness probe | Target-group health | Don’t fail on optional deps |
| Load spike | Scale out | KEDA / VMSS autoscale | ASG target tracking | Max count; pre-warm; cooldown |
| Zone loss | Reschedule to healthy zone | Zone-redundant pool | Multi-AZ ASG | Capacity headroom for N−1 |
| Dependency failing | Stop calling it | Circuit breaker (code) | Circuit breaker (code) | Fallback path; alert on open |
| Bad deploy | Roll back automatically | Deployment slots / rollout | CodeDeploy auto-rollback | Health-gated deployment |
Validate with chaos engineering and a reliability scorecard
A redundancy design you have never failed over is a hypothesis, not a control. Chaos engineering injects the failures from your FMEA and watches the health model and self-healing respond — turning “we think it fails over” into “we measured it failing over in 90 seconds inside the budget.” Both clouds have managed fault-injection services (Azure Chaos Studio, AWS FIS); the full program is Building a Chaos Engineering Program.
The method: form a hypothesis (“a zone loss recovers within RTO, no SLO breach”), define a blast radius and a stop condition, run in non-prod first, then a controlled prod game day with the budget watched live. The pass criterion is never “it recovered” — it is “it recovered within the RTO and inside the error budget.”
# Kill a checkout pod and confirm readiness pulls it from the LB
# and the Deployment reschedules without a journey-level SLO breach.
kubectl delete pod -l app=checkout-api -n checkout --grace-period=0

# Start a defined Azure Chaos Studio experiment (e.g. NSG block to SQL, AKS node shutdown)
az rest --method post \
  --url "https://management.azure.com/subscriptions/<sub>/resourceGroups/rg-checkout-prod/providers/Microsoft.Chaos/experiments/exp-zone-failover/start?api-version=2024-01-01"

# AWS FIS: start a pre-defined experiment (e.g. stop instances in one AZ)
aws fis start-experiment --experiment-template-id EXT123abc
The experiments worth running, mapped to the FMEA rows they validate:
| Experiment | Validates (FMEA row) | Expected self-healing | Pass criterion |
|---|---|---|---|
| Kill a pod / instance | Instance crash | Reschedule + readiness drain | No SLO breach; recovers < 60s |
| Shut down one zone/AZ | Zone loss | Traffic to healthy zones | RTO met; capacity holds (N−1) |
| Block network to the DB | Dependency loss | Circuit breaker opens; fallback | No cascading failure; breaker opens |
| Inject latency on a dependency | Brownout | Timeout + retry + breaker | Threads not exhausted; degrades gracefully |
| Fail over the database region | Region loss | Failover group / promote replica | RTO + RPO met; no data corruption |
| CPU/memory pressure | Saturation | Autoscale out | Scales before SLO breach |
Capture the outcome in a reliability scorecard per journey, so it is auditable and trends over time:
| Dimension | Target | Last result | Status |
|---|---|---|---|
| Availability SLO (30d) | 99.95% | 99.97% | Pass |
| Error budget remaining | > 25% | 61% | Pass |
| Zone-failover RTO | < 5 min | 3m 40s | Pass |
| Cross-region RPO | < 60 s | 22 s | Pass |
| Liveness restart recovery | < 60 s | 18 s | Pass |
| DR game day (last run) | < 90 days ago | 41 days | Pass |
| Untested FMEA rows | 0 | 2 | Fail |
| DNS failover TTL | ≤ 60 s | 60 s | Pass |
Tradeoffs: reliability vs cost and performance
Reliability is never free, and both frameworks are explicit that pillars pull against each other. The reliability pillar’s job is not to maximize reliability — it is to buy exactly enough and be honest about what it costs the others. The tensions you actually argue about in a review:
| Reliability choice | Costs the Cost pillar | Costs the Performance pillar | When it’s worth it |
|---|---|---|---|
| Multi-region active-active | ~2× infra spend | Cross-region write conflict/latency | Journey RTO near-zero; global users |
| Synchronous replication | Standby capacity | Write latency (commit waits for replica) | Zero RPO required |
| Extra redundant copies | Linear per-copy cost | None (usually helps perf) | Composite availability math demands it |
| Aggressive retries | Marginal | Added tail latency; risk of storms | Only with backoff+jitter+breaker |
| Deep health checks | Marginal | Probe load on the app | Never for liveness; carefully for readiness |
| Pre-warmed instances (no cold start) | Idle instance cost | Improves perf (no cold start) | Latency-sensitive, spiky traffic |
| Chaos + DR game days | Engineer time; controlled risk | None | Always — untested DR is the bigger risk |
The most common failure of judgment is spending on the wrong nine: buying multi-region for a workload the business would happily set at 99.9%, while under-investing in the detection (synthetic probes, burn-rate alerts) that catches the brownouts that cause the outages. Do the math, read the FMEA, and let those two artifacts — not instinct — decide where the money goes.
Architecture at a glance
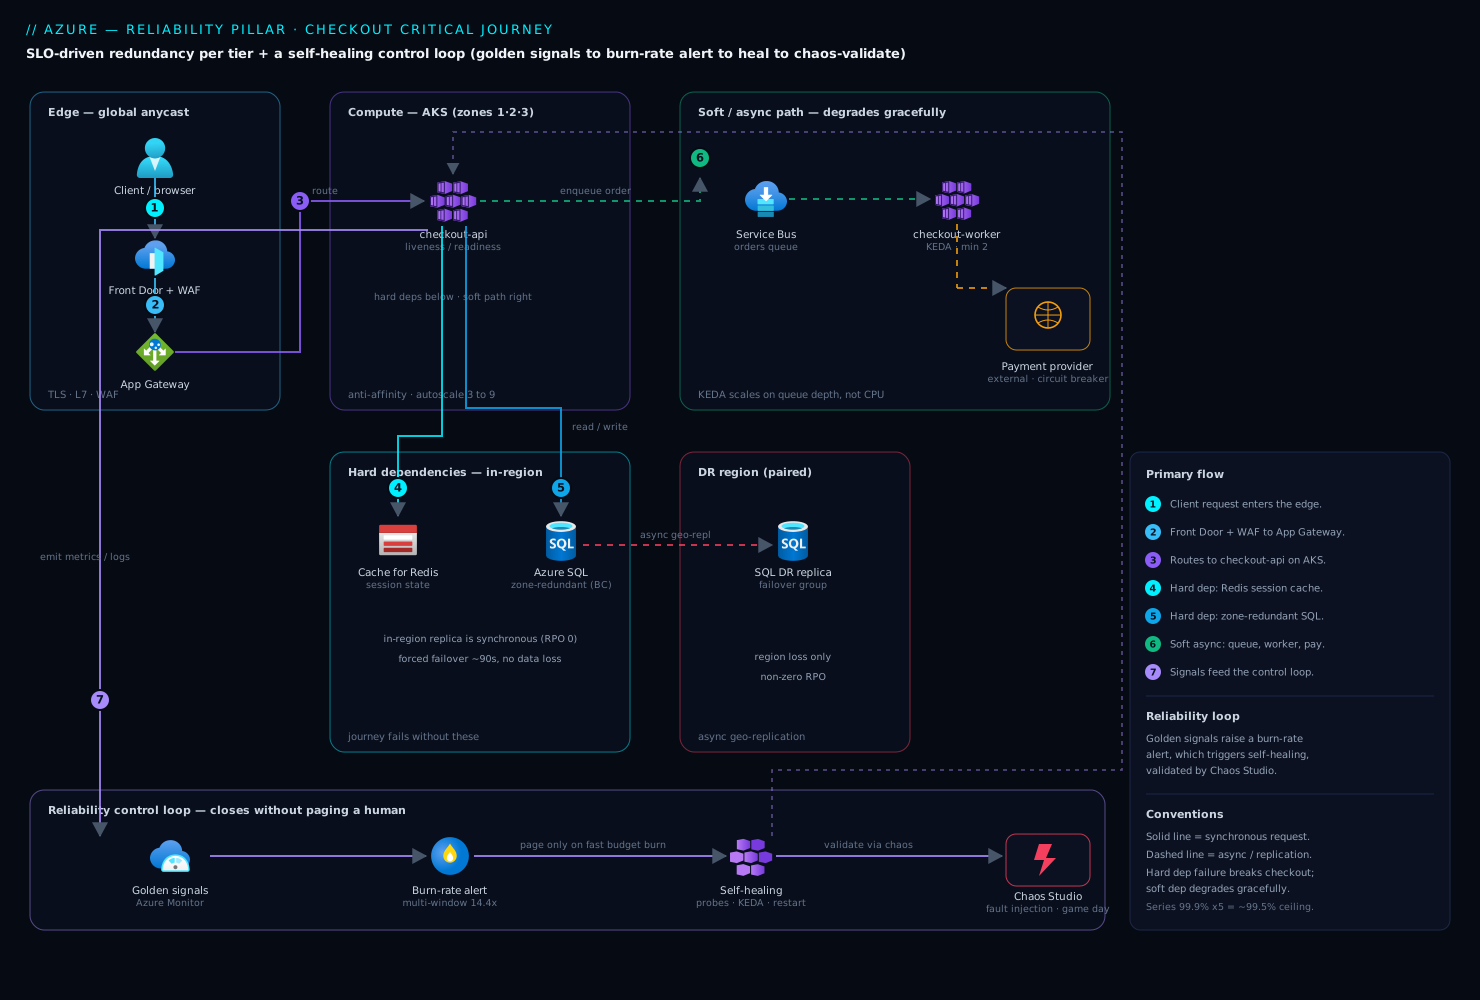
The diagram traces a checkout journey and overlays the reliability control loop that keeps it up. Read left to right as a request path, then notice the feedback loop around it. A client enters through a global front end (Azure Front Door / anycast edge), routes to a regional App Gateway and into the AKS checkout-api. The journey has two hard dependencies in the critical path — Redis (session/cache) and a zone-redundant Azure SQL primary — and one soft, asynchronous path through Service Bus to a background worker plus an external payment provider reached with a circuit breaker. A cross-region SQL failover group hangs off the primary as the DR leg (async, non-zero RPO).
Wrapped around all of it is the control loop the whole article builds: golden signals feed a health model, a burn-rate alert watches the error budget, self-healing (probes, autoscale, auto-restart) closes the loop on known failures, and Chaos Studio validates it on a schedule. The lesson: the request path is the easy part; reliability is the loop around it — measure, detect, heal, and prove — and every hard dependency in the path is a factor in the availability math that decides how much redundancy each box earns.
Real-world scenario
A fintech — call it Paylane — ran checkout on zone-redundant Azure SQL Business Critical with an auto-failover group to a paired region and a multi-window burn-rate alert wired as above. On paper: four nines. The critical journey (login → cart → checkout) had a 99.95% SLO, a ~21-minute monthly budget, and an FMEA flagging the payment provider and the database as the top two RPN rows. Traffic ran ~600 rps, spiking to 2,400 rps on payday. Monthly Azure spend was about ₹9,20,000.
Then a regional networking event degraded the primary’s storage latency without taking it offline — the brownout row (RPN 189) made real. The failover group’s automatic policy never tripped: Azure fails over on a hard outage, and the grace period (--grace-period 1) governs tolerance of an outage, not slowness. Writes were timing out, the fast-burn alert was screaming, and the database “looked healthy” to the platform.
The team’s first instinct was the cross-region failover group. They hesitated — correctly — because it replicates asynchronously, so a forced cross-region flip would lose the in-flight tail of committed payment records (non-zero RPO, unacceptable). Exactly the DR tradeoff: no zero RPO and region survival on one replica. But they did not need the region — the region was fine; the replica was sick.
The fix respected RPO by using the in-region synchronous secondary. Because Business Critical keeps a synchronous zone-redundant replica in-region, they failed over locally — zero data loss, no cross-region hop:
# Force failover to the IN-REGION synchronous secondary (Business Critical) — no data loss
az sql db failover \
  --resource-group rg-checkout-prod \
  --server sql-checkout-prod \
  --name orders
Recovery was 90 seconds; the budget survived with ~40% remaining. Three lasting changes: a synthetic write-latency probe feeding the burn-rate logic (dropping that row’s detectability from 7 to 2 — the cheapest, highest-leverage fix); a runbook making the manual-failover decision explicit (“budget burning + Azure healthy → fail to the in-region secondary first, cross-region only on a real region loss”); and a quarterly Chaos Studio experiment injecting storage latency, so the brownout path is now a tested control. The board-level lesson: automation handles the binary failures; the brownout is where a human still earns their pager — and a synthetic probe is what wakes them up in time.
The incident as a timeline — the order of decisions is the lesson:
| Time | Signal | Action | Effect | The right principle |
|---|---|---|---|---|
| 14:02 | Fast-burn alert fires | On-call paged | — | Burn-rate alert caught it, not a threshold |
| 14:04 | DB “healthy”, writes timing out | Check failover-group state | Auto-failover hadn’t tripped | Brownout ≠ outage; policy is for hard loss |
| 14:07 | Budget burning fast | Almost forced cross-region failover | Would lose committed tx (RPO) | Don’t take a non-zero-RPO hit unnecessarily |
| 14:09 | Diagnosed: sick replica, healthy region | Fail to in-region synchronous secondary | Recovered in 90s, zero data loss | Match the recovery to the actual failure |
| +1 week | Post-incident | Add synthetic write-latency probe | FMEA detectability 7 → 2 | Cheapest RPN reduction is detection |
| +2 weeks | Hardening | Runbook + quarterly Chaos experiment | Brownout is now a tested control | Untested failover is a liability |
Advantages and disadvantages
The number-driven method both demands discipline and rewards it. Weigh it honestly:
| Advantages (why the pillar method helps) | Disadvantages (why it’s hard) |
|---|---|
| Redundancy spend is justified by math and FMEA, not instinct — you stop over- and under-buying | Requires real effort up front: SLOs, availability math, an FMEA per journey — teams skip it under deadline |
| Error budget gives a shared, quantitative currency between “ship fast” and “stay up” | The budget is a cultural contract; it only works if leadership honors the freeze when it’s spent |
| Burn-rate alerts page on real budget consumption, not noisy static thresholds | Multi-window burn-rate math is unfamiliar; wiring it correctly takes iteration |
| Chaos + game days convert “we think it fails over” into a measured, auditable control | Fault injection in prod feels scary; needs blast-radius discipline and buy-in |
| The method is cloud-agnostic — same math and patterns on Azure and AWS | Two vocabularies (zone/AZ, zone-redundant/Multi-AZ) to keep straight in a multi-cloud org |
| Self-healing removes humans from known failures, cutting MTTR and pager load | Self-healing is dangerous without guardrails (deep liveness, no breaker) — easy to make it self-harm |
| Per-journey SLOs let you spend reliability where the business actually pays for it | Requires honest product conversations about which journeys matter — political, not just technical |
The method is right for any workload with a real SLA and stateful tiers, essential for anything mission-critical or global, and overkill only for a genuinely tolerant internal tool — where even so, the SLA→SLO→budget step takes an hour and prevents the “why are we paying for multi-region on this?” conversation two years later.
Hands-on lab
Prove two load-bearing ideas end to end on Azure: (a) compute an error budget, and (b) deploy a zone-redundant tier and validate self-healing (kill a pod, drain a zone). Run in Cloud Shell (Bash); everything is deleted at the end.
Step 1 — Variables and resource group.
RG=rg-reliab-lab
LOC=eastus2
AKS=aks-reliab-$RANDOM
az group create -n $RG -l $LOC -o table
Step 2 — Create a small zone-redundant AKS cluster (nodes spread across 3 zones).
az aks create -g $RG -n $AKS \
  --node-count 3 \
  --zones 1 2 3 \
  --node-vm-size Standard_D2s_v5 \
  --generate-ssh-keys -o table
az aks get-credentials -g $RG -n $AKS --overwrite-existing
Expected: cluster provisions with one node in each of zones 1, 2, 3. Confirm the spread:
kubectl get nodes -o custom-columns=NODE:.metadata.name,ZONE:'.metadata.labels.topology\.kubernetes\.io/zone'
# Expect three nodes across eastus2-1, eastus2-2, eastus2-3
Step 3 — Deploy a stateless app with proper probes and multi-zone spread.
kubectl create deployment web --image=mcr.microsoft.com/azuredocs/aci-helloworld:latest --replicas=3
kubectl set env deployment/web WEBSITES_PORT=80
kubectl expose deployment web --port=80 --target-port=80 --type=LoadBalancer
# Add a topology spread so the 3 replicas land in 3 different zones
kubectl patch deployment web --type=json -p='[{"op":"add","path":"/spec/template/spec/topologySpreadConstraints","value":[{"maxSkew":1,"topologyKey":"topology.kubernetes.io/zone","whenUnsatisfiable":"ScheduleAnyway","labelSelector":{"matchLabels":{"app":"web"}}}]}]'
Confirm one pod per zone:
kubectl get pods -l app=web -o wide
# Each of the 3 pods should be on a node in a different zone
Step 4 — Compute the error budget by hand (the number that drives everything). For a 99.9% SLO over 30 days:
# Downtime budget = (1 - SLO) * window
python3 -c "budget=(1-0.999)*30*24*60; print(f'{budget:.1f} minutes/30d')"
# → 43.2 minutes/30d  (this is your monthly error budget)
Step 5 — Validate self-healing: kill a pod and watch it recover.
# Delete one pod; the Deployment must reschedule it, ideally in the same zone
kubectl delete pod -l app=web --field-selector=status.phase=Running | head -1
watch -n1 kubectl get pods -l app=web -o wide
# Expected: a replacement pod appears within seconds; count returns to 3
Step 6 — Simulate a zone loss (cordon+drain one zone’s node) and confirm capacity holds.
# Pick one node and drain it to simulate losing a zone
NODE=$(kubectl get nodes -o name | head -1)
kubectl cordon $NODE
kubectl drain $NODE --ignore-daemonsets --delete-emptydir-data --force
kubectl get pods -l app=web -o wide
# Expected: pods reschedule onto the remaining zones; the app stays available (N-1)
kubectl uncordon $NODE   # restore
Validation checklist. You spread a stateless tier across three zones, computed a 43.2-minute monthly budget from a 99.9% SLO, and validated pod-level (kill → reschedule) and zone-level (drain → app stays up on N−1) resilience. What each step proved:
| Step | What you did | Reliability principle proven |
|---|---|---|
| 2–3 | Zone-redundant nodes + topology spread | Redundancy at the zone tier; break shared fate |
| 4 | Compute the error budget | Targets drive design; the budget is arithmetic |
| 5 | Kill a pod, watch recovery | Self-healing on instance failure |
| 6 | Drain a zone, app survives | Zone-loss resilience; capacity for N−1 |
Cleanup (avoid lingering AKS charges).
az group delete -n $RG --yes --no-wait
Cost note. Three D2s_v5 nodes run a few rupees per hour; an hour of this lab is well under ₹200, and deleting the resource group stops everything including the load balancer’s public IP.
Common mistakes & troubleshooting
The reliability failures that recur in review after review — symptom, the root cause the team missed, how to confirm, and the fix. Scan the table, then read the detail on the ones that bite hardest.
| # | Symptom | Root cause | Confirm (exact check) | Fix |
|---|---|---|---|---|
| 1 | SLA promised but breached in a bad week | No SLO/budget margin below the SLA | Compare SLA to internal SLO — are they equal? | Set SLO tighter than SLA; track budget |
| 2 | “Four nines” claimed, delivers ~99.5% | Series math ignored: too many hard deps | Multiply hard-dependency availabilities (0.999^n) |
Reduce/soften hard deps; add redundancy |
| 3 | Multi-region built, still had an outage | Both “regions” shared a single database/DNS | Trace the dependency graph for shared fate | Remove the shared SPOF; verify independence |
| 4 | Failover never triggers on a brownout | Auto-failover policy is for hard loss only | Reproduce with a latency-injection experiment | Synthetic latency probe + manual runbook |
| 5 | Failover flip completes but users still down | DNS TTL too long; clients cache old IP | dig the record’s TTL (3600?) |
Lower TTL to 30–60s; use anycast front end |
| 6 | A dependency blip causes a total outage | Retry with no circuit breaker → retry storm | Check outbound policy for a breaker | Add circuit breaker + backoff + jitter |
| 7 | One slow dependency hangs the whole service | No bulkhead; shared thread pool exhausted | Look for a per-dependency pool/isolation | Bulkhead per dependency; timeouts |
| 8 | Retries recover… then knock the dep down again | Backoff with no jitter → thundering herd | Inspect retry policy for jitter | Add full jitter to the backoff |
| 9 | A DB blip restart-storms every pod | Deep liveness probe touching the database | Read the liveness probe path | Make liveness shallow; deps in readiness |
| 10 | Autoscale doesn’t prevent the 5xx spike | Scaling on CPU, not the real bottleneck | Compare CPU vs queue depth/in-flight at incident | Scale on the true saturation metric (KEDA) |
| 11 | RPO worse than promised after failover | Cross-region async lag underestimated | Check replication lag metric at failover time | Set RPO from measured lag; sync in-region |
| 12 | DR “works” in the doc, fails on the day | Runbook never exercised; procedures stale | Date of last DR game day | Quarterly game day; automate the runbook |
| 13 | Alert storms on every minor blip | Static error threshold, not burn rate | Are alerts on errors > X% or on burn rate? |
Multi-window burn-rate alert |
| 14 | Zone loss drops capacity below demand | No N−1 headroom; sized for N | Can remaining zones carry full load? | Size each tier for N−1; test by draining |
The two that cause the most wasted incident time, expanded — because both fail softly and a naive design misses them:
Row 4 — failover never triggers on a brownout. Managed auto-failover (Azure failover group, RDS Multi-AZ) fires on a hard outage, not a sick-but-alive primary — a brownout keeps the probe green while the app times out. Confirm by injecting latency (Chaos Studio / FIS) and watching the auto-failover not fire while error rate climbs. Fix with a synthetic user-path latency probe feeding your burn-rate alert, plus a runbook making the manual-failover decision explicit when the budget burns but the platform reports healthy.
Row 9 — a DB blip restart-storms every pod. A liveness probe does a deep check that touches the database; a brief DB blip fails every pod’s liveness at once, Kubernetes kills them all, and the mass restart outlasts the blip. Confirm by reading the liveness path — if it calls a dependency, that is the bug. Fix by making liveness shallow/local, moving dependency checks to readiness, and adding a startup probe.
Best practices
- Set an SLO per critical journey, below the SLA. No SLO, no error budget, no data-driven design; the margin between them is your buffer.
- Do the availability math, then run an FMEA per journey. If
0.999^nacross your hard dependencies is below your SLO, redundancy or dependency reduction is mandatory. Sort the FMEA by RPN and attack detectability first (cheapest), then severity, then likelihood. - Match the redundancy tier to data gravity. Stateless front ends go zone-redundant trivially; for stateful tiers, choose synchronous in-region (zero RPO) vs async cross-region (region survival) deliberately.
- Choose the DR strategy from the RTO/RPO, not habit. Most workloads land on pilot light or warm standby.
- Emit the four golden signals and roll them into a health model; page on burn rate, not static thresholds. Alert on journey degradation.
- Design retry, circuit breaker, timeout, and bulkhead as one outbound policy. Never retry without backoff+jitter and a breaker; never share a thread pool across dependencies.
- Keep liveness shallow; gate traffic with readiness; guard slow boots with startup probes. A deep liveness probe is a restart-storm generator.
- Size every tier for N−1 (losing a zone shouldn’t drop you below demand) and keep DNS failover TTLs low (30–60s) or use an anycast front end — a fast failover is worthless behind a 3600-second TTL.
- Run a chaos experiment and a DR game day on a schedule. An untested failover is a liability; the “untested FMEA rows” scorecard row keeps you honest.
Security notes
Reliability and security intersect more than teams expect — several reliability controls are security controls, and several security misconfigurations cause outages.
- Least privilege on failover automation. The identity that triggers a failover or scales a tier gets exactly the RBAC to do so (
SQL DB Contributor, an ASG scaling role) — not owner. A broad compromised credential can cause an outage by triggering an unwanted failover. - Protect the DR path, not just the primary. Encryption, key access, and network rules must exist in the DR region before you need it — a failover to a region where the app can’t reach Key Vault / KMS is a failover to an outage.
- Managed identity in the resiliency path. Health probes, failover automation, and backup jobs authenticate with managed identity / IAM roles, not stored secrets — a rotated-away secret is a boot-time crash loop (a reliability incident with a security root cause).
- Rate-limit and shed load; don’t leak topology. A bulkhead and breaker also defend against a spike exhausting resources (availability protection is DoS protection), and
/healthzreturns a status, not a map of internal hostnames. - Secure the chaos tooling and test your backups. Chaos Studio / FIS can cause outages by design — scope its identity tightly and require approval for prod. Backups must be immutable (object-lock) and restore-tested; an untested backup is Schrödinger’s recovery.
Cost & sizing
The bill drivers of a reliability design:
- Redundancy multiplies infra cost roughly linearly per copy — two zone-redundant copies ≈ 2× that tier, three ≈ 3×, multi-region active-active ≈ 2× the whole stack. The math tells you the fewest copies that meet the SLO; buy those.
- Synchronous replication costs standby capacity + a little write latency; async cross-region costs standby capacity + accepts RPO. The cheaper reliability is usually detection (synthetic probes, burn-rate alerts) — a few rupees of telemetry that catches brownouts redundancy alone would miss.
- DR strategy is a cost dial — backup-restore (storage only), pilot light (data warm, minimal infra), warm standby (scaled-down full stack), active-active (full capacity twice). Match it to the RTO the business will pay for.
- Chaos and game days cost engineer time, not infra — and prevent the far larger cost of a failed real failover. N−1 over-provisioning is deliberate slack so a zone loss doesn’t drop you below demand.
A rough monthly picture for a mid-size critical web workload (illustrative INR):
| Reliability posture | What you run | Rough INR / month | RTO / RPO delivered | When it’s right |
|---|---|---|---|---|
| Single-zone, backups only | 1 zone + nightly backups | ~₹2,00,000 | RTO hours / RPO hours | Tolerant internal tools |
| Zone-redundant, in-region HA | Multi-AZ compute + Multi-AZ DB | ~₹3,20,000 | RTO minutes / RPO ~0 (zone) | Most production apps |
| + Pilot-light DR region | Above + replicated data, minimal DR infra | ~₹3,80,000 | RTO ~30–60 min / RPO minutes | Business-critical, region-loss coverage |
| + Warm standby | Above + scaled-down full DR stack | ~₹4,80,000 | RTO single-digit min / RPO minutes | Low-RTO business-critical |
| Active-active multi-region | Full stack serving both regions | ~₹6,40,000 | RTO ~0 / RPO ~0–seconds | Mission-critical, global |
| Detection layer (any posture) | Synthetic probes + burn-rate alerts + logs | ~₹15,000–40,000 | (catches brownouts) | Always — cheapest reliability |
The lesson in the table: single-zone → zone-redundant is the highest-value rupee you spend; active-active is the most expensive jump and only pays off at a genuinely near-zero RTO; and the detection layer at the bottom is the cheapest line and often the one that would have prevented the last incident.
Interview & exam questions
1. Distinguish SLA, SLO, SLI, and the error budget. The SLA is the contractual promise with penalties; the SLO is your tighter internal target; the SLI is the measured indicator you compare to it. The error budget is 1 − SLO — the allowed unreliability — and it governs release risk: budget left → ship faster; budget spent → freeze. Set the SLO below the SLA so a bad week doesn’t immediately breach contract.
2. Five hard dependencies each at 99.9% — what’s the ceiling, and what do you do? 0.999^5 ≈ 99.5%, already below a 99.9% SLO — series dependencies multiply, so the whole is less available than the weakest link. Reduce the number of hard dependencies, add redundancy to the weakest, or convert hard to soft with caching/queues so the journey degrades instead of failing.
3. Why can’t you have zero RPO and survive a region loss on the same replica? Zero RPO needs synchronous replication (commit waits for the replica), which is distance-bound and stays in-region (Multi-AZ / Business Critical zone-redundant). Surviving a region loss needs a cross-region replica, reachable only via asynchronous replication, which lags — so failover loses the in-flight tail (non-zero RPO). Choose per tier.
4. Name the four DR strategies in cost/RTO order. Backup-and-restore (cheapest, RTO hours) → pilot light (core data warm, RTO tens of minutes) → warm standby (scaled-down full stack, RTO minutes) → active-active (full stack both sides, RTO near-zero, ~2× cost). You pay to keep more of the system warm for a lower RTO.
5. Active-active vs active-passive, and a common trap? Active-passive keeps a standby that takes over on failure (cheaper, RTO minutes, single writer — simpler data). Active-active serves traffic from all regions (near-zero RTO, ~2× cost, needs conflict resolution). The trap: “active-active” over a single shared database — that’s active-active compute over active-passive data, and the shared DB is your real SPOF.
6. Why is a retry without a circuit breaker dangerous? When a dependency degrades, retries increase the load on it, deepening the failure — a self-inflicted DDoS. A circuit breaker opens when failures cross a threshold, failing fast (or falling back) so the dependency can recover. Pair it with backoff+jitter (no thundering herds) and a bulkhead (the failure can’t exhaust shared threads).
7. What is a bulkhead and what failure does it prevent? A bulkhead gives each dependency its own bounded thread/connection pool (from a ship’s watertight compartments). If one dependency hangs, only its bulkhead fills and the rest of the service keeps serving. Without it, one slow dependency exhausts the shared pool and the whole service goes down — a cascading failure from one soft failure.
8. Why keep liveness probes shallow and readiness probes deeper? Liveness (“is the process wedged?”) restarts the pod on failure — so a deep DB check there fails every pod at once on a brief DB blip and restart-storms the cluster. Readiness (“can I serve?”) removes the pod from the load balancer without a restart, so it’s the right place for dependency checks.
9. What is a burn-rate alert and why is it better than a static threshold? It pages when you’re consuming the error budget fast enough to exhaust it before the window closes (e.g. 14.4× = 2% of a 30-day budget in an hour), confirmed on two windows (short + long) to kill false pages. A static errors > 1% either pages on noise or misses a slow bleed; burn rate ties the page to the budget itself.
10. How do you validate a redundancy design, and what’s the pass criterion? With chaos engineering (Azure Chaos Studio / AWS FIS): hypothesis, blast radius + stop condition, inject the failure (kill a pod, drain a zone, block the DB), watch the health model and self-healing respond — non-prod first, then a prod game day. Pass is not “it recovered” but “it recovered within the RTO and inside the error budget.”
11. Failover completes in 90 seconds but users are down for an hour. Why? The DNS TTL on the failover record is too long (e.g. 3600s), so clients keep resolving the old IP. The control is DNS caching, not the database. Fix with a low TTL (30–60s) or an anycast front end (Front Door / Global Accelerator) whose health-probe failover doesn’t depend on client DNS caching.
12. An app OOM-restart-loops under load — does scaling out fix it? No — scaled-out instances each hit the same per-instance memory ceiling and OOM identically. Memory is per-instance, so scale up to a higher-RAM SKU and/or fix the leak (capture a dump). A redundancy-doesn’t-help case: the failure is per-instance saturation, so only more RAM-per-instance or less memory use resolves it.
These map to cert objectives on both clouds:
| Question theme | Azure cert | AWS cert |
|---|---|---|
| SLA/SLO/error budget, golden signals | AZ-400 / AZ-104 | SAP-C02 (Reliability) |
| Availability math, redundancy tiers | AZ-305 (design) | SAP-C02 / SAA-C03 |
| DR strategies, RTO/RPO, replication | AZ-305 | SAP-C02, ANS-C01 |
| Retry/breaker/bulkhead, distributed patterns | AZ-204 | DVA-C02 |
| Health probes, autoscale, self-healing | AZ-104 / CKA (K8s) | SOA-C02 |
| Chaos engineering, game days | AZ-400 | SAP-C02 |
Quick check
- Your SLA is 99.9%. Should your internal SLO be 99.9%, higher, or lower — and why?
- A journey has six hard dependencies, each at 99.95%. Roughly what is the availability ceiling, and is a 99.95% SLO achievable as-is?
- You need to survive a full region loss and you were told “zero data loss.” Which one has to give, and why?
- Name the four DR strategies from cheapest to most expensive.
- A retry policy recovers your app, then knocks the downstream over again a few seconds later. What single thing is the policy missing?
Answers
- Higher (tighter) than the SLA. The SLA is the contractual floor with penalties; you set the SLO above it (e.g. 99.95%) so a bad week burns internal budget without immediately breaching contract. Equal SLO and SLA leaves zero margin.
0.9995^6 ≈ 99.70%. The ceiling (~99.7%) is below the 99.95% target, so the SLO is not achievable with six hard dependencies at 99.95% each. You must add redundancy to some of them or reduce/soften them until the composite clears 99.95%.- Zero RPO has to give (or you accept some data loss on region failover). Zero RPO needs synchronous replication, which is distance-bound and stays in-region; surviving a region loss needs a cross-region replica, which is asynchronous and lags. You can have in-region zero RPO and cross-region DR with a small RPO — but not zero RPO across a region boundary.
- Backup-and-restore → pilot light → warm standby → active-active. Cost and warmth rise together; RTO falls as you keep more of the system running.
- Jitter (random spread on the backoff). Without jitter, every client backs off by the same amount and retries in the same instant the downstream recovers — a synchronized thundering herd that knocks it back down. Add full jitter (and confirm a circuit breaker is present).
Glossary
- SLA / SLO / SLI — the contractual promise (with penalties); your tighter internal target; and the measured indicator (success ratio, latency percentile) compared against it.
- Error budget —
1 − SLO; the allowed unreliability, spent as a currency to govern release risk. Burn rate is how fast you consume it relative to the window; a multi-window burn-rate alert pages on real consumption, not a static threshold. - Availability zone (AZ) — a physically isolated datacenter within a region (independent power/cooling/network); zone-redundant / Multi-AZ survives a zone loss. A region pair / DR region survives a full region loss but needs (usually async) cross-region replication.
- Hard dependency — the journey can’t function without it; hard deps in series multiply their availabilities. A soft dependency only degrades the journey (via caching, queuing, or a fallback).
- Composite availability — a journey’s availability from its topology: series (hard) dependencies multiply; parallel (redundant) ones combine as
1 − (1−p)ⁿ. - FMEA / FMA (Failure Mode & Effects / Failure Mode Analysis) — a structured enumeration of how each component fails, its effect, detection, and a Risk Priority Number (
RPN = Severity × Likelihood × Detectability, each 1–10) that sorts rows into a prioritized backlog. - RTO / RPO — the max tolerable downtime (drives the DR strategy) and the max tolerable data loss in time (drives the replication mode).
- Active-active vs active-passive — all regions serve traffic (near-zero RTO, highest cost, needs conflict resolution) vs a standby that takes over on failure (cheaper, higher RTO, single-writer data model).
- DR strategies — backup-and-restore (cheapest, slowest), pilot light, warm standby, active-active (dearest, fastest) — points on the cost-vs-RTO/RPO curve.
- Retry / circuit breaker / timeout / bulkhead — the four resiliency patterns: retry transient failures with backoff+jitter; a circuit breaker stops calling a failing dependency (open → half-open → closed) to prevent cascading failure; a timeout caps how long you wait; a bulkhead isolates a bounded resource pool per dependency so one failure can’t exhaust shared threads.
- Golden signals — latency, traffic, errors, saturation; the four metrics every tier should emit and roll into a health model (resource → component → journey → business).
- Self-healing — automated recovery from known failures (restart via probes, scale via autoscale, reroute via readiness) without a human, validated by chaos engineering (Azure Chaos Studio / AWS FIS) that injects faults to confirm redundancy and self-healing behave as designed within RTO and the error budget.
Next steps
You can now take a business SLA down to an error budget, choose redundancy and a DR strategy from the numbers, and validate it with chaos. Build outward:
- Next: Resiliency Patterns That Actually Work: Retry, Circuit Breaker, and Bulkhead — the code-level deep dive on the patterns framed here.
- Related: High Availability vs Disaster Recovery: RTO and RPO Explained — the RTO/RPO foundations behind the DR-strategy choice.
- Related: Building a Chaos Engineering Program — turn the validation step into a standing program.
- Related: Multi-Region Data: Choosing Replication and Consistency Without Losing Writes — the hard part of active-active.
- Related: Cell-Based Architecture: Containing Blast Radius — bulkheads scaled to whole-system isolation.
- Related: Well-Architected Operational Excellence Pillar — the runbooks and game days that make recovery muscle memory.
- Related: Azure Well-Architected: Reliability — the Azure control catalog mapped to the WAF checklist codes.