In a nutshell
DORA metrics are four numbers that tell you how well a team ships software. They come out of years of research (the Accelerate book and the annual State of DevOps / DORA report) that asked a simple question: what actually separates high-performing engineering teams from struggling ones? The answer boiled down to four measurable signals — how often you deploy, how long a change takes to reach production, how often a deploy breaks things, and how fast you recover when it does.
Those four split neatly into two ideas. The first two measure throughput — speed and frequency of delivery. The second two measure stability — how safe that delivery is. Think of a pizza shop. Throughput is “how fast and how often orders go out the door.” Stability is “how often a pizza arrives cold, and how quickly you make it right.” A shop that ships fast but half the pizzas are wrong is not good; a shop that never makes a mistake but takes a week per order is not good either. DORA’s headline finding is the counter-intuitive part: the best teams are good at both at once — speed and stability rise together, they are not a trade-off, because the same habits that let you ship small changes often (automated tests, small batches, fast rollback) are exactly what keep failures rare and short.
Why should a beginner care? Because DORA is the industry’s common language for “are we getting better at delivering?” — and because most DORA dashboards are quietly wrong. They count GitHub merges as deploys, treat every closed Jira bug as a failure, and mash forty services into one meaningless company-wide number. This lesson teaches you to build a DORA pipeline that measures the real thing: each metric mapped to a concrete, timestamped event in a system you control, stored in one table, and shown on a dashboard nobody can game.
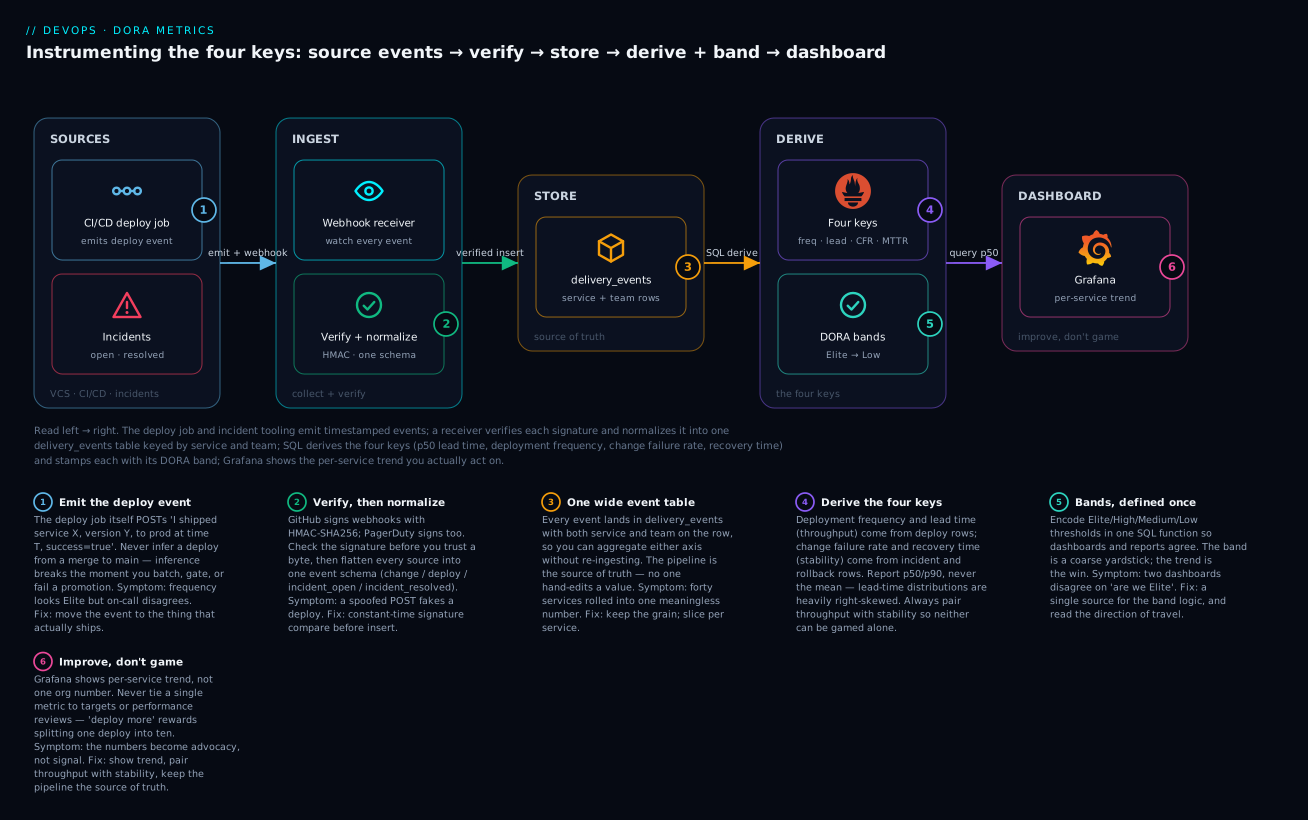
The diagram traces one change left to right: the CI/CD deploy job and incident tooling emit timestamped events; a receiver verifies each signature and normalizes everything into one delivery_events table that keeps both service and team; SQL derives the four keys (p50 lead time, deployment frequency, change failure rate, recovery time) and stamps each with its DORA band; and Grafana shows the per-service trend you actually act on — never a single org-wide number people optimize toward.
Level: Intermediate · Time: ~30 min
Most DORA dashboards lie. They count GitHub merges as deploys, treat every closed Jira bug as a failure, and aggregate forty services into one meaningless company-wide number. The result is a chart leadership stares at while nobody’s delivery actually improves. DORA metrics are only useful when each value maps to a real, timestamped event in a system you control, and when the aggregation matches how you actually ship.
This guide builds that pipeline. We collect deployment and change events from your VCS and CI/CD, derive lead time from first commit to production, compute change failure rate and MTTR from incident and rollback signals, store everything in a queryable table, and surface it in Grafana without creating metrics people game. The reference stack is GitHub plus a generic CI runner plus PostgreSQL plus Grafana, but every event boundary maps cleanly to GitLab, Azure DevOps, Jenkins, PagerDuty, or Opsgenie.
Prerequisites & what you’ll be able to do
You will get the most from this lesson if you already know:
- What DORA metrics are at a conceptual level and where they sit in a DevOps culture — if that is new, start with DevOps fundamentals: culture, CI/CD, DORA & value stream.
- How a CI/CD pipeline runs jobs on merge and deploy, and roughly what a “deploy job” does.
- Basic SQL —
SELECT,GROUP BY, and the idea of an aggregate (you will meetpercentile_conthere, explained inline). - What a webhook is — an HTTP POST a SaaS system sends you when something happens.
- Helpful but not required: a working Grafana + a SQL data source, covered in Prometheus & Grafana monitoring stack.
After working through it you will be able to:
- Define each of the four keys precisely, including the exact event boundary each one is measured between, and name the pitfalls that turn each into fiction.
- Instrument a CI/CD pipeline to emit a real deploy event (service, version, environment, outcome, first-commit timestamp) instead of inferring deploys from merges.
- Ingest VCS, CI, and incident events into one normalized event table with verified webhook signatures.
- Write the SQL that derives deployment frequency, p50/p90 lead time, change failure rate, and recovery time — with a clock-skew guard.
- Encode the DORA performance bands once so dashboards and reports agree, and build Grafana panels that respect the time range and a
$servicevariable. - Design the whole thing so no single metric can be gamed, and know how DORA relates to SPACE and flow metrics.
1. Define the four keys precisely (and the pitfalls)
The four DORA metrics, per the Accelerate research and the annual DORA report, split into throughput and stability:
| Metric | Definition | Event boundary |
|---|---|---|
| Deployment frequency | How often you deploy to production | One row per successful prod deploy |
| Lead time for changes | Time from code committed to code running in prod | first_commit_ts to deployed_ts |
| Change failure rate | Percentage of deployments causing a failure in prod | failed deploys / total deploys |
| Mean time to restore (MTTR)* | Time to recover from a prod failure | incident_start_ts to incident_resolved_ts |
*The 2024 DORA report renamed MTTR to “failed deployment recovery time” to clarify it measures recovery from a deployment-induced failure, not from any incident. The boundary matters: a failed disk in a datacenter is reliability, not delivery. Scope MTTR to incidents linked to a deployment.
Notice the split. The first two metrics — deployment frequency and lead time — measure throughput: how fast and how often change reaches users. The second two — change failure rate and recovery time — measure stability: how often that change breaks things and how quickly you recover. The counter-intuitive finding from the Accelerate research is that these are not a trade-off. Elite teams score well on both at once; speed and stability rise together, because the same practices that let you ship small changes often (automated tests, small batches, decoupled deploys, fast rollback) are exactly what keep failures rare and short. If your throughput improves while stability collapses, you are not going faster — you are accumulating risk, and the metrics are there to make that visible.
The pitfalls that produce fiction:
- Merge != deploy. A merge to
mainis a change event, not a deployment. Counting merges inflates frequency for teams that batch releases. - Lead time must start at first commit, not at PR open or merge. Code sitting in a long-lived branch is exactly the waste lead time is meant to expose. Use the earliest commit on the branch, not the merge commit timestamp.
- Change failure rate needs a denominator of deployments, not of incidents. CFR is
failed_deploys / total_deploys, so you must record successful deploys too. - Averages hide everything. DORA bands are about distributions. Report the median (p50) for lead time and MTTR; a single outlier rollback at 3am wrecks the mean.
2. Identify the source events
Map each metric to a concrete, timestamped signal before writing any code. For the reference stack:
| Event | Source | Signal |
|---|---|---|
| Change created | GitHub | push / merge to default branch; first commit SHA + author date |
| Build / pipeline run | CI | pipeline start and finish with commit SHA |
| Deployment | CI deploy job | explicit “deploy succeeded/failed to prod” emission |
| Incident opened | PagerDuty / Opsgenie | incident triggered with a service field |
| Incident resolved | PagerDuty / Opsgenie | incident resolved timestamp |
| Rollback | CI / GitOps | a deploy whose is_rollback=true |
The single most important design decision: the deployment event is emitted by the deploy job itself, not inferred. Inference (e.g. “a merge to main means a deploy happened”) breaks the moment you batch, gate, or have a failed promotion. Make the pipeline say “I deployed service X, version Y, to prod, at time T, and it succeeded.”
3. Collect deployment and change events
Two ingestion paths feed one normalized table: webhooks for things that happen in SaaS (merges, incidents) and an explicit CI annotation for deploys.
First, the schema. One wide event table is enough to start; you derive metrics with SQL.
CREATE TABLE delivery_events (
  id            BIGSERIAL PRIMARY KEY,
  event_type    TEXT NOT NULL,          -- change | deploy | incident_open | incident_resolved
  service       TEXT NOT NULL,
  team          TEXT,
  environment   TEXT,                   -- prod | staging | ...
  commit_sha    TEXT,
  first_commit_ts TIMESTAMPTZ,          -- earliest commit in the change set
  occurred_at   TIMESTAMPTZ NOT NULL,   -- when the event itself happened
  success       BOOLEAN,                -- deploy outcome
  is_rollback   BOOLEAN DEFAULT FALSE,
  incident_id   TEXT,                   -- correlate open/resolved
  source        TEXT NOT NULL,          -- github | ci | pagerduty
  payload       JSONB,                  -- raw event for auditing
  ingested_at   TIMESTAMPTZ NOT NULL DEFAULT now()
);

CREATE INDEX idx_events_service_time ON delivery_events (service, occurred_at);
CREATE INDEX idx_events_type ON delivery_events (event_type, environment);
A minimal receiver. Verify the webhook signature before trusting anything; GitHub signs with HMAC-SHA256 over the raw body using your webhook secret.
import hashlib, hmac, os, json
from datetime import datetime, timezone
from flask import Flask, request, abort
import psycopg

app = Flask(__name__)
SECRET = os.environ["GH_WEBHOOK_SECRET"].encode()

def verify(req) -> bool:
    sig = req.headers.get("X-Hub-Signature-256", "")
    mac = hmac.new(SECRET, req.get_data(), hashlib.sha256)
    expected = "sha256=" + mac.hexdigest()
    return hmac.compare_digest(expected, sig)

@app.post("/hooks/github")
def github():
    if not verify(request):
        abort(401)
    if request.headers.get("X-GitHub-Event") != "push":
        return "", 204
    e = request.json
    if e.get("ref") != f"refs/heads/{e['repository']['default_branch']}":
        return "", 204  # only default-branch changes count

    commits = e.get("commits", [])
    if not commits:
        return "", 204
    # earliest commit timestamp in the pushed set = lead-time start
    first_ts = min(c["timestamp"] for c in commits)

    with psycopg.connect(os.environ["DATABASE_URL"]) as conn:
        conn.execute(
            """INSERT INTO delivery_events
               (event_type, service, commit_sha, first_commit_ts,
                occurred_at, source, payload)
               VALUES ('change', %s, %s, %s, %s, 'github', %s)""",
            (e["repository"]["name"], e["after"], first_ts,
             datetime.now(timezone.utc), json.dumps(e)),
        )
    return "", 202
Now the deploy event. Emit it from the pipeline at the end of the prod deploy step. This is a plain authenticated POST; the CI job already knows the version, environment, and outcome.
# Runs as the last step of the prod deploy job.
# DEPLOY_OK is "true"/"false" set by the preceding deploy step.
FIRST_COMMIT_TS=$(git log --reverse --format=%cI "origin/main..HEAD" | head -1)
[ -z "$FIRST_COMMIT_TS" ] && FIRST_COMMIT_TS=$(git show -s --format=%cI HEAD)

curl -fsS -X POST "$METRICS_INGEST_URL/events/deploy" \
  -H "Authorization: Bearer $METRICS_TOKEN" \
  -H "Content-Type: application/json" \
  -d @- <<JSON
{
  "service":        "$SERVICE_NAME",
  "team":           "$TEAM_NAME",
  "environment":    "prod",
  "commit_sha":     "$(git rev-parse HEAD)",
  "first_commit_ts":"$FIRST_COMMIT_TS",
  "occurred_at":    "$(date -u +%Y-%m-%dT%H:%M:%SZ)",
  "success":        $DEPLOY_OK,
  "is_rollback":    ${IS_ROLLBACK:-false}
}
JSON
The git log origin/main..HEAD trick gives you the first commit unique to this change set, which is the correct lead-time start. For a merge-commit workflow, walk the merged commits instead via the GitHub compare API.
Make the metrics POST non-blocking for the deploy: wrap it so a metrics outage never fails a production release. Use
curl -fsS ... || echo "metrics emit failed"and alert on the gap separately. Delivery instrumentation must never be in the critical path of delivery.
4. Compute lead time for changes
Lead time is the gap between first_commit_ts and the prod deploy that carried that commit. Because the deploy event records its own first_commit_ts (from the CI snippet above), the computation is local to the deploy row, no join required:
SELECT
  service,
  date_trunc('week', occurred_at)                       AS week,
  percentile_cont(0.5) WITHIN GROUP (
    ORDER BY EXTRACT(EPOCH FROM (occurred_at - first_commit_ts))
  ) / 3600.0                                             AS lead_time_p50_hours,
  percentile_cont(0.9) WITHIN GROUP (
    ORDER BY EXTRACT(EPOCH FROM (occurred_at - first_commit_ts))
  ) / 3600.0                                             AS lead_time_p90_hours,
  count(*)                                               AS deploys
FROM delivery_events
WHERE event_type = 'deploy'
  AND environment = 'prod'
  AND success = TRUE
  AND first_commit_ts IS NOT NULL
GROUP BY service, week
ORDER BY week DESC;
Two correctness notes. Report p50 and p90, not the mean, because lead-time distributions are heavily right-skewed. And guard against clock skew producing negative intervals: if a committer’s machine has a future clock, occurred_at - first_commit_ts goes negative. Filter WHERE occurred_at >= first_commit_ts or clamp at zero, and log the rejects so you can chase the bad runner.
Deployment frequency falls out of the same table trivially:
SELECT service,
       date_trunc('day', occurred_at) AS day,
       count(*) AS prod_deploys
FROM delivery_events
WHERE event_type = 'deploy' AND environment = 'prod' AND success = TRUE
GROUP BY service, day
ORDER BY day DESC;
5. Derive change failure rate and MTTR
Change failure rate is failed prod deploys over all prod deploys. Two failure signals count: a deploy that reports success=false, and a subsequent is_rollback=true deploy (a rollback is evidence the prior release failed).
WITH prod AS (
  SELECT * FROM delivery_events
  WHERE event_type = 'deploy' AND environment = 'prod'
)
SELECT
  service,
  date_trunc('week', occurred_at) AS week,
  count(*) FILTER (WHERE success = FALSE OR is_rollback)::numeric
    / NULLIF(count(*), 0) AS change_failure_rate,
  count(*) AS total_deploys
FROM prod
GROUP BY service, week
ORDER BY week DESC;
MTTR comes from correlating incident_open and incident_resolved events on incident_id. Scope to incidents tied to a service that deploys, so you measure deployment recovery rather than general reliability:
WITH incidents AS (
  SELECT
    service,
    incident_id,
    min(occurred_at) FILTER (WHERE event_type = 'incident_open')     AS opened,
    min(occurred_at) FILTER (WHERE event_type = 'incident_resolved') AS resolved
  FROM delivery_events
  WHERE event_type IN ('incident_open', 'incident_resolved')
  GROUP BY service, incident_id
)
SELECT
  service,
  date_trunc('week', opened) AS week,
  percentile_cont(0.5) WITHIN GROUP (
    ORDER BY EXTRACT(EPOCH FROM (resolved - opened))
  ) / 60.0 AS mttr_p50_minutes
FROM incidents
WHERE resolved IS NOT NULL
GROUP BY service, week
ORDER BY week DESC;
For the incident source, normalize the PagerDuty webhook into the same table. PagerDuty v3 webhooks deliver an envelope with event.event_type values like incident.triggered and incident.resolved:
@app.post("/hooks/pagerduty")
def pagerduty():
    e = request.json["event"]
    etype = {"incident.triggered": "incident_open",
             "incident.resolved":  "incident_resolved"}.get(e["event_type"])
    if not etype:
        return "", 204
    data = e["data"]
    with psycopg.connect(os.environ["DATABASE_URL"]) as conn:
        conn.execute(
            """INSERT INTO delivery_events
               (event_type, service, environment, occurred_at,
                incident_id, source, payload)
               VALUES (%s, %s, 'prod', %s, %s, 'pagerduty', %s)""",
            (etype, data["service"]["summary"], e["occurred_at"],
             data["id"], json.dumps(e)),
        )
    return "", 202
6. Model per-service vs. per-team aggregation and bands
DORA bands are defined per delivery unit, and the right unit depends on your org. A team owning one service: roll up by team. A platform team owning twenty services: per-service is the unit that drives action, with team as a secondary slice. Keep both service and team on every row (as the schema does) so you can aggregate either way without re-ingesting.
The published DORA performance bands (2024 report) are a useful, if coarse, yardstick:
| Metric | Elite | High | Medium | Low |
|---|---|---|---|---|
| Deployment frequency | On-demand (multiple/day) | Weekly to monthly | Monthly to every 6 months | Fewer than every 6 months |
| Lead time for changes | Less than one day | One day to one week | One week to one month | One to six months |
| Change failure rate | 5 percent | 10 percent | 15 percent | 64 percent (low cluster) |
| Failed deployment recovery | Less than one hour | Less than one day | One day to one week | More than six months |
Encode the bands once so dashboards and reports agree:
CREATE OR REPLACE FUNCTION lead_time_band(hours numeric)
RETURNS text LANGUAGE sql IMMUTABLE AS $$
  SELECT CASE
    WHEN hours < 24            THEN 'Elite'
    WHEN hours < 24 * 7        THEN 'High'
    WHEN hours < 24 * 30       THEN 'Medium'
    ELSE 'Low'
  END;
$$;
Resist averaging metrics across services into one org number. A platform team’s true picture is “16 of 20 services are Elite on lead time, 4 are Medium and here’s why,” not “the org is High.” The per-service breakdown is what you act on.
7. Build dashboards in Grafana (and avoid gaming)
Point Grafana at the PostgreSQL data source and back each panel with the SQL above. Use Grafana’s macros so panels respect the dashboard time range and the $service template variable:
-- Grafana panel: weekly lead time p50 per selected service
SELECT
  $__timeGroup(occurred_at, '1w')                       AS time,
  percentile_cont(0.5) WITHIN GROUP (
    ORDER BY EXTRACT(EPOCH FROM (occurred_at - first_commit_ts))
  ) / 3600.0                                            AS "lead_time_p50_hours"
FROM delivery_events
WHERE event_type = 'deploy' AND environment = 'prod' AND success
  AND service IN ($service)
  AND $__timeFilter(occurred_at)
GROUP BY 1
ORDER BY 1;
Define the $service variable as a query: SELECT DISTINCT service FROM delivery_events ORDER BY 1. The $__timeFilter and $__timeGroup macros bind to the dashboard controls automatically.
On gaming: every delivery metric has a perverse optimum. The defenses are structural, not motivational:
- Never set per-team targets on a single metric. “Deploy more” rewards splitting one deploy into ten. Always pair throughput (frequency, lead time) with stability (CFR, MTTR), so a team can’t win one by wrecking the other.
- Don’t tie metrics to performance reviews. The instant DORA is a personal KPI, the numbers become advocacy, not signal.
- Show trend, not a single number. A team going from monthly to weekly deploys is the win, regardless of which band it lands in.
- Make the pipeline the source of truth, so no one can hand-edit a value. If a number looks wrong, fix the event emission, not the dashboard.
Going deeper
You have a working pipeline. This section is for the reader who owns DORA for a platform and needs the internals, the edge cases, and the wider context.
Throughput and stability are not a trade-off — the quadrant
The most misused idea in delivery metrics is “you can have speed or safety, pick one.” The Accelerate research found the opposite: plot throughput on one axis and stability on the other, and the four quadrants are not evenly populated. Elite teams cluster in the top-right — high throughput and high stability together. Low performers sit in the bottom-left, slow and fragile. The empty quadrant is “fast but broken,” because a team that ships fast without the practices that keep it safe does not stay fast for long; it drowns in rework. This is why you never optimize one key in isolation. If a dashboard shows deployment frequency climbing while change failure rate climbs with it, that is not progress toward Elite — it is a team sliding toward the “fast but broken” corner, and the paired metric is what makes it visible before the incident review does.
The reference implementation: Google’s Four Keys and dora.dev
You just built, from first principles, roughly what Google’s open-source Four Keys project (github.com/dora-team/fourkeys) does: a collector ingests VCS/CI/incident events, normalizes them, stores them (BigQuery in their case), and dashboards the four metrics. Reading it is worth an afternoon — the event-normalization design mirrors the delivery_events table here, and it ships parsers for GitHub, GitLab, and PagerDuty you can crib from. The canonical home for the research is dora.dev, which also hosts the DORA Quick Check — a short questionnaire that places you in the bands and suggests the capabilities most correlated with improving from where you are. Point a new team at the Quick Check before you build anything: it sets a shared baseline and, more importantly, frames DORA as a mirror for improvement rather than a scoreboard.
What the DORA report actually is, and how its framing evolves
“DORA” is both a research program (DevOps Research and Assessment, the team behind Accelerate) and its annual output, the State of DevOps report. Two things a practitioner should keep straight:
- The band thresholds and even the cluster count shift year to year. Some years the report identifies four clusters (Elite / High / Medium / Low); at least one recent year the Elite cluster did not separate cleanly and only three appeared. The specific numbers in the Section 6 table are one year’s snapshot. Treat the bands as a directional yardstick — “we are roughly Medium and trending toward High” — not a fixed certification. The trend on your own trace matters far more than the exact band boundary.
- The model has grown a fifth signal and a wider frame. Recent reports pair the four delivery keys with an operational / reliability dimension (are you meeting your reliability targets?), acknowledging that delivery speed is meaningless if the service is down. Recent editions also examine second-order forces — platform engineering, developer experience, and the effect of AI-assisted coding on throughput and stability — and repeatedly find that a practice which helps individuals can still hurt system-level delivery if batch sizes and review flow are not managed. The lesson for your pipeline: the four keys are the durable core, but leave room to add a reliability signal (e.g. SLO attainment) alongside them.
DORA vs SPACE vs flow metrics
DORA is not the only measurement framework, and it deliberately does not measure everything. Know where it stops:
| Framework | Measures | Unit of analysis | Typical data source | Best question it answers |
|---|---|---|---|---|
| DORA (four keys) | Delivery throughput + stability | The delivery pipeline / deploys | Pipeline + incident events | “How well does our delivery system ship change?” |
| SPACE | Developer productivity across 5 dimensions (Satisfaction, Performance, Activity, Communication, Efficiency) | People and teams | Surveys + system signals | “Are our developers effective and healthy?” — and it exists to stop you reducing productivity to one number |
| Flow metrics (Flow Framework) | Flow of business value (velocity, time, efficiency, load, distribution) | Work items — features, defects, risk, debt — across the value stream | Work-tracking tools (Jira, etc.) | “How fast does an idea become customer value, end to end?” |
They compose rather than compete. DORA tells you the delivery pipeline is healthy; flow metrics tell you whether that pipeline is shipping the right mix of work (are 80% of your cycles going to defects and debt?); SPACE keeps you honest that a team hitting Elite DORA numbers by burning out is not actually a win. A common trap is to grab one activity signal from SPACE (lines of code, PRs merged) and treat it as a productivity KPI — which is exactly the single-metric gaming SPACE was designed to prevent. If you only have budget for one, start with DORA: it is the cheapest to instrument (you own the events) and the most directly actionable.
Edge cases that break naive lead-time
- Monorepo / multi-service deploys. One push touches three services; one pipeline deploys all three. Emit a separate deploy event per service, each with the
first_commit_tsof the commits that touched that service’s paths, or you will smear one slow service’s lead time across the fast ones. - Hotfixes and cherry-picks. A hotfix branched off a release tag has a tiny commit→deploy gap and will look Elite. That is honest — a hotfix is fast — but it drags the median down and can mask that normal changes take days. Slice hotfixes out (a label on the deploy event) when you want the “normal change” picture.
- Reverts and rollbacks. A revert is a change; the rollback deploy that carries it is a stability signal, not a throughput win. Mark
is_rollback=trueso a rollback does not count as a healthy deploy inflating frequency. - Batch size is the hidden variable. Lead time is dominated by how long code waits, not how long it builds. The single biggest lever is smaller batches and shorter-lived branches — which is why trunk-based development moves lead time more than any pipeline tuning. If your p90 lead time is weeks while p50 is hours, you have a batching problem, not a build problem.
Scaling and hardening the pipeline
- Idempotency. Webhook providers retry on timeout and CI steps get re-run, so the same event can arrive twice. Key inserts on the provider’s own delivery id (GitHub’s
X-GitHub-Deliveryheader, PagerDuty’s eventid) with a unique index andON CONFLICT DO NOTHING, or a retry silently inflates deployment frequency. (Practice challenge 6 builds this.) - Late and out-of-order events. An
incident_resolvedcan arrive before you have recorded itsincident_openif a webhook was delayed. Correlate onincident_idand compute MTTR only where both ends exist (the Section 5 query already does —WHERE resolved IS NOT NULL), and re-run derivations as a scheduled job so late arrivals are picked up. - Everything in UTC. Store
TIMESTAMPTZ, emitoccurred_atas UTC (date -u), and do timezone display only in Grafana. Mixing local times is the most common source of “impossible” negative lead times after clock skew. - Retention and PII. The
payloadJSONB is invaluable for backfill and auditing — you can replay it to recompute a metric after fixing a bug — but raw webhook payloads carry emails, usernames, and commit messages. Set a retention policy onpayload, and never expose it through a dashboard data source that analysts can query freely. - Secret hygiene. The webhook secret and the metrics ingest token are credentials: keep them in a secret store, rotate them, and verify signatures in constant time (
hmac.compare_digest, not==) so you do not leak validity through timing. For incident-recovery context and how MTTR ties into on-call, see SRE incident management, postmortems & on-call.
When there is no webhook: GitOps and pull-based deploys
The whole design assumes a deploy job you can bolt a curl onto. With GitOps (Argo CD, Flux) the deploy is a sync the CI pipeline never sees — the Enterprise scenario below solves exactly this by treating the GitOps controller’s rollout health as the deploy event source. The principle generalizes: the deploy event must come from whatever actually performs and confirms the rollout, whether that is a CI job, a Kubernetes controller watching Rollout health, or a serverless deploy hook. If you cannot instrument the thing that ships, your DORA numbers measure something other than shipping.
Verify
Confirm the pipeline produces correct, trustworthy numbers before anyone reads a dashboard.
# 1. Webhook signature path works (expect 202 for valid, 401 for tampered).
BODY='{"ref":"refs/heads/main","after":"abc123",
       "repository":{"name":"checkout","default_branch":"main"},
       "commits":[{"id":"abc123","timestamp":"2026-06-08T09:00:00Z"}]}'
SIG="sha256=$(printf '%s' "$BODY" | openssl dgst -sha256 -hmac "$GH_WEBHOOK_SECRET" | awk '{print $2}')"
curl -i -X POST localhost:8080/hooks/github \
  -H "X-GitHub-Event: push" -H "X-Hub-Signature-256: $SIG" \
  -H "Content-Type: application/json" -d "$BODY"
-- 2. No negative lead times leaked in (clock-skew guard working).
SELECT count(*) AS bad_rows
FROM delivery_events
WHERE event_type = 'deploy' AND occurred_at < first_commit_ts;
-- expect 0

-- 3. CFR denominator includes successes (not just failures).
SELECT count(*) FILTER (WHERE success)      AS ok,
       count(*) FILTER (WHERE NOT success)  AS failed,
       count(*) FILTER (WHERE is_rollback)  AS rollbacks
FROM delivery_events
WHERE event_type = 'deploy' AND environment = 'prod';

-- 4. Every resolved incident has a matching open (correlation intact).
SELECT incident_id FROM delivery_events
WHERE event_type = 'incident_resolved'
  AND incident_id NOT IN (
    SELECT incident_id FROM delivery_events WHERE event_type = 'incident_open');
-- expect 0 rows
Then sanity-check one known release by hand: pick a recent prod deploy, find its first commit in git log, and confirm the dashboard’s lead time for that week matches the wall-clock gap. If it doesn’t, the bug is in the event, not the query.
Enterprise scenario
A platform team at a payments company ran twenty-six microservices behind Argo CD. Their first DORA dashboard counted GitHub merges as deployments, and it reported the whole org as “Elite” with sub-hour lead times. Leadership loved it; the on-call engineers knew it was nonsense. The gap: a merge to main only updated a Helm values file in the GitOps repo. The actual rollout happened minutes-to-hours later when Argo CD synced and the canary analysis passed, and a non-trivial fraction of syncs were rolled back by the analysis gate. Merges massively under-counted lead time and completely missed failures.
The constraint was that the deploy outcome lived in Argo CD, not in CI, and the team couldn’t bolt a curl into a sync the way they could into a pipeline job. They solved it by treating Argo CD as the deployment event source: a Kubernetes controller watched Rollout and Application resources and emitted a deploy event only when a rollout reached Healthy in prod, with success=false when it reached Degraded and is_rollback=true when Argo CD aborted to the previous revision. The first_commit_ts came from the image tag’s commit SHA, resolved against the app repo.
# Argo CD notifications trigger -> POST a real deploy event on rollout health.
template.deploy-event: |
  webhook.metrics:
    method: POST
    path: /events/deploy
    body: |
      {
        "service": "{{.app.metadata.labels.service}}",
        "team": "{{.app.metadata.labels.team}}",
        "environment": "prod",
        "commit_sha": "{{.app.status.sync.revision}}",
        "occurred_at": "{{.app.status.operationState.finishedAt}}",
        "success": {{eq .app.status.health.status "Healthy"}}
      }
trigger.on-deployed: |
  - when: app.status.health.status in ['Healthy', 'Degraded']
    send: [deploy-event]
Once the event came from the system that actually performs the deploy, the dashboard told a true and far less flattering story: median lead time was nine hours, change failure rate was eleven percent, and two services dragged the rest. Those two became the next quarter’s focus, and lead time on them halved within two months. Same data warehouse, same Grafana; the fix was moving the event boundary to the thing that ships.
Practice challenges
Work these in order — they escalate from beginner to advanced. Each has a worked solution against the delivery_events schema; try it before you expand it.
Challenge 1 — Deployment frequency this week (beginner)
Write a query that counts successful production deploys this week, per service, from delivery_events.
<details> <summary>Solution</summary>
SELECT service, count(*) AS prod_deploys_this_week
FROM delivery_events
WHERE event_type = 'deploy' AND environment = 'prod' AND success = TRUE
  AND occurred_at >= date_trunc('week', now())
GROUP BY service
ORDER BY prod_deploys_this_week DESC;
Why: deployment frequency is nothing more than a count of successful prod-deploy rows — the table grain is already “one row per deploy,” so no window functions or joins are needed. Filtering success = TRUE keeps failed attempts out of the throughput number.
</details>
Challenge 2 — Why merges lie (beginner, conceptual)
A team merges to main about ten times a week but cuts one release every Friday. Explain, in terms of the event boundaries, why counting merges overstates deployment frequency and understates lead time.
<details> <summary>Solution</summary>
A merge is a change event, not a deploy event. Counting the ten weekly merges reports ~10 deploys/week when the team actually deployed once — a 10x overstatement of frequency. Lead time is worse: if you measure it from merge to deploy you drop the hours or days each commit sat in a feature branch before merging (the biggest chunk of real lead time), and you also collapse the Monday–Thursday wait before Friday’s release. Measured correctly — earliest commit to actual prod deploy — a change merged Monday and shipped Friday has ~4 days of lead time, not the minutes the merge-based number would show.
Why: the whole point of lead time is to expose waiting, and merges hide exactly the waiting you want to see. </details>
Challenge 3 — Clock-skew guard (intermediate)
Find deploy rows with a negative lead-time interval (a future-clocked committer), then show the WHERE clause that excludes them from the p50 calculation.
<details> <summary>Solution</summary>
-- Find the offenders
SELECT id, service, first_commit_ts, occurred_at,
       EXTRACT(EPOCH FROM (occurred_at - first_commit_ts)) AS interval_secs
FROM delivery_events
WHERE event_type = 'deploy' AND occurred_at < first_commit_ts;
Exclude them by adding one predicate to the lead-time query from Section 4:
AND occurred_at >= first_commit_ts
Why: a committer whose laptop clock is in the future makes occurred_at - first_commit_ts negative, and even one such row can pull a median down or make a mean nonsensical. Filter the impossible rows and log them (the SELECT above) so you can chase the misconfigured runner rather than silently swallowing bad data.
</details>
Challenge 4 — Emit the deploy event from GitHub Actions, non-blocking (intermediate)
Add a step to a GitHub Actions job that emits the deploy event even when the deploy failed (so success=false is recorded) and that never fails the release if the metrics endpoint is down.
<details> <summary>Solution</summary>
Give the deploy step an id, then add an emit step with if: always():
      - name: Deploy to prod
        id: deploy
        run: ./deploy.sh prod

      - name: Emit DORA deploy event (never fails the release)
        if: always()
        env:
          METRICS_INGEST_URL: ${{ vars.METRICS_INGEST_URL }}
          METRICS_TOKEN: ${{ secrets.METRICS_TOKEN }}
          SERVICE_NAME: checkout
          TEAM_NAME: payments
          DEPLOY_OK: ${{ steps.deploy.outcome == 'success' }}
        run: |
          FIRST_COMMIT_TS=$(git log --reverse --format=%cI "origin/main..HEAD" | head -1)
          [ -z "$FIRST_COMMIT_TS" ] && FIRST_COMMIT_TS=$(git show -s --format=%cI HEAD)
          curl -fsS -X POST "$METRICS_INGEST_URL/events/deploy" \
            -H "Authorization: Bearer $METRICS_TOKEN" \
            -H "Content-Type: application/json" \
            -d "{\"service\":\"$SERVICE_NAME\",\"team\":\"$TEAM_NAME\",\"environment\":\"prod\",\"commit_sha\":\"$(git rev-parse HEAD)\",\"first_commit_ts\":\"$FIRST_COMMIT_TS\",\"occurred_at\":\"$(date -u +%Y-%m-%dT%H:%M:%SZ)\",\"success\":$DEPLOY_OK}" \
            || echo "metrics emit failed (non-blocking)"
Why: if: always() runs the emit even when the deploy step failed, so the CFR denominator honestly records failures; steps.deploy.outcome yields the literal true/false JSON boolean; and || echo keeps a metrics outage out of the release’s critical path — instrumentation must never be able to fail a production deploy.
</details>
Challenge 5 — Count a fast rollback as a failure of the prior deploy (advanced)
Extend change failure rate so that a is_rollback deploy occurring within 30 minutes of a “successful” deploy for the same service marks that prior deploy as failed — and make sure the rollback itself is not double-counted as its own failed deploy.
<details> <summary>Solution</summary>
WITH deploys AS (
  SELECT * FROM delivery_events
  WHERE event_type = 'deploy' AND environment = 'prod'
),
scored AS (
  SELECT d.*,
    (d.success = FALSE
     OR EXISTS (
       SELECT 1 FROM deploys r
       WHERE r.service = d.service
         AND r.is_rollback
         AND r.occurred_at >  d.occurred_at
         AND r.occurred_at <= d.occurred_at + interval '30 minutes'
     )) AS failed
  FROM deploys d
  WHERE d.is_rollback = FALSE          -- score real deploy attempts, not the rollbacks
)
SELECT service,
       date_trunc('week', occurred_at) AS week,
       avg(failed::int)::numeric       AS change_failure_rate,
       count(*)                        AS scored_deploys
FROM scored
GROUP BY service, week
ORDER BY week DESC;
Why: a rollback minutes after a “green” deploy is strong evidence that deploy actually failed in production even though the job reported success. Attributing the failure to the preceding attempt (and excluding rollbacks from the denominator) measures “how often a deploy caused a problem” rather than double-counting the recovery action as a second failure. </details>
Challenge 6 — Make ingest idempotent (advanced)
A webhook retry delivers the same deploy event twice. Add a schema change so a duplicate is a no-op and cannot inflate deployment frequency.
<details> <summary>Solution</summary>
Key on the provider’s own delivery id and enforce it with a unique index:
ALTER TABLE delivery_events ADD COLUMN event_uid TEXT;
-- backfill existing rows a distinct value first (e.g. id::text), then:
CREATE UNIQUE INDEX uq_events_uid ON delivery_events (event_uid);
The receiver sets event_uid from the source’s delivery identifier — GitHub’s X-GitHub-Delivery header, PagerDuty’s webhook id, or for the CI deploy a deterministic "${service}:${commit_sha}:prod" — and inserts with ON CONFLICT:
INSERT INTO delivery_events
  (event_type, service, environment, commit_sha, occurred_at, success, source, event_uid, payload)
VALUES ('deploy', 'checkout', 'prod', 'abc123',
        '2026-06-08T09:00:00Z', TRUE, 'ci', 'checkout:abc123:prod', %s)
ON CONFLICT (event_uid) DO NOTHING;
Why: webhook providers retry on any timeout and CI steps get re-run, so “at-least-once” delivery is the norm. A deterministic, provider-supplied id plus a unique index turns a re-delivery into a harmless no-op — without it, one flaky network blip can quietly double a service’s deployment frequency and move it a whole band. </details>
Common beginner mistakes
- “A merge to
mainis a deployment.” A merge is a change; the deploy happens later (or never, if it is batched or the promotion fails). Right model: the deploy event is emitted by the thing that ships, so the number can only move when something actually reaches production. - “Lead time starts when the PR is merged.” No — it starts at the earliest commit in the change set. The days a branch sat unmerged are the waste lead time exists to expose; measuring from merge deletes exactly the signal you want.
- “Report the average lead time and average MTTR.” Both distributions are heavily right-skewed — one 3am rollback wrecks the mean. Right model: report p50 and p90; the median is the typical experience, the p90 is the tail you should attack.
- “Give me one DORA number for the company.” Bands are defined per delivery unit. Averaging twenty services into “the org is High” hides the two services that are on fire. Right model: per-service breakdown, roll up to team only when the team owns one service.
- “Our goal this quarter is to reach Elite.” The band is a coarse yardstick whose thresholds even shift between yearly reports. Right model: chase the trend — monthly to weekly deploys is the win regardless of which band it lands in.
- “Let’s set a deployment-frequency target per team.” Any single metric with a target gets gamed — “deploy more” rewards splitting one deploy into ten. Right model: always pair throughput with stability so a team cannot win one key by wrecking another, and keep it off performance reviews.
- “Change failure rate is incidents divided by deploys.” The denominator is total deploys, not incidents, and the numerator is failed deploys (including rollbacks) — which means you must record successful deploys too. A pipeline that only logs failures can never compute CFR.
- “MTTR covers every incident we have.” Scope it to deployment-linked failures. A failed disk or an upstream provider outage is reliability, not delivery — folding it in makes your recovery metric measure something DORA never intended.
- “We put DORA on a dashboard, so delivery will improve.” Metrics are a mirror, not a lever. You improve by changing practices — smaller batches, test automation, decoupled deploys, fast rollback — and then watch the numbers move. Staring at the chart changes nothing.
Glossary
- DORA — DevOps Research and Assessment, the research program (and its authors of Accelerate) behind the four keys; also shorthand for the metrics themselves and the annual State of DevOps report.
- The four keys — the four DORA metrics: deployment frequency, lead time for changes, change failure rate, and failed deployment recovery time.
- Deployment frequency — how often you successfully release to production; one of the two throughput metrics.
- Lead time for changes — elapsed time from the earliest commit in a change set to that change running in production; the other throughput metric.
- Change failure rate (CFR) — the fraction of production deploys that cause a failure (
failed_deploys / total_deploys); one of the two stability metrics. - Failed deployment recovery time — time to recover from a deployment-induced production failure; the 2024 rename of what was called MTTR (mean time to restore); the other stability metric.
- Throughput — the speed-and-frequency dimension of delivery (deployment frequency + lead time).
- Stability — the safety dimension of delivery (change failure rate + recovery time); the research shows it rises with throughput, not against it.
- Performance bands / clusters — Elite / High / Medium / Low groupings the DORA report assigns per metric; a directional yardstick whose thresholds shift year to year.
- Accelerate — the 2018 book (Forsgren, Humble, Kim) that established the four keys as predictive of organizational performance.
- Four Keys — Google’s open-source reference implementation (
github.com/dora-team/fourkeys) that ingests events and dashboards the four metrics. - dora.dev / DORA Quick Check — the research program’s official site and its short self-assessment that places a team in the bands.
- Deploy event — an explicit, timestamped record emitted by the deploy step saying which service/version reached which environment and whether it succeeded; the anchor of the whole pipeline.
- Change event — a merge/push to the default branch; a change, distinct from a deploy.
first_commit_ts— the timestamp of the earliest commit in a change set; the correct start of lead time.- Event boundary — the pair of timestamps a metric is measured between (e.g.
first_commit_ts→deployed_tsfor lead time); getting the boundary right is most of the accuracy. - p50 / p90 (percentile) — the median and 90th-percentile of a distribution; used instead of the mean because lead-time and recovery distributions are right-skewed.
percentile_cont— the PostgreSQL ordered-set aggregate that computes a continuous percentile (e.g. p50) over a group.- Webhook — an HTTP POST a system (GitHub, PagerDuty) sends you when an event happens; the ingestion path for changes and incidents.
- HMAC signature — a keyed hash (GitHub uses HMAC-SHA256) a provider attaches to a webhook so you can verify it is genuine before trusting the body; compare it in constant time.
- Idempotency / dedup key — designing ingest so the same event delivered twice inserts once, keyed on a provider delivery id with a unique index; prevents retries inflating counts.
- Clock skew — a mis-set machine clock producing impossible (negative) intervals; guarded by rejecting rows where
occurred_at < first_commit_ts. - Value stream — the end-to-end flow from idea to delivered customer value; the frame flow metrics measure and the wider context DORA sits within.
- SPACE — a five-dimension framework (Satisfaction, Performance, Activity, Communication, Efficiency) for developer productivity; complements DORA and exists to prevent single-metric measurement.
- Flow metrics — the Flow Framework’s measures (flow velocity, time, efficiency, load, distribution) of business value moving through the value stream, tracked over work items.
- Gaming — optimizing a metric in ways that improve the number without improving delivery (e.g. splitting one deploy into ten); defended against structurally by pairing throughput with stability and never tying metrics to reviews.