In a nutshell
Ask a beginner “is your system reliable?” and they point at a dashboard where CPU is green and every service says healthy. That is the wrong place to look. Reliability — the fourth pillar of the Google Cloud Architecture Framework — starts from a single reframing that changes everything downstream: reliability is defined by the user’s experience, not by server-side health. A node can be pegged at 100% CPU, a pod can be crash-looping, a background task can be dead — and none of that is an outage if user requests are still succeeding within their latency target. The flip side is worse: every dependency can report “healthy” while users stare at 503s. So the pillar’s job is to take the vague sentence “it must be highly available” and turn it into an evidenced, measured, and tested promise.
The cleanest mental model is a city’s electricity grid. The utility’s promise is measured at your socket — “power is there 99.98% of the time” — not “the turbine is spinning.” A whole generator can trip and you never notice, because others carry the load (that is why you measure user requests, not CPU). Regulators allow a small budget of outage-minutes per year; promise zero and you could never take a line down for maintenance (that is your error budget). The grid runs N+1 redundancy — multiple plants, substations, and transmission paths — so losing one doesn’t darken the city (redundancy across failure domains: zone → region → global). During a heatwave peak it will drop voltage or shed non-critical districts rather than collapse the whole grid (graceful degradation and load shedding). Utilities rehearse restarting a dead grid from cold and switching to backup feeds (DR game-days and chaos testing). And they hold reserve generating margin for the summer peak, booked ahead of time (capacity and quota planning). Every reliability move you’ll learn maps onto something a grid operator already does.
Those moves are exactly the seven engineering sub-components this lesson teaches, and Google organizes them under four focus areas — Scoping, Observation, Response, Learning — and nine principles. Here is the map from the grid, to the practice, to the section:
| In a power grid | On Google Cloud (this lesson) | Section |
|---|---|---|
| Measure power at the socket, not the turbine | Measure the success ratio of user requests, not CPU | SLIs, SLOs & error budgets |
| A regulated allowance of outage-minutes | The error budget = 100% − SLO, spent deliberately | SLIs, SLOs & error budgets |
| N+1 generators, substations, transmission paths | Redundancy across zones / regions / global | Redundancy across failure domains |
| Brownout beats blackout | Graceful degradation — serve stale / partial | Graceful degradation |
| Backup feeds & black-start drills | DR (RTO/RPO), self-healing, chaos game-days | Failure recovery; Chaos testing |
| Reserve margin for the heatwave | Capacity + quota reserved ahead of the surge | Capacity & quota planning |
Level: Advanced · Time: ~47 min
Prerequisites. You should have read the framework’s System Design pillar (the topology that reliability hardens) and Operational Excellence (the observability and safe-change discipline this pillar rests on), and be comfortable defining SLOs in the Cloud Monitoring / Logging operations suite. The DR patterns here are taken further in DR & resilience architecture.
After this lesson you will be able to:
- Define reliability from the user’s experience — inventory critical user journeys and express each as an SLI/SLO with an error budget and a written budget policy.
- Do the composite-availability math on a dependency chain and know when the SLO you promised is mathematically impossible without redesign.
- Choose the right redundancy tier (zone / region / global, active-active vs active-passive) driven by SLO and RTO/RPO, using the correct GCP regional/multi-region building blocks.
- Convert a hard dependency to a soft one and design graceful degradation — caching, queues, circuit breakers, backoff, and load shedding.
- Set honest RTO/RPO per journey, map each to a DR pattern, and defend against the failure classes replication propagates rather than survives.
- Prove the whole design with chaos game-days, shrink MTTR with burn-rate detection, and reserve capacity and quota so a failover never hits a wall.
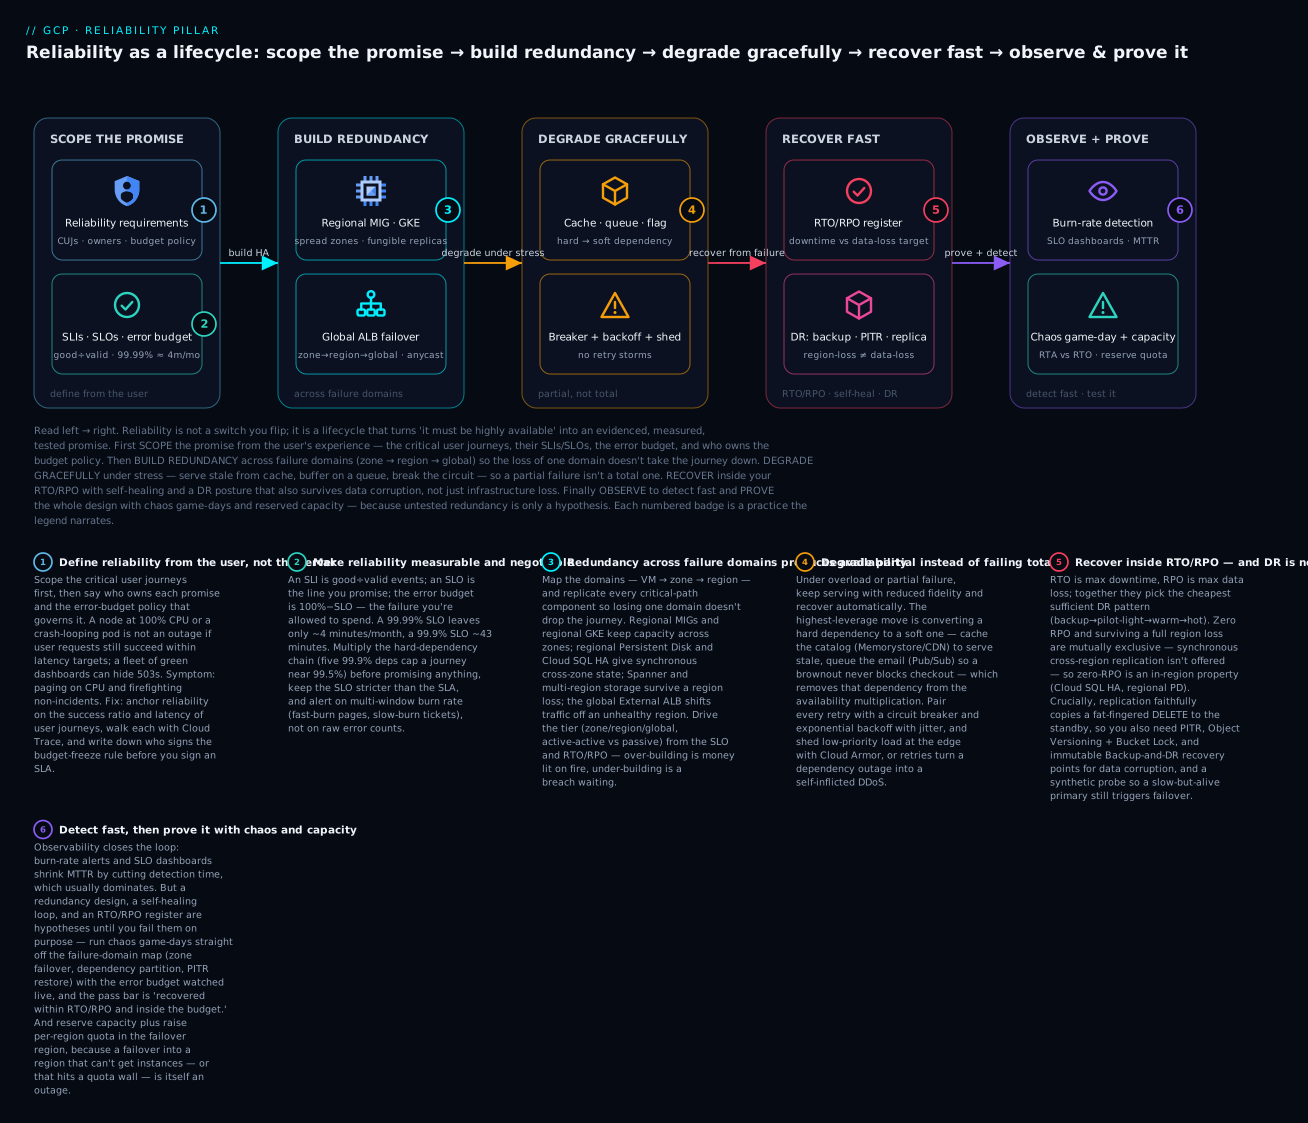
Read the diagram left → right: you scope the promise (critical user journeys, SLIs/SLOs, error budget, and who owns the budget policy), build redundancy across failure domains so losing one zone or region doesn’t drop the journey, degrade gracefully by converting hard dependencies to soft ones and breaking circuits under stress, recover fast inside your RTO/RPO with self-healing and a DR posture that also survives data corruption, and finally observe and prove the design with burn-rate detection, chaos game-days, and reserved capacity — because untested redundancy is only a hypothesis. The numbered badges are the practices the sections below unpack.
Where this fits
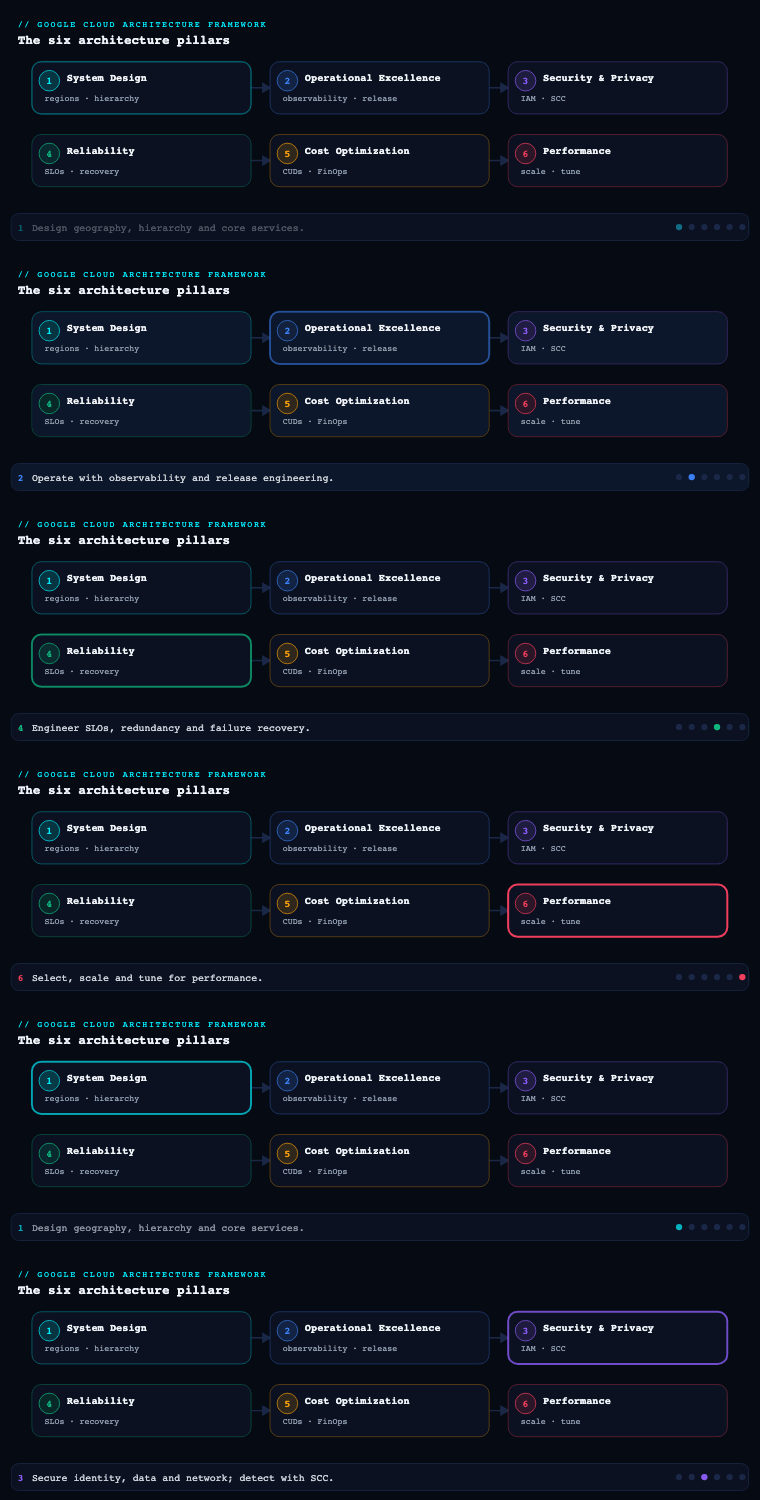
The Google Cloud Architecture Framework organizes Google’s guidance into pillars — System Design, Operational Excellence, Security/Privacy/Compliance, Reliability, Cost Optimization, and Performance Optimization — and Reliability is part 4 of this series. It sits deliberately after System Design (part 1) and Operational Excellence (part 2), because reliability is not a property you bolt on: it is the discipline of taking the topology you chose in System Design and the observability and automation you built in Operational Excellence, and turning a vague “it must be highly available” into an evidenced, measured, and tested set of promises. Google frames the pillar around four focus areas — Scoping, Observation, Response, and Learning — and a set of nine principles, all anchored on one reframing that runs through the whole pillar: reliability is defined by the user’s experience, not by server-side health. This article walks the seven engineering sub-components that operationalize those principles: the reliability principles themselves, SLIs/SLOs/error budgets, redundancy, graceful degradation, failure recovery, chaos testing, and capacity planning.
Reliability principles — the design philosophy and the four focus areas
What it is. The Reliability pillar is expressed as nine principles grouped under four focus areas. The focus areas are the lifecycle frame — Scoping (understand the system, its components, and how they fail), Observation (detect problems proactively), Response (recover efficiently, ideally automatically), and Learning (stop failures recurring). The nine principles are the concrete practices that live inside those areas:
| # | Principle (official title) | Focus area | The sub-component it drives |
|---|---|---|---|
| 1 | Define reliability based on user-experience goals | Scoping | SLIs/SLOs |
| 2 | Set realistic targets for reliability | Scoping | SLOs & error budgets |
| 3 | Build highly available systems through resource redundancy | Scoping | Redundancy |
| 4 | Take advantage of horizontal scalability | Scoping | Redundancy / capacity |
| 5 | Detect potential failures by using observability | Observation | Detection (feeds all) |
| 6 | Design for graceful degradation | Response | Graceful degradation |
| 7 | Perform testing for recovery from failures | Response | Failure recovery / chaos |
| 8 | Perform testing for recovery from data loss | Response | Failure recovery (data) |
| 9 | Conduct thorough postmortems | Learning | Learning loop |
A tenth principle that Google publishes alongside these in the pillar’s recommendations — Manage capacity and quota — is the capacity-planning sub-component this article also covers.
Why it matters. The principles encode the single most important shift in the pillar: principle 1 insists you define reliability from the user’s perspective, not from CPU, memory, or “is the task running.” A node can be pegged at 100% CPU, a pod can be crash-looping, and a task can have died — and none of that is an outage if user requests are still succeeding within latency targets. Conversely, every dependency can report “healthy” while users see 503s. Server-centric metrics routinely mislead teams into firefighting non-incidents and missing real ones; the principles redirect attention to the success ratio of user requests and the latency of user journeys. The rest of the pillar — redundancy, degradation, recovery, capacity — exists only to keep that user-facing success ratio above an agreed line.
How to do it well. Treat the four focus areas as the order of work: scope the critical user journeys and their dependencies first; stand up observation that measures the journeys (not just the servers); design the response mechanisms (redundancy, degradation, self-healing, failover); and close the learning loop with blameless postmortems. Use Cloud Trace to walk a real user’s request through the system and find the latency-contributing hops, because that trace is the map of what your SLIs must measure. The anti-pattern is jumping straight to “deploy in three zones” before you have written down which journeys matter and what success means for them.
Artifacts & GCP tooling. The principles are operationalized through the Architecture Framework / Well-Architected content and the Cloud Well-Architected review as a design gate; Active Assist and Recommender surface reliability anti-patterns per resource. The output of this sub-component is a critical-user-journey (CUJ) inventory and a reliability requirements document recording the user-experience goals each journey must honor.
SLIs, SLOs, and error budgets — making reliability measurable and negotiable
What it is. This is the heart of Google’s SRE practice and of principles 1 and 2. The three terms are precise and must not be blurred:
| Term | Definition | The question it answers | GCP expression |
|---|---|---|---|
| SLI (indicator) | A quantitative measure of some aspect of service level — usually good events ÷ valid events |
“How good is the service right now?” | A request-based or windows-based ratio in Cloud Monitoring service monitoring |
| SLO (objective) | A target value or range for an SLI over a rolling window | “What’s the line we promise to stay above?” | An SLO object on a Service in Cloud Monitoring |
| SLA (agreement) | A contract with consequences (credits) if the SLO is missed | “What do we owe if we breach?” | Commercial contract; SLO should be stricter than SLA |
| Error budget | 100% − SLO over the window — the allowed unreliability |
“How much failure can we spend?” | Derived from the SLO; tracked as burn rate |
Why it matters. The error budget is the pillar’s most powerful idea because it converts reliability from a moral argument into an accounting one. The gap between 100% and your SLO is a budget you are allowed to spend — on risky deploys, experiments, and feature velocity. A concrete anchor: a 99.99% availability SLO over a rolling 30 days yields an error budget of about 4 minutes of allowed downtime; a 99.9% SLO yields roughly 43 minutes. That single number ends most “let’s just promise five nines” conversations, because four minutes a month leaves essentially no room for a bad deploy, a noisy dependency, or a maintenance window. The budget also resolves the eternal dev-vs-SRE tension with a rule, not a fight: while budget remains, ship features; when it is exhausted, the policy freezes risky changes and the team’s priority shifts to reliability work until the budget recovers.
Choosing the SLI — the request/success model. Google’s canonical SLI types map to the journey:
| SLI type | Good ÷ valid definition | Best for |
|---|---|---|
| Availability | successful responses ÷ valid requests | Almost every request/response flow |
| Latency | requests faster than threshold ÷ valid requests | User-perceived speed (set a threshold, e.g. 95% < 400 ms) |
| Quality | full-fidelity responses ÷ valid responses | Services that degrade (full vs degraded answers) |
| Freshness | data younger than threshold ÷ valid data | Pipelines, caches, replicas |
| Correctness / coverage | correct records ÷ records processed | Batch/data jobs |
You compute these from real signals — request-based SLIs divide good requests by total; windows-based SLIs count good time-windows. In Cloud Monitoring you build them from Application Load Balancer request metrics, Cloud Run / GKE request counts, Cloud Trace latency distributions, or log-based metrics.
How to do it well.
- Set the SLO from the user, then verify it is achievable. Define what users actually need (most users do not perceive the difference between 99.9% and 99.99%), then sanity-check against the composite of your hard dependencies — series dependencies multiply, so five hard components at 99.9% each cap a journey near 99.5%, already below a 99.9% promise. That math forces a redesign (reduce hard dependencies, add redundancy, or convert hard to soft via caching/queues) before you sign anything.
- Make the SLO stricter than the SLA. Always keep an internal buffer so you detect and react before the contractual line is crossed.
- Alert on burn rate, not raw errors. Google’s recommended pattern is multi-window, multi-burn-rate alerting: a fast-burn alert (e.g. the canonical 14.4x burn rate, which would exhaust a 30-day budget in ~2 days, confirmed over a short and a longer window) pages for acute events; a slow-burn alert (e.g. ~3x, ~6x) opens a ticket for chronic erosion. This is what stops both alert fatigue (paging on a 30-second blip) and silent budget drain.
- Pick the right window. Rolling 28- or 30-day windows are typical; calendar-aligned windows tie to business reporting.
Artifacts & GCP tooling. Produce an SLO specification per CUJ (SLI definition, target, window, rationale) and a composite-availability calculation from the dependency chain. The native tool is Cloud Monitoring service-level objectives (define a Service, attach SLOs, view error-budget burn on the SLO dashboard, and configure burn-rate alerting policies). For GKE/microservices, Cloud Service Mesh can auto-discover services and help author SLOs from telemetry. Error-budget policy (what happens when it is spent) is a written document, not a tool — and it is the artifact most teams skip.
Redundancy across failure domains — turning resilience into availability
What it is. Principles 3 (“build highly available systems through resource redundancy”) and 4 (“take advantage of horizontal scalability”). Redundancy means mapping your failure domains — from a single VM, to a zone, to a region — and deploying replicated, independent copies of every component on a critical path so the loss of one domain does not take the journey down. On Google Cloud the domain hierarchy is explicit: a zone is an isolated failure domain within a region (independent power/cooling/network at the relevant layer), and a region is an independent geography composed of multiple zones.
Why it matters. Redundancy is the mechanism that produces the availability your SLO promises. But the level of redundancy is where most reliability money is won or lost: putting a flow that tolerates an hour of downtime into an active-active multi-region topology is money lit on fire, while running a database that backs a four-nines journey in a single zone is a breach waiting to happen. The level must be driven by the SLO and RTO/RPO, and it must respect data gravity — stateless tiers go multi-zone almost for free, while stateful tiers force the hard replication and consistency decisions.
How to do it well — choose the redundancy tier per component.
| Tier | Protects against | GCP building blocks | Cost/complexity step |
|---|---|---|---|
| Single zone | Nothing beyond instance/disk faults | Zonal MIG, zonal PD, single-zone GKE | Baseline — avoid for critical paths |
| Multi-zone (regional) | Loss of one zone | Regional managed instance group, regional GKE / Autopilot, regional Persistent Disk / Hyperdisk (synchronous cross-zone), Cloud SQL HA (regional, standby in 2nd zone), zonal NEGs behind a regional LB | The modern default for “in-region HA” |
| Multi-region | Loss of a whole region | Spanner multi-region, Cloud Storage dual/multi-region, BigQuery multi-region, Firestore multi-region, cross-region replicas, global LB across regional backends | Forces replication, consistency, and routing decisions |
| Global (anycast frontend) | Regional ingress / latency | Global External Application Load Balancer + Cloud CDN + Cloud Armor on Google’s anycast edge | The front door that ties regions together |
Then confront the active-active vs active-passive decision explicitly, because it sets your routing and data-consistency design:
| Decision | Active-passive (warm standby) | Active-active |
|---|---|---|
| Cost | One region full, one minimal | Two+ regions at full freight |
| RTO | Minutes (failover required) | Near-zero (already serving) |
| Data | Async cross-region replication (non-zero RPO) | Multi-write (Spanner) or partitioned-by-region |
| Complexity | Failover orchestration & testing | Conflict resolution, global routing, split-brain |
| Routing | DNS / global LB failover on health | Global LB active load distribution across regions |
| When | Most enterprise workloads | Only when SLO + RTO/RPO truly demand it |
The decisive GCP-specific moves: use regional resources by default (a regional MIG keeps capacity across zones; regional Persistent Disk gives synchronous two-zone block replication so a database VM survives a zone loss; Cloud SQL HA runs a standby in a second zone with automatic failover), reach for Spanner when you need horizontal scale with strong consistency and multi-region availability (its multi-region configurations carry a 99.999% availability SLA and remove application-level sharding), and front everything with the global External Application Load Balancer so traffic shifts off an unhealthy region automatically. Principle 4’s horizontal-scalability angle matters here too: redundant replicas should also be the unit of scale — stateless, fungible instances behind an autoscaler — so the same design that survives a failure also absorbs load.
Artifacts & GCP tooling. Deliver a per-tier redundancy decision record (zone / region / global + active-active vs passive), a failure-domain map per critical journey, a region-pair selection with data-residency justification, and the Terraform / Infrastructure Manager that encodes zone and region spread so it is repeatable and reviewable. The non-negotiable rule: redundancy you have never failed over is a hypothesis, not a control — which is why principle 3 is inert without principle 7.
Graceful degradation — failing partial instead of total
What it is. Principle 6, in the Response focus area. Graceful degradation is designing a system so that under overload or partial failure it continues to serve, with reduced functionality, fidelity, or freshness, rather than failing completely — and recovers full function automatically when conditions normalize. It is the structural complement to the quality SLI: a degraded-but-serving response is still a good-ish event, and a well-degraded system keeps its availability SLO even while its quality SLO dips.
Why it matters. Without degradation, every dependency is a hard dependency — its failure is your failure, and the composite-availability multiplication drags your achievable SLO down. The single highest-leverage reliability move in many designs is converting a hard dependency to a soft one: cache the product catalog so the catalog service’s outage downgrades to stale-but-served; queue the order-confirmation email so the mail provider’s brownout never blocks checkout; return last-known position when the live-tracking feed stalls. Each conversion removes that dependency from the availability multiplication entirely. Degradation is also the antidote to retry storms and cascading failure: a system that sheds load gracefully protects the very dependencies that are struggling.
How to do it well — the GCP toolkit of degradation patterns.
| Pattern | What it does | GCP mechanism |
|---|---|---|
| Caching / serve-stale | Answer from cache when source is down | Memorystore (Redis/Valkey), Cloud CDN, HTTP cache headers, stale-while-revalidate |
| Asynchronous decoupling | Buffer work so a slow consumer deepens a queue, not a failure | Pub/Sub between tiers; queue-based load leveling |
| Circuit breaker + backoff | Stop hammering a sick dependency; fail fast to a fallback | App-level breakers; Cloud Service Mesh / Envoy outlier detection & retries with backoff |
| Load shedding & rate limiting | Drop low-priority work to protect the core | Cloud Armor rate-limiting/throttling rules at the edge; priority queues |
| Bulkheads / isolation | Contain a failure to one partition | Separate pools, cell-based partitioning, per-tenant quotas |
| Timeouts & fallbacks | Bound waits; return a default/partial answer | Aggressive client timeouts; feature flags to disable non-critical features |
| Throttling autoscaler-aware | Cap concurrency to protected backends | Cloud Run max-instances / concurrency; GKE HPA + PodDisruptionBudgets |
How to apply it. Walk each critical journey and classify every dependency as hard or soft; for each currently hard dependency, decide whether a cache, queue, default value, or feature flag can make it soft, and design the fallback explicitly (what does “degraded” actually return?). Pair every retry with a circuit breaker and exponential backoff with jitter — retries without a breaker convert a dependency outage into a self-inflicted DDoS that takes the dependency down harder. Put Cloud Armor rate-limiting at the edge so a traffic spike or abusive client is shed before it reaches origin, and use Pub/Sub to absorb downstream slowness as backlog rather than front-door errors. Surface degradation explicitly via the quality SLI so you can see when the system is running degraded and for how long.
Artifacts & GCP tooling. Produce a hard/soft dependency map per journey, a degradation design per critical dependency (fallback behavior + the feature flags that toggle it), and the quality SLI definitions that measure degraded-vs-full responses. Tooling: Memorystore, Cloud CDN, Pub/Sub, Cloud Armor, Cloud Service Mesh (retries, timeouts, outlier detection), and feature-flag configuration (e.g. via a config service or Firebase Remote Config for client tiers).
Failure recovery — RTO/RPO, automated response, and recovering from data loss
What it is. Principles 7 (“perform testing for recovery from failures”) and 8 (“perform testing for recovery from data loss”), in the Response focus area. Recovery is governed by two numbers set per critical journey: RTO (Recovery Time Objective) — the maximum acceptable downtime before recovery — and RPO (Recovery Point Objective) — the maximum acceptable data loss measured in time. RTO selects your recovery mechanism and speed; RPO selects your replication and backup cadence. They are distinct knobs that, together, select your DR architecture and its bill.
Why it matters. RTO and RPO are not aspirations to minimize blindly — driving both to zero is the most expensive mistake in the pillar, because zero RPO and surviving a full region loss are mutually exclusive: synchronous cross-region replication is not physically offered (the speed of light forbids it at distance), so zero data loss is an in-region property. Stating honest, per-journey RTO/RPO is what justifies the cheapest sufficient DR pattern instead of defaulting to active-active everywhere. Equally important is principle 8’s distinction: DR is not backup. Cross-region replication faithfully copies a logical-corruption or a fat-fingered DELETE to the standby in milliseconds — so you also need point-in-time recovery and immutable backups to recover from data loss/corruption, which is a different failure class from infrastructure loss.
How to do it well — map each RTO/RPO pair to a GCP pattern.
| Pattern | Typical RTO | Typical RPO | GCP mechanism | Relative cost |
|---|---|---|---|---|
| Backup & restore | Hours–days | Hours (last backup) | Backup and DR Service, Cloud SQL automated backups, Cloud Storage snapshots/exports | Lowest |
| Pilot light | Tens of min | Minutes | Core data replicated (async) to a 2nd region; compute scaled up on failover | Low |
| Warm standby (active-passive) | Minutes | Seconds–minutes | Cross-region read replica promoted; global LB shifts traffic | Medium |
| Hot / active-active | Near-zero | Near-zero (in-region sync) | Spanner multi-region; partitioned multi-region writes; global LB across live regions | Highest |
| In-region synchronous HA | Seconds | Zero | Cloud SQL HA (standby zone), regional Persistent Disk, AlloyDB HA | Medium (no region-loss cover) |
The GCP recovery toolkit:
- Automated, observable response (principle 5 feeds this). Self-healing should handle common faults without a human: regional MIGs with autohealing health checks replace unhealthy VMs; GKE reschedules pods and Cloud Run replaces failed instances; Cloud SQL / AlloyDB failover is automatic to the standby. Human-paged recovery rarely meets a tight RTO, so the more of the recovery path is automated and tested, the lower your achievable RTO.
- Recovering from infrastructure loss. Promote a cross-region replica (Cloud SQL, AlloyDB) or perform a Spanner multi-region role shift, then move traffic with the global External Application Load Balancer or Cloud DNS failover. Keep the standby region’s IaC applied so capacity exists to scale into.
- Recovering from data loss/corruption. Use point-in-time recovery (Cloud SQL PITR, AlloyDB), Cloud Storage Object Versioning + retention policy / Bucket Lock (WORM, immutable), Spanner backups and PITR, and the Backup and DR Service for application-consistent, immutable recovery points. These defend against the failure class that replication propagates rather than survives.
The brownout caveat. A failover that triggers only on a hard outage does not protect against a sick-but-alive primary (high-latency brownout). Pair the failover trigger with a synthetic probe (an uptime check / SLI-based signal) so a primary that is up-but-slow is detected and, if it breaches the journey’s latency SLO, fails over.
Artifacts & GCP tooling. Deliver an RTO/RPO register per journey, a DR runbook (structured, documented, and tested) covering both region-loss and data-loss scenarios, and the backup/replication policy per data store. Record the RTA (Recovery Time Actual) measured in drills next to the RTO so the gap is visible. Tooling: Backup and DR Service, Cloud SQL/AlloyDB HA + cross-region replicas + PITR, Spanner backups/PITR, regional Persistent Disk, Cloud Storage versioning/Bucket Lock, regional MIG autohealing, and global LB / Cloud DNS for traffic shifting.
Chaos testing — proving the recovery design with deliberate fault injection
What it is. The testing half of principles 7 and 8 — periodically and deliberately injecting the faults you enumerated (zone failovers, region failovers, release rollbacks, dependency outages, data restores) and verifying the system withstands the fault, scales under demand, and recovers within its RTO/RPO. Google’s guidance is explicit that the objectives include validating RTO and RPO, assessing fault tolerance under varied failure scenarios, and confirming automated failover mechanisms actually work.
Why it matters. A redundancy design (principle 3), a self-healing loop (principle 5), and an RTO/RPO register are all hypotheses until you fail them on purpose and watch the response. Chaos testing is the one activity that validates every prior sub-component at once: it proves the redundancy fails over inside RTO, the degradation actually sheds load instead of cascading, the recovery automation fires, and the SLO/error-budget instrumentation actually detects the event. The pass criterion is not “it recovered” but “it recovered within RTO/RPO and inside the error budget.”
How to do it well — disciplined experiments, not breakage.
- Form a hypothesis tied to an SLO: “loss of zone
asia-south1-afails the Cloud SQL primary over to its standby in under 60 s with no breach of the booking journey’s 99.95% SLO.” - Bound the blast radius — non-production first, then a controlled production game day with the error budget watched live and an abort condition ready (and only run in production if budget remains).
- Inject a fault from the failure-domain map — kill a GKE pod (
kubectl delete pod) to test probes; cordon/drain a node; sever a dependency with a firewall rule; inject latency; trigger a Cloud SQL failover; force a regional MIG instance recreation; restore a backup into a scratch project to time RPO/RTO. - Measure RTA against RTO and confirm self-healing and degradation behaved as designed.
- Capture results in a reliability scorecard and feed gaps back into the failure-domain map and the DR runbook.
The GCP reality on tooling. Google does not ship a first-party managed chaos service equivalent to a hosted fault-injection product; chaos engineering on GCP is assembled from primitives and open-source tools. The practical toolkit:
| Capability | How you do it on GCP |
|---|---|
| Kill/disrupt workloads | kubectl delete pod, node cordon/drain, GKE + open-source Chaos Mesh or LitmusChaos for pod/network/IO/stress faults |
| Network faults / partition | VPC firewall rules to block a dependency; service-mesh fault injection (Cloud Service Mesh / Envoy abort & delay) |
| Stress / resource pressure | stress-ng, Chaos Mesh stress experiments, latency injection at the mesh |
| Zone / region failover | Trigger Cloud SQL / AlloyDB failover; recreate a zone’s MIG instances; drain a region’s backend from the global LB |
| Data-loss drill | Restore a PITR / Backup and DR recovery point into an isolated project and measure RPO/RTO |
| Scale-under-demand | Load tests (open-source k6/Locust on GKE, or Cloud Load Balancing synthetic traffic) to validate horizontal scaling and capacity |
Artifacts & GCP tooling. Deliverables: a chaos experiment catalog mapped one-to-one to failure-domain rows, game-day runbooks with explicit abort criteria, and a reliability scorecard per journey (SLO attainment, error budget remaining, zone/region failover RTA, RPO measured). Validate the “scale under demand” half with load testing against autoscaled Cloud Run / GKE tiers, and watch the run on the Cloud Monitoring SLO dashboards so the experiment’s impact on the error budget is visible in real time.
Capacity and quota planning — having the resources when the failure happens
What it is. The Manage capacity and quota principle. Capacity planning ensures that sufficient capacity is reserved in every region you intend to fail into, or that the risks of relying on emergency autoscaling are explicitly accepted. Quota management ensures the per-project, per-region service limits that gate your scaling paths are raised ahead of need. The two are tightly coupled to reliability because a failover into a region that lacks capacity — or a scale-up that hits a quota wall — is an outage, no matter how good the redundancy design looked on paper.
Why it matters. This is the sub-component teams most often discover during an incident. Two classic failure modes: (1) you designed active-passive DR but never reserved capacity in the standby region, so when the primary fails and everyone fails over at once, the standby cannot get enough instances and your beautiful failover degrades into a brownout; (2) a traffic surge or a failover doubles your instance count and you hit a Compute Engine CPU quota or a Cloud Run max-instances ceiling, and the autoscaler simply stops scaling. Google’s guidance is blunt: do data-driven capacity planning using load tests and traffic forecasts, and either reserve capacity or consciously accept the autoscaling risk — silence is not an option.
How to do it well.
- Forecast from data, validate with load tests. Build traffic forecasts from historical peaks (festival sales, month-end, marketing events) and confirm the architecture serves the forecast peak with a load test, so the capacity number is measured, not guessed.
- Reserve capacity where failover demands certainty. Use Compute Engine reservations (on-demand capacity reservations) to guarantee instances exist in the standby region/zone; for steady baseline use committed use discounts (CUDs) to lock in both capacity economics and presence. For Spot-tolerant work, plan around Spot VM preemption rather than depending on it for the critical path.
- Right-size the autoscalers and their headroom. Configure MIG autoscaling, GKE cluster autoscaler / node auto-provisioning, Cloud Run max-instances/concurrency, and HPA with enough headroom that a failover-driven spike (often a near-doubling) does not saturate them; account for scale-up latency (new nodes/VMs take time) by keeping warm capacity for tight-RTO journeys.
- Manage quotas as a first-class reliability artifact. Inventory the per-project, per-region quotas on every scaling path (Compute CPUs, in-use IPs, Cloud Run instances, Spanner nodes, NAT IPs/ports, LB resources, API rates), request increases to ≥ projected peak in every active and standby region, and monitor consumption. Use Cloud Quotas (and quota-usage alerts) so you are warned before you hit a ceiling, not after.
| Lever | Reliability purpose | GCP mechanism |
|---|---|---|
| Capacity reservation | Guarantee standby-region capacity for failover | Compute Engine reservations, CUDs |
| Autoscaling | Absorb demand and replace failed capacity | MIG autoscaler, GKE cluster autoscaler / NAP, Cloud Run autoscaling, HPA |
| Quota headroom | Stop scaling from hitting a wall | Cloud Quotas, quota increase requests, usage alerts |
| Load testing & forecasting | Make the capacity number evidence-based | k6/Locust on GKE, traffic forecasts from Monitoring history |
| Headroom for scale-up latency | Cover the seconds/minutes new capacity takes | Min-instances / warm pools / pre-provisioned standby |
Artifacts & GCP tooling. Produce a capacity plan per journey (forecast peak, reserved vs autoscaled, standby-region capacity strategy), a quota register mapping every scaling path to its per-region limit and headroom, and load-test results validating the forecast. Tooling: Compute Engine reservations / CUDs, MIG & GKE autoscaling, Cloud Run scaling controls, Cloud Quotas with monitoring alerts, and Cloud Monitoring as the source of historical traffic for forecasting.
Going deeper
Composite availability, formalized — series multiplies, parallel divides the risk. Two components on the same critical path are in series: the journey needs both, so their availabilities multiply — A_total = A₁ × A₂ × … × Aₙ. That is why five hard dependencies at 99.9% each yield 0.999⁵ ≈ 0.995 = 99.5%, already below a 99.9% promise, and why adding a sixth hard dependency lowers your ceiling no matter how good your code is. Redundancy flips the arithmetic: two independent replicas of the same component are in parallel, and the journey survives if either lives, so the unavailabilities multiply — A = 1 − (1 − A₁)(1 − A₂). Two 99% replicas in parallel give 1 − 0.01² = 0.9999 = 99.99% — two nines become four. This is the mathematical reason redundancy produces availability and why the single most powerful SLO move is often removing a hard dependency (converting it to soft) rather than hardening it: a removed series term stops multiplying your ceiling down entirely. Independence is the fine print — two “replicas” that share a zone, a disk, or a control plane are not really parallel, and the formula quietly overstates your availability.
Burn-rate arithmetic — why 14.4 and 6 are the magic numbers. An SLO implies a budget: 99.9% over 30 days allows 0.1% × 43,200 min ≈ 43.2 minutes of “bad” per month. Burn rate is how fast you spend it relative to the sustainable pace, so time-to-exhaust = window ÷ burn rate — a 10× burn empties a 30-day budget in 3 days. Google’s SRE workbook derives the paging thresholds from how much budget you’ll tolerate spending before someone acts: a 1-hour window at 14.4× consumes 14.4 × (1 ÷ 720) ≈ 2% of the month’s budget — page-worthy; a 6-hour window at 6× consumes ≈ 5% — ticket-worthy. Requiring a short and a long window to be burning simultaneously suppresses one-minute spikes while still catching a slow leak. That is why you alert on burn rate, not on a raw error count: the same 50 errors are noise at 2 a.m. and a Sev1 at peak.
Request-based vs windows-based SLIs, and the “valid events” trap. The everyday SLI is request-based — good ÷ total over events (e.g. non-5xx ÷ valid requests). Windows-based SLIs instead score time windows as good or bad (“was this minute healthy?”), which suits signals that aren’t naturally per-request. The subtle, incident-causing decision is the denominator: valid events should exclude what you don’t own or don’t want to count — client 4xx (a user’s bad input isn’t your outage), health-check traffic, and warm-up requests. Get the denominator wrong and you either flatter the SLO (hiding real pain) or self-inflict breaches (counting a bot’s 404 storm as your failure). Latency uses a distribution cut: SLO “99% of requests under 400 ms” by counting requests in the sub-threshold buckets, rather than chasing a moving p99 number.
Regional Persistent Disk / Hyperdisk internals — synchronous, and the write-latency you pay for zero in-region RPO. Regional PD (and Hyperdisk with regional replication) writes synchronously to two zones before acknowledging the write, so a zone loss leaves a fully consistent copy — that is how you get zero in-region RPO for a database VM. The cost is real: every write waits for the cross-zone round trip, adding latency versus a zonal disk, and on failover you force-attach the disk to a standby VM in the surviving zone. Contrast this sharply with cross-region replication, which is asynchronous (the speed of light makes synchronous cross-region impractical at distance) and therefore carries a non-zero RPO — the few seconds of writes in flight when the region died. This is the physics behind “zero RPO is an in-region property.”
Spanner multi-region and TrueTime — strong consistency across regions, and its floor. Spanner replicates via Paxos across zones and regions and uses TrueTime — a globally synchronized clock with a bounded uncertainty interval fed by GPS and atomic clocks — to order transactions globally without a single coordinator. To guarantee external consistency it does a brief commit-wait (waiting out the clock uncertainty) so no reader ever sees a transaction out of order. That is what lets a multi-region configuration offer strong consistency and a 99.999% availability SLA and horizontal scale, eliminating the application-level sharding a Cloud SQL design would carry. The trade-offs to design around: multi-region Spanner has a write-latency floor (commit-wait plus cross-region Paxos quorum) and a node/processing-unit cost floor, so it earns its place only when the requirement genuinely needs all three properties at once.
Circuit breakers, outlier detection, and retry budgets — the internals of “don’t make it worse.” In Cloud Service Mesh / Envoy, a circuit breaker is outlier detection: after N consecutive 5xx (or a gateway-error rate), the mesh ejects the failing endpoint from the load-balancing pool for a base period that grows on repeat ejection, so traffic routes to healthy replicas and the sick one gets breathing room. Retries are governed by a retry budget — retry at most, say, 20% of active requests — so a broad failure can’t multiply into a retry storm, and each retry uses exponential backoff with jitter (sleep = random(0, base × 2^attempt)) to de-synchronize clients that would otherwise re-hammer in lockstep. Advanced flows add hedged requests (fire a second request after a delay and take the first response) to shave tail latency — powerful, but it raises load, so it needs its own budget.
DR is not backup — the three failure classes, made explicit. Recovery design must name which failure it defends against, because the controls differ:
| Failure class | What happens | What survives it | What does NOT |
|---|---|---|---|
| Infrastructure loss (zone/region down) | Hardware/network gone, data intact | Redundancy + replication (regional HA, cross-region replica, Spanner) | A single-zone deployment |
Data corruption / logical delete (bad migration, fat-fingered DELETE, bug, ransomware) |
Bad data written and faithfully replicated everywhere | PITR, Object Versioning + Bucket Lock, immutable Backup and DR points | Replication — it propagates the corruption in milliseconds |
| Brownout (primary up-but-slow) | Latency SLO breached, health check still green | A synthetic probe / SLI-based failover trigger | A failover that only fires on a hard outage |
The trap is assuming cross-region replication is a backup. It is the opposite for class 2: the faster and more faithful your replication, the faster corruption reaches the standby. Immutable, time-separated recovery points are the only defense against a failure you caused.
MTTR is mostly detection — shrink the part that dominates. Recovery time decomposes into MTTD (detect) + MTTA (acknowledge) + MTTR (repair). In practice detection and acknowledgement dominate: a fault the system self-heals in seconds still becomes a long incident if nobody noticed for 20 minutes. This is why observability is a reliability control, not just an ops nicety — burn-rate alerts, synthetic probes, and SLO dashboards collapse MTTD, and self-healing (regional MIG autohealing, automatic Cloud SQL failover, Cloud Run instance replacement) collapses the repair term by removing the human from the common-fault path. Automating recovery is the only way to hit a tight RTO, because a paged human rarely acknowledges, diagnoses, and acts inside a few minutes.
How reliability differs from — and wires into — the other pillars. Beginners blur three pillars that feel adjacent:
- Reliability vs Operational Excellence. They share SLOs, but they own different halves. Operational Excellence is the daily running discipline — readiness reviews, incident command, safe deploys, toil reduction (see that lesson). Reliability is the designed-in resilience and the target-setting: it decides what the promise is (SLO), how many failure domains it survives (redundancy), and proves it (chaos). Opex asks “can we run and change this safely?”; Reliability asks “does the architecture keep the user’s promise when things break?”
- Reliability vs Performance. Performance is fast under normal load; Reliability is available and correct under failure and at the tail. A service with a brilliant median latency that collapses at p99.9 when one zone dies is performant but unreliable. They interact — a saturated system is both slow and fragile — but the SLO makes the boundary crisp: latency-SLO is a reliability concern (a slow-enough response is a failed one), while raw throughput tuning is performance.
- Ties to the rest. Reliability inherits its topology from System Design; its redundancy, reservations, and DR posture are the biggest lever the Cost Optimization pillar governs (over-building is the classic reliability overspend); and its failover, immutability, and least-privilege recovery paths are Security controls expressed operationally. Skip reliability and every other pillar inherits a system that looks correct on paper and fails the first real zone outage.
Real-world enterprise scenario
Aerolux Airways is a fictional full-service carrier headquartered in Dubai, running its flight-booking and check-in platform on GKE and Cloud SQL in me-central1 (Doha) with europe-west1 (Belgium) as a secondary, fronted by the global External Application Load Balancer and Cloud Armor. Booking volume triples around holiday peaks and major fare sales; a regional control-plane event the previous year took bookings down for ~70 minutes during a sale and cost an estimated $1.9M in lost bookings and goodwill. The VP of Engineering mandates a Google Cloud Architecture Framework Reliability review before the next sale.
Reliability principles. The platform team starts in the Scoping focus area: they inventory three critical user journeys — Search & Book, Check-in, and Loyalty/Miss-fare reporting — and run Cloud Trace to map each journey’s dependency chain. Applying define reliability based on user-experience goals, they refuse a blanket “five nines” and instead measure the success ratio of booking requests, not node CPU; a prior habit of paging on CPU saturation (which routinely self-corrected) is dropped in favor of journey-based signals.
SLIs, SLOs, error budgets. They set per-journey SLOs in Cloud Monitoring service monitoring: Search & Book — 99.95% availability + 95% of requests < 500 ms (30-day window, ~22 min/month budget); Check-in — 99.9% availability (degrades to cached boarding-pass data); Reporting — 99.5%. The composite math on Search & Book exposes six hard dependencies capping it near 99.5%, so they convert the fare-rules lookup and seat-map service from hard synchronous calls to Memorystore-cached soft dependencies, lifting the achievable ceiling above 99.95%. Multi-window burn-rate alerts (14.4x fast-burn paging; 3x slow-burn ticketing) replace static error thresholds, and a written error-budget policy freezes risky deploys when a journey’s budget is exhausted.
Redundancy across failure domains. Decision record: all stateless tiers and the GKE node pools go regional across three zones; Cloud SQL moves to regional HA (standby in a second zone) for in-region zero-RPO; the DR posture for region loss is active-passive Doha → Belgium with a promotable cross-region read replica; ingress stays on the global External Application Load Balancer so traffic shifts off an unhealthy region automatically. The loyalty datastore, needing global scale with strong consistency, is moved to Spanner (multi-region) — eliminating the application-level sharding the old system carried.
Graceful degradation. The hard/soft map drives concrete fallbacks: Memorystore serves stale fare/seat data when those services are down; Pub/Sub decouples booking-confirmation emails and loyalty accrual so a downstream brownout never blocks a booking; Cloud Armor rate-limiting sheds abusive/burst traffic at the edge; and a quality SLI tracks how often Search & Book is serving degraded (cached) results so degradation is visible, not silent. Every external call gets a circuit breaker + backoff via Cloud Service Mesh.
Failure recovery. The RTO/RPO register: Search & Book RTO 10 min / RPO 0 (bookings cannot be lost) → Cloud SQL regional HA for zero in-region RPO plus the cross-region replica for region loss (accepting a few seconds’ RPO only in the catastrophic case); Check-in RTO 15 min / RPO 5 min; Reporting RTO 24 h / RPO 24 h → Backup and DR Service restore. They explicitly document that zero-RPO and region-survival cannot both hold, and add Cloud SQL PITR + Cloud Storage Object Versioning with Bucket Lock to defend against data corruption (a logical-delete that replication would otherwise propagate). Regional MIG/GKE autohealing and automatic Cloud SQL failover handle the common faults without a human.
Chaos testing. Using Chaos Mesh on GKE plus native triggers, they catalog experiments straight from the failure-domain map: pod kills, a firewall-rule partition simulating loss of the seat-map service, a Cloud SQL failover flip, draining the Doha backend from the global LB, and a PITR restore into a scratch project to time RPO. The first production game day reveals the cross-region replica promotion RTA is 12 minutes against a 10-minute RTO — a fail — fixed by keeping the Belgium compute warm (pilot-light → warm-standby) and pre-promoting on a synthetic-probe latency breach rather than only on hard outage.
Capacity and quota. A load test to forecast holiday-sale peak shows a near-2x instance surge on failover; they place Compute Engine reservations in europe-west1 so the standby actually has capacity, raise Compute CPU, in-use IP, and Cloud Run instance quotas to 2x peak in both regions via Cloud Quotas, and wire quota-usage alerts. CUDs cover the steady baseline.
Outcome. Going into the next sale, Search & Book held 99.97% through a real single-zone incident with zero data loss (regional HA), the fare-rules circuit breaker prevented a repeat cascade, the rehearsed regional failover RTA came down to 6m 10s — inside RTO and inside the error budget — and the standby region’s reserved capacity absorbed the failover surge without hitting a quota wall. The per-journey reliability scorecard, reviewed each release with the error-budget policy, became the artifact the business uses to steer peak-readiness.
| Metric | Before the review | After (next sale) |
|---|---|---|
| Search & Book SLO attainment | not measured | 99.97% (target 99.95%) |
| Regional failover RTA vs RTO | ~70 min real outage | 6m 10s vs 10 min RTO |
| In-region data loss on a zone incident | at risk (single-zone DB) | 0 (regional HA, RPO 0) |
| Repeat dependency cascade | yes (fare-rules) | prevented (circuit breaker) |
| Failover hitting a quota/capacity wall | yes (contributed to outage) | 0 (reservations + 2× quota) |
Practice challenges
Work these in order — they climb from “read the budget” to “prove a failover meets RTO.” Try each before opening the solution.
1. (Beginner) Turn an SLO into an error budget. A journey has a 99.95% availability SLO over a rolling 30-day window. How many minutes of “bad” is the budget, and how long until it is fully spent at a steady 20× burn rate?
<details><summary>Solution</summary>
Budget = (1 − 0.9995) × 30 days = 0.05% × 43,200 min ≈ 21.6 minutes / 30 days. Time-to-exhaust = window ÷ burn rate = 30 days ÷ 20 = 1.5 days.
Why: the error budget is the currency of change, and burn rate — not a raw error count — tells you how urgently to act, because it measures budget spent per unit time against the sustainable pace. </details>
2. (Beginner) Do the composite-availability math. A booking journey makes four hard, synchronous calls, each with 99.9% availability. What is the best availability the journey can achieve, and does it satisfy a 99.9% journey SLO? If not, name the cheapest fix.
<details><summary>Solution</summary>
Series dependencies multiply: 0.999⁴ ≈ 0.9960 = 99.6% — below the 99.9% SLO, so the promise is mathematically impossible as designed. Cheapest fix: convert one or more hard dependencies to soft (cache the read with Memorystore, or queue the write with Pub/Sub) so it leaves the multiplication entirely; alternatively add a redundant parallel replica of the weakest link.
Why: every hard dependency multiplies your ceiling down regardless of code quality — the highest-leverage move is usually removing a series term, not hardening it. </details>
3. (Intermediate) Define an availability SLO as code. Express a 99.9% availability, 30-day rolling SLO for a booking service in Terraform so it is reviewable and repeatable, rather than clicked in the console.
<details><summary>Solution</summary>
resource "google_monitoring_slo" "booking_availability" {
  service             = google_monitoring_service.booking.service_id
  slo_id              = "booking-availability-30d"
  display_name        = "99.9% availability, 30-day rolling"
  goal                = 0.999
  rolling_period_days = 30

  basic_sli {
    availability {}   # request-based good/total on the discovered service
  }
}
For a custom metric you would swap basic_sli for a request_based_sli { good_total_ratio { good_service_filter = "…2xx…"; total_service_filter = "…" } }. (Representative — service references a google_monitoring_service / custom service you define.)
Why: an SLO in Terraform gets the same review, diff, and rollback discipline as any other resource, and the goal + rolling_period_days make the error budget explicit and machine-readable for burn-rate alerts.
</details>
4. (Intermediate) Convert a hard dependency to a soft one. On the booking path, the fare-rules service is a synchronous call; when it is down, bookings fail. Describe the GCP change that makes it soft and state exactly what “degraded” returns.
<details><summary>Solution</summary>
Put Memorystore (Redis) in front of the fare-rules lookup with a short TTL. On the hot path: try cache → on miss, call the service and populate the cache. Wrap the call in a circuit breaker (Cloud Service Mesh outlier detection) so repeated failures fail fast to the cache instead of blocking. Degraded behavior: serve the last-known-good fare rules (stale but valid) and flip a quality SLI to “degraded” so the downgrade is visible; only refuse a booking if there is no cached value at all. The fare-rules service now leaves the availability multiplication — its outage becomes a quality dip, not an availability failure.
Why: converting hard → soft removes the dependency from the composite-availability product entirely, which raises the achievable SLO more than any amount of hardening the dependency itself. </details>
5. (Advanced) Author the multi-window, multi-burn-rate alert pair. For a 99.9% SLO, specify the two alerting conditions (window, burn rate, budget consumed, action) and explain why you need both.
<details><summary>Solution</summary>
| Policy | Window | Burn rate | Budget consumed | Action |
|---|---|---|---|---|
| Fast | 1 h | 14.4× | ~2% | Page |
| Slow | 6 h | 6× | ~5% | Ticket |
Each condition thresholds the SLO’s burn rate over its window (in Cloud Monitoring, a select_slo_burn_rate("<slo>", "3600s") and "21600s" condition). To suppress flapping, require a shorter confirmation window (e.g. 5 min) to also be burning before the fast policy pages.
Why: the fast window catches an acute outage in minutes; the slow window catches a chronic leak that would otherwise drain the whole budget by month-end — and requiring both a long and a short window to burn together filters out one-minute spikes that would cause alert fatigue. </details>
6. (Advanced) Prove a zone failover meets RTO with a chaos experiment. Design the game-day experiment for a Cloud SQL regional-HA instance whose primary is in asia-south1-a. Give the hypothesis, the blast-radius bound, the fault-injection command, and the pass criterion.
<details><summary>Solution</summary>
Hypothesis (tied to an SLO): “Failing the Cloud SQL primary from asia-south1-a to its standby completes in under 60 s with no breach of the booking journey’s 99.95% availability SLO.”
Blast radius: run in staging first; then a production game day with the error budget watched live on the SLO dashboard and an explicit abort/rollback condition — only proceed in prod if budget remains.
Inject the fault:
gcloud sql instances failover booking-db \
  --project=PROJECT_ID
Measure & pass: record RTA vs RTO (target < 60 s), confirm autohealing/traffic behaved as designed, and verify the booking SLO did not breach. The pass bar is “recovered within RTO and inside the error budget,” not merely “it came back.” Capture the result in the reliability scorecard and feed any gap into the DR runbook.
Why: redundancy and self-healing are hypotheses until you fail them on purpose — a rehearsed failover with the budget watched is the only evidence that the RTO is real, and it routinely surfaces gaps (e.g. an RTA that exceeds the RTO) before a real incident does. </details>
Common beginner mistakes
These are misconceptions — the wrong mental model — as distinct from the architect-level pitfalls listed further down.
- “Reliability means the servers are healthy.” Green CPU and “healthy” pods tell you a host is running, not whether users can book a flight. Right model: reliability is the success ratio and latency of user journeys; measure and alert on those (principle 1), and keep resource metrics for diagnosis, not for defining “up.”
- “Five nines everywhere is the safe choice.” A 100% target leaves zero error budget (you can never deploy), and “five nines” across the board over-engineers cheap flows while the composite math on a six-dependency journey silently caps it near 99.5%. Right model: set negotiated per-journey SLOs, do the dependency multiplication, and spend the budget deliberately.
- “More retries make it more reliable.” Retries without a circuit breaker and backoff-with-jitter convert a dependency’s brownout into a self-inflicted DDoS that takes it down harder. Right model: every retry gets a breaker + exponential backoff + jitter + a retry budget; failing fast to a fallback is more reliable than retrying into a wall.
- “Cross-region replication is our backup.” Replication faithfully copies a fat-fingered
DELETEor a bad migration to the standby in milliseconds. Right model: replication defends infrastructure loss; data corruption is a different failure class needing PITR, Object Versioning + Bucket Lock, and immutable Backup-and-DR recovery points. - “We’ll just autoscale in the failover region.” Capacity ≠ quota, and the standby can have neither. Right model: reserve capacity (Compute Engine reservations / CUDs) and raise the per-project, per-region quota to ≥ peak in the failover region — verified in a game day, not discovered in an incident.
- “It’s deployed in three zones, so redundancy is done.” A failover path you have never exercised is a hypothesis, not a control. Right model: prove it with chaos game-days, measure RTA vs RTO, and treat any untested failure-domain row as a failing scorecard line.
- “RTO and RPO should both be zero.” Zero RPO and surviving a full region loss are mutually exclusive — synchronous cross-region replication isn’t offered. Right model: set honest per-journey targets; use in-region synchronous HA (Cloud SQL HA, regional PD) for zero in-region RPO and accept a small RPO only for the catastrophic region-loss case.
- “Reliability is just performance / just operational-excellence.” Fast-under-normal-load (performance) and safe-to-run-day-to-day (opex) are different pillars. Right model: reliability is available and correct under failure and at the tail — a fast system that collapses at p99.9 when a zone dies is performant but unreliable, and a well-run system with no SLO or failover design is operationally excellent but not reliable.
Deliverables & checklist
By the end of the Reliability phase you should hold:
Common pitfalls
- Measuring server health instead of user experience. Paging on CPU/memory/“task alive” produces firefighting on non-incidents and blindness to real ones. Avoid it: define SLIs as the success ratio of user requests per critical journey (principle 1), and use Cloud Trace to find what actually degrades the user.
- Promising platform-wide “uptime” and skipping the composite math. “Five nines everywhere” overengineers everything and protects nothing well; five hard dependencies at 99.9% already cap a journey near 99.5%. Avoid it: set negotiated per-journey SLOs, multiply the hard-dependency chain, and convert hard dependencies to soft where the math demands it.
- Driving RTO and RPO to zero without the physics. Zero RPO and surviving a full region loss are mutually exclusive — synchronous cross-region replication is not offered. Avoid it: set honest per-journey targets, use in-region synchronous HA (Cloud SQL HA, regional PD) for zero in-region RPO, and pick the cheapest sufficient cross-region pattern.
- Treating DR replication as a backup. Cross-region replication faithfully copies a
DELETEor corruption to the standby. Avoid it: add PITR, Object Versioning + Bucket Lock, and Backup and DR Service recovery points to cover data loss, which is a different failure class from infrastructure loss (principle 8). - Untested redundancy and DR. A failover path you have never exercised is a liability — principles 3 and the recovery patterns are inert without principle 7. Avoid it: run chaos experiments and a production game day, measure RTA vs RTO, and make “untested failure-domain rows” a failing scorecard line until it is zero.
- No capacity reserved in the failover region (or hitting a quota wall). A failover into a region that cannot get instances — or a scale-up that hits a per-region quota — is an outage. Avoid it: reserve capacity (Compute Engine reservations/CUDs) in the standby region, raise Cloud Quotas to ≥ 2x peak in every active and standby region, and validate with a load test.
Glossary
- Reliability (the pillar) — the Architecture Framework pillar that turns “it must be highly available” into an evidenced, measured, tested promise; four focus areas (Scoping, Observation, Response, Learning), nine principles, seven engineering sub-components.
- SLI (Service Level Indicator) — a quantitative measure of user-facing behavior, usually
good events ÷ valid events(e.g. non-5xx ÷ valid requests). - SLO (Service Level Objective) — a target for an SLI over a rolling window (e.g. 99.95% success over 30 days); the line that defines “healthy” for a journey.
- SLA (Service Level Agreement) — a contractual promise with consequences (credits); the internal SLO should always be stricter than the SLA.
- Error budget —
100% − SLOover the window; the amount of failure you are allowed to spend on change. 99.99% ≈ 4 min/month; 99.9% ≈ 43 min/month. - Error-budget policy — the pre-agreed rule for what happens when the budget is spent (typically: freeze risky deploys, redirect to reliability work until it recovers).
- Burn rate — how fast you spend error budget vs the sustainable pace; time-to-exhaust = window ÷ burn rate. 14.4× over 1 h ≈ 2% of a 30-day budget.
- Multi-window, multi-burn-rate alert — pairing a fast window (page) and a slow window (ticket), each requiring sustained burn, to catch both acute outages and slow leaks without flapping.
- Critical user journey (CUJ) — a user-facing flow (e.g. “search & book a flight”) that reliability is scoped and measured around, rather than around individual servers.
- Composite availability — the availability of a journey computed from its dependencies: series deps multiply (
A₁×A₂×…), parallel redundant replicas divide the risk (1 − ∏(1−Aᵢ)). - Hard vs soft dependency — a hard dependency’s failure fails the journey (it multiplies your ceiling down); a soft one can be cached, queued, defaulted, or feature-flagged away, so it leaves the availability multiplication.
- Failure domain — a boundary within which a single fault is contained: VM → zone → region. Redundancy maps components across domains so one loss doesn’t drop the journey.
- Zone / Region — a zone is an isolated failure domain within a region (independent power/cooling/network); a region is an independent geography of multiple zones.
- Redundancy tier — the level of replication chosen per component: single-zone, multi-zone (regional), multi-region, or global (anycast frontend), driven by the SLO and RTO/RPO.
- Active-active vs active-passive — both regions serve live (near-zero RTO, needs conflict resolution / multi-write) vs a warm standby promoted on failover (cheaper, non-zero RTO/RPO).
- Graceful degradation — continuing to serve with reduced fidelity/freshness under partial failure or overload, recovering automatically; the structural complement to the quality SLI.
- Circuit breaker — a mechanism (e.g. Envoy outlier detection) that ejects a failing dependency from the pool after repeated errors so traffic routes to healthy replicas and the sick one recovers.
- Exponential backoff with jitter — spacing retries as
random(0, base × 2^attempt)so retrying clients de-synchronize instead of re-hammering a struggling dependency in lockstep. - Retry budget — a cap on the fraction of traffic that may be retries (e.g. 20%), so a broad failure can’t multiply into a retry storm.
- Load shedding — deliberately dropping low-priority work (e.g. Cloud Armor rate-limiting at the edge) to protect the core journey under overload.
- Bulkhead — isolating partitions (separate pools, cell-based partitioning, per-tenant quotas) so a failure is contained instead of taking everything down.
- RTO (Recovery Time Objective) — the maximum acceptable downtime before recovery; selects the recovery mechanism and speed.
- RPO (Recovery Point Objective) — the maximum acceptable data loss measured in time; selects the replication/backup cadence.
- RTA (Recovery Time Actual) — the recovery time actually measured in a drill; the gap between RTA and RTO is what game-days exist to expose.
- DR pattern ladder — backup-and-restore → pilot light → warm standby (active-passive) → hot / active-active, in increasing cost and decreasing RTO/RPO.
- PITR (Point-in-Time Recovery) — restoring a datastore to a moment before a corruption/logical-delete (Cloud SQL, AlloyDB, Spanner); a defense replication cannot provide.
- Object Versioning / Bucket Lock — Cloud Storage features that keep prior object versions and enforce immutable (WORM) retention, defending against overwrite/delete and ransomware.
- Regional Persistent Disk / Hyperdisk (regional) — block storage replicated synchronously to two zones before ack, giving zero in-region RPO at the cost of extra write latency.
- Spanner (multi-region) — Google’s horizontally-scalable, strongly-consistent database using TrueTime and Paxos across regions; carries a 99.999% SLA and removes app-level sharding.
- Self-healing / autohealing — automatic replacement/reschedule of failed capacity (regional MIG autohealing, GKE pod reschedule, Cloud Run instance replacement, automatic Cloud SQL failover), which collapses the repair part of MTTR.
- Chaos engineering / game day — deliberately injecting enumerated faults (zone/region failover, dependency partition, data restore) to prove the system recovers within RTO/RPO and inside the error budget.
- Synthetic probe / uptime check — an active health/latency probe (Cloud Monitoring uptime check) that detects a brownout — an up-but-slow primary — so failover can trigger on a latency-SLO breach, not just a hard outage.
- MTTD / MTTA / MTTR — mean time to detect / acknowledge / repair; detection usually dominates, which is why observability is a reliability control.
- Capacity reservation vs CUD — a Compute Engine reservation guarantees the capacity itself in a region/zone; a committed-use discount guarantees only the price. DR failover needs the reservation, not just the CUD.
- Quota (rate vs allocation) — per-project, per-region ceilings on API rates or resource counts, enforced even when physical capacity exists — the classic silent cause of a failed failover.
- Cloud Quotas — the API/console for reading quota consumption, requesting increases as quota preferences, and alerting before a limit is hit.
What’s next
Part 5 of the Google Cloud Architecture Framework series turns to the Cost Optimization pillar — aligning the redundancy, capacity reservations, and DR posture you just designed with a sustainable spend through right-sizing, committed-use discounts, autoscaling efficiency, and FinOps practices on Google Cloud.