In a nutshell
Every cloud team eventually learns a hard truth: designing a system and running one are different jobs. You can architect something elegant and still get paged at 3 a.m. because nobody could see what broke, the deploy had no rollback, and the on-call had no runbook. Operational Excellence is the pillar of the Google Cloud Architecture Framework that closes that gap — the discipline of turning a designed system into one you can run, observe, change, and recover every single day, on purpose, with the same rigor you give latency or security.
Think of it like running a busy international airport. A new airline doesn’t get to fly until it passes safety certification (operational readiness — the Production Readiness Review). The control tower watches every aircraft on radar and instruments, because you cannot manage what you cannot see (observability — the four golden signals and SLOs). When something goes wrong there is a single, calm incident commander and a rehearsed protocol, not a dozen people shouting (incident management). You don’t reroute every flight the instant you change a runway procedure — you trial it on a few flights first and can revert instantly (safe deployments — canary and rollback). The ground crew automates the repetitive turnaround so nobody is hand-cranking a fuel pump (toil reduction). And before the festival-season rush you make sure there are enough gates and runway slots — on GCP that second phrase is literal: quota — reserved ahead of the surge (capacity and quota planning).
Those six moves are exactly the six engineering sub-components this lesson teaches, and Google organizes them under five principles: ensure operational readiness using CloudOps, manage incidents and problems, manage and optimize cloud resources, automate and manage change, and continuously improve and innovate. Here is the map:
| Google principle | What the practice buys you | This lesson’s section |
|---|---|---|
| Ensure operational readiness (CloudOps) | A workload that is provably operable before it takes traffic | Operational readiness; Observability |
| Manage incidents and problems | Fast, calm recovery — and the same fire never returns | Incident and problem management |
| Automate and manage change | Deploys that don’t cause the outages | Release engineering; Automation & toil |
| Manage and optimize cloud resources | Headroom for the surge without paying for idle | Capacity and quota planning |
| Continuously improve and innovate | Each incident and each toil-hour makes the system better | The whole loop (see the diagram) |
Level: Advanced · Time: ~42 min
Prerequisites. You should understand the framework’s System Design pillar (how the workload is shaped) and be comfortable with the GCP Cloud Operations suite — Monitoring, Logging, Trace and the Cloud Build / Cloud Deploy pipeline. This pillar sits deliberately before Reliability in the series — you cannot promise an SLO you cannot see, deploy, or roll back.
After this lesson you will be able to:
- Run a Production Readiness Review as a real go-live gate across people, process, tooling, and governance.
- Instrument the four golden signals, define an SLO and a multi-burn-rate alert as code, and explain why you alert on burn rate rather than CPU.
- Stand up incident command (ICS roles, severity levels, on-call) and run a blameless postmortem with tracked action items and an error-budget policy.
- Build a build-once, deploy-progressively pipeline — Cloud Build → Artifact Registry → Binary Authorization → Cloud Deploy canary with automatic rollback on SLO regression.
- Measure and reduce toil below the ~50% cap, and turn runbooks into runnable automation.
- Plan capacity and quota ahead of demand — including the failover-region quota and reservations that DR plans routinely forget.
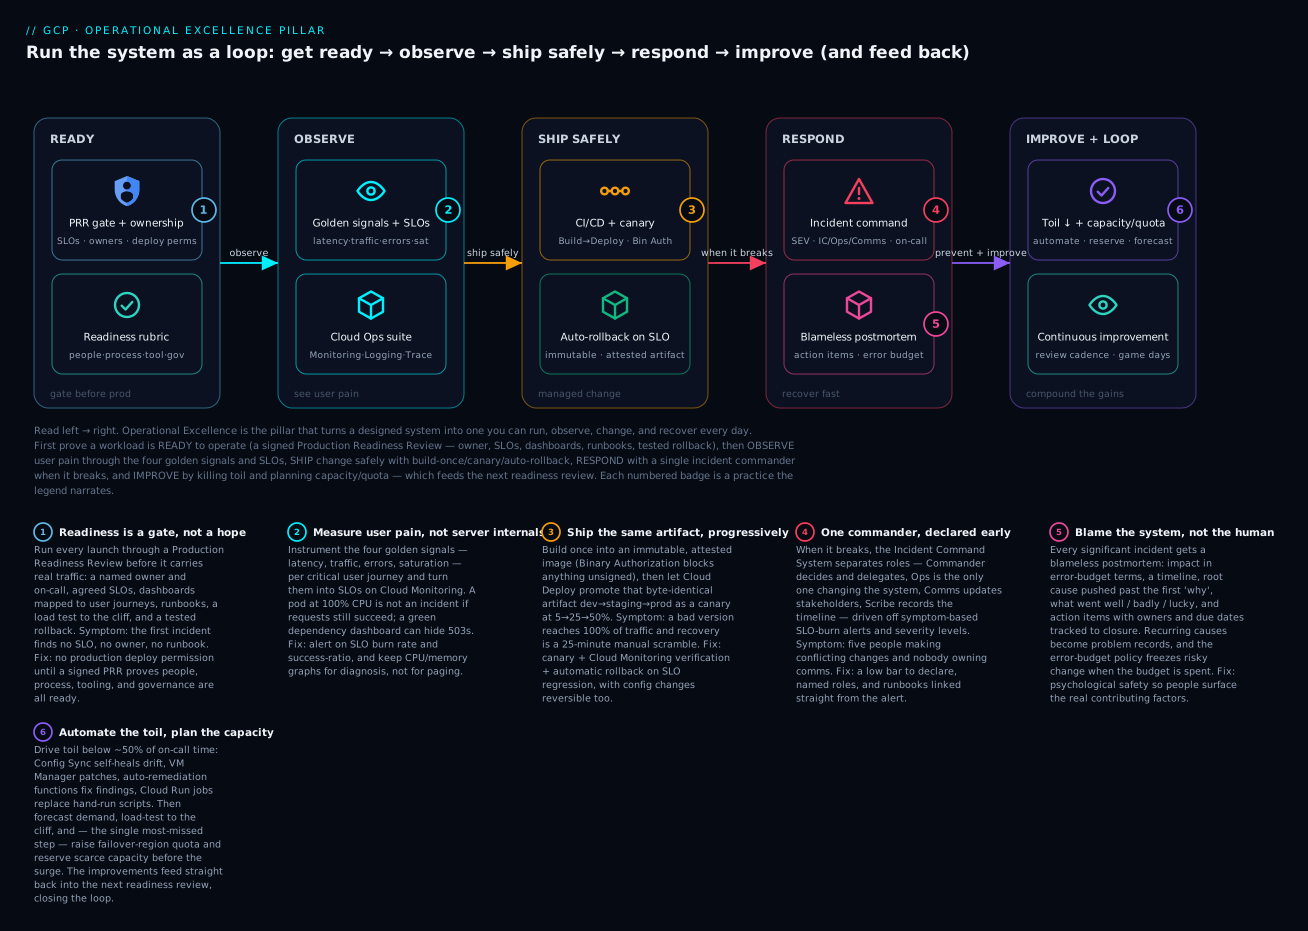
Read the diagram left → right as a loop: a workload must be proved ready (a signed PRR), you then observe user pain through golden signals and SLOs, ship change safely with build-once/canary/auto-rollback, respond with a single incident commander when it breaks, and improve by killing toil and planning capacity — which feeds the next readiness review. The numbered badges are the practices the sections below unpack.
Where this fits
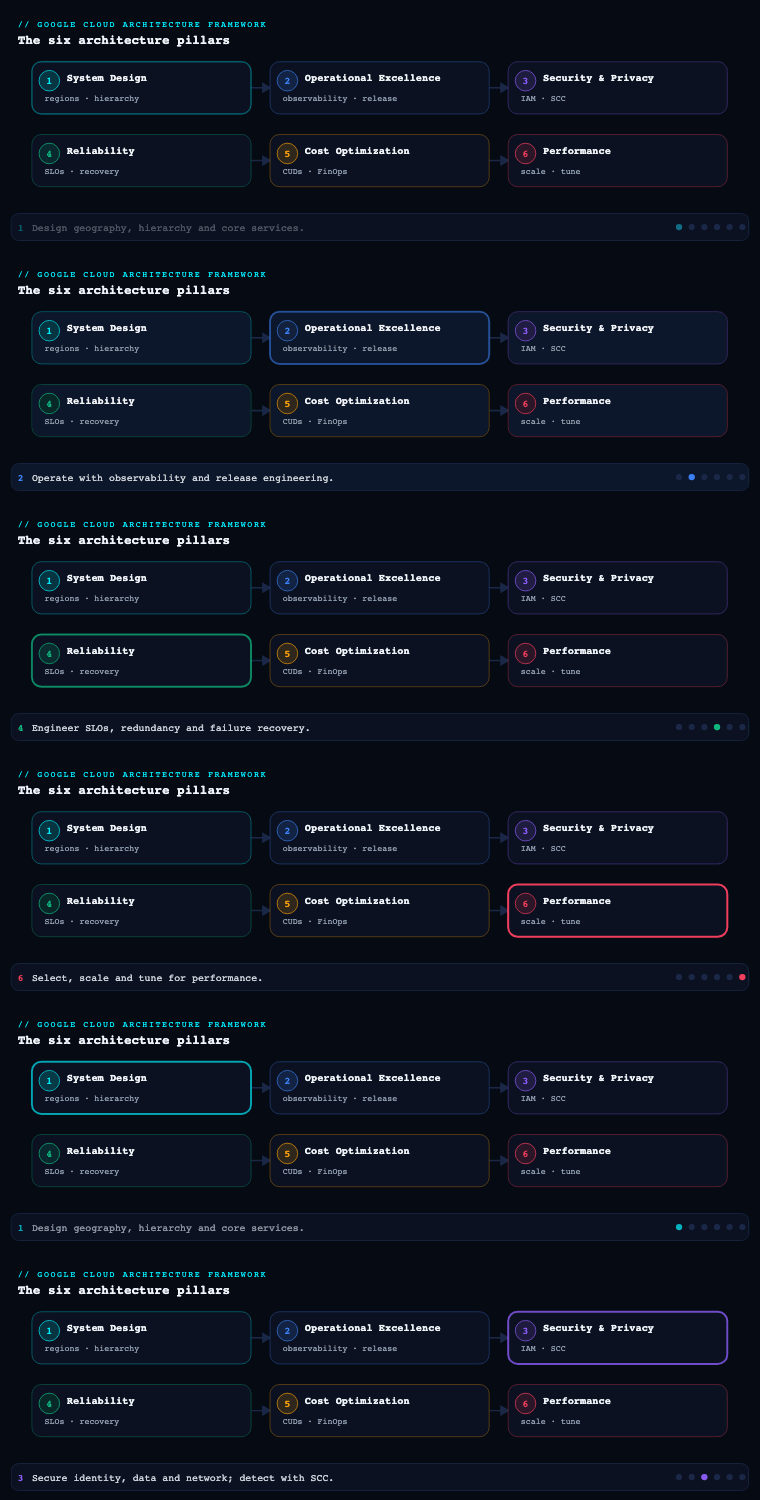
The Google Cloud Architecture Framework organizes Google’s guidance into pillars — System Design (part 1), Operational Excellence (part 2), Security/Privacy/Compliance, Reliability, Cost Optimization, and Performance Optimization — and Operational Excellence is the pillar that turns a designed system into one you can run, observe, change, and recover every day. Google frames it around five principles — ensure operational readiness and performance using CloudOps; manage incidents and problems; manage and optimize cloud resources; automate and manage change; continuously improve and innovate — built on a deliberate “embrace automation, orchestration, and data-driven insights” stance. This article walks the six engineering sub-components that operationalize those principles: operational readiness, observability, incident and problem management, release engineering and safe deployments, automation and toil reduction, and capacity and quota planning. It sits before Reliability in the series on purpose — you cannot promise an SLO you cannot see, deploy, or roll back.
Operational readiness — the CloudOps foundation
What it is. Operational readiness is the discipline of proving a workload can actually be operated in production before it carries real traffic, and of keeping that proof true as the system evolves. Google’s first principle — ensure operational readiness and performance using CloudOps — bundles four practices that gate go-live: defining SLOs, comprehensive monitoring, performance testing, and capacity planning. The framework’s mental model is the four readiness dimensions: people (who is on call, are they trained), processes (runbooks, escalation, change control), tooling (observability, deploy, automation), and governance (SLOs agreed, ownership recorded). Readiness is not a one-time checklist; it is a recurring gate at every significant launch and architecture change.
Why it matters. The most expensive incidents are the ones a team cannot diagnose because the service shipped without the operational scaffolding — no SLO to tell whether behavior is even wrong, no dashboard that maps to user journeys, no runbook, no named owner, no load test to reveal the cliff. Readiness front-loads that work into the cheap part of the lifecycle. It is also the connective tissue of the whole pillar: the SLOs you define here become the alerting basis for incident management, the deploy gates for release engineering, and the demand signal for capacity planning. Skip readiness and every later sub-component inherits the gap.
How to do it well. Run launches through a Production Readiness Review (PRR) — Google’s SRE practice — as a structured gate, not a rubber stamp. The PRR interrogates the service against a fixed rubric and produces a signed-off artifact. A pragmatic GCP-flavored rubric:
| Readiness dimension | The question the PRR asks | GCP artifact / evidence |
|---|---|---|
| Ownership | Who owns this service and its on-call? | Entry in service catalog; PagerDuty/Opsgenie schedule; Cloud Asset Inventory labels (owner, team, cost-center) |
| SLOs | What are the user-facing SLIs and their SLO targets? | Cloud Monitoring services & SLOs objects; error-budget policy doc |
| Monitoring | Can we see the critical user journeys? | Dashboards in Cloud Monitoring; alerting policies on SLO burn rate |
| Logging | Are logs structured, retained, and queryable? | Cloud Logging buckets + retention; log-based metrics |
| Runbooks | Is there a documented response for the top failure modes? | Linked runbooks; alert annotations pointing to them |
| Capacity | Have we load-tested to the cliff and reserved headroom? | Load-test report; quota review; autoscaler config |
| Rollback | Can we revert a bad change in minutes? | Cloud Deploy rollback target; documented procedure |
| DR | What is the RTO/RPO and has failover been tested? | Backup config; tested failover record |
Artifacts & GCP tooling. The readiness sub-component produces a PRR document, a service catalog entry, an SLO definition (in code or as a Monitoring object), a load-test report, and an on-call schedule. The signed PRR is the gate the platform team checks before granting production deploy permissions. Codify the rubric as a checklist in your repo so it travels with the service, and re-run it at every architecture change of consequence (new region, new dependency, 10× traffic).
Observability — Cloud Logging, Cloud Monitoring, Cloud Trace, and Error Reporting
What it is. Observability is the property that lets you ask arbitrary questions about your system’s behavior from its external outputs — without shipping new code to answer each one. It rests on three telemetry signals — metrics, logs, and traces — plus aggregated errors as a fourth, derived view. On Google Cloud these map directly to the Cloud Operations suite (formerly Stackdriver):
| Signal | What it answers | GCP service | The unit |
|---|---|---|---|
| Metrics | “Is something wrong, and how wrong?” (rates, latencies, saturation) | Cloud Monitoring | Time series (e.g. run.googleapis.com/request_count) |
| Logs | “What exactly happened on this request?” | Cloud Logging | Structured LogEntry (JSON payload + resource + severity) |
| Traces | “Where did the latency go across services?” | Cloud Trace | Spans stitched into a distributed trace |
| Errors | “What’s the new/most-frequent crash?” | Error Reporting | Deduplicated error group + count + first/last seen |
| CPU/heap hotspots | “Why is this slow/expensive in code?” | Cloud Profiler | Statistical flame graph |
Why it matters. The pillar’s bias toward data-driven insights is hollow without telemetry that maps to the user’s experience rather than to server internals. A pod at 100% CPU is not an incident if requests still succeed within latency targets; conversely every dependency can report “healthy” while users get 503s. Observability done well lets you build SLIs on the success ratio and latency of user journeys, diagnose a novel failure in minutes by pivoting from a metric spike to the exact logs to the slow span, and do all of this without re-deploying. Done badly — unstructured printf logs, dashboards full of CPU graphs, no trace propagation — it produces the worst failure mode in operations: a war room where nobody can answer “what is actually broken?”
How to do it well — metrics and dashboards (Cloud Monitoring). Instrument the four golden signals — latency, traffic, errors, saturation — for every service, because they generalize across architectures and feed SLOs directly. Adopt OpenTelemetry as the vendor-neutral instrumentation layer and export to Managed Service for Prometheus (Google’s drop-in for Prometheus that ingests PromQL and scales to billions of active series without you running the storage). Build dashboards per critical user journey, not per machine, and keep one “service overview” dashboard that any responder can open cold. Define alerting policies on symptoms (SLO burn rate, elevated error ratio) rather than causes (high CPU), so you page on user pain and not on noise. Use multi-window, multi-burn-rate alerts (e.g. a fast 1-hour window at 14.4× burn for “page now,” a slow 6-hour window at 6× for “ticket”) to catch both sudden and slow budget exhaustion while controlling false pages.
How to do it well — logs (Cloud Logging). Emit structured JSON logs so every field is queryable in the Logs Explorer with the Logging query language (LQL); on GKE, Cloud Run, and App Engine, severity and trace context are auto-extracted. Route logs with the Log Router through sinks into the right destination: keep hot operational logs in log buckets (with Log Analytics enabled so you can query them as a BigQuery dataset via SQL), tier audit and security logs to BigQuery for long-horizon analysis and to Cloud Storage or Pub/Sub for archive and streaming. Turn recurring signals into log-based metrics so a log pattern becomes a graphable, alertable time series. Crucially, correlate logs to traces: when a log entry carries trace/spanId fields, Cloud Logging and Cloud Trace cross-link, so one click takes a responder from an error log to the full distributed trace of that exact request.
How to do it well — traces and errors. Propagate W3C Trace Context (or the legacy X-Cloud-Trace-Context) end-to-end so Cloud Trace can reconstruct the request waterfall across Cloud Run, GKE, and managed back ends; Trace’s latency analysis finds the slow hop and surfaces latency distributions per endpoint. Let Error Reporting do the de-duplication it is built for — it groups stack traces into error groups, tracks first/last-seen and occurrence counts, and notifies on new error types, which is exactly the “what regressed in this release?” signal you want piped into a deploy gate or chat channel. Reach for Cloud Profiler when a service is correctly behaved but expensive or slow, to see CPU and heap attribution down to the function with negligible overhead.
Artifacts & GCP tooling. The observability sub-component produces a telemetry standard (golden signals + structured-log schema + trace-context propagation as a platform contract), dashboards as code (Monitoring dashboards exported to JSON/Terraform), alerting policies as code, a log-retention and routing design (sinks, buckets, BigQuery datasets), and SLO objects in Cloud Monitoring. The platform team should ship a golden instrumentation library / OpenTelemetry baseline so every team inherits correct telemetry by default rather than reinventing it.
Worked example — an SLO and a multi-burn-rate alert as code
The four golden signals become SLIs you can define and alert on. The mapping most teams actually use:
| Golden signal | The question | A request-based SLI | You alert on |
|---|---|---|---|
| Latency | Are responses fast enough? | fraction of requests served under the threshold (e.g. p99 < 800 ms) | SLO burn (too many slow requests) |
| Traffic | How much demand? | requests/sec (the denominator for the others) | anomalous drop/spike — diagnosis, not paging |
| Errors | Are responses correct? | good ÷ total = non-5xx ÷ total requests | SLO burn (success ratio) |
| Saturation | How close to the limit? | utilization of the most-constrained resource | capacity / diagnosis signal |
An availability SLO and its fast-burn alert, in Terraform (representative — filters and IDs are placeholders):
resource "google_monitoring_slo" "consumer_pay" {
  service      = google_monitoring_service.consumer_pay.service_id
  slo_id       = "consumer-pay-availability"
  display_name = "99.95% of consumer-pay requests succeed (30-day rolling)"

  goal                = 0.9995   # 0.05% error budget
  rolling_period_days = 30

  request_based_sli {
    good_total_ratio {
      # define 'total' and one of good/bad; Monitoring derives the ratio
      total_service_filter = "metric.type=\"prometheus.googleapis.com/http_requests_total/counter\" resource.type=\"prometheus_target\""
      bad_service_filter   = "metric.type=\"prometheus.googleapis.com/http_requests_total/counter\" resource.type=\"prometheus_target\" metric.label.\"code\"=monitoring.regex.full_match(\"5..\")"
    }
  }
}

resource "google_monitoring_alert_policy" "consumer_pay_fast_burn" {
  display_name = "consumer-pay: fast burn (PAGE)"
  combiner     = "OR"
  conditions {
    display_name = "burn rate > 14.4x over 1h"
    condition_threshold {
      filter          = "select_slo_burn_rate(\"${google_monitoring_slo.consumer_pay.name}\", \"3600s\")"
      comparison      = "COMPARISON_GT"
      threshold_value = 14.4
      duration        = "0s"
      aggregations {
        alignment_period   = "300s"
        per_series_aligner = "ALIGN_MEAN"
      }
    }
  }
  notification_channels = [var.pager_channel]
}
Wire two policies, not one — the canonical multi-window, multi-burn-rate pair:
| Window | Burn rate | Budget consumed to fire | Action | Why |
|---|---|---|---|---|
| 1 hour | 14.4× | ~2% of a 30-day budget | Page | Catches a sudden, severe break fast |
| 6 hours | 6× | ~5% of budget | Ticket | Catches a slow leak without paging on noise |
The fast window pages you on an acute outage; the slow window opens a ticket on a gradual regression that would otherwise burn the whole budget by month-end. Requiring both a short and a long window to be burning together is what filters a one-minute blip out of a real, sustained problem.
Incident and problem management — response, retrospectives, and prevention
What it is. Google’s second principle — manage incidents and problems — separates two related-but-distinct loops. Incident management is the reactive loop: detect, respond, mitigate, and restore service fast when something breaks. Problem management is the proactive loop: find and remove the underlying cause so the incident class never recurs. The pillar names the ingredients explicitly: comprehensive observability (the detection feedstock), clear incident response procedures, thorough retrospectives, and preventive measures.
Why it matters. Mean time to detect and mean time to restore are the metrics your users actually feel; unmanaged incidents stretch both, and chaotic response (no clear commander, no comms, ad-hoc debugging) makes a 5-minute glitch into a 2-hour outage and a trust loss. Equally, an organization that only fights fires — that never closes the problem-management loop — will fight the same fire indefinitely, burning its error budget and its people. The pair is what converts raw observability into durable reliability.
How to do it well — incident response. Adopt a structured Incident Command System (ICS), the model Google’s SRE program uses, with clearly separated roles so cognitive load is distributed:
| ICS role | Responsibility | Anti-pattern it prevents |
|---|---|---|
| Incident Commander (IC) | Owns the incident, makes decisions, delegates; does not debug | One hero doing everything |
| Operations / Ops Lead | The only person changing the system; executes mitigations | Multiple people making conflicting changes |
| Communications Lead | Updates stakeholders and status page on a cadence | Engineers interrupted for status |
| Planning / Scribe | Records the timeline, actions, and decisions | An unreconstructable retrospective |
Drive severity levels (SEV1–SEV4) that map to response expectations and escalation. Detection should be symptom-based alerts on SLO burn rate flowing into an on-call tool (PagerDuty, Opsgenie) with schedules and escalation policies. Maintain runbooks linked directly from alert annotations so the responder lands on “what to check, what to do” without hunting. Declare incidents early and cheaply — a low bar to declare beats a high bar to suffer. Practice with DiRT-style disaster drills and game days so the muscle exists before it is needed.
How to do it well — problem management & retrospectives. Every significant incident gets a blameless postmortem — Google’s signature practice — that focuses on what in the system and process allowed this, never who erred. The artifact has a fixed shape: summary, impact (with SLO/error-budget cost), timeline, root cause (push past the first cause with the “5 Whys”), what went well / what went wrong / where we got lucky, and a list of action items with owners and due dates tracked to completion. The blameless framing is not soft; it is what makes engineers tell the truth about contributing factors, which is the only way to fix them. Feed recurring root causes into problem records and an error-budget policy: when the budget is exhausted, the policy freezes risky change and redirects effort to reliability work — turning the dev-vs-SRE tension into a rule rather than a fight.
Artifacts & GCP tooling. The artifacts are an incident-response plan, severity matrix, on-call schedule, runbook library, postmortem template + archive, action-item tracker, and an error-budget policy. On GCP, alerting policies and SLO burn-rate in Cloud Monitoring are the detection source; Personalized Service Health surfaces Google-side incidents affecting your specific projects (so you do not postmortem an outage that was Google’s, and you do get a verified signal when it was); Cloud Logging’s timeline and Trace reconstruct the technical narrative for the postmortem; and the postmortem archive itself often lives in a doc/wiki linked from the service catalog.
A severity matrix and a blameless postmortem template
A pragmatic SEV matrix — the point is that a severity maps to a response expectation, not to a feeling:
| Severity | Definition | Example | Response |
|---|---|---|---|
| SEV1 | Critical user-facing outage or data loss | Payments failing for all users | Page IC now; all-hands bridge; status page; exec comms |
| SEV2 | Major degradation, partial or single-region | p99 latency 3× SLO in one region | Page on-call; IC if not mitigated fast |
| SEV3 | Minor / limited impact, workaround exists | One non-critical endpoint elevated errors | Ticket; fix in business hours |
| SEV4 | Negligible / cosmetic | Dashboard glitch, no user impact | Backlog |
A blameless postmortem template — the fixed shape every retrospective fills, so nothing important is skipped under pressure:
# Postmortem: <service> <date> — <one-line title>
**Severity:** SEV_   **Authors:** _   **Status:** Draft → Reviewed → Actions-tracked

## Summary
One paragraph: what broke, who was affected, for how long.

## Impact
Users affected, requests failed, revenue/SLA impact, and **error budget consumed**
(e.g. 42% of the 30-day budget in 38 minutes).

## Timeline (UTC)
- 14:02  Bad config deployed (rollout reached 100%)
- 14:07  SLO burn-rate alert paged on-call
- 14:11  Incident declared SEV1; IC assigned
- 14:29  Rollback initiated
- 14:40  Service restored

## Root cause
The technical *and* process cause, pushed past the first 'why' with the 5 Whys.

## What went well / What went wrong / Where we got lucky

## Action items
| Action | Owner | Due | Type (prevent/detect/mitigate) | Tracking link |
|--------|-------|-----|--------------------------------|---------------|
And the rule that gives problem-management teeth — an error-budget policy written down before the argument, not during it:
If a service’s 30-day error budget is exhausted, all feature deploys freeze and the owning team redirects to reliability work until the budget recovers. Exceptions require the service owner’s sign-off. Security fixes are always exempt.
That single paragraph converts the perennial dev-versus-SRE tension into a rule the whole organization agreed to in advance.
Release engineering and safe deployments — Cloud Build, Cloud Deploy, and progressive rollout
What it is. Release engineering is the discipline of getting a code change from a developer’s commit into production safely, repeatably, and reversibly. It spans the build (compile, test, produce an immutable artifact), the supply-chain controls (provenance, signing, admission), and the deployment strategy that limits blast radius. Google’s fourth principle — automate and manage change — is explicit that CI/CD pipelines and IaC are the mechanism, and that change must be managed, not just automated.
Why it matters. A large share of production incidents are self-inflicted by deployments — a bad config, a regressed binary, a schema change without a backout. The cost of a deploy-induced outage is a direct function of two design choices: how big a population the bad version reaches before you notice (blast radius) and how fast you can revert (recovery time). Progressive delivery plus one-click rollback collapses both. Equally, an unverified supply chain is an open door: if you cannot prove what you deployed and that nothing tampered with it, you cannot trust production.
How to do it well — the GCP toolchain. Google provides a coherent, managed path from commit to production:
| Stage | GCP service | What it does |
|---|---|---|
| Source / trigger | Cloud Build triggers (or Cloud Build connected to GitHub/GitLab) | Fires the pipeline on push/PR/tag |
| Build & test | Cloud Build | Runs declarative steps in containers; unit/integration/e2e tests |
| Artifact store | Artifact Registry | Immutable, versioned container images and language packages |
| Provenance | SLSA / Cloud Build attestations + Software Delivery Shield | Generates build provenance (who/what/how built) |
| Admission control | Binary Authorization | Blocks any image lacking required attestations from running on GKE/Cloud Run |
| Vulnerability scan | Artifact Analysis | Scans images for CVEs continuously |
| Progressive delivery | Cloud Deploy | Managed delivery pipeline: dev→staging→prod with approvals, canary, and rollback |
| Fleet config | Config Sync / Policy Controller | GitOps for GKE fleet state and admission policy |
How to do it well — deployment strategies. Pick the rollout pattern by risk and stateful-ness:
| Strategy | Mechanism | Blast radius | Best for |
|---|---|---|---|
| Canary | Route a small % (e.g. 5%) to the new version, watch SLIs, then ramp | A fraction of traffic | Default for stateless services; native in Cloud Deploy and Cloud Run revision traffic splitting |
| Blue-green | Stand up a full new environment, cut over, keep old warm | All-or-nothing but instant rollback | Releases that cannot run two versions side by side |
| Rolling | Replace instances incrementally | Grows with the rollout | GKE Deployments / MIG rolling updates |
| Feature flags | Decouple deploy from release; toggle features at runtime | Per-user/segment | Decoupling shipping code from exposing it |
The decisive practice is automated rollback on SLO regression: wire Cloud Deploy canary phases to Cloud Monitoring verification so a burn-rate breach during the canary automatically aborts and reverts. Treat infrastructure as code as part of releases — Infrastructure Manager (Google’s managed Terraform) or Terraform in the pipeline — so environment changes get the same review, plan, and rollback discipline as application code. Keep artifacts immutable and promote the same artifact through environments (never rebuild per stage), so what you tested is byte-for-byte what you ship.
Artifacts & GCP tooling. This sub-component produces a CI/CD pipeline definition (cloudbuild.yaml), a Cloud Deploy delivery pipeline with named targets and promotion sequence, Binary Authorization policy, deployment-strategy standards per workload tier, a rollback runbook, and IaC modules under version control. The platform team typically ships a golden pipeline template so product teams get canary + verification + rollback by default.
Worked example — build once, deploy progressively
A cloudbuild.yaml that builds one immutable image, emits provenance, and hands off to Cloud Deploy:
steps:
  - name: gcr.io/cloud-builders/docker
    args: ["build", "-t", "asia-south1-docker.pkg.dev/$PROJECT_ID/apps/payments:$SHORT_SHA", "."]
  - name: gcr.io/cloud-builders/docker
    args: ["push", "asia-south1-docker.pkg.dev/$PROJECT_ID/apps/payments:$SHORT_SHA"]
  - name: gcr.io/google.com/cloudsdktool/cloud-sdk
    entrypoint: gcloud
    args:
      - deploy
      - releases
      - create
      - rel-$SHORT_SHA
      - --delivery-pipeline=payments
      - --region=asia-south1
      - --images=payments=asia-south1-docker.pkg.dev/$PROJECT_ID/apps/payments:$SHORT_SHA
options:
  requestedVerifyOption: VERIFIED   # emit build provenance (SLSA) for Binary Authorization
images:
  - asia-south1-docker.pkg.dev/$PROJECT_ID/apps/payments:$SHORT_SHA
The Cloud Deploy pipeline that promotes that same digest through a verified canary to a human-approved prod:
apiVersion: deploy.cloud.google.com/v1
kind: DeliveryPipeline
metadata:
  name: payments
serialPipeline:
  stages:
    - targetId: staging
      profiles: [staging]
    - targetId: prod
      profiles: [prod]
      strategy:
        canary:
          runtimeConfig:
            kubernetes:
              serviceNetworking:
                service: payments
                deployment: payments
          canaryDeployment:
            percentages: [5, 25, 50]   # ramp; verify between each phase
            verify: true
---
apiVersion: deploy.cloud.google.com/v1
kind: Target
metadata:
  name: prod
requireApproval: true                  # human gate before prod
gke:
  cluster: projects/PROJECT_ID/locations/asia-south1/clusters/prod
Two design choices do the heavy lifting: the image is built once and promoted by digest (what you tested is byte-for-byte what ships), and Binary Authorization refuses to run any image lacking the VERIFIED attestation — so a hand-built or tampered image cannot reach the cluster. Wire the canary’s verify step to a Cloud Monitoring SLO check and a burn breach at the 5% phase aborts and reverts before most users ever see the new version.
Automation and toil reduction — eliminating manual, repetitive operational work
What it is. Toil is Google’s precise term for operational work that is manual, repetitive, automatable, tactical, devoid of enduring value, and scales linearly with service growth. The fourth principle’s intent — “alleviate the burden of manual labor” — is to drive toil down so engineers spend their time on engineering, not on hand-cranking the same fix. SRE’s well-known guidance caps toil at roughly 50% of an SRE’s time; above that, reliability and morale both decay.
Why it matters. Toil that scales linearly with the fleet is an existential limit on growth: if every new service adds a fixed slice of manual work, headcount must grow with the estate and humans become the bottleneck and the error source. Manual, repetitive operations are also where outages are born — a fat-fingered console change, a forgotten step, an inconsistent environment. Automation removes the human from the repetitive loop, which simultaneously increases reliability, throughput, and the team’s capacity to do work that compounds.
How to do it well. First measure toil (survey on-call load, count manual interventions) so you can target the worst offenders and prove the win. Then attack it in layers:
| Toil source | Automation on GCP |
|---|---|
| Provisioning & environments | Infrastructure Manager / Terraform; project factory; Config Controller |
| Config drift across a fleet | Config Sync (GitOps) so cluster/fleet state self-heals to Git |
| Scaling under load | Cluster Autoscaler, HPA/VPA, MIG autoscaling, Cloud Run concurrency — capacity as a feedback loop, not a ticket |
| Patching & images | VM Manager (OS patch management); rebuild golden images in Cloud Build |
| Scheduled/event ops | Cloud Scheduler + Cloud Run jobs / Cloud Functions; Workflows and Eventarc to orchestrate |
| Remediation | Event-driven auto-remediation: log/finding → Pub/Sub → Cloud Function that fixes the resource |
| Recommendations | Active Assist / Recommender to surface (and optionally auto-apply) rightsizing, idle-resource, and security fixes |
The cultural complement is “automate yourself out of a job” as a virtue, and the error-budget incentive: when reliability work (including toil reduction) competes with features, the budget policy gives it teeth. Treat automation code as production code — it gets review, testing, and observability — because a buggy auto-remediation can do damage faster than any human.
Artifacts & GCP tooling. The sub-component produces a toil inventory and budget, an automation backlog prioritized by toil-hours saved, runbooks converted into runnable automation (the goal is to demote a runbook from “human follows steps” to “a job runs the steps”), IaC modules, and auto-remediation functions. A useful KPI is the share of incidents auto-detected and auto-mitigated versus those needing a human.
Capacity and quota planning — staying ahead of demand without overpaying
What it is. Capacity planning ensures resources are available to meet demand at the required performance and reliability — before the demand arrives — while not paying for idle headroom. On Google Cloud it has a distinctive second half: quota management. Google enforces per-project, per-region quotas (API rates, CPUs, IP addresses, GPUs, etc.) that act as guardrails; a quota ceiling you did not plan for will throttle a launch or a failover even when the underlying capacity exists. Capacity planning on GCP therefore means modeling demand and ensuring quota (and, for guaranteed capacity, reservations) are in place to serve it.
Why it matters. The failure modes are symmetric and both costly. Under-provisioning (or hitting a quota wall) causes throttling, latency, and outages — and quota limits are an especially nasty surprise because they bite during exactly the surge or regional failover you provisioned hardware for. Over-provisioning quietly burns budget on idle capacity, which the Cost Optimization pillar will charge you for. The pillar’s manage and optimize cloud resources principle (right-sizing, autoscaling, monitoring) is the steady-state half; deliberate capacity planning is the forward-looking half that keeps launches and peak events from falling off a cliff.
How to do it well. Treat capacity as a forecast-and-reserve loop:
| Practice | What to do | GCP mechanism |
|---|---|---|
| Forecast demand | Model organic growth + known events (sales, launches) from historical metrics | Cloud Monitoring history; BigQuery analysis |
| Load-test to the cliff | Find the saturation point and per-instance capacity empirically | Load testing in a prod-like env; document the cliff |
| Right-size | Match machine types/requests to real usage | Active Assist / Recommender rightsizing recommendations |
| Autoscale for variability | Absorb normal variation automatically | HPA/VPA, Cluster Autoscaler, MIG autoscaling, Cloud Run |
| Raise quotas ahead of need | Request increases before the surge or DR test, with lead time | Cloud Quotas API / IAM-managed quota requests; quota alerts at e.g. 80% |
| Guarantee scarce capacity | Reserve when you must not be denied (GPUs, big peaks, DR region) | Compute reservations; CUDs for committed discounts |
| Plan for failover capacity | Ensure the failover region has both quota and headroom for shifted load | Per-region quota review; reservations in the DR region |
The most-missed step is failover capacity and quota: a DR plan that assumes “we’ll just scale up in region B” fails if region B’s project quota was never raised to hold region A’s traffic. Bake quota checks into the readiness PRR and into game days. Use Cloud Quotas to monitor consumption with alerts (e.g. page at 80% of a critical quota) so you raise limits with lead time rather than during an incident.
Artifacts & GCP tooling. This sub-component produces a demand forecast, a capacity model (per-instance capacity × headroom factor), a quota register (which quotas matter, current limit, alert thresholds, DR-region values), a reservation/CUD plan, and autoscaler configurations. The forward review cadence (e.g. quarterly, plus before every major event) is itself an artifact of the operating model.
Going deeper
The error-budget arithmetic, and why the magic numbers are 14.4 and 6. An SLO implies a budget: a 99.9% availability target over 30 days allows 0.1% × 43,200 min ≈ 43.2 minutes of “bad” per month. Burn rate is how fast you’re spending that budget relative to the sustainable pace — a burn rate of 1× spends exactly 100% of the budget across the full window, so time-to-exhaust = window ÷ burn rate (a 10× burn empties a 30-day budget in 3 days). Google’s SRE workbook derives the alerting thresholds from how much budget you’re willing to spend before someone acts: a 1-hour window at 14.4× consumes 14.4 × (1 ÷ 720) ≈ 2% of budget — page-worthy; a 6-hour window at 6× consumes ≈ 5% — ticket-worthy. Requiring a short and a long window to be burning simultaneously suppresses one-minute spikes while still catching a slow leak. This is why you alert on burn rate, not on a raw error count: the same 50 errors mean nothing at 2 a.m. low traffic and a Sev1 at peak.
SLI shapes: request-based vs windows-based, and latency as a distribution cut. The everyday SLI is request-based — good_total_ratio over events (non-5xx ÷ total). Windows-based SLIs instead score time windows as good or bad (“was the system healthy this minute”), which suits metrics that aren’t naturally per-request. Latency uses a distribution cut: you SLO “99% of requests under 800 ms” by counting requests whose latency falls in the sub-threshold buckets, rather than chasing a moving p99 number. Choosing the wrong shape produces SLOs that are technically green while users suffer.
Managed Service for Prometheus is Monarch underneath. MSfP ingests Prometheus exposition and PromQL but stores samples in Google’s global Monarch TSDB — so you get effectively unbounded cardinality and multi-region aggregation without running Prometheus HA, sharding, or Thanos yourself. Exemplars attach a trace ID to a metric sample, so a latency spike on a graph links straight to the exact slow trace. Cost is per-sample ingested — control it by scrape interval and by dropping high-cardinality labels at the collector, not after ingestion.
Log Router internals: sinks, buckets, and the two you already have. Every project ships with a _Required bucket (admin/audit logs, 400-day immutable retention) and a _Default bucket (everything else, 30 days). The Log Router evaluates inclusion/exclusion filters on every entry and copies matches to sink destinations — log buckets, BigQuery, Cloud Storage, or Pub/Sub. Enable Log Analytics on a bucket to query it as a BigQuery-backed dataset in SQL. Use an aggregated sink at the org or folder level to centralize security logs into one project without touching every project individually, and remember each sink has a writer identity that must be granted write access on the destination. Log-based metrics turn a log pattern into a Monitoring time series you can alert on.
Binary Authorization and the software supply chain. The provenance emitted by requestedVerifyOption: VERIFIED is an SLSA attestation signed by an attestor whose key lives in Cloud KMS. The Bin Auth policy (per-cluster or per-project) says “only images with an attestation from attestor X may run”; violations are blocked (enforced mode) or logged (dry-run mode) so you can roll it out safely. Keep a break-glass annotation for emergencies — it deploys and logs the override rather than blocking a Sev1 fix. Artifact Analysis scans continuously, so a CVE disclosed after you deployed still surfaces against the running image.
Cloud Deploy internals: render vs deploy, and automatic rollback. A release first renders manifests once (via Skaffold) into an immutable set, then a rollout applies that render per target. A canary rollout creates a temporary canary/stable split and, with verify: true, runs your verification job between phases. Configure rollback so a failed verification or rollout creates a rollback release to the last-good version — expressible as a Cloud Deploy automation rule, so an SLO breach at 5% reverts with no human in the loop. Targets can requireApproval and can be multi-target (fan out to several clusters/regions at once).
Quota is a control plane, not just a number. GCP quotas come in two kinds: rate quotas (API requests per minute) and allocation quotas (concurrent resources — CPUs, IPs, GPUs per region), both enforced per project, per region. The Cloud Quotas API lets you read consumption, set quota preferences (increase requests expressed as code), and alert near a limit. The trap: a quota is enforced even when physical capacity exists, so a DR failover into region B fails if B’s project quota was never raised to hold A’s traffic. Reservations are the other axis — a reservation guarantees the capacity itself (scarce GPUs, a known peak), whereas a CUD only guarantees the price. Serious DR planning needs both, in the failover region, verified in a game day rather than discovered in an incident.
Toil, the 50% cap, and why it’s an economic argument. Toil scales linearly with the fleet; if each new service adds a fixed slice of manual work, headcount must grow with the estate and humans become both the bottleneck and the error source. Capping toil at ~50% of an SRE’s time protects the engineering half that compounds — automation, better tooling, reliability work. The error-budget policy is the incentive that funds it: when the budget is spent, reliability work (including toil reduction) outranks features by rule. Treat auto-remediation as production code — a buggy remediation loop can damage the fleet faster than any human, so it gets review, tests, rate limits, and a kill switch.
How this pillar wires into the other five. Operational Excellence is the connective tissue of the whole framework. The SLOs you define here are the Reliability pillar’s targets and the deploy gates; the canary + load-to-the-cliff practice is where Performance regressions get caught before users feel them; Binary Authorization and least-privilege deploy identities are Security controls expressed operationally; right-sizing from Recommender and reservation/CUD planning are the same levers the Cost Optimization pillar governs; and the PRR is where all five pillars are checked at once before go-live. Skip Operational Excellence and every other pillar inherits a system nobody can actually run.
Real-world enterprise scenario
Company. Saffron Pay — a fictional pan-India digital-payments platform processing UPI and card transactions for 40 million consumers and 2 million merchants. Their workload runs on GKE (transaction services), Cloud Run (merchant APIs and webhooks), Cloud Spanner (ledger), and Pub/Sub + Dataflow (settlement and reconciliation). Regulatory pressure is high, traffic is spiky (festival sales, salary-day peaks), and a payments outage is front-page news. After a 38-minute partial outage during a festival sale — caused by a bad config deploy that nobody could roll back quickly and a CPU dashboard that told them nothing about why payments were failing — leadership chartered an Operational Excellence program against the Architecture Framework.
Operational readiness. Saffron Pay stood up a Production Readiness Review gate owned by a new SRE platform team. No service reaches the production GKE fleet without a signed PRR covering ownership, SLOs, dashboards, runbooks, load-test evidence, and a tested rollback. They populated Cloud Asset Inventory labels (owner, team, tier, pii) across every project, so the catalog and on-call mapping are queryable. The PRR caught that the webhook service had no runbook and the reconciliation Dataflow job had no owner — both fixed before the next launch.
Observability. They standardized on OpenTelemetry + Managed Service for Prometheus and mandated structured JSON logging with trace context across all services. Per critical user journey — “merchant collects a payment,” “consumer pays via UPI,” “settlement file generated” — they built a Cloud Monitoring dashboard on the four golden signals and a request-based SLO of 99.95% success and p99 < 800 ms for the consumer-pay journey. Logs route via Log Router: hot logs in a log bucket with Log Analytics, audit/security logs tiered to BigQuery (400-day retention) and archived to Cloud Storage. Error Reporting posts every new error group into a Chat space; Cloud Trace is used to find the slow hop — which, in one investigation, was a Spanner hotspot that Cloud Profiler then tied to an inefficient query.
Incident & problem management. They adopted ICS with named IC / Ops / Comms / Scribe roles, a SEV1–SEV4 matrix, and PagerDuty schedules fed by multi-burn-rate SLO alerts (page at 14.4× over 1h; ticket at 6× over 6h). Every SEV1/SEV2 gets a blameless postmortem in a fixed template with owned, due-dated action items tracked to closure. They enabled Personalized Service Health so they distinguish “Saffron Pay broke it” from “Google broke it.” Within two quarters, repeat-cause incidents dropped because problem records forced fixes (e.g. the Spanner hotspot became a schema change, not a recurring page).
Release engineering. The festival-sale root cause — an irreversible bad config — drove the biggest change. They moved to Cloud Build → Artifact Registry (immutable images, scanned by Artifact Analysis) → Binary Authorization (only attested images run) → Cloud Deploy delivery pipelines (dev→staging→prod) with canary rollouts and automatic rollback on SLO regression wired to Cloud Monitoring. Infrastructure changes go through Infrastructure Manager. Feature flags now decouple deploy from release for risky changes. Result: a bad canary aborts at 5% traffic in under two minutes instead of reaching 100%.
Automation & toil reduction. A toil survey showed on-call spent ~40% of time on manual scaling tickets, drift fixes, and patching. They moved fleet config to Config Sync (GitOps self-heal), patching to VM Manager, and built auto-remediation Cloud Functions (e.g. a Pub/Sub-triggered function that re-enables a misconfigured firewall rule from a Security finding). Scheduled reconciliation moved to Cloud Run jobs + Cloud Scheduler. Active Assist rightsizing recommendations are reviewed monthly.
Capacity & quota planning. They built a demand forecast for festival and salary-day peaks, load-tested each journey to its cliff, and created a quota register with Cloud Quotas alerts at 80% per critical quota and per region. Crucially, they raised failover-region quotas and placed Compute reservations + CUDs so a regional failover or a 6× festival surge has both quota and warm headroom — the exact gap that caused the original outage.
Measurable outcome (12 months).
| Metric | Before | After |
|---|---|---|
| MTTR (SEV1) | ~95 min | ~18 min |
| Deploy-induced incidents / quarter | 7 | 1 |
| Change failure rate | ~22% | ~6% |
| Time to roll back a bad release | ~25 min (manual) | < 2 min (auto, at 5% canary) |
| On-call toil (% of time) | ~40% | ~14% |
| Quota/capacity-related throttling events | 4 (incl. the festival outage) | 0 |
| Consumer-pay SLO attainment | not measured | 99.96% (target 99.95%) |
Practice challenges
Work these in order — they climb from “read the budget” to “guarantee a DR failover.” Try each before opening the solution.
1. (Beginner) Turn an SLO into an error budget. A service has a 99.9% availability SLO over a 30-day window. How much “bad time” is the budget, and how long until it is fully spent if the service burns at a steady 10×?
<details><summary>Solution</summary>
Budget = (1 − 0.999) × 30 days = 0.1% × 43,200 min ≈ 43.2 minutes / 30 days. Time-to-exhaust = window ÷ burn rate = 30 days ÷ 10 = 3 days. (Equivalently, a 1-hour window burning at 14.4× spends 14.4 × 1⁄720 ≈ 2% of the month’s budget in that hour.)
Why: burn rate — not a raw error count — is what tells you how urgently to act, because it measures budget spent per unit time against the sustainable pace. </details>
2. (Beginner) Promote a recurring error log to an alertable metric. Cloud Run emits a structured log with jsonPayload.event="payment_declined" at ERROR severity. Create a log-based metric that counts them so you can graph and alert.
<details><summary>Solution</summary>
gcloud logging metrics create payment_declines \
  --description="Count of payment-decline errors" \
  --log-filter='resource.type="cloud_run_revision"
    AND jsonPayload.event="payment_declined"
    AND severity>=ERROR'
Then build a Monitoring alert on the metric type logging.googleapis.com/user/payment_declines.
Why: a log-based metric promotes a text pattern into a graphable, alertable time series with no new application instrumentation. </details>
3. (Intermediate) Centralize audit logs org-wide into BigQuery. Route Cloud Audit Logs from every project under the organization into one BigQuery dataset with a single sink.
<details><summary>Solution</summary>
gcloud logging sinks create audit-to-bq \
  bigquery.googleapis.com/projects/LOG_PROJECT/datasets/audit \
  --organization=ORG_ID \
  --include-children \
  --log-filter='logName:"cloudaudit.googleapis.com"'
# then grant the sink's writerIdentity BigQuery Data Editor on the dataset:
gcloud logging sinks describe audit-to-bq --organization=ORG_ID --format='value(writerIdentity)'
Why: an aggregated sink with --include-children at the org level captures logs from all child projects into one destination without configuring each project — and the sink’s writer identity must be granted write access or nothing lands.
</details>
4. (Intermediate) Make a canary that verifies — and can revert. Define the Cloud Deploy prod stage so a release canaries at 5→25→50% with verification, and give the one command that rolls prod back to the last good release.
<details><summary>Solution</summary>
strategy:
  canary:
    canaryDeployment:
      percentages: [5, 25, 50]
      verify: true
gcloud deploy targets rollback prod \
  --delivery-pipeline=payments \
  --region=asia-south1
Why: verify: true runs a check between canary phases so a bad release is caught at 5%, and targets rollback creates a rollback release to the previous successful render in one step (minutes, not a manual rebuild).
</details>
5. (Advanced) Author the multi-window, multi-burn-rate alert pair. For a 99.9% SLO, specify the two alerting conditions (windows, burn rates, budget consumed, action) and say why you need both.
<details><summary>Solution</summary>
| Policy | Window | Burn rate | Budget consumed | Action |
|---|---|---|---|---|
| Fast | 1 h | 14.4× | ~2% | Page |
| Slow | 6 h | 6× | ~5% | Ticket |
Each condition is a select_slo_burn_rate("<slo>", "3600s") (and "21600s") threshold. To suppress flapping, require a shorter confirmation window (e.g. 5-min) to also be burning before the fast policy fires.
Why: the fast window catches an acute outage quickly; the slow window catches a gradual leak that would otherwise drain the whole budget by month-end — and requiring both a long and short window to burn together filters out one-minute spikes. </details>
6. (Advanced) Guarantee a DR failover has capacity and quota in region B. Region A is asia-south1; the DR region is asia-southeast1. State the two independent things you must secure, and give a runnable command for the capacity half.
<details><summary>Solution</summary>
Two independent axes: capacity (the hardware exists to run region A’s load) and quota (the per-project, per-region ceiling permits it). Reserve the capacity:
gcloud compute reservations create dr-headroom \
  --zone=asia-southeast1-b \
  --vm-count=50 \
  --machine-type=n2-standard-8 \
  --require-specific-reservation
Then raise region-B allocation quota ahead of the game day via Cloud Quotas (a quota preference / increase request) with an 80% consumption alert. A CUD covers the price but not the capacity, so it is not a substitute for the reservation.
Why: a DR plan that assumes “we’ll just scale up in region B” fails if B’s quota was never raised or the capacity was never reserved — verify both in a game day, not in an incident. </details>
Common beginner mistakes
These are misconceptions — the wrong mental model — as distinct from the architect-level pitfalls listed further down.
- “We have dashboards, so we have observability.” Dashboards full of CPU/memory graphs tell you a host is busy, not whether users are in pain. Right model: observability is the ability to ask new questions from telemetry — build SLIs on the success and latency of user journeys, and alert on SLO burn.
- “An SLO of 100% is the safe target.” 100% leaves zero error budget, so every deploy and every dependency blip is a violation and you can never ship. Right model: pick the lowest availability users won’t notice (99.9%, 99.95%) and spend the budget deliberately on change.
- “Alert on CPU so we catch problems early.” High CPU pages the team for non-incidents and misses real user pain (a healthy-looking fleet still returning 503s). Right model: page on symptoms (SLO burn, error ratio); keep resource metrics for diagnosis.
- “We deployed it, so we released it.” Deploy (code is running) and release (users can see the feature) are different things. Coupling them makes every rollout all-or-nothing. Right model: decouple with feature flags so you ship dark and expose gradually.
- “Rollback means redeploy the old version from CI.” Rebuilding is slow and may not be byte-identical to what worked. Right model: promote immutable artifacts by digest and keep the last-good render one click away (Cloud Deploy rollback).
- “The postmortem should find who caused it.” Blameful retrospectives teach people to hide the contributing factors, so the incident recurs. Right model: blameless — fix the system and process that allowed the error; the human is the last line of defense, not the root cause.
- “Toil is just part of on-call.” Manual scaling tickets and drift fixes scale linearly with the fleet and become the bottleneck and the error source. Right model: measure toil, cap it (~50%), and convert runbooks into runnable automation.
- “We have capacity, so failover is fine.” Capacity ≠ quota. The failover region can have hardware and still throttle you at the per-project, per-region quota. Right model: raise failover-region quota and reserve scarce capacity before the game day.
Deliverables & checklist
Common pitfalls
-
Monitoring servers instead of journeys. Dashboards full of CPU/memory and alerts on host metrics page the team for non-incidents and miss real user pain. Avoid it: build SLIs and alerts on the success ratio and latency of critical user journeys, alert on SLO burn rate, and reserve resource metrics for diagnosis, not paging.
-
Deploying without a fast, tested rollback. The classic self-inflicted outage: a bad change reaches 100% of traffic and recovery takes 25 minutes of manual scramble. Avoid it: mandate immutable artifacts, canary with Cloud Monitoring verification, and automatic rollback on SLO regression via Cloud Deploy; keep config changes reversible too.
-
Forgetting quota — especially in the failover region. Hardware exists but the per-project, per-region quota throttles a launch or a DR failover. Avoid it: maintain a quota register, set Cloud Quotas alerts at 80%, raise limits with lead time, and verify failover-region quota and reservations in game days.
-
Postmortems that hunt for a culprit. Blameful retrospectives teach engineers to hide contributing factors, so the same incident recurs. Avoid it: run blameless postmortems focused on systemic and process causes, with action items owned and tracked — and feed recurring causes into problem records.
-
Treating toil as “just the job.” Manual scaling tickets, drift fixes, and patching scale linearly with the fleet and become the bottleneck and the error source. Avoid it: measure toil, cap it (~50%), and convert runbooks into runnable automation — Config Sync, VM Manager, Cloud Run jobs, auto-remediation — with toil-hours-saved as the prioritization metric.
-
Unstructured logs and broken trace context.
printflogs and missingtrace/spanIdfields mean a war room cannot pivot from a metric spike to the offending request. Avoid it: enforce structured JSON logging and end-to-end trace propagation as a platform contract so Cloud Logging ↔ Cloud Trace cross-linking works on every request.
Glossary
- Operational Excellence — the Architecture Framework pillar covering how you run, observe, change, and recover a system day to day; five principles, six engineering sub-components.
- Operational readiness — proving a workload can actually be operated in production before it takes traffic, across people, process, tooling, and governance.
- Production Readiness Review (PRR) — a structured go-live gate (a Google SRE practice) that interrogates a service against a fixed rubric and produces a signed artifact; production deploy permission depends on it.
- SLI (Service Level Indicator) — a measured signal of user-facing behavior, usually a ratio of good events to total (e.g. non-5xx ÷ total requests).
- SLO (Service Level Objective) — a target for an SLI over a window (e.g. 99.95% success over a 30-day rolling period); the line that defines “healthy.”
- SLA (Service Level Agreement) — a contractual promise to customers with consequences; always looser than the internal SLO.
- Error budget — the allowed unreliability (1 − SLO); the currency you spend on change. Exhaust it and the policy freezes risky deploys.
- Error-budget policy — the pre-agreed rule for what happens when the budget is spent (typically: freeze features, redirect to reliability work; security fixes exempt).
- Burn rate — how fast you’re consuming error budget relative to the sustainable pace; burn 1× spends the whole window’s budget exactly on time, 14.4× spends ~2% of a 30-day budget in one hour.
- Multi-window, multi-burn-rate alert — pairing a fast window (page) and a slow window (ticket), each requiring sustained burn, to catch both sudden and gradual budget loss without flapping.
- Four golden signals — latency, traffic, errors, saturation; the minimal metric set that generalizes across services and feeds SLOs.
- Observability — the property that lets you ask arbitrary questions about system behavior from its outputs (metrics, logs, traces, errors) without shipping new code.
- Cloud Operations suite — Google’s Monitoring, Logging, Trace, Error Reporting, and Profiler (formerly Stackdriver).
- Managed Service for Prometheus (MSfP) — Google’s managed, PromQL-compatible metrics service backed by the global Monarch TSDB; scales cardinality without you running Prometheus.
- OpenTelemetry (OTel) — the vendor-neutral standard for instrumenting metrics, logs, and traces; the recommended instrumentation layer.
- Log Router / sink — the pipeline that evaluates every log entry against filters and copies matches to destinations (log buckets, BigQuery, Cloud Storage, Pub/Sub); each sink has a writer identity.
- Log Analytics — a feature that makes a log bucket queryable as a BigQuery-backed dataset in SQL.
- Log-based metric — a Monitoring time series derived from a log pattern, so text logs become graphable and alertable.
- Trace context — the propagated IDs (W3C
traceparentor the legacyX-Cloud-Trace-Context) that let Cloud Trace stitch a request’s spans across services and cross-link to logs. - Incident Command System (ICS) — the role model (Incident Commander, Ops, Comms, Scribe) that distributes cognitive load during an incident.
- Blameless postmortem — a retrospective focused on the system and process that allowed an incident, never on who erred, with owned, tracked action items.
- Problem management — the proactive loop that removes the underlying cause so an incident class never recurs (vs incident management, the reactive loop).
- Toil — manual, repetitive, automatable operational work devoid of enduring value that scales linearly with the fleet; SRE caps it at ~50% of an engineer’s time.
- Canary deployment — routing a small traffic percentage to a new version, verifying SLIs, then ramping; limits blast radius.
- Progressive delivery — the umbrella for canary, blue-green, rolling, and feature-flag strategies that limit how far a bad change spreads.
- Binary Authorization — a deploy-time gate that blocks any image lacking a required attestation from running on GKE / Cloud Run.
- SLSA provenance / attestation — a signed record of who/what/how an artifact was built, used to prove supply-chain integrity.
- Cloud Deploy — Google’s managed continuous-delivery service: rendered releases promoted through targets with canary, approval, verification, and rollback.
- Infrastructure Manager — Google’s managed Terraform service, so infrastructure changes get the same review/plan/rollback discipline as code.
- Quota (rate vs allocation) — per-project, per-region ceilings on API rates or resource counts, enforced even when physical capacity exists.
- Cloud Quotas — the API/console for reading consumption, requesting increases as quota preferences, and alerting near limits.
- Reservation vs CUD — a reservation guarantees the capacity; a committed-use discount guarantees the price. DR often needs both, in the failover region.
- Personalized Service Health — Google’s signal for incidents on Google’s side affecting your specific projects, so you don’t postmortem an outage that was Google’s.
- Game day / DiRT drill — a deliberate exercise of incident response, rollback, and failover capacity (Google’s “Disaster Recovery Testing”), so the muscle exists before it’s needed.
What’s next
Part 3 of the Google Cloud Architecture Framework series covers Security, Privacy & Compliance — applying defense-in-depth, identity-first access, data protection, and compliance controls across your Google Cloud estate.