In a nutshell
Imagine a building inspector who never goes home. Instead of checking your apartment once on move-in day and never again, this inspector walks every room every day. Each time something changes — you swap an appliance, prop a fire door open, or leave a spare key under the mat — they write it on a colour-coded sticky note and pin it to a shared board that anyone with the right badge can read. Trivy Operator is that inspector for your Kubernetes cluster. It continuously scans everything actually running — container images for known vulnerabilities (CVEs), workload settings for misconfigurations, RBAC for over-broad permissions, and image layers for baked-in secrets — and writes every finding back into the cluster as a Kubernetes object you can read with kubectl.
The one thing to hold onto from the start: the inspector writes findings down; it does not lock your doors. Trivy Operator reports, it does not block. It will never stop a vulnerable image from being deployed. That job belongs to a separate layer (an admission controller — more on this later). Confusing “it scanned it” with “it blocked it” is the single most common beginner mistake, so we flag it here and come back to it.
Why should a beginner care? Because most teams only scan images once, in the build pipeline, and then ship. Three weeks later that image is still running, but the world has changed: a new CVE was disclosed against a library inside it, someone hand-edited the Deployment and reintroduced runAsRoot, or a teammate pasted a real database URL into a ConfigMap during an incident. A build-time gate sees none of that, because the build already passed. Trivy Operator answers the question the build gate cannot: “what is exposed in production right now?” — and it keeps answering it on a loop.
Because the findings are ordinary Kubernetes objects (called CRDs — Custom Resource Definitions — introduced in Kubernetes CRDs, Controllers & the Operator Pattern), everything you already use to work with the cluster works on your security posture too: kubectl, RBAC, dashboards, alerts, GitOps. No external SaaS is required for the core loop.
Level: Intermediate · Time: ~38 min
After this lesson you can:
- Install Trivy Operator with Helm and confirm its CRDs and controllers are running.
- Read live vulnerability, misconfiguration, exposed-secret, and RBAC findings as plain
kubectlobjects. - Explain what triggers a re-scan, and use severity filtering so findings stay actionable instead of overwhelming.
- Wire findings into Prometheus/Datadog and route alerts on new criticals without drowning in noise.
- Tune the operator for scale and air-gapped clusters (ClientServer mode, mirrored DB, capped concurrency).
- Draw the line correctly between reporting (this operator) and enforcement (an admission engine).
A platform team running a 240-node EKS fleet gets the same finding in every audit: they scan images in the build pipeline, sign off, and ship — but nobody is looking at what is actually running three weeks later. A base image that was clean at build time has since picked up a critical glibc CVE, a developer patched a Deployment by hand and reintroduced runAsRoot, and a teammate pasted a real database URL into a ConfigMap during an incident and never cleaned it up. None of that shows on a build-time gate, because the build already passed. What they need is a scanner that lives inside the cluster, watches every workload as it changes, and answers a single question on a loop: “what is exposed in production right now?” That is exactly what Trivy Operator does. This guide deploys it on a real cluster, makes its findings first-class Kubernetes objects, and plugs those findings into the ticketing, GitOps, and observability tooling a platform team already runs.
The operator works by reconciling Kubernetes resources. When a Pod is created or its spec changes, the operator schedules a one-off scan Job, and writes the result back into the cluster as a Custom Resource — a VulnerabilityReport per container image, a ConfigAuditReport per workload, an ExposedSecretReport, an RbacAssessmentReport, and (optionally) an InfraAssessmentReport for the control plane. Because the reports are CRDs, everything you already use to query Kubernetes — kubectl, RBAC, admission webhooks, Prometheus exporters, GitOps drift detection — works on your security posture for free. No external SaaS is required for the core loop; the SaaS tools in this guide consume the operator’s output rather than replace it.
Prerequisites
- A Kubernetes cluster on v1.27+ (examples assume EKS, but AKS/GKE/on-prem behave the same), with a worker node pool that can absorb short-lived scan Jobs.
kubectlandhelmv3.12+ configured against the target cluster.- Cluster-admin (or rights to install CRDs and a namespace-scoped operator with a ClusterRole).
- A reachable container registry; for private images, pull credentials available as a Kubernetes
Secret. - Outbound egress (direct or via proxy) to the Trivy vulnerability database (
mirror.gcr.io/ GitHub Container Registry) — or an internal OCI mirror if the cluster is air-gapped. - Optional but assumed here: Argo CD for GitOps, HashiCorp Vault for registry credentials, and a Prometheus/Datadog stack for metrics.
- Comfortable reading a Deployment/Pod spec and using
kubectl get -o json | jq. If CRDs and the controller pattern are new, skim Kubernetes CRDs, Controllers & the Operator Pattern first — the whole design of this tool rests on it.
Target topology
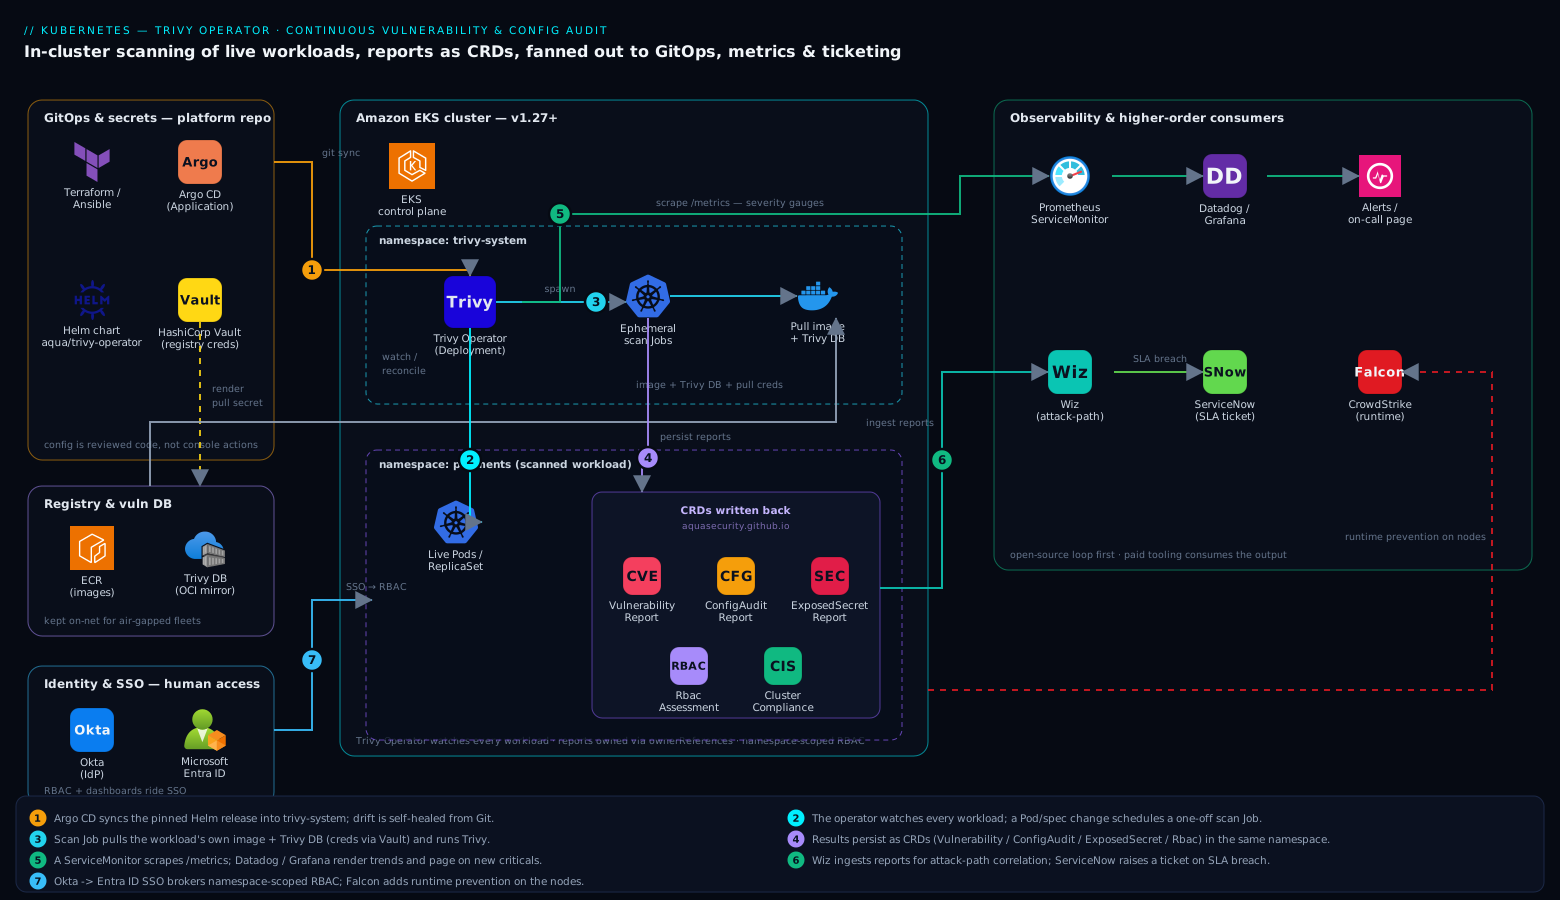
The operator runs as a single Deployment in a dedicated trivy-system namespace. It watches workloads across the cluster, spawns ephemeral scan Jobs (each Job pulls the workload’s own image, runs Trivy in client mode against a shared DB cache, and exits), and persists results as CRDs in the same namespace as the scanned workload. From there the data fans out: a Prometheus ServiceMonitor scrapes the operator’s /metrics, Datadog (or Grafana on top of Prometheus) renders the trend dashboards and pages on new criticals, Wiz ingests the reports through its Kubernetes integration to correlate an in-cluster CVE with its cloud attack path, and a small controller raises a ServiceNow change/incident ticket when a Critical crosses an SLA threshold. Identity for the humans reading any of this is brokered through Okta (federated to Entra ID on the Azure-hosted clusters) so cluster RBAC and dashboard access ride the same SSO. Runtime prevention is a separate layer — CrowdStrike Falcon sensors on the nodes catch live exploitation — while Trivy Operator owns the posture question of what is vulnerable in the first place. The two are complementary, not redundant.
What the operator produces: the report CRDs
Before installing anything, it pays to understand what you get back, because that shapes how you read and act on it. Trivy Operator does not have a UI, a database, or an API of its own. Its entire output is a set of Kubernetes Custom Resources — one report object per thing it scanned — living right next to the workloads they describe. That is the whole design: your security findings become cluster objects, so kubectl, RBAC, GitOps, and Prometheus all “just work” on them.
Here are the report types you will meet, what each answers, and its scope:
| CRD (kind) | Answers the question | Scanned per | Scope |
|---|---|---|---|
VulnerabilityReport |
Which known CVEs are in this image? | container image | namespaced |
ConfigAuditReport |
Is this workload misconfigured (runAsRoot, no limits, hostPath…)? | workload | namespaced |
ExposedSecretReport |
Are there secrets baked into the image layers? | container image | namespaced |
RbacAssessmentReport |
Is this Role over-permissive? | Role | namespaced |
ClusterRbacAssessmentReport |
Is this ClusterRole over-permissive? | ClusterRole | cluster |
InfraAssessmentReport |
Are control-plane/node components hardened (kube-bench style)? | node/component | namespaced |
SbomReport |
What is the full bill of materials for this image? | container image | namespaced |
ClusterComplianceReport |
Does the cluster meet CIS / NSA / PSS controls? | whole cluster | cluster |
A beginner reflex is to treat this as “the CVE tool.” It is much more: two of the four everyday report types (ConfigAuditReport, RbacAssessmentReport) and ExposedSecretReport have nothing to do with CVEs at all, and a baked-in secret or a cluster-admin-equivalent Role is frequently a bigger risk than a Low-severity CVE. Read all of them.
What one report actually looks like
Every report has the same shape: a metadata block (labels tying it to the workload, plus ownerReferences) and a report block with a summary (severity counts) and the detailed findings. Here is a trimmed, representative VulnerabilityReport:
apiVersion: aquasecurity.github.io/v1alpha1
kind: VulnerabilityReport
metadata:
  name: replicaset-checkout-7c9f-checkout
  namespace: payments
  labels:
    trivy-operator.resource.kind: ReplicaSet
    trivy-operator.resource.name: checkout-7c9f
    trivy-operator.container.name: checkout
    resource-spec-hash: 7d6c8b5f9c      # fingerprint of the scanned pod spec
  ownerReferences:
    - apiVersion: apps/v1
      kind: ReplicaSet
      name: checkout-7c9f
      controller: true                   # report is GC'd when the RS is deleted
report:
  artifact:
    repository: myorg/checkout
    tag: "1.4.2"
  scanner:
    name: Trivy
    vendor: Aqua Security
    version: "0.55.0"
  summary:                               # the fast path — read this for gating
    criticalCount: 2
    highCount: 5
    mediumCount: 12
    lowCount: 30
    unknownCount: 0
  vulnerabilities:                        # the detail — one entry per CVE
    - vulnerabilityID: CVE-2024-2961
      resource: libc6
      installedVersion: 2.31-13+deb11u5
      fixedVersion: 2.31-13+deb11u6       # empty here means "no fix yet"
      severity: CRITICAL
      score: 8.1
      title: "glibc: out-of-bounds write in iconv"
      primaryLink: https://avd.aquasec.com/nvd/cve-2024-2961
Three fields do most of the work in practice. The resource-spec-hash label is how the operator knows whether a workload has changed since the last scan (see below). The ownerReferences make the report a child of the workload, so Kubernetes garbage-collects it automatically when the workload is deleted — there is no stale-data cleanup to run. And the report.summary counts are what you gate and alert on; the per-CVE vulnerabilities list is what a human reads when triaging.
What triggers a scan
The operator is a controller: it runs a reconcile loop over workload resources (Deployments, StatefulSets, DaemonSets, CronJobs, Jobs, ReplicaSets, bare Pods). A scan is (re)triggered in three situations:
- A workload appears or its spec changes. The operator computes the
resource-spec-hashfrom the pod template. If no report with that hash exists, it schedules a scan. Change the image tag, add a volume, flip a security context — new hash, new scan. - The report’s TTL expires.
operator.scannerReportTTL(we set24h) forces a re-scan of unchanged workloads on a cadence. This is what surfaces a CVE that was disclosed after you deployed: the image never changed, but the vulnerability database did. - You change the scanner configuration. Bump the Trivy settings and a config-hash changes, invalidating existing reports so everything is re-evaluated against the new rules.
That trio — spec change, TTL, config change — is the entire “when does it scan?” model. There is no cron you manage per workload; you set a TTL and let reconciliation do the rest.
The severity model
Trivy classifies every finding as CRITICAL, HIGH, MEDIUM, LOW, or UNKNOWN, derived from CVSS scores and vendor advisories. Two settings decide how much of that you actually see, and getting them right is the difference between a report people read and one they mute:
trivy.severity(defaultUNKNOWN,LOW,MEDIUM,HIGH,CRITICAL) — the severities included in reports. Narrowing toHIGH,CRITICALcuts the noise floor dramatically on busy clusters.trivy.ignoreUnfixed— hides CVEs that have no fixed version available yet. There is nothing you can do about an unfixable CVE except accept or replace the component, so surfacing it in the daily report usually just buries the actionable findings.
These are the two highest-leverage dials in the whole system. We turn ignoreUnfixed on in the install below and revisit noise management in Going deeper.
1. Install the CRDs and the operator with Helm
Add Aqua’s chart repository and install the operator into its own namespace. Pin the chart version so the install is reproducible and reviewable in Git.
helm repo add aqua https://aquasecurity.github.io/helm-charts/
helm repo update

helm upgrade --install trivy-operator aqua/trivy-operator \
  --namespace trivy-system \
  --create-namespace \
  --version 0.24.1 \
  --set="trivy.ignoreUnfixed=true" \
  --set="operator.scannerReportTTL=24h" \
  --set="operator.vulnerabilityScannerScanOnlyCurrentRevisions=true" \
  --set="trivyOperator.scanJobsConcurrentLimit=5" \
  --wait
What each flag buys you in practice:
trivy.ignoreUnfixed=true— suppress CVEs that have no fixed version yet. This is the single highest-signal setting: without it, teams drown in unactionable findings and stop reading reports entirely. Turn it off later for an exhaustive audit.operator.scannerReportTTL=24h— re-scan every workload at least daily so the DB updates surface newly disclosed CVEs against images that have not changed.vulnerabilityScannerScanOnlyCurrentRevisions=true— only scan the live ReplicaSet, not historical ones, which avoids a flood of Jobs on busy clusters.scanJobsConcurrentLimit=5— cap how many scan Jobs run at once so a cold-start scan of the whole fleet does not stampede the node pool.
Confirm the CRDs registered and the operator is up:
kubectl get crd | grep aquasecurity.github.io
kubectl -n trivy-system rollout status deploy/trivy-operator
kubectl -n trivy-system logs deploy/trivy-operator | tail -n 20
You should see CRDs including vulnerabilityreports, configauditreports, exposedsecretreports, and rbacassessmentreports, and a log line like Started workers for each controller.
2. Give scanners access to private registries via Vault
Scan Jobs pull the workload’s image, so they need the same pull credentials your workloads use. Rather than committing a registry secret, pull it from HashiCorp Vault at deploy time. Here the Vault Agent Injector (already running in the cluster) renders a dockerconfigjson into the operator-managed Jobs through a referenced ServiceAccount; the operator picks up any imagePullSecrets on the scanned workload’s ServiceAccount automatically, so the cleanest pattern is to let Vault populate that secret.
# One-time: store the registry creds in Vault (run by a Vault admin, not in CI)
vault kv put secret/platform/registry \
  username="aws" \
  password="$(aws ecr get-login-password --region eu-west-1)"

# Annotate the workload's ServiceAccount so Vault Agent renders the pull secret.
# Trivy Operator inherits imagePullSecrets from the workload it is scanning.
kubectl -n payments annotate serviceaccount default \
  vault.hashicorp.com/agent-inject="true" \
  vault.hashicorp.com/role="registry-reader" --overwrite
For air-gapped clusters, point the operator at an internal mirror of the Trivy DB and the registry instead, so no scan Job ever needs public egress:
helm upgrade trivy-operator aqua/trivy-operator -n trivy-system --reuse-values \
  --set="trivy.dbRepository=registry.internal.corp/trivy-db" \
  --set="trivy.javaDbRepository=registry.internal.corp/trivy-java-db"
This is also where you would point at a registry served by Akamai’s CDN for geo-distributed clusters, keeping DB pulls on-net and fast.
3. Manage the operator declaratively with Argo CD
A security control you installed by hand will drift. Put the Helm release under Argo CD so the operator’s configuration is reconciled from Git, and any out-of-band kubectl edit is reverted automatically — drift detection on your scanner itself.
# argocd/trivy-operator.yaml — committed to the platform GitOps repo
apiVersion: argoproj.io/v1alpha1
kind: Application
metadata:
  name: trivy-operator
  namespace: argocd
spec:
  project: platform-security
  source:
    repoURL: https://aquasecurity.github.io/helm-charts/
    chart: trivy-operator
    targetRevision: 0.24.1
    helm:
      valuesObject:
        trivy:
          ignoreUnfixed: true
        operator:
          scannerReportTTL: "24h"
          metricsFindingsEnabled: true
  destination:
    server: https://kubernetes.default.svc
    namespace: trivy-system
  syncPolicy:
    automated:
      prune: true
      selfHeal: true   # revert manual changes to the scanner config
    syncOptions:
      - CreateNamespace=true
kubectl apply -f argocd/trivy-operator.yaml
argocd app sync trivy-operator
The same job done in a non-GitOps shop fits naturally into a Jenkins or GitHub Actions pipeline: a helm upgrade --install step driven by Terraform (the helm_release resource) or an Ansible kubernetes.core.helm task, gated behind a pull-request review of the values file. Whatever the runner, the principle holds — the scanner’s config is reviewed code, not a console action.
4. Read the findings as Kubernetes objects
This is the payoff: your security posture is now queryable with plain kubectl. Trigger a scan implicitly by deploying anything, or just inspect what the operator has already produced.
# Vulnerability reports across the whole cluster, summarised
kubectl get vulnerabilityreports -A \
  -o custom-columns='NS:.metadata.namespace,WORKLOAD:.metadata.labels.trivy-operator\.resource\.name,CRIT:.report.summary.criticalCount,HIGH:.report.summary.highCount'

# Drill into one report's actual CVEs, sorted by severity
kubectl -n payments get vulnerabilityreport \
  replicaset-checkout-7c9f-checkout -o json \
  | jq '.report.vulnerabilities[] | select(.severity=="CRITICAL") | {id:.vulnerabilityID, pkg:.resource, fixed:.fixedVersion}'

# Misconfigurations (runAsRoot, missing limits, hostPath mounts, …)
kubectl get configauditreports -A \
  -o custom-columns='NS:.metadata.namespace,NAME:.metadata.name,CRIT:.report.summary.criticalCount,HIGH:.report.summary.highCount'

# Hard-coded secrets the operator found baked into image layers
kubectl get exposedsecretreports -A

# Over-permissive RBAC the operator flagged
kubectl get rbacassessmentreports -A
Because these are real RBAC-scoped resources, you can hand a development team read access to their own namespace’s reports without exposing the rest of the cluster — a Role granting get/list on vulnerabilityreports.aquasecurity.github.io is all it takes. Combined with Okta-driven group-to-RBAC mapping, each squad sees exactly its own posture and nothing else.
5. Export metrics and route alerts
The operator exposes Prometheus metrics, including per-severity gauges, on its service. Wire them in so trends and alerts live next to the rest of your platform telemetry.
# servicemonitor.yaml — requires metricsFindingsEnabled: true (set in step 3)
apiVersion: monitoring.coreos.com/v1
kind: ServiceMonitor
metadata:
  name: trivy-operator
  namespace: trivy-system
  labels:
    release: kube-prometheus-stack
spec:
  selector:
    matchLabels:
      app.kubernetes.io/name: trivy-operator
  endpoints:
    - port: metrics
      interval: 30s
# Alert rule: any new CRITICAL vulnerability across the fleet
sum by (namespace) (
  trivy_image_vulnerabilities{severity="Critical"}
) > 0
For shops on Datadog rather than raw Prometheus, the Datadog Agent’s OpenMetrics check scrapes the same /metrics endpoint — add a pod annotation and the trivy_image_vulnerabilities series flows into a Datadog monitor that pages on-call. Dynatrace consumes it the same way via its Prometheus ingest. The dashboard everyone actually wants is simple: total criticals over time, trending toward zero, with a spike every time a new CVE is disclosed against a running image.
Two higher-order consumers close the loop:
- Wiz ingests Trivy Operator reports through its Kubernetes integration, then correlates an in-cluster CVE with cloud context — is the vulnerable Pod on a node with an over-permissive IAM role reachable from the internet? That attack-path view turns a list of CVEs into a ranked “fix this one first.” Wiz Code carries the same finding back to the originating repo so the fix lands at the source.
- A lightweight controller (or a Datadog webhook) opens a ServiceNow incident when a
Criticalwith a known fix breaches its remediation SLA, attaching theVulnerabilityReportso the assigned team has the CVE, package, and fixed version without leaving the ticket.
6. (Optional) Tighten with Built-in Compliance and infra checks
Enable cluster compliance reporting (CIS Kubernetes Benchmark, NSA hardening) and control-plane infra assessment for a fuller posture beyond per-workload scans.
helm upgrade trivy-operator aqua/trivy-operator -n trivy-system --reuse-values \
  --set="compliance.cron='0 */6 * * *'" \
  --set="operator.infraAssessmentScannerEnabled=true" \
  --set="operator.clusterComplianceEnabled=true"

# After the next cron tick:
kubectl get clustercompliancereports
kubectl get clustercompliancereport cis -o json | jq '.status.summary'
This is where Trivy Operator’s posture data feeds your audit narrative directly — a clustercompliancereport is exportable evidence for the CIS controls an auditor will ask about.
Validation
Prove the loop works end to end by deploying a deliberately vulnerable workload and watching the report appear.
# A known-vulnerable image used widely for testing
kubectl create deployment vuln-demo --image=docker.io/knqyf263/vuln-image:1.2.3

# Watch the scan Job spawn, run, and complete in trivy-system
kubectl -n trivy-system get jobs -w   # Ctrl-C once a scan-* Job shows Completions 1/1

# The report should now exist in the workload's namespace (default here)
kubectl get vulnerabilityreports -l trivy-operator.resource.name=vuln-demo \
  -o custom-columns='NAME:.metadata.name,CRIT:.report.summary.criticalCount,HIGH:.report.summary.highCount'
A non-zero CRIT/HIGH count confirms the operator detected the workload, spawned a scan, pulled the image, and persisted results. Then verify the supporting plumbing:
# Metrics endpoint is serving severity gauges
kubectl -n trivy-system port-forward deploy/trivy-operator 5000:5000 &
curl -s localhost:5000/metrics | grep trivy_image_vulnerabilities | head

# Config-audit and secret scans also ran
kubectl get configauditreports,exposedsecretreports -A | head
Finally, confirm Prometheus is scraping the target (Status -> Targets in the Prometheus UI should list trivy-operator as UP) and that your Datadog/Grafana panel shows the demo’s criticals. Then delete the demo: kubectl delete deployment vuln-demo. Its reports are garbage-collected automatically because they are owned by the workload.
Rollback and teardown
The operator is namespaced and additive — removing it leaves your workloads untouched. If you installed via Argo CD, delete the Application (with prune) or roll targetRevision back to the previous chart version and sync. For a direct Helm install:
helm uninstall trivy-operator -n trivy-system
Helm intentionally does not delete CRDs on uninstall, so the report objects persist until you remove them explicitly. To fully clean up:
kubectl delete vulnerabilityreports,configauditreports,exposedsecretreports,rbacassessmentreports,infraassessmentreports --all -A
kubectl get crd -o name | grep aquasecurity.github.io | xargs kubectl delete
kubectl delete namespace trivy-system
Because every report is owned (via ownerReferences) by the workload that produced it, deleting a Deployment cleans up its reports on its own — there is no orphaned-data problem to manage during normal operations.
Common pitfalls
- Scan Jobs stuck
Pending. The node pool cannot schedule the ephemeral Jobs — usually no room, or a taint the Job does not tolerate. SetscanJobsConcurrentLimitlower, or give the Jobs resource requests and tolerations via--set scanJob.podTemplateLabels/ node selectors so they land on a dedicated pool. - Every image shows hundreds of CVEs. You forgot
ignoreUnfixed=true, so unpatchable findings bury the actionable ones. Start strict-but-actionable, then widen. ImagePullBackOffon the scan Job, not the workload. The Job lacks pull credentials for a private registry. Fix the ServiceAccountimagePullSecretson the scanned workload (step 2) — the operator inherits them.- DB download failures in air-gapped clusters. The scanner cannot reach the public Trivy DB. Mirror it (
trivy.dbRepository) and serve it internally; never punch a hole to the internet for a security tool. - Reports look stale. Without
scannerReportTTL, an unchanged image is never re-scanned, so a CVE disclosed after deploy never surfaces. Set a TTL of 24h or less. - Operator OOMKilled on large clusters. Raise the operator’s memory limit and lower scan concurrency; thousands of workloads mean thousands of reconciles.
Security notes
Trivy Operator is a posture tool: it tells you what is vulnerable, not who is attacking. Pair it with a runtime sensor — CrowdStrike Falcon on the nodes catches live exploitation and lateral movement that a scanner never sees — so you cover both “what is exposed” and “what is being exploited.” Lock down the operator itself: its ClusterRole is read-heavy by design, but scan Jobs run in your cluster, so pin them to a hardened node pool and apply a restrictive seccomp/PodSecurity profile. Treat ExposedSecretReport findings as incidents, not backlog — a secret baked into an image layer is already compromised and must be rotated, not just rebuilt. And keep the trust boundary clear: human access to reports and dashboards rides Okta/Entra ID SSO and namespace-scoped RBAC, so a developer sees only their own services’ posture.
Cost notes
The operator’s own footprint is small — a single lightweight Deployment. The real cost is the burst of short-lived scan Jobs, which is CPU/memory you already pay for on existing nodes; cap it with scanJobsConcurrentLimit and a dedicated, scale-to-zero node group so scans do not compete with production at peak. Mirroring the Trivy DB internally (and optionally fronting it with Akamai) cuts repeated egress and registry-rate-limit pain on large fleets. Crucially, the core scanning loop is open-source and free; the paid tooling (Wiz for attack-path correlation, Datadog/Dynatrace for dashboards, ServiceNow for ticketing) consumes the operator’s output, so you can stand up the full continuous-audit capability first and add commercial correlation only where it earns its keep.
Going deeper
Everything above gets you a working, GitOps-managed scanner. This section is for the engineer who now owns it at scale, air-gapped, and integrated — the internals and the design decisions that separate “it runs” from “it runs on a 240-node fleet without paging anyone at 3 a.m.”
Inside a scan Job: what actually runs
When reconciliation decides a workload needs scanning, the operator does not scan inline. It creates a short-lived Kubernetes Job (in the trivy-system namespace by default) whose pod does the work, then exits. Isolating the scan in a Job is deliberate: a heavy image scan cannot OOM or stall the operator itself, the Job inherits the scanned workload’s imagePullSecrets so it can pull private images, and Kubernetes handles its lifecycle and cleanup.
Inside that Job, Trivy inspects the target image’s layers to enumerate OS packages (apk/dpkg/rpm) and language dependencies (npm, pip, Go modules, Maven…), then matches each against the vulnerability database. The result is streamed back and the operator writes it into the VulnerabilityReport. The knobs that matter operationally:
trivyOperator.scanJobsConcurrentLimit— how many scan Jobs run at once (default 10; we lowered it to 5). This is your throttle against a fleet-wide cold start stampeding the node pool.scanJob.tolerations/scanJob.nodeSelector/scanJob.affinity— steer scan Jobs onto a dedicated (ideally scale-to-zero) node group so they never compete with production pods.trivy.resources.requests/trivy.resources.limits— a large image scan can want 500Mi–1Gi of memory; set these so Jobs schedule predictably and do not get OOMKilled mid-scan.scanJob.podTemplateLabels/ annotations — needed if a service mesh or network policy would otherwise block the Job’s egress to the DB. (If you run a default-deny mesh, see Kubernetes Network Policies — scan Jobs need an explicit allow to the DB source.)
Standalone vs ClientServer: database caching at scale
By default the operator runs Trivy in Standalone mode (trivy.mode=Standalone): every scan Job downloads the vulnerability database itself. On a handful of workloads that is fine. On hundreds, it is a problem — N Jobs means N database pulls, which burns bandwidth and trips registry rate limits (the classic Docker Hub / GHCR throttle).
ClientServer mode fixes this. You deploy a central trivy-server (the chart does it when you set trivy.mode=ClientServer), which holds and refreshes the DB once; the scan Jobs run Trivy as thin clients that query the server instead of downloading anything:
helm upgrade trivy-operator aqua/trivy-operator -n trivy-system --reuse-values \
  --set="trivy.mode=ClientServer" \
  --set="trivy.serverURL=http://trivy-operator-trivy-server.trivy-system:4954"
One DB refresh, many cheap clients. For any fleet past a few dozen distinct images, ClientServer is the default you want. The upstream Trivy DB is rebuilt roughly every six hours, so in ClientServer mode the server picks up fresh advisories on that cadence and every subsequent scan sees them — this is what makes the daily scannerReportTTL re-scan meaningful.
Air-gapped operation, end to end
The step-2 snippet mirrored the vuln DB. A fully air-gapped install has three pull sources to redirect so no scan Job ever needs public egress:
trivy.dbRepository— the main vulnerability DB (defaultmirror.gcr.io/aquasec/trivy-db), mirrored to your internal OCI registry.trivy.javaDbRepository— the separate Java index DB (defaultmirror.gcr.io/aquasec/trivy-java-db), only pulled when a Java artifact is scanned, and easy to forget until a Java workload fails.- The misconfiguration checks bundle that powers
ConfigAuditReport, which Trivy also pulls as an OCI artifact — mirror it alongside the DBs.
Combine mirroring with ClientServer mode so the server is the only component that ever refreshes from your internal mirror, and the Jobs stay fully offline. Never carve a firewall exception to the public internet for a security tool: a scanner that phones home through a hole you punched is its own risk.
SBOMs as a byproduct
With operator.sbomGenerationEnabled=true (on by default in current versions) the operator also emits an SbomReport (and cluster-scoped ClusterSbomReport) per image, in CycloneDX format — a complete software bill of materials for everything running:
kubectl get sbomreports -A
kubectl -n payments get sbomreport <name> -o json | jq '.report.components | length'
That matters beyond curiosity: when the next log4shell-class advisory drops, an SBOM already in-cluster lets you answer “are we affected, and where?” with a kubectl/jq query in seconds instead of re-scanning the fleet. It also feeds supply-chain tooling downstream — see Securing the Container Supply Chain: Cosign, SBOMs, and SLSA for signing and provenance that pair with these SBOMs.
Compliance reports: CIS, NSA, PSS
Step 6 enabled ClusterComplianceReport. Under the hood these are not a separate scan — they are a mapping: a compliance spec (cis, nsa, pss-baseline, pss-restricted) lists controls, each control points at findings the operator already produces (config-audit and infra-assessment results), and the report rolls them up into pass/fail per control on the compliance.cron schedule:
kubectl get clustercompliancereports          # cis, nsa, pss-baseline, pss-restricted
kubectl get clustercompliancereport nsa -o json | jq '.status.summary'
Because the raw evidence (which workload failed which check) is right there in the underlying reports, a clustercompliancereport is defensible audit evidence, not a black-box score. Pair it with Pod Security Admission: PSA enforces the baseline/restricted profiles at admission, while the PSS compliance report measures how close the running fleet is.
Metrics, cardinality, and sane alerting
The operator serves Prometheus metrics on :8080 by default (OPERATOR_METRICS_BIND_ADDRESS), and with metricsFindingsEnabled: true (set in step 3) it exposes per-finding series you can slice by severity:
trivy_image_vulnerabilities{severity="Critical"}trivy_image_exposedsecrets{severity="Critical"}trivy_resource_configaudits{severity="High"}trivy_role_rbacassessments{severity="High"}
Note the severity label values are Title-case here (Critical, High), unlike the upper-case CRITICAL inside a report’s JSON — a small gotcha that produces empty PromQL if you get it wrong.
Two cardinality warnings. First, resist the option to attach the CVE ID as a metric label (metricsVulnIdEnabled): a fleet with thousands of images times thousands of CVEs is a cardinality bomb that will hurt Prometheus far more than it helps you. Keep CVE-level detail in the reports, keep metrics at severity granularity. Second, alert on the right shape. Alerting on an absolute count (> 0 criticals) fires forever until every last critical is gone — guaranteed alert fatigue. Prefer alerting on new criticals appearing:
# Page only when criticals INCREASE in the last 10m (a new one appeared),
# not for the standing backlog you are already working through.
sum by (namespace) (
  increase(trivy_image_vulnerabilities{severity="Critical"}[10m])
) > 0
See Prometheus & Grafana on Kubernetes for wiring the ServiceMonitor and building the trend dashboard.
Report ≠ enforcement: where admission control fits
This is the architectural point the In a nutshell opener promised to return to, and the one most worth internalising. Trivy Operator observes and records. It never blocks anything. A brand-new Deployment with a hundred criticals will be admitted, scheduled, and run — and then get a red report. If you need to prevent a bad image from being admitted in the first place, that is a job for an admission controller, which is a genuinely different mechanism:
| Layer | When | Mechanism | Blocks? |
|---|---|---|---|
| Build-time SCA | in CI, pre-merge | trivy fs / Snyk in the pipeline |
fails the build |
| Registry scan | at image push | ECR / Harbor / ACR scanning | can quarantine the tag |
| Admission gate | at kubectl apply |
Kyverno / Gatekeeper webhook | rejects the request |
| Runtime operator | continuously, post-deploy | Trivy Operator | no — reports only |
The admission layer is where “no” lives. Kyverno or OPA Gatekeeper can reject a Pod at the API server; Kyverno’s verifyImages specifically checks a cosign signature and attestations, so you admit only images that were signed and, optionally, that carry a passing scan attestation. That is a supply-chain trust check at admission time. Trivy Operator is the runtime posture check after admission. They answer different questions — “should this image be allowed in?” versus “what is wrong with what is already running?” — and a mature setup runs both. (For the webhook machinery underneath, see Kubernetes Admission Control, In Depth.)
Managing noise: severity, ignore files, and VEX
A scanner nobody reads is worse than no scanner, because it manufactures false confidence. Beyond ignoreUnfixed and narrowing trivy.severity, you have graduated tools for suppression, roughly in order of preference:
trivy.ignoreFile— a.trivyignorelist of specific CVE IDs to hide. Blunt but explicit; use it for a documented, time-boxed accepted risk, never as a silent dumping ground.trivy.ignorePolicy— a Rego policy that filters findings programmatically (e.g. “ignore MEDIUM in namespaces labelledtier=sandbox”). Structured, reviewable, versioned in Git.- VEX (Vulnerability Exploitability eXchange) — the emerging best practice. A VEX document (OpenVEX / CSAF / CycloneDX flavours) is a signed, auditable statement that a specific CVE is not exploitable in your context — for instance because the vulnerable function is never reachable. Trivy consumes VEX to suppress non-exploitable findings with a paper trail, which is categorically better than a blanket ignore: the suppression carries its own justification. Treat VEX as the direction of travel for taming CVE noise honestly.
The governing principle: every suppression should be documented, attributable, and expiring. A silent ignore is a future incident.
Where it sits versus registry and build-time scanning
Teams often ask “we already scan images in ECR — why also run this?” Because they see different things at different times. The comparison table above lays out the layers; the key insight is that only the runtime operator re-evaluates what is actually deployed against a database that keeps changing. A registry scan is a point-in-time verdict at push; it does not know which of those images you actually deployed, and it does not re-scan a two-month-old running Pod when a fresh CVE lands. Build-time and registry scanning shift left (cheaper to fix early); the operator covers the long tail of post-deploy drift, hand-patched workloads, and newly disclosed CVEs against images that have not changed since they shipped. They are complementary, not substitutes — you want the whole ladder, not one rung.
Practice challenges
Work these against a cluster with the operator installed and a few workloads scanned. Each has a worked solution — try first, then check.
1. (Beginner) Rank the fleet by exposure. List every VulnerabilityReport across all namespaces, showing critical and high counts, sorted so the worst offender is on top.
<details> <summary>Solution</summary>
kubectl get vulnerabilityreports -A -o json \
  | jq -r '.items[] | [.metadata.namespace, .metadata.name,
      .report.summary.criticalCount, .report.summary.highCount] | @tsv' \
  | sort -k3 -rn
Why: the report.summary counts are the fast path — you never need the full CVE list just to triage which workload to look at first.
</details>
2. (Beginner) Show only the fixable criticals for one workload. For a single report, print each CRITICAL CVE that has a fixed version, with its package and the version to upgrade to.
<details> <summary>Solution</summary>
kubectl -n payments get vulnerabilityreport replicaset-checkout-7c9f-checkout -o json \
  | jq '.report.vulnerabilities[]
        | select(.severity=="CRITICAL" and .fixedVersion != "")
        | {id:.vulnerabilityID, pkg:.resource, upgradeTo:.fixedVersion}'
Why: filtering on a non-empty fixedVersion is the manual version of ignoreUnfixed — it leaves only findings a developer can actually act on today.
</details>
3. (Intermediate) Write a CI gate on severity. Produce a shell one-liner that exits non-zero if any workload in the payments namespace has one or more criticals — the kind of check a pipeline runs before promoting a release.
<details> <summary>Solution</summary>
kubectl get vulnerabilityreports -n payments \
  -o jsonpath='{range .items[*]}{.report.summary.criticalCount}{"\n"}{end}' \
  | awk '{s+=$1} END{print "criticals:", s; exit (s>0)}'
Why: exit (s>0) turns the aggregate count into a pass/fail exit code. This is your gate reading the operator’s reports — the operator still did not block anything; you built the enforcement on top.
</details>
4. (Intermediate) Look past CVEs. Find the highest-severity ExposedSecretReport and RbacAssessmentReport findings in the cluster — the non-CVE risks beginners overlook.
<details> <summary>Solution</summary>
kubectl get exposedsecretreports -A -o json \
  | jq -r '.items[] | select(.report.summary.criticalCount>0)
           | "\(.metadata.namespace)/\(.metadata.name): SECRET IN IMAGE"'

kubectl get rbacassessmentreports -A -o json \
  | jq -r '.items[] | .report.checks[]
           | select(.severity=="HIGH" or .severity=="CRITICAL") | .title' \
  | sort -u
Why: an ExposedSecretReport hit is an incident — the secret is already in a shared image layer and must be rotated, not merely rebuilt out.
</details>
5. (Advanced) Cut the noise via GitOps. Change the Argo CD Application so the operator reports only HIGH,CRITICAL, hides unfixed CVEs, keeps a 12h TTL, and enables SBOMs — all as reviewed values, not a live --set.
<details> <summary>Solution</summary>
# patch the helm.valuesObject in argocd/trivy-operator.yaml
spec:
  source:
    helm:
      valuesObject:
        trivy:
          severity: "HIGH,CRITICAL"
          ignoreUnfixed: true
        operator:
          scannerReportTTL: "12h"
          sbomGenerationEnabled: true
          metricsFindingsEnabled: true
Why: with selfHeal: true, a live helm --set would just be reverted by Argo CD on the next sync — the values file is the source of truth, so the change belongs there and goes through review.
</details>
6. (Advanced) Scale the DB strategy. The fleet has grown to 300 distinct images and scan Jobs are intermittently failing on registry rate limits. Reconfigure so the database is fetched once, not once per Job, and explain the math.
<details> <summary>Solution</summary>
helm upgrade trivy-operator aqua/trivy-operator -n trivy-system --reuse-values \
  --set="trivy.mode=ClientServer" \
  --set="trivy.serverURL=http://trivy-operator-trivy-server.trivy-system:4954"
Why: Standalone mode is one DB pull per scan Job — 300 images can mean 300 pulls and a rate-limit wall. ClientServer collapses that to a single server that refreshes the DB (~every 6h) while Jobs become thin clients that download nothing. </details>
Common beginner mistakes
These are misconceptions, not typos — each is a wrong mental model, why it is wrong, and the model to replace it with.
- “Trivy Operator will block vulnerable images from deploying.” It will not. It only observes running workloads and writes reports; nothing is gated, ever. Blocking is a different layer — an admission controller like Kyverno or Gatekeeper. Right model: the operator is the smoke detector; the admission engine is the lock on the door. You need both, and they are not the same device.
- “Install it once and you’re covered.” A scanner is only as current as its database. Without
scannerReportTTLre-scans and a fresh DB (or a refreshed air-gap mirror), a CVE disclosed after you deployed never surfaces against an unchanged image. Right model: it is a living feed, not a one-time audit — keep the TTL at 24h or less and keep the DB current. - “Page the team on every finding.” Alert on absolute counts or on Mediums and Lows and people will mute the channel within a week, criticals included. Right model: page only on new, fixable criticals (the
increase(...)alert above); dashboard everything else and review it on a cadence. - “It’s a CVE tool.” Fixating on
VulnerabilityReportmeans ignoringConfigAuditReport(runAsRoot, missing limits),RbacAssessmentReport(over-broad Roles), andExposedSecretReport(secrets in image layers) — any of which can outrank a Low CVE. Right model: four everyday report types, read all of them, and treat an exposed secret as an incident. - “Scan Jobs are free.” Each Job is real CPU and memory, plus a DB pull in Standalone mode; a fleet-wide cold start can stampede your nodes and trip registry rate limits. Right model: cap
scanJobsConcurrentLimit, move to ClientServer at scale, and give Jobs a dedicated scale-to-zero node group. - “A green build means clean runtime.” The build passed weeks ago; the running image has since accumulated new CVEs, and someone may have hand-edited the live workload. Right model: build-time and runtime are different questions — the operator exists precisely to answer “what is exposed now,” which the build gate cannot.
Glossary
- Trivy — Aqua Security’s open-source scanner for images, filesystems, and IaC. The engine the operator runs inside its scan Jobs.
- Trivy Operator — the in-cluster controller that runs Trivy continuously against live workloads and writes findings back as CRDs.
- Controller / reconcile loop — a program that watches Kubernetes objects and drives reality toward a desired state. Here, “every workload should have a current report.”
- CRD (Custom Resource Definition) — a way to teach the Kubernetes API new object types. The operator’s reports (
VulnerabilityReport, etc.) are CRDs, sokubectland RBAC work on them natively. - VulnerabilityReport — per-image CRD listing known CVEs and a severity summary.
- ConfigAuditReport — per-workload CRD listing misconfigurations (runAsRoot, missing resource limits, hostPath mounts…).
- ExposedSecretReport — per-image CRD flagging secrets baked into image layers. A hit is an incident, not backlog.
- RbacAssessmentReport / ClusterRbacAssessmentReport — CRDs flagging over-permissive Roles / ClusterRoles.
- InfraAssessmentReport — CRD assessing control-plane and node component hardening (kube-bench style).
- ClusterComplianceReport — cluster-scoped roll-up mapping findings to a benchmark (CIS, NSA, PSS).
- SbomReport — per-image software bill of materials in CycloneDX format, emitted when SBOM generation is on.
- SBOM (Software Bill of Materials) — a complete inventory of components in an artifact; lets you answer “am I affected?” for a new advisory without re-scanning.
- CVE — Common Vulnerabilities and Exposures; a public identifier for a specific known flaw, e.g.
CVE-2024-2961. - CVSS score — a 0–10 numeric severity for a CVE; feeds the CRITICAL/HIGH/MEDIUM/LOW rating.
- Severity — Trivy’s rating:
CRITICAL,HIGH,MEDIUM,LOW,UNKNOWN(Title-case in metrics, upper-case in report JSON). ignoreUnfixed— setting that hides CVEs with no available fix, so reports show only actionable findings.- VEX (Vulnerability Exploitability eXchange) — a signed statement that a given CVE is not exploitable in your context; the auditable way to suppress non-reachable findings.
- Scan Job — the short-lived Kubernetes
Jobthe operator spawns to scan one image, isolating the heavy work from the operator itself. - Standalone vs ClientServer mode — whether each scan Job downloads the DB itself (Standalone) or queries a shared
trivy-serverthat caches it (ClientServer, for scale). - Trivy DB / Java DB — the OCI-distributed vulnerability databases the scanner matches packages against; mirror both for air-gapped clusters.
- Admission controller — the API-server webhook layer (Kyverno, Gatekeeper) that can reject a resource at apply time. Where blocking lives — distinct from the operator, which only reports.
- Posture vs runtime security — posture = “what is vulnerable/misconfigured” (this operator); runtime = “what is being actively exploited” (a sensor like Falcon). Complementary.
- CIS / NSA benchmark — published Kubernetes hardening standards the compliance report measures against.
- SCA (Software Composition Analysis) — scanning an artifact’s dependencies for known vulnerabilities; what Trivy does to image packages.
scannerReportTTL— how long a report is considered fresh before the operator re-scans an unchanged workload; the dial that surfaces newly disclosed CVEs.