There is a moment every Linux operator meets: an alert fires, someone says “the server is slow,” and a dozen dashboards all look a little bit red. The amateur move is to start guessing — restart the service, add more RAM, blame the network, reboot and hope. The professional move is to measure, in order, until the numbers name exactly one bottleneck, change exactly one thing, and then re-measure to prove it moved. That discipline is the whole of performance work, and it is entirely learnable.
This lesson teaches the discipline first and the tools second, because tools without a method just give you more numbers to panic about. We start with the USE method — for every resource, ask three questions: how utilized is it, how saturated (queued) is it, and is it throwing errors? Then we walk CPU, memory, disk, and network with the real commands that answer those questions, decode every cryptic column, and finish by fixing what we find with tuned, sysctl, and ulimit. Everything here runs on a throwaway VM, a cloud instance, WSL2, or a container — type the commands as you read.
Why this matters
“Slow” is not a diagnosis; it is a symptom, and it can come from four completely different places. A box can be slow because the CPU is pegged (real work, or a runaway loop), because memory ran out and the machine is thrashing swap or the OOM killer is culling processes, because the disk cannot keep up and every process is stuck in I/O wait, or because the network is dropping and retransmitting packets. The tools you reach for, and the fix you apply, are different in each case. Reach for the wrong one and you spend an hour tuning the CPU while the real problem is a disk queue twelve requests deep.
Beginners get three things wrong here, over and over. They misread load average as “CPU percent” (it is neither a percent nor CPU-only). They panic at free showing almost no free memory, not knowing the kernel deliberately fills RAM with reclaimable cache (“Linux ate my RAM” — it didn’t). And they guess at fixes — bumping vm.swappiness they read about on a forum — without first proving the box is even memory-bound. This lesson kills all three mistakes from first principles.
The mental model to hold for the whole lesson: a computer is four resources — CPU, memory, disk, network — and every performance problem is one of them being either fully used, backed up with a queue, or erroring. Your job is to find which one, with evidence, before you touch a single knob. Get that habit and you will out-diagnose people with ten more years of experience who are still guessing.
The method first: the USE method and the toolmap
Before any command, learn the framework that tells you which command to run. The USE method, popularised by performance engineer Brendan Gregg, says: for every resource, check three things.
| Term | Question it answers | What “bad” looks like |
|---|---|---|
| U — Utilization | What fraction of the time (or capacity) is the resource busy? | CPU near 100% busy; memory fully allocated; disk %util high; link near line-rate |
| S — Saturation | How much extra work is queued and waiting because the resource can’t keep up? | A long run queue; swap in/out activity; disk aqu-sz and await climbing; NIC drops/backlog |
| E — Errors | Is the resource returning hard failures? | ECC/MCE events; OOM kills; disk I/O errors (EIO) in dmesg; TCP retransmits, NIC rx/tx errors |
The power of USE is that utilization alone lies. A disk at 100% %util on an NVMe SSD may be perfectly happy (it serves many requests in parallel), while a disk at 60% %util with a queue depth of 12 is the real bottleneck. You only see that by also checking saturation. Three questions, four resources — twelve cells — is the fastest known path from “it’s slow” to “here is the bottleneck.”
Now map each resource to the tools that answer those three questions. This is the toolmap you will use for the rest of your career:
| Resource | Observe utilization | Observe saturation | Observe errors |
|---|---|---|---|
| CPU | top, htop, mpstat -P ALL, vmstat (us+sy) |
vmstat r column, uptime load avg, pidstat |
dmesg (MCE), perf |
| Memory | free -h, /proc/meminfo, vmstat (free/cache) |
vmstat si/so, swap used, sar -W |
dmesg (OOM killer), /proc/vmstat |
| Disk I/O | iostat -xz 1 %util, iotop |
iostat await/aqu-sz, pidstat -d |
dmesg (I/O errors), smartctl |
| Network | sar -n DEV, ip -s link, ethtool |
ss -s, nstat, sar -n EDEV drops |
ss -ti retrans, ethtool -S, nstat |
The four resources each get a family of “observe” tools that feed a single “tune” action — a tuned profile, a sysctl, or a ulimit. That is the shape of the entire workflow, and it is worth seeing as one picture before we dive in:
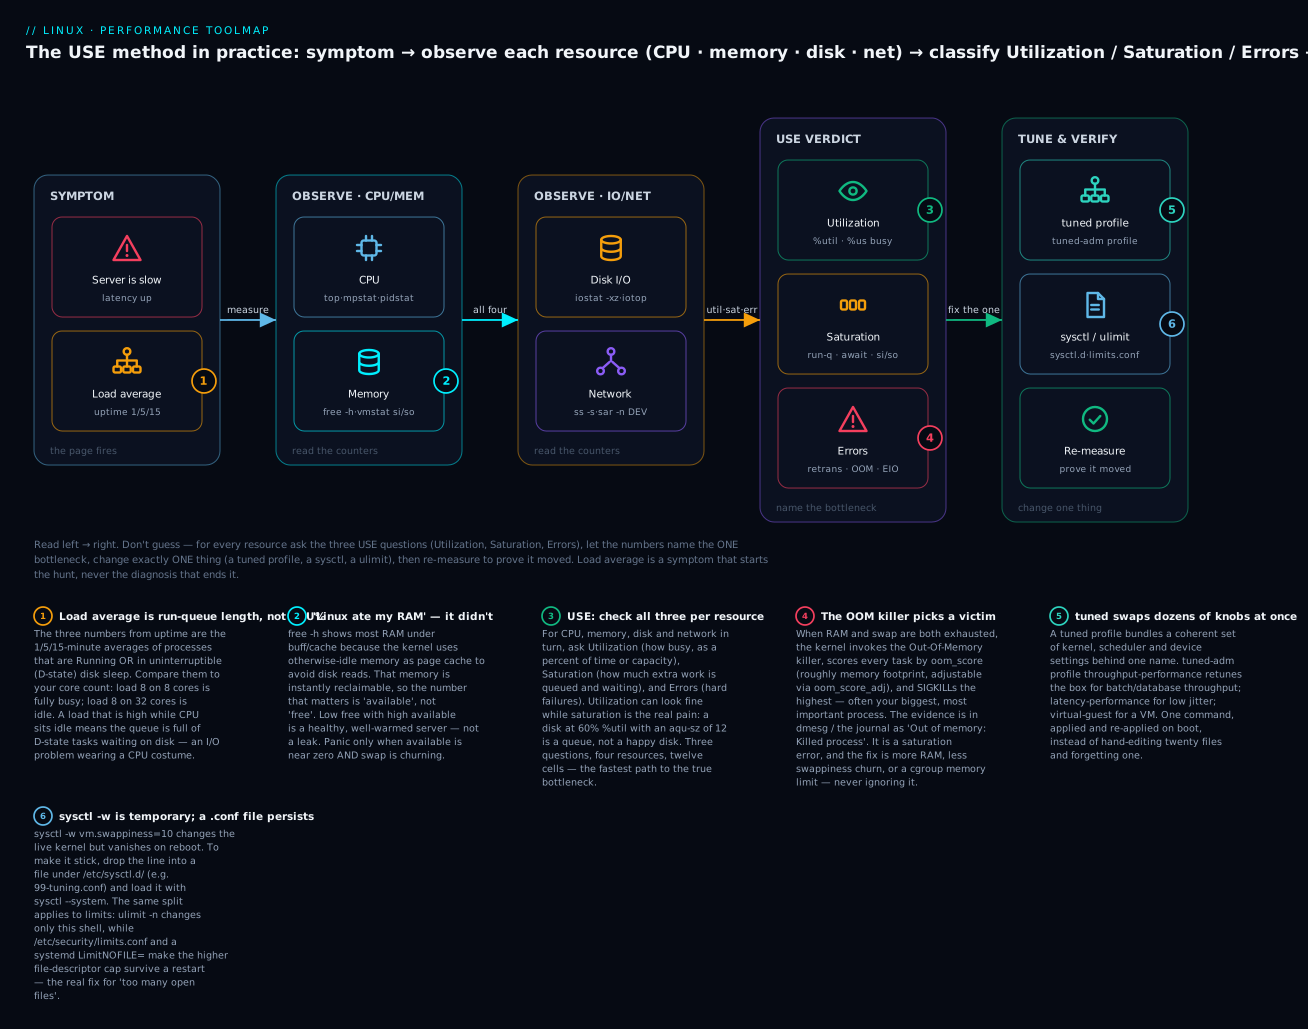
Read it left to right: the page fires, you observe every resource, the USE questions turn raw counters into a verdict naming one bottleneck, and only then do you tune. The badges call out the six ideas people get wrong — start with the first one, because it is the number everyone reads first and almost everyone misreads.
Brendan Gregg also splits observability tools by how they get their data, which tells you how much overhead and detail to expect:
| Tool type | Examples | What it gives you | Cost |
|---|---|---|---|
| Fixed counters | vmstat, free, iostat, sar, /proc |
Kernel-maintained running totals, summarised per interval | Nearly free |
| Profiling (sampling) | perf top, perf record |
Where CPU time is spent, by function/stack, from periodic samples | Low, tunable |
| Tracing | ftrace, perf trace, eBPF/bpftrace |
Every event (syscall, block I/O, scheduler) with full context | Higher, targeted |
| Monitoring | sar/sysstat, Prometheus/node_exporter |
The history — what the box looked like at 03:00 last night | Storage + agent |
You start at the top (cheap counters) and only descend to tracing when the counters point somewhere but can’t say why. For the deepest layer — per-event kernel tracing with eBPF — see Observability with eBPF, bpftrace, perf & ftrace; this lesson deliberately stays in the counters-and-profiling layers you reach for first.
Most of these tools live in one package. Install it before you go further:
# Debian / Ubuntu — sysstat gives iostat, mpstat, pidstat, sar; plus the interactive extras
sudo apt update && sudo apt install -y sysstat htop iotop procps

# RHEL / Fedora / Rocky / Alma
sudo dnf install -y sysstat htop iotop procps-ng
procps/procps-ng provides top, vmstat, free, uptime and is usually already present. sysstat is the one you almost always have to add.
Reading load average correctly
Everyone’s first performance metric is load average, and almost everyone reads it wrong. It appears in uptime, top, w, and /proc/loadavg:
# The three load-average numbers: 1-minute, 5-minute, 15-minute exponentially-weighted averages
uptime
#  14:23:01 up 12 days,  3:44,  2 users,  load average: 7.81, 4.20, 2.15
Load average is not a percentage and it is not CPU-only. On Linux it is the average number of processes (technically tasks) that are either R — running/runnable (on a CPU or waiting for one) or D — in uninterruptible sleep (blocked in the kernel, almost always on disk or NFS I/O). That second half is the part beginners miss: a machine with an idle CPU but a saturated disk can show a load of 20, because twenty tasks are all stuck in D state waiting for the disk. Load average measures demand for the system, not CPU busyness.
The only way to read the raw number is against your core count. A load of 8 means “on average, 8 tasks wanted to run at once.”
| Load average vs. cores | Interpretation |
|---|---|
Load < cores |
Spare capacity — tasks rarely wait |
Load ≈ cores |
Fully utilized, no queue — the healthy busy point |
Load > cores |
Saturated — more demand than CPUs; tasks are queuing |
Load ≫ cores while CPU idle |
Demand is not CPU — likely D-state, i.e. a disk/IO bottleneck |
# How many cores do I have to compare against?
nproc
# 4

# Or the detailed topology
lscpu | grep -E '^CPU\(s\)|Core|Socket|Thread'
# CPU(s):                4
# Thread(s) per core:    2
# Core(s) per socket:    2
# Socket(s):             1
So load average: 7.81, 4.20, 2.15 on a 4-core box means: right now (1-min) demand is ~2x capacity and rising (1-min > 5-min > 15-min — the spike is recent and getting worse). If the order were reversed (2.15, 4.20, 7.81) the storm would be passing. Reading the trend across the three numbers is half the value.
The three columns decoded:
| Field | Meaning |
|---|---|
| 1st number | Load averaged over the last 1 minute — the “right now” |
| 2nd number | Over the last 5 minutes — the recent trend |
| 3rd number | Over the last 15 minutes — the baseline |
| Rising (1 > 5 > 15) | Load is increasing — the incident is active |
| Falling (1 < 5 < 15) | Load is decreasing — the incident is receding |
To confirm whether a high load is CPU demand or D-state I/O wait, count the states directly — this single command tells you which of the two halves of load average is doing the damage:
# Count runnable (R) vs uninterruptible (D) tasks right now
ps -eo state | grep -c '^R'   # runnable / running  -> CPU demand
ps -eo state | grep -c '^D'   # uninterruptible      -> stuck on I/O

# See exactly which tasks are stuck in D (blocked on disk/NFS)
ps -eo pid,state,cmd | awk '$2 ~ /D/'
A load of 20 that is mostly R is a CPU problem; a load of 20 that is mostly D is a disk problem wearing a CPU costume. Process states (R, S, D, T, Z) are covered in depth in Processes & Jobs: ps, top, signals & kill; here they are the fork in the diagnostic road.
CPU: is it busy, and with what?
Load told you demand exists. Now find out whether the CPU itself is the bottleneck, and if so, doing what — user code, kernel/system work, or waiting on I/O.
top and htop — the live dashboard
top is on every box. The header line and the %Cpu(s) line are the parts that matter:
top
top - 14:23:01 up 12 days,  3:44,  2 users,  load average: 7.81, 4.20, 2.15
Tasks: 214 total,   6 running, 208 sleeping,   0 stopped,   0 zombie
%Cpu(s): 71.3 us,  9.8 sy,  0.0 ni, 12.1 id,  6.4 wa,  0.0 hi,  0.4 si,  0.0 st
MiB Mem :   7960.0 total,    412.3 free,   5820.1 used,   1727.6 buff/cache
MiB Swap:   2048.0 total,    108.0 free,   1940.0 used,    980.4 avail Mem

    PID USER      PR  NI    VIRT    RES    SHR S  %CPU  %MEM     TIME+ COMMAND
   3312 app       20   0 4820100 3.1g   12m R  63.1  40.0  88:14.02 java
   3410 app       20   0  912000 210m   8m R  22.7   2.6  10:02.11 python3
The %Cpu(s) line is the single most information-dense row in Linux performance. Every field is a percentage of total CPU time over the refresh interval, and they sum to ~100%:
| Field | Name | What it means | Watch for |
|---|---|---|---|
| us | user | Time running user-space code (your apps) | High = app doing real (or runaway) work |
| sy | system | Time in the kernel on behalf of processes (syscalls) | High = syscall-heavy: lots of I/O, context switches, network |
| ni | nice | User time of re-niced (low-priority) processes | Usually 0 unless you use nice |
| id | idle | CPU doing nothing | Low id + high us/sy = CPU-bound |
| wa | iowait | Idle because it’s waiting for disk/IO to return | High = likely I/O-bound, not CPU-bound |
| hi | hardirq | Servicing hardware interrupts | High = NIC/storage IRQ storm |
| si | softirq | Servicing software interrupts (network stack, timers) | High si = heavy network packet processing |
| st | steal | Time the hypervisor gave to another VM | On cloud VMs, high st = noisy neighbour / oversubscribed host |
Two of these are the ones people skip and shouldn’t: wa tells you the CPU is idle only because it’s blocked on I/O — high wa redirects you to the disk section. st (steal) only appears on virtualized guests and is your evidence that the host is oversubscribed — no amount of guest tuning fixes it; you resize or move the instance.
htop (sudo apt install htop / sudo dnf install htop) is the friendlier, colour version: per-core meters, tree view (F5), searchable, and you can send signals without leaving it. Same data, nicer glass.
mpstat — is the load spread or stuck on one core?
top’s %Cpu(s) line is an average across all cores. That average hides the classic single-threaded bottleneck: one core pinned at 100% while seven sit idle shows as “12% CPU” and looks fine. mpstat -P ALL breaks it out per core:
# -P ALL = every CPU; the trailing 1 = refresh every 1 second
mpstat -P ALL 1
02:31:07 PM  CPU    %usr   %nice    %sys %iowait    %irq   %soft  %steal  %idle
02:31:08 PM  all   68.42    0.00    8.31    5.20    0.00    0.51    0.00   17.56
02:31:08 PM    0   99.01    0.00    0.99    0.00    0.00    0.00    0.00    0.00
02:31:08 PM    1    5.10    0.00    2.04    3.06    0.00    0.00    0.00   89.80
02:31:08 PM    2    4.08    0.00    1.02    2.04    0.00    0.00    0.00   92.86
02:31:08 PM    3    6.19    0.00    3.09    4.12    0.00    1.03    0.00   85.57
CPU 0 is at 100% (%idle 0.00) while 1–3 are nearly idle. That is a single-threaded workload that cannot use more cores — throwing more vCPUs at it will do nothing. This one view saves countless wrong “just scale up” decisions.
pidstat — which process, over time
top sorts by instantaneous CPU; pidstat gives you a timestamped log per process, which is far better for catching intermittent spikes and for after-the-fact evidence:
# Per-process CPU every 2 seconds; add a count to stop (5 samples)
pidstat 2 5
# 02:35:10 PM   UID    PID    %usr %system  %guest   %wait    %CPU   CPU  Command
# 02:35:12 PM  1001   3312   58.00    6.50    0.00    2.00   64.50     0  java
# 02:35:12 PM  1001   3410   20.00    3.00    0.00    1.50   23.00     3  python3
pidstat option |
Shows |
|---|---|
pidstat 1 |
Per-process CPU each second |
pidstat -d 1 |
Per-process disk I/O (kB read/write per sec) |
pidstat -r 1 |
Per-process memory (faults, RSS) |
pidstat -w 1 |
Per-process context switches (voluntary/involuntary) |
pidstat -t 1 |
Break down by thread, not just process |
pidstat -p PID 1 |
Focus on one PID |
%wait in that output is CPU run-queue wait (the task was ready but no core was free) — a direct saturation signal at the process level.
vmstat — the whole machine in one line per second
If you learn one command from this lesson, make it vmstat. One tidy line per second summarising CPU, memory, swap, I/O, and system activity together — the fastest “what kind of slow is this” read there is:
# Refresh every 1s. The FIRST line is an average since boot — ignore it; read from line 2.
vmstat 1
procs -----------memory---------- ---swap-- -----io---- -system-- ------cpu-----
 r  b   swpd   free   buff  cache   si   so    bi    bo   in   cs us sy id wa st
 8  1 1986048 421900  18240 1707800    0    4     6    28  980 4120 71 10 12  6  1
 9  0 1986048 418020  18240 1709220  120   80  4096  8192 5200 9800 68 12  4 15  1
 7  2 1985024 420110  18244 1708900   40   16   512   256 1100 4500 74  9 15  1  1
Decode every column — this table is worth memorising:
| Group | Col | Meaning | What it tells you |
|---|---|---|---|
| procs | r | Tasks runnable (running or waiting for CPU) | r > cores, sustained = CPU saturated |
| procs | b | Tasks in uninterruptible sleep (blocked on I/O) | b > 0, sustained = I/O bottleneck |
| memory | swpd | Virtual memory swapped out (KB) | Large + growing = under memory pressure |
| memory | free | Idle memory (KB) | Low is normal (cache); not a problem by itself |
| memory | buff / cache | Buffers + page cache | The reclaimable cache — see memory section |
| swap | si | Memory swapped IN from disk (KB/s) | Non-zero = active thrashing, a red flag |
| swap | so | Memory swapped OUT to disk (KB/s) | Sustained > 0 = memory pressure |
| io | bi | Blocks received from disk (KB/s in) | Read throughput |
| io | bo | Blocks sent to disk (KB/s out) | Write throughput |
| system | in | Interrupts per second | Very high = IRQ storm (NIC/timer) |
| system | cs | Context switches per second | Very high = lock contention / too many threads |
| cpu | us sy id wa st | Same as top: user, system, idle, iowait, steal |
The CPU-time split |
Now read the three lines above like a doctor: r is 7–9 on a 4-core box (CPU saturated), us is ~70% (user code, not kernel), si/so spiked to 120/80 on line 2 (a moment of swap thrash), and wa jumped to 15 when bo hit 8192 (a burst of writes stalling the CPU). In three seconds vmstat told you: primarily CPU-bound in user space, with memory pressure starting to bite. That is the read the whole lesson is teaching.
Context switches, the run queue, and CPU-bound vs I/O-bound
Two vmstat columns deserve their own paragraph. cs (context switches) counts how often the kernel swapped one task off a CPU for another. Some is healthy; tens of thousands per second usually means too many threads fighting for too few cores or lock contention — the CPU is spending its time switching instead of working. Pair a high cs with pidstat -w to find the culprit. r (the run queue) is the per-instant version of load average’s CPU half: r consistently above your core count is the cleanest possible “CPU is the bottleneck” signal.
The whole point of the CPU section is one binary decision — CPU-bound or I/O-bound? Here is the decision table:
| Signal | CPU-bound | I/O-bound |
|---|---|---|
top %Cpu(s) |
High us+sy, low id, low wa | Low us/sy, high wa, or high id despite high load |
vmstat r vs b |
r high (runnable queue) |
b high (blocked on I/O) |
| Load avg composition | Mostly R-state tasks |
Mostly D-state tasks |
mpstat |
Cores near 100% %usr/%sys |
Cores show %iowait, otherwise idle |
| The fix lives in… | CPU/scheduler tuning, more cores, faster code | The disk section, not here |
If the evidence says I/O-bound, stop tuning the CPU and jump to the disk section. This redirection is where the method earns its keep.
Memory: the buff/cache truth, swap, and the OOM killer
Memory is where beginners cause the most self-inflicted panic, because the healthy state looks alarming. Let’s fix that permanently.
free -h and the “Linux ate my RAM” myth
# -h = human units; -w widens buff/cache into separate columns on newer procps
free -h
#                total        used        free      shared  buff/cache   available
# Mem:           7.8Gi       5.7Gi       402Mi        18Mi       1.7Gi       1.9Gi
# Swap:          2.0Gi       1.9Gi       108Mi
New operators see free = 402Mi on an 8 GB box and reach for the “add more RAM” button. They are misreading it. Here is what each column actually means:
| Column | Meaning | Should you worry? |
|---|---|---|
| total | Physical RAM the kernel can use | — |
| used | RAM in use by processes + kernel, excluding reclaimable cache | This is “real” usage |
| free | Completely unused RAM | Low is normal and good — unused RAM is wasted RAM |
| shared | tmpfs / shared memory | Usually small |
| buff/cache | Page cache + buffers + slab — reclaimable | Not “used up”; kernel hands it back on demand |
| available | An estimate of RAM available to new apps without swapping | This is the number that matters |
The kernel deliberately uses every spare byte of RAM as page cache — copies of recently-read files — so that the next read is a memory hit instead of a disk seek. That cache shows up under buff/cache and drives free toward zero on any box that has been up a while. The moment a process needs memory, the kernel evicts cache instantly and hands it over. So free being tiny is not a leak; it is a warmed cache, which is exactly what you want.
Read available, not free. In the output above, available is 1.9 GiB — the box has headroom. The genuine danger sign is available near zero while swap is churning. Memes about “Linux ate my RAM” exist because this trips up everyone once; now it won’t trip up you.
/proc/meminfo — the source of truth
free is a friendly summary of /proc/meminfo, which has the full detail:
# The kernel's raw memory accounting; free/top/vmstat all read this file
grep -E 'MemTotal|MemFree|MemAvailable|Buffers|^Cached|SwapTotal|SwapFree|Dirty|Writeback|^Slab' /proc/meminfo
# MemTotal:        8151040 kB
# MemFree:          411900 kB
# MemAvailable:    1965300 kB
# Buffers:           18240 kB
# Cached:          1689560 kB
# SwapTotal:       2097148 kB
# SwapFree:         110592 kB
# Dirty:             40960 kB
# Writeback:             0 kB
# Slab:             198320 kB
| Field | What it is |
|---|---|
| MemAvailable | Kernel’s own estimate of allocatable memory — the honest “how much is left” |
| Buffers | Block-device metadata cache |
| Cached | Page cache — file contents held in RAM |
| Dirty | Modified pages not yet written to disk (see vm.dirty_ratio in tuning) |
| Writeback | Dirty pages being written right now |
| Slab | Kernel data structures (inodes, dentries) — can balloon on file-heavy workloads |
| SwapTotal/SwapFree | Swap capacity and how much remains |
Dirty and Writeback are the memory-side view of write pressure; if Dirty is huge, a lot of data is waiting to hit disk and a flush storm may be coming — which connects directly to the vm.dirty_* knobs later.
Swap activity: the number that actually matters
Having swap used is not a problem. Swap being actively read and written — thrashing — is. The distinction is si/so in vmstat:
# Watch swap-in / swap-out. Sustained non-zero si+so = thrashing = real pressure.
vmstat 1 5 | awk 'NR>2 {print "si="$7"  so="$8}'
# si=0  so=0
# si=120 so=80      <- pages moving both ways: the box is thrashing
# si=240 so=16
A box can sit for weeks with 1.9 GB of swap used (stale, cold pages parked there) and be perfectly fast, because nothing is being paged in or out. The instant si/so go sustained-positive, every page fault becomes a disk seek and the machine grinds. Judge swap by si/so, never by “swap used.” sar -W 1 gives the same signal historically (pswpin/s, pswpout/s).
The OOM killer — how the kernel picks a victim
When RAM and swap are both exhausted and a process demands more, the kernel cannot say “no” gracefully — so it invokes the Out-Of-Memory (OOM) killer, which SIGKILLs a process to reclaim memory. The victim is not random. Each task carries an oom_score (0–1000), roughly proportional to its memory footprint, adjustable per-process:
# The current OOM score of a process (higher = more likely to be killed)
cat /proc/3312/oom_score
# 742

# The tunable knob: -1000 (never kill) .. +1000 (kill first). Default 0.
cat /proc/3312/oom_score_adj
# 0

# Protect a critical process (e.g. the database) from the OOM killer:
echo -500 | sudo tee /proc/3312/oom_score_adj
The evidence that an OOM kill happened is in the kernel ring buffer and the journal — this is the log line you grep for when a process “just disappeared”:
# Did the OOM killer fire? This is the smoking gun.
sudo dmesg -T | grep -i -A1 'out of memory'
# [Wed Jul  9 03:14:52 2026] Out of memory: Killed process 3312 (java)
#   total-vm:4820100kB, anon-rss:3100160kB, file-rss:0kB, shmem-rss:0kB, oom_score_adj:0

# Same evidence via the journal, with surrounding context
sudo journalctl -k | grep -i 'killed process'
| OOM concept | Detail |
|---|---|
| When it fires | RAM + swap exhausted and an allocation can’t be satisfied |
| How it chooses | Highest oom_score — largest memory user, adjusted by oom_score_adj |
oom_score_adj |
−1000 = immune, +1000 = kill first, 0 = default; set via /proc/PID/oom_score_adj |
| Signal used | SIGKILL (9) — the process cannot clean up; it just dies |
| Where’s the proof | dmesg -T / journalctl -k: “Out of memory: Killed process …” |
| The real fix | More RAM, a memory limit (cgroup/MemoryMax=), fixing the leak — not just protecting via oom_score_adj |
An OOM kill is an errors signal in USE terms — the memory resource returned a hard failure. If you see it repeatedly, the box is under-provisioned or leaking; oom_score_adj is a seatbelt, not a fix.
swappiness — how eager the kernel is to swap
vm.swappiness (0–100 on most kernels, 0–200 on newer ones; default 60) biases the kernel between reclaiming page cache and swapping out anonymous (application) memory when it needs to free RAM. Lower = “prefer to drop cache, avoid touching app memory.”
vm.swappiness |
Behaviour | Typical use |
|---|---|---|
| 0 | Avoid swapping anon memory until an OOM is imminent | Databases, latency-critical (with enough RAM) |
| 1–10 | Swap very reluctantly | Servers with plenty of RAM; common production choice |
| 60 | Default — balanced | General-purpose desktops/servers |
| 100+ | Swap aggressively, favour keeping cache | Rare; memory-overcommitted / some container hosts |
# See it, set it live (temporary), then persist it (survives reboot) — details in the tuning section
sysctl vm.swappiness
# vm.swappiness = 60
sudo sysctl -w vm.swappiness=10          # live, lost on reboot
echo 'vm.swappiness = 10' | sudo tee /etc/sysctl.d/99-swappiness.conf   # persistent
Note: swappiness=0 does not disable swap; since kernel 3.5 it means “only swap to avoid OOM.” To truly disable swap you swapoff -a and remove it from /etc/fstab — and then a memory spike goes straight to the OOM killer, so only do that with enough RAM to never need it.
Disk I/O: iostat, the queue, and schedulers
If wa was high or vmstat’s b column had tasks blocked, the disk is your suspect. iostat is the primary instrument.
iostat -xz 1 — the disk’s vital signs
# -x extended stats, -z hide idle devices, 1 = per second. First sample is since-boot; ignore it.
iostat -xz 1
Device    r/s     w/s     rkB/s     wkB/s   rrqm/s  wrqm/s  r_await  w_await  aqu-sz  %util
nvme0n1   12.0   980.0     512.0   62720.0     0.0    45.0     0.42    18.60   12.40   99.80
sda        2.0    30.0      64.0     480.0     0.0     2.0     6.10    22.40    0.85   14.20
Decode the columns that matter (the exact set varies by sysstat version, but these are the load-bearing ones):
| Column | Meaning | USE role |
|---|---|---|
| r/s, w/s | Read / write operations per second (IOPS) | Utilization (workload) |
| rkB/s, wkB/s | Read / write throughput (KB/s) | Utilization (bandwidth) |
| rrqm/s, wrqm/s | Requests merged per second (kernel coalescing) | Efficiency hint |
| r_await, w_await | Average time (ms) a read/write took, incl. queue wait | Saturation — latency |
| await | Combined average I/O latency (ms) | Saturation |
| aqu-sz | Average queue depth (outstanding requests) | Saturation — the key number |
| %util | Percent of time the device had at least one I/O in flight | Utilization (misleading on SSD/NVMe) |
Read the example: nvme0n1 is at %util 99.8 — but on an SSD/NVMe that alone means little, because these devices serve many requests in parallel. The real story is aqu-sz 12.4 (twelve requests queued on average) and w_await 18.6 ms (writes taking ~19 ms when the device could do sub-millisecond) — that is a saturated disk. Meanwhile sda at only %util 14 shows w_await 22 ms, telling you it’s a slow spinning disk even when barely busy. This is the USE method in miniature: utilization is the trap; saturation (await, aqu-sz) is the truth.
⚠️ On multi-queue SSDs, do not treat %util = 100% as “disk full/maxed.” Judge by await climbing above the device’s normal latency and by aqu-sz growing. A rising queue with rising latency is saturation; a high %util with flat, low latency is just a busy-but-coping disk.
Which process is doing the I/O? iotop, pidstat -d, lsof
iostat tells you the disk is saturated; it does not say who. Three tools name the culprit:
# iotop — a 'top' for disk I/O. -o shows only processes actually doing I/O.
sudo iotop -o
# Total DISK READ:  1.20 M/s | Total DISK WRITE: 61.00 M/s
#   TID  PRIO  USER   DISK READ  DISK WRITE  SWAPIN     IO>    COMMAND
#  3312  be/4  app     0.00 B/s   58.20 M/s  0.00 %  92.4 %  java -jar app.jar
# pidstat -d — per-process disk KB/s, logged over time (scriptable, no curses UI)
pidstat -d 1
# 03:22:10 PM   UID    PID    kB_rd/s   kB_wr/s   kB_ccwr/s  iodelay  Command
# 03:22:11 PM  1001   3312       0.00  59600.00        0.00       42  java
# lsof — which files a process has open (find the file being hammered, or the deleted-but-open one)
sudo lsof -p 3312 | grep -E 'REG' | head
# java  3312  app  200w  REG  259,1  62914560  1179841 /var/log/app/debug.log
lsof also solves the sibling mystery to disk-I/O: “df says the disk is full but du finds nothing.” That is a deleted file still held open by a running process — the space isn’t freed until the process closes it. sudo lsof +L1 lists exactly those:
# Files that are deleted but still open (holding disk space hostage)
sudo lsof +L1
# COMMAND  PID USER  FD  TYPE DEVICE SIZE/OFF NLINK  NODE NAME
# app     3312 app   3w   REG  259,1 2.1G      0   1180  /var/log/app/old.log (deleted)
I/O schedulers and mount options
Two disk-side tuning levers are worth knowing. First, the I/O scheduler decides the order requests hit the device:
| Scheduler | Best for | Notes |
|---|---|---|
| none | Fast NVMe/SSD | No reordering — the device’s own queue is smarter; lowest overhead |
| mq-deadline | SATA SSD / HDD, general servers | Bounds latency with read/write deadlines; a safe default |
| bfq | Desktop / interactive, mixed | Fair queueing, great responsiveness; more CPU overhead |
| kyber | High-IOPS NVMe under load | Simple latency-target multiqueue scheduler |
# See and set the scheduler (the one in [brackets] is active)
cat /sys/block/nvme0n1/queue/scheduler
# [none] mq-deadline kyber bfq
echo mq-deadline | sudo tee /sys/block/sda/queue/scheduler   # live; persist via a udev rule
⚠️ Setting it via /sys is not persistent. To make it stick, use a udev rule, e.g. /etc/udev/rules.d/60-ioscheduler.rules:
ACTION=="add|change", KERNEL=="sd[a-z]", ATTR{queue/scheduler}="mq-deadline".
Second, mount options. The default relatime already avoids most access-time writes, but on read-heavy filesystems noatime eliminates them entirely — no metadata write on every file read:
| Mount option | Effect | Trade-off |
|---|---|---|
| relatime | Update atime only if older than mtime/ctime or >24h (default) |
Good balance; rarely needs changing |
| noatime | Never update access time | Fastest reads; breaks tools that rely on atime (rare — old mailers) |
| nodiratime | No atime updates for directories only | Milder than noatime |
Add noatime in /etc/fstab for the read-heavy filesystem and remount. Storage-stack mechanics (partitions, filesystems, /etc/fstab) are covered in the storage lesson; here it is purely a performance knob.
Network performance, briefly
Network tuning is a lesson of its own, but for the “is the network the bottleneck?” question you need three quick reads. Utilization: throughput per interface. Saturation: drops and backlog. Errors: TCP retransmits and NIC errors.
# Socket summary: total sockets, TCP states, and — crucially — retransmit counters
ss -s
# Total: 421
# TCP:   318 (estab 210, closed 40, orphaned 2, timewait 38)

# Per-interface throughput and utilization over time (sysstat)
sar -n DEV 1 3
# IFACE   rxpck/s  txpck/s   rxkB/s   txkB/s   ...   %ifutil
# eth0    18240.0  17980.0  21400.5  20880.1   ...     84.20

# Errors and DROPS per interface (the saturation/error signal)
sar -n EDEV 1 3
# IFACE   rxerr/s  txerr/s  rxdrop/s  txdrop/s  ...
# eth0       0.00     0.00     42.00      0.00
Retransmits are the clearest “the network is hurting” signal — TCP resending data it thinks was lost. See per-socket retransmits with ss -ti, and NIC-level errors/drops with ethtool:
# Per-connection TCP info incl. retransmits (look for 'retrans:' and high 'rtt')
ss -ti | grep -A1 ESTAB | head
#   cubic wscale:7,7 rtt:0.34/0.17 ... retrans:0/128 ...   <- 128 total retransmits on this socket

# NIC hardware/driver stats: errors, drops, and link speed
sudo ethtool -S eth0 | grep -E 'err|drop|discard' | head
sudo ethtool eth0 | grep -E 'Speed|Duplex'
# Speed: 1000Mb/s
# Duplex: Full
| Network signal | Command | Bottleneck if… |
|---|---|---|
| Throughput / %ifutil | sar -n DEV 1 |
%ifutil near 100 = link saturated |
| Drops / backlog | sar -n EDEV 1, ss -s |
rxdrop/s/txdrop/s > 0 = kernel/NIC can’t keep up |
| Retransmits | ss -ti, nstat -az | grep -i retrans |
Rising retransmits = packet loss / congestion |
| NIC errors, link | ethtool -S, ethtool |
err/discard counts, or wrong Speed/Duplex |
A common trap: high si (softirq) in top on a busy box is the network stack processing packets — pair it with sar -n DEV to confirm the traffic is real.
Sampling deeper: sar history and perf profiling
The tools so far are live. Two more give you history (what happened at 3 a.m. while you slept) and depth (which line of code is burning the CPU).
sar — the flight recorder
sar (from sysstat) periodically records every subsystem to disk, so you can replay any past interval. Enable the collector once:
# Enable historical collection (writes to /var/log/sa/ every ~10 min via a systemd timer)
sudo systemctl enable --now sysstat        # Debian also needs ENABLED="true" in /etc/default/sysstat
# On RHEL/Fedora the timer is: sysstat-collect.timer + sysstat-summary.timer
Then read any metric for any window — the killer feature is -s/-e to zoom into the incident time:
sar flag |
Reports | Answers |
|---|---|---|
sar -u |
CPU (us/sy/wa/id) | Was the CPU busy at 03:00? |
sar -r |
Memory + %memused |
Was RAM exhausted overnight? |
sar -S / -W |
Swap usage / swap in-out | Did it thrash? |
sar -b / -d |
I/O rate / per-device | Which disk was hot, and when? |
sar -q |
Run queue + load average history | When did load spike? |
sar -n DEV/EDEV/TCP |
Network throughput / errors / TCP | Was the link saturated or dropping? |
sar -B |
Paging (pgpgin/s, faults) |
Page-fault / paging storms |
# Yesterday's CPU between 02:00 and 04:00 (sa08 = the 8th of the month)
sar -u -f /var/log/sa/sa08 -s 02:00:00 -e 04:00:00
# Current-day load-average history
sar -q
Being able to say “load hit 40 at 03:12 and CPU iowait was 60% at exactly that minute” — after the fact, without having been watching — is what turns a 3 a.m. mystery into a five-minute diagnosis.
perf — where is the CPU time actually going?
When the CPU is pegged in us and you need to know which function, perf samples the running stacks:
# Install perf: Debian -> linux-tools; RHEL/Fedora -> perf
sudo apt install -y linux-tools-common linux-tools-generic linux-tools-$(uname -r)   # Debian/Ubuntu
sudo dnf install -y perf                                                             # RHEL/Fedora

# Live top-of-CPU by function, like 'top' but for code paths
sudo perf top

# Record with call graphs for 10s, then read the report
sudo perf record -F 99 -a -g -- sleep 10
sudo perf report --stdio | head -30

# Just the summary counters for one command (cache misses, IPC, context switches)
perf stat -- ./my_program
perf subcommand |
Use |
|---|---|
perf top |
Live “which functions are hot” across the system |
perf record -g |
Capture sampled stacks to perf.data for offline analysis |
perf report |
Explore the recorded profile (often rendered as a flame graph) |
perf stat |
Hardware counters for one run: IPC, cache misses, branch misses |
perf samples (cheap, statistical). For tracing every event — every block I/O, every scheduler switch, every slow syscall with full context — you move up to eBPF/bpftrace, covered in Observability with eBPF, bpftrace, perf & ftrace. Reach for that when perf shows you where but you need to know why a specific rare event is slow.
Tuning: tuned, sysctl, and ulimit
Diagnosis names the bottleneck; now you fix it. There are three levers, from highest-level to lowest.
tuned — profiles that flip dozens of knobs at once
tuned is a daemon that applies a named bundle of kernel, scheduler, and device settings. Instead of hand-editing twenty files, you pick a profile that matches your workload and it does the rest — consistently, and re-applied on every boot.
# Install & enable
sudo apt install -y tuned    # Debian/Ubuntu
sudo dnf install -y tuned    # RHEL/Fedora (often preinstalled)
sudo systemctl enable --now tuned

# What profiles exist, and which is active?
tuned-adm list
tuned-adm active
# Current active profile: virtual-guest

# tuned can even recommend one based on the hardware/role
tuned-adm recommend
# virtual-guest

# Switch profile (applies immediately and persists across reboots)
sudo tuned-adm profile throughput-performance
| Profile | Optimises for | Typical use |
|---|---|---|
| balanced | Compromise of power vs performance | Default desktop/laptop |
| throughput-performance | Maximum throughput; disables power saving, tunes VM & I/O | Databases, batch, app servers |
| latency-performance | Lowest, most consistent latency; pins C-states | Trading, real-time, low-jitter services |
| network-latency | Low network latency (builds on latency-performance) | Latency-sensitive network apps |
| network-throughput | Max network throughput (bigger buffers) | Bulk transfer, streaming origin |
| virtual-guest | A VM guest (cloud instances) | Most cloud VMs — the common default |
| virtual-host | A hypervisor host | KVM hosts |
| powersave | Minimum power draw | Battery / green |
Under the hood, throughput-performance sets things like vm.dirty_ratio, the CPU governor to performance, and a suitable I/O scheduler — you can inspect exactly what any profile does in /usr/lib/tuned/<profile>/tuned.conf. Start here: pick the right profile first, then hand-tune only the specific knob your measurements demand.
sysctl — the individual kernel knobs
sysctl reads and writes kernel parameters exposed under /proc/sys/. The critical distinction — and the one people get wrong — is live vs. persistent:
# READ a value
sysctl vm.swappiness
# vm.swappiness = 60

# WRITE it LIVE — takes effect now, but is LOST on reboot
sudo sysctl -w vm.swappiness=10

# PERSIST it — drop a file in /etc/sysctl.d/ so it re-applies every boot
echo 'vm.swappiness = 10' | sudo tee /etc/sysctl.d/99-tuning.conf
sudo sysctl --system                 # reload all sysctl.d files now
⚠️ sysctl -w alone is a rookie trap: your careful tuning vanishes on the next reboot and the problem returns “mysteriously.” Always mirror a live change into /etc/sysctl.d/*.conf. The knobs you will actually reach for:
| sysctl key | Default (typical) | What it does | Tune when |
|---|---|---|---|
| vm.swappiness | 60 | Bias to swap anon memory vs drop cache | Lower (1–10) for DB/latency with ample RAM |
| vm.dirty_ratio | 20 | % RAM of dirty pages before writers block and flush synchronously | Lower for steadier latency; raise for burst throughput |
| vm.dirty_background_ratio | 10 | % RAM of dirty pages that triggers background flush | Lower to smooth out write bursts |
| vm.vfs_cache_pressure | 100 | How aggressively to reclaim inode/dentry cache | Lower (50) to keep metadata cache on file-heavy boxes |
| net.core.somaxconn | 4096 (≥5.4), 128 (older) | Max accept queue length per listening socket | Raise for high-connection servers (was the classic 128 bottleneck) |
| net.core.netdev_max_backlog | 1000 | Packets queued to the stack when the NIC out-runs the CPU | Raise on high-PPS boxes seeing rxdrop |
| net.ipv4.tcp_max_syn_backlog | 128–1024 | Half-open (SYN) queue size | Raise under SYN bursts / connection storms |
| net.ipv4.ip_local_port_range | 32768–60999 | Ephemeral source ports for outbound connections | Widen on hosts making many outbound connections |
| net.core.rmem_max / wmem_max | ~212 KB | Max socket receive/send buffer | Raise for high-bandwidth-delay (long fat) networks |
| fs.file-max | (large, RAM-derived) | System-wide max open file descriptors | Rarely — it’s usually already huge |
| fs.nr_open | 1048576 | Per-process hard ceiling for ulimit -n |
Raise before pushing ulimit -n past ~1M |
For the deeper mechanics of /proc, /sys, and how sysctl maps onto kernel parameters (and kernel modules), see Kernel modules, /proc, /sys & sysctl.
ulimit and limits.conf — the “too many open files” fix
The single most common resource-limit error in production is Too many open files (errno EMFILE) — a process hit its file-descriptor cap. FDs are consumed by open files and every socket, so busy network servers hit it constantly. There are three layers, and the classic failure is fixing the wrong one.
# What is the limit in THIS shell? (soft | hard)
ulimit -n            # soft (current) limit, e.g. 1024
ulimit -Hn           # hard (ceiling) limit, e.g. 524288
ulimit -a            # all limits
ulimit only changes the current shell and its children. To persist for interactive/login users, edit /etc/security/limits.conf (enforced by PAM at login):
# /etc/security/limits.conf  — <domain> <type> <item> <value>
*        soft    nofile   65535
*        hard    nofile   65535
app      soft    nofile   200000
app      hard    nofile   200000
The gotcha that costs people hours: limits.conf is applied by PAM at login, so it does not affect services started by systemd — and most production processes are systemd services. Setting limits.conf and restarting your database will not raise its FD limit. The fix lives in the unit file:
# Correct fix for a systemd-managed service
sudo systemctl edit myapp.service
# add:
#   [Service]
#   LimitNOFILE=200000
sudo systemctl daemon-reload && sudo systemctl restart myapp

# Verify the LIVE limit the RUNNING process actually got (don't trust config, check reality):
cat /proc/$(pgrep -f myapp | head -1)/limits | grep 'Max open files'
# Max open files            200000    200000    files
| Layer | Where | Applies to | Note |
|---|---|---|---|
ulimit |
Shell builtin | Current shell + children | Temporary; can’t exceed the hard limit unless root |
/etc/security/limits.conf |
PAM config | Login sessions (SSH, console) | Ignored by systemd services |
systemd LimitNOFILE= |
Unit [Service] |
That service | The correct fix for daemons |
fs.nr_open / fs.file-max |
sysctl | Per-process ceiling / system-wide | Raise these before pushing limits past ~1M |
Always verify against /proc/PID/limits — the running process’s actual limit — rather than trusting what you wrote in a config file. That one habit turns “too many open files” from a recurring outage into a two-minute fix.
Putting it together: a “server is slow” decision walk
Method beats memory. When the page fires, walk the resources in a fixed order and let the numbers eliminate suspects. This is the table to internalise — glance at a handful of counters and it points you at one subsystem:
| Symptom (what you see) | Likely resource | Confirm with | Then look at |
|---|---|---|---|
Load high, top us+sy high, id low, wa low |
CPU | vmstat r > cores; mpstat -P ALL |
Which process (pidstat), which function (perf top) |
Load high but wa high / id high, CPU looks idle |
Disk I/O | vmstat b > 0; iostat -xz await/aqu-sz |
Which process (iotop, pidstat -d), which file (lsof) |
free available near 0, vmstat si/so sustained |
Memory (swap thrash) | vmstat si/so; sar -W |
Biggest RSS (ps aux --sort=-rss); leak vs under-provision |
| A process “vanished,” others slow after | Memory (OOM) | dmesg -T | grep -i oom |
oom_score, add RAM / MemoryMax= |
| One core pegged, others idle | CPU (single-thread) | mpstat -P ALL |
App concurrency; can’t fix with more vCPUs |
High cs in vmstat, latency up |
CPU (contention) | pidstat -w; thread count |
Lock contention / thread-pool sizing |
High st (steal) in top/vmstat |
Hypervisor (noisy neighbour) | top %st; sar -u %steal |
Resize/move the instance — not a guest fix |
App logs Too many open files |
FD limit | /proc/PID/limits; lsof -p count |
LimitNOFILE= (systemd) or limits.conf |
Requests slow, ss -s retrans rising |
Network | sar -n DEV/EDEV; ss -ti retrans |
ethtool -S; congestion / packet loss |
The order matters: check CPU and memory first (cheapest, most common), then disk, then network. And obey the two golden rules — change one thing at a time, and re-measure to prove it moved. If you changed a knob and the number didn’t budge, put the knob back. This decision walk plugs into the broader outage playbook in Troubleshooting methodology: boot, disk, network & permissions — performance is one branch of that tree.
Hands-on lab
A self-contained lab you can run on any Linux VM, cloud instance, container, or WSL2. You will generate a bottleneck in each subsystem, diagnose it with the USE method, and tune one knob. Nothing here destroys data — the only writes go to a scratch file you delete at the end.
⚠️ This lab intentionally loads the machine (CPU, RAM, disk writes). Run it on a throwaway box, not production, and not while others depend on it.
Step 0 — Install the toolkit and a load generator.
# Debian/Ubuntu
sudo apt update && sudo apt install -y sysstat htop iotop stress-ng procps
# RHEL/Fedora/Rocky
sudo dnf install -y sysstat htop iotop stress-ng procps-ng
nproc      # note your core count — you'll compare load against it
What just happened: you have the observe tools (sysstat, iotop) and stress-ng, a synthetic load generator, plus your core count as the yardstick.
Step 1 — Baseline. Know “normal” before you break anything.
uptime; free -h; vmstat 1 3
What just happened: you captured an idle baseline — low load, healthy available memory, si/so = 0, low r/b. Every later reading is compared to this.
Step 2 — Create a CPU bottleneck and diagnose it.
# Pin all cores with busy loops for 30 seconds (run in the background)
stress-ng --cpu $(nproc) --timeout 30s &
# In the same window, observe:
uptime                 # load climbs toward (and past) your core count
vmstat 1 5             # r >= cores, us ~100, wa ~0  -> CPU-bound, user space
mpstat -P ALL 1 3      # every core near 100% %usr
pidstat 1 3            # stress-ng owns the CPU
What just happened: USE verdict = CPU utilization saturated (r ≥ cores, us high, wa low). Because wa is ~0, it’s compute, not I/O. mpstat confirms all cores are used (not a single-thread case).
Step 3 — Create memory pressure and watch swap.
# Allocate more memory than is free to force reclaim/swap (adjust 90% to your box)
stress-ng --vm 2 --vm-bytes 90% --vm-keep --timeout 30s &
vmstat 1 8             # watch free drop, then si/so go NON-ZERO = thrashing
free -h                # 'available' collapses toward 0
dmesg -T | tail -5     # if it goes too far: 'Out of memory: Killed process ...'
What just happened: USE verdict = memory saturated — available near 0 and si/so sustained-positive is thrashing. If you pushed harder, the OOM killer fired and dmesg recorded the victim. This is the “Linux ate my RAM” state — but now proven with si/so, not guessed from free.
Step 4 — Create a disk-I/O bottleneck and find the culprit.
# Write a 2 GB scratch file with O_DIRECT so it really hits the disk (not just cache)
stress-ng --hdd 1 --hdd-bytes 2G --timeout 30s &
iostat -xz 1 5         # %util high AND await/aqu-sz climbing = saturated
vmstat 1 5             # b > 0 (blocked tasks), wa rises
sudo iotop -o          # names stress-ng as the writer
What just happened: USE verdict = disk saturated — the giveaway is await/aqu-sz climbing (not %util alone). vmstat’s b column and rising wa corroborate; iotop names the process.
Step 5 — Apply a tuning change and prove it.
# Make swapping less eager (a memory-tuning example), live + persistent
sysctl vm.swappiness                                   # note current (60)
sudo sysctl -w vm.swappiness=10                         # live change
echo 'vm.swappiness = 10' | sudo tee /etc/sysctl.d/99-lab.conf   # persist
sysctl vm.swappiness                                   # re-measure: now 10

# And apply a whole-box profile with tuned (if installed)
sudo tuned-adm profile throughput-performance 2>/dev/null; tuned-adm active 2>/dev/null
What just happened: you changed one knob, persisted it correctly (a file under /etc/sysctl.d/, not just -w), and re-measured to confirm — the full tune-and-verify loop.
Step 6 — Fix “too many open files” the right way.
ulimit -n                                              # this shell's soft limit (e.g. 1024)
# For a systemd service, the ONLY correct fix:
#   sudo systemctl edit myapp   ->  [Service] \n LimitNOFILE=65535
#   sudo systemctl daemon-reload && sudo systemctl restart myapp
#   cat /proc/$(pgrep -f myapp)/limits | grep 'open files'   # verify the LIVE limit
echo "systemd services ignore limits.conf — use LimitNOFILE and verify via /proc/PID/limits"
What just happened: you learned to check the live limit at /proc/PID/limits and to fix daemons in the unit file, not limits.conf.
Step 7 — Clean up.
wait                                                   # let background stress jobs finish
sudo rm -f /etc/sysctl.d/99-lab.conf && sudo sysctl --system   # revert the lab knob
sudo tuned-adm profile balanced 2>/dev/null            # back to default profile
rm -f ./stress-ng* 2>/dev/null; free -h                # confirm memory recovered
What just happened: the box is back to baseline. You have now driven all four USE verdicts and the full tune-and-verify loop end to end.
Common mistakes and troubleshooting
| Symptom | Cause | Fix |
|---|---|---|
| “8 GB box, only 400 MB free — out of memory!” | Reading free instead of available; buff/cache is reclaimable |
Read the available column; page cache is not “used up” |
Tuned sysctl -w vm.swappiness=10, reverted after reboot |
Live change never persisted | Add it to /etc/sysctl.d/99-*.conf and sysctl --system |
Raised limits.conf nofile, service still hits “Too many open files” |
systemd ignores PAM limits.conf |
Set LimitNOFILE= in the unit; verify /proc/PID/limits |
| Added vCPUs, no faster | Single-threaded workload — one core pegged | Check mpstat -P ALL; fix app concurrency, not core count |
Disk shows %util 100% on NVMe — assumed maxed |
%util is misleading on parallel SSD/NVMe |
Judge by await and aqu-sz, not %util |
| Load average 20, CPU shows idle | Load counts D-state (I/O) tasks, not just CPU |
Count R vs D (ps -eo state); look at the disk |
df says full, du finds nothing |
Deleted-but-open file holding space | lsof +L1; restart/HUP the process holding it |
| Guest slow, guest tuning does nothing | High %st steal — host oversubscribed |
Resize/migrate the instance; it’s a host problem |
High cs, everything sluggish |
Context-switch storm: too many threads / lock contention | pidstat -w; right-size thread pools |
Set I/O scheduler via /sys, gone after reboot |
/sys writes aren’t persistent |
Persist with a udev rule |
Three gotchas deserve extra words because they cost the most time:
1. %util on SSDs will lie to you. The %util metric was designed for single-spindle rotating disks, where “busy 100% of the time” meant “maxed out.” Modern SSDs and NVMe drives service many requests in parallel, so they can sit at %util 100% while barely working. If you decommission or “fix” a disk because %util is high, you may be chasing a ghost. Always corroborate with await (is latency actually high?) and aqu-sz (is a queue actually forming?). Rising latency + growing queue = real saturation; high %util with flat low latency = a disk that is busy and coping fine.
2. The systemd/limits.conf trap. This one has a near-universal failure story: an engineer hits “Too many open files,” edits /etc/security/limits.conf, restarts the service, and the error comes right back — because the service is a systemd unit, and systemd never consults PAM’s limits.conf. Hours evaporate re-editing a file that was never going to work. Burn this in: daemons → LimitNOFILE= in the unit; login shells → limits.conf; always verify against /proc/PID/limits.
3. Tuning before measuring. The forums are full of “add these ten sysctls for performance” lists. Applying them blind is how you turn one problem into three, none reproducible. Every knob in this lesson has a measurement that justifies it: you lower swappiness because you saw si/so thrashing, you raise somaxconn because you saw accept-queue drops. No measurement, no change. And after every change, re-run the exact command that showed the problem — if the number didn’t move, revert.
Cheat-sheet
| Command | What it does |
|---|---|
uptime / cat /proc/loadavg |
Load average (1/5/15 min) — compare to nproc |
nproc / lscpu |
Core count / CPU topology (the yardstick for load) |
top / htop |
Live processes; read the %Cpu(s) line (us/sy/id/wa/st) |
mpstat -P ALL 1 |
Per-core CPU — catches single-thread bottlenecks |
pidstat 1 |
Per-process CPU over time (-d disk, -r mem, -w ctx-sw) |
vmstat 1 |
Whole-box: r/b, si/so, bi/bo, cs, cpu split |
free -h |
Memory — read available, not free |
| `grep -E 'MemAvailable | Dirty |
dmesg -T | grep -i oom |
Did the OOM killer fire? Who died? |
cat /proc/PID/oom_score{,_adj} |
OOM victim scoring / protection |
iostat -xz 1 |
Disk: %util, await, aqu-sz, r/s, w/s |
iotop -o / pidstat -d 1 |
Which process is doing the disk I/O |
lsof -p PID / lsof +L1 |
Open files / deleted-but-open (disk-full mystery) |
ss -s / ss -ti |
Socket summary / per-connection retransmits |
sar -n DEV 1 / sar -n EDEV 1 |
Network throughput / errors & drops |
ethtool -S eth0 / ethtool eth0 |
NIC error counters / link speed & duplex |
sar -u -f /var/log/sa/saNN |
Historical CPU (replace -u with -r -b -d -q -n) |
perf top / perf record -g |
Where the CPU time goes, by function/stack |
tuned-adm list / active / profile X |
List / show / apply a tuning profile |
sysctl KEY / sysctl -w KEY=V |
Read / set a kernel knob (live) |
echo 'k = v' > /etc/sysctl.d/99-x.conf; sysctl --system |
Persist a sysctl across reboots |
ulimit -n / ulimit -Hn |
Soft / hard open-file limit (this shell) |
systemctl edit svc → LimitNOFILE= |
Raise FD limit for a systemd service |
cat /proc/PID/limits |
The process’s actual live limits (source of truth) |
Interview and exam questions
Q: What does load average actually measure, and why can it be high while the CPU is idle?
A: It is the exponentially-weighted average count of tasks that are runnable (R) or in uninterruptible sleep (D) over 1/5/15 minutes. Because D-state tasks are blocked on I/O (usually disk/NFS), a saturated disk can drive load high while CPUs sit idle — the demand is for the disk, not the CPU. Always compare load to nproc and check R vs D composition.
Q: free -h shows 200 MB free on an 8 GB server. Is it out of memory?
A: Almost certainly not. Look at available, not free. The kernel fills spare RAM with reclaimable page cache (buff/cache), which it releases instantly when apps need it. Low free is healthy; the danger sign is low available plus sustained si/so swap activity in vmstat.
Q: How do you tell a CPU-bound problem from an I/O-bound one?
A: In top, CPU-bound shows high us+sy, low id, low wa; I/O-bound shows high wa (or high id despite high load). In vmstat, CPU-bound has a high r (run queue), I/O-bound has a high b (blocked). Confirm with mpstat -P ALL (cores at %usr vs %iowait) and by counting R vs D tasks.
Q: On an NVMe SSD, iostat shows %util 100%. Is the disk maxed out?
A: Not necessarily. %util (percent of time with ≥1 I/O in flight) is misleading on devices that serve requests in parallel. Judge saturation by await (latency climbing above normal) and aqu-sz (a growing queue). High %util with flat, low latency is a busy-but-coping disk.
Q: What is the OOM killer, how does it choose a victim, and where’s the evidence?
A: When RAM and swap are exhausted, the kernel kills a process (with SIGKILL) to reclaim memory. It picks the highest oom_score — roughly the largest memory user, biased by oom_score_adj (−1000 immune … +1000 first). Evidence is in dmesg -T/journalctl -k: “Out of memory: Killed process …”. The real fix is more RAM or a memory limit, not just oom_score_adj.
Q: You lowered vm.swappiness with sysctl -w but it reset after a reboot. Why, and how do you make it stick?
A: sysctl -w changes the live kernel only; it isn’t persistent. Put vm.swappiness = 10 in a file under /etc/sysctl.d/ (e.g. 99-tuning.conf) and run sysctl --system — those files are applied on every boot.
Q: A service keeps logging “Too many open files.” You raised nofile in /etc/security/limits.conf but nothing changed. What’s wrong?
A: limits.conf is enforced by PAM at login and does not apply to systemd-managed services. Set LimitNOFILE= in the unit (systemctl edit svc), daemon-reload, restart, and verify the live limit with cat /proc/PID/limits.
Q: What does tuned do, and name three profiles and when you’d use them.
A: tuned applies a named bundle of kernel/scheduler/device settings and re-applies it on boot. throughput-performance for databases/batch (max throughput, no power saving); latency-performance for low, consistent latency (real-time/trading); virtual-guest for cloud VMs. Apply with tuned-adm profile <name>; check with tuned-adm active.
Q: Decode these vmstat columns: r, b, si, so, wa, cs.
A: r = runnable tasks (CPU demand; > cores = saturated); b = tasks blocked in uninterruptible I/O; si/so = pages swapped in/out per second (sustained non-zero = thrashing); wa = CPU % idle waiting on I/O; cs = context switches/sec (very high = contention or too many threads).
Q (RHCSA-style): Persistently set vm.swappiness to 10 and verify.
A:
echo 'vm.swappiness = 10' | sudo tee /etc/sysctl.d/99-swappiness.conf
sudo sysctl --system
sysctl vm.swappiness      # -> vm.swappiness = 10
Q (RHCSA-style): Show current-day CPU history, then just the window 02:00–03:00. A:
sar -u                                    # today's CPU, all recorded intervals
sar -u -s 02:00:00 -e 03:00:00            # zoom to the incident window
# (requires sysstat collection enabled: systemctl enable --now sysstat)
Q: Which single command best summarises CPU, memory, swap, and I/O together, and how do you read it?
A: vmstat 1. Ignore the first line (since-boot average). Then read r/b (CPU vs I/O demand), si/so (swap thrash), bi/bo (disk throughput), cs (context switches), and the us/sy/id/wa/st CPU split — the whole machine’s health in one line per second.
Key takeaways
- Method before tools. For every resource — CPU, memory, disk, network — ask the three USE questions: Utilization, Saturation, Errors. Twelve cells find the bottleneck faster than any dashboard.
- Load average is run-queue length, not CPU %. It counts
RandD-state tasks; compare it tonproc, and a high load with idle CPUs means an I/O problem. freelow is healthy; readavailable. The kernel caches files in spare RAM and reclaims it instantly. Real memory pressure = lowavailableplus sustainedsi/so. When both RAM and swap run out, the OOM killer picks the highestoom_score— proof is indmesg.- Saturation, not utilization, is the disk truth. On SSD/NVMe,
%utillies; judge byawaitandaqu-sz. Corroborate withvmstat’sbcolumn andiotop/pidstat -dto name the process. - Tune with the right lever, at the right scope.
tunedprofiles flip dozens of knobs at once;sysctlsets individual ones (persist in/etc/sysctl.d/, or they vanish on reboot);ulimit/LimitNOFILEfix file-descriptor limits — and systemd services ignorelimits.conf. - Change one thing, then re-measure. Every knob you touch must be justified by a measurement and confirmed by re-running the command that showed the problem. If the number didn’t move, revert.
- Verify reality, not config. Trust
/proc/PID/limits,tuned-adm active, andsysctl <key>over what you think you set. The kernel’s live view is the source of truth.