In a nutshell
A running container is a sealed appliance — think of a washing machine bolted shut with its program already running inside. When you sit at a keyboard you open the lid and press buttons: that is docker exec -it. But automation is a robot arm reaching in through a small service hatch. The arm can’t “press buttons on a screen” (there is no terminal), it can only feed a tape in (stdin) and read a tape out (stdout) — and the appliance can be swapped out mid-cycle at any moment (Kubernetes pods are ephemeral), so before every reach-in the arm has to check the appliance is still there, and afterwards it has to check that the little “done” light actually means done.
Four ideas carry the whole lesson:
- Your script never runs inside the container. It asks a runtime (
docker/podman) or an API server (kubectl) to run something in there and report back. Every interaction is a request that can fail on its own — separately from whether the command you ran succeeded. - There is no terminal in automation. Interactively you get a TTY for free; a CI runner, cron job, or systemd unit does not. The
-tflag demands a terminal that isn’t there, so it aborts withthe input device is not a TTY. Scripts pipe data (-i) and read exit codes; they don’t “type.” - The truth is JSON, not text.
docker psandkubectl getprint pretty columns for humans, and those columns shift width and lie to parsers. The real, stable interface is--format/-o jsonpiped intojq. - “Started” is not “finished,” and “ran” is not “passed.” A rollout returns before the old pods die; a detached
docker runreturns before the container exits; anexecinto a dying pod can look successful. Automation that trusts the happy path silently corrupts state.
If you take one habit from this lesson: drop -t in every script, select with -o json/--format instead of awk, and never trust “done” until you have polled for it. Everything below is the “why” and the safe patterns behind those habits.
Level: Intermediate–Advanced · Time: ~40–50 min
Prerequisites
- You can write and run a shell script and know that
$?holds the exit status of the last command (0= success). If exit codes are fuzzy, revisit the conditionals / exit-codes lesson first. - You understand pipes and why
set -o pipefailmatters — the pipes & pipelines lesson is the direct prerequisite for every... | jqin here. - You know basic
jq(select, string interpolation) — the text-processing lesson covers it. - Helpful but optional: the signal-handling lesson for trapping and cleaning up background
port-forward/docker runprocesses.
After this lesson you can
- Drive
dockerandpodmanfrom non-interactive scripts without the TTY error, piping data cleanly in and out of a container. - Read any container’s real state — exit code, health, restart count, IP, mounts — with
inspect --formatGo templates and| jq, instead of grepping. - Explain how docker’s daemon model differs from podman’s daemonless / rootless model, and where their exit codes diverge.
- Select and filter Kubernetes objects structurally with
-o jsonpath,-o json | jq, and--field-selector, and know which to reach for. - Poll for a truthful “done”: rollout complete and old pods gone, N replicas Ready, a log marker seen, a Job succeeded.
- Capture the real exit code across the whole stack, and tell “the command failed” apart from “I couldn’t reach the container.”
- Spot and refactor a
docker-in-a-loop fork storm into a single batched call.
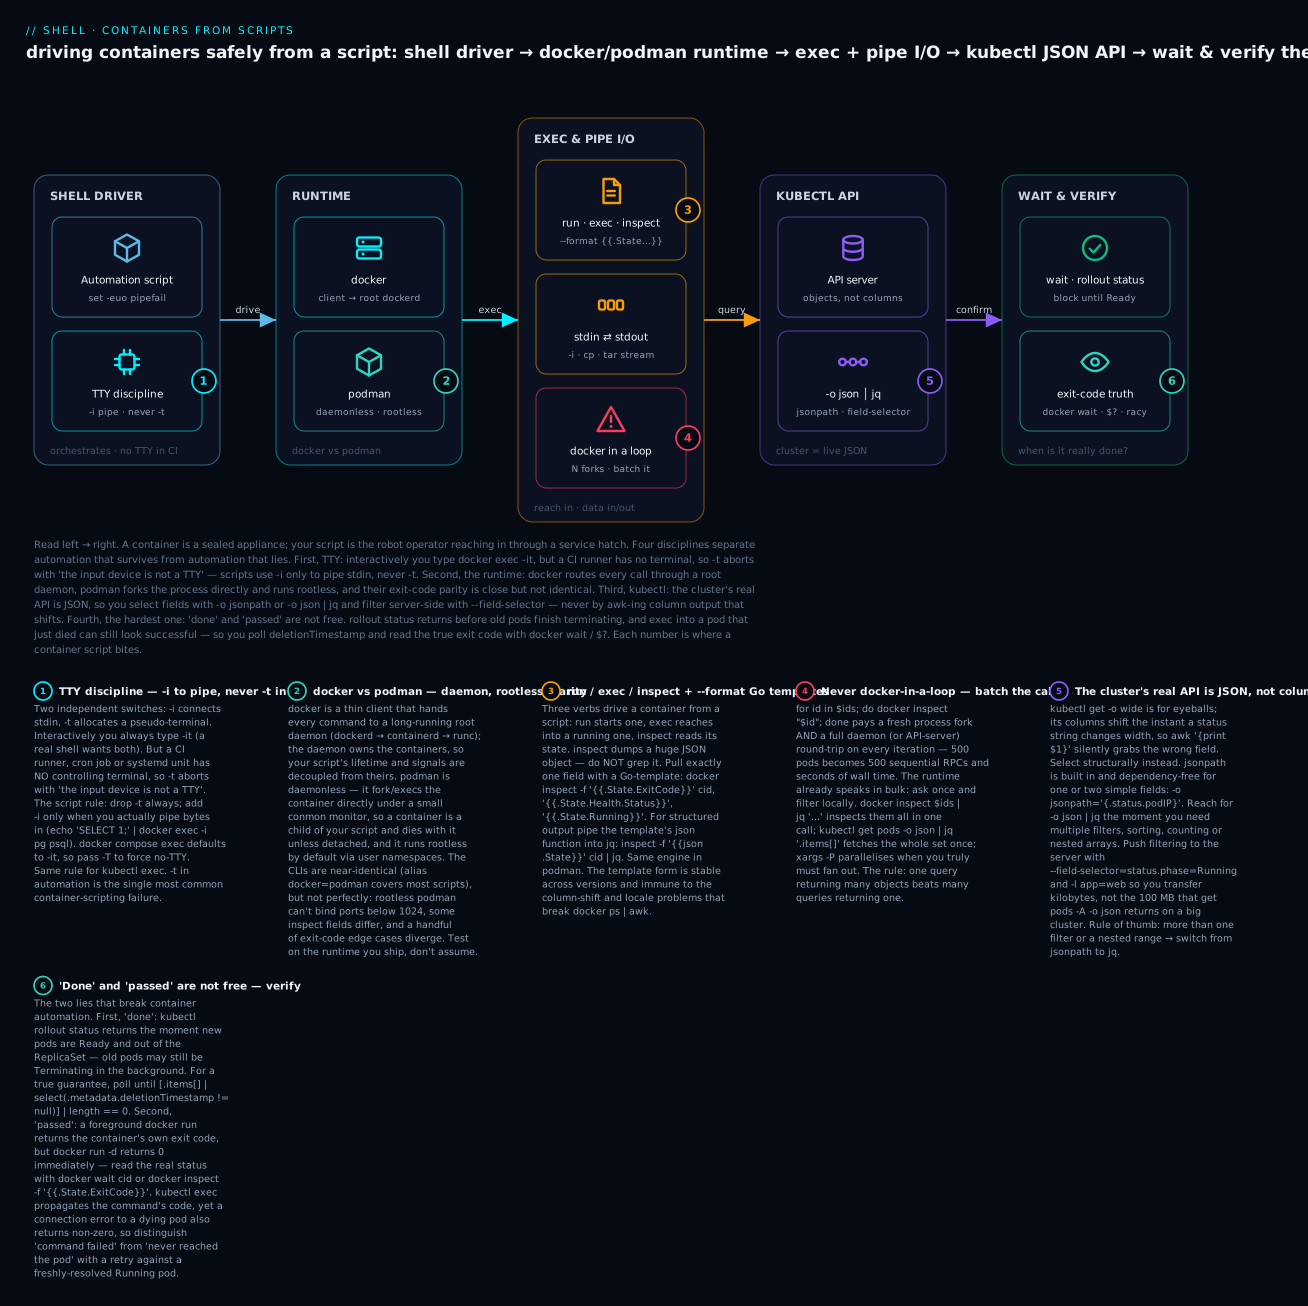
Read the diagram left → right: your script sits on the far left and everything it touches — the runtime, the exec/pipe channel, the kubectl JSON API, and the final verification — is a separate system that can fail on its own, and the six badges walk the four disciplines (TTY, runtime parity, JSON selection, and verifying “done”/“passed”) that keep container automation honest.
Why Shell + Containers Is a Specific Skill
You’ve written docker exec -it container bash a thousand times interactively. Now you’re in a CI script that runs docker exec -it $CONTAINER pytest and it fails: the input device is not a TTY. You drop -it and the test passes — but in a different script, removing -it means colorless output that breaks a regex parser. You add -T to a docker-compose exec call to force no-TTY, and now signal forwarding doesn’t work and Ctrl-C in CI doesn’t stop the test.
Shell + containers has its own physics:
- TTY allocation is binary: with TTY, you get terminal semantics (color, line discipline, signal forwarding, but stdin must be a terminal). Without, you get raw bytes (pipes work, redirection works, but no color and signals behave differently).
execinto a container is “best effort”: pods can disappear betweenkubectl get podandkubectl exec. The exec succeeds, then the connection terminates with no clear error.docker logsandkubectl logsare not streaming pipes by default: they buffer, they have timestamp formats that change between versions, they truncate.- kubectl
-o jsonis enormous:kubectl get pods -o jsonfor a busy cluster can be 50+ MB. You cannot hold that in shell variables. Pipe it. - JSONPath is half-implemented:
kubectl get -o jsonpathdoesn’t support every JSONPath construct; complex queries need-o json | jq. Knowing when to use each saves hours. - Rolling restarts are racy:
kubectl rollout restartreturns immediately. Polling withkubectl rollout statusreturns success the moment a single new pod is ready, not when all old pods are gone.
This lesson covers the patterns that hold up: when to use -T, when to use -it, how to stream logs reliably, how to pick between JSONPath and jq, the kubectl rollout-status correctness gotchas, and a lib/k8s.sh you can source.
A note on this environment. The commands below are the real, current forms for Linux with
docker/podman/kubectl/jq. Those container tools are typically absent on a macOS authoring box (and on this one), so any output shown is representative — labelled as such — not captured live. Thejqfilters, however, are exercised against representative JSON and are correct. Registry credentials and tokens appear only as placeholders ($REGISTRY_TOKEN,$DB_URL) — never hard-code a real one.
docker / podman: TTY, Stdin, and the -it Confusion
docker run, docker exec, and docker-compose exec all take -i (interactive: connect stdin) and -t (allocate a TTY). The 4 combinations:
| Flags | stdin | TTY | When to use |
|---|---|---|---|
| (none) | not connected | none | Detached or commands that don’t read stdin or output; fire-and-forget |
-i |
piped | none | Pipe data IN: cat data.json | docker exec -i pg psql |
-t |
not connected | yes | Rare; mostly only useful for “show me what the prompt looks like” |
-it |
piped | yes | Interactive shell, bash, python repl. Requires the caller to be a TTY too. |
The CI rule: in scripts and CI runners, never use -t. Use -i only if you need to pipe stdin into the container.
# WRONG in CI: -t fails because CI has no TTY.
docker exec -it myapp /opt/app/run-tests.sh

# RIGHT for CI: no -t, no -i (we're not piping stdin).
docker exec myapp /opt/app/run-tests.sh

# RIGHT when piping stdin:
echo 'SELECT 1;' | docker exec -i postgres psql -U postgres

# WRONG: combining stdin pipe with -t.
echo 'SELECT 1;' | docker exec -it postgres psql -U postgres
# In some Docker versions: works, but escape sequences pollute output.
# In others: 'the input device is not a TTY'.
docker-compose exec defaults to -it; you must pass -T to disable TTY:
# In CI:
docker-compose exec -T web pytest      # no TTY allocated
docker-compose exec    web bash        # interactive (TTY allocated)
podman is mostly drop-in compatible, with the same semantics. Rootless podman has stricter cgroups v2 requirements but exec flags work the same.
docker vs podman: daemon, daemonless, rootless, and exit-code parity
podman is not merely “docker renamed” — the architecture differs, and that shows up in your scripts. Docker is a thin client that hands every command to a long-running root daemon (dockerd → containerd → runc); the daemon owns the containers, so their lifetime is decoupled from your script. Podman is daemonless: it fork/execs the container directly under a small conmon monitor, so a foreground container is a child of your script and dies with it unless you detach — and it runs rootless by default, mapping container-root to your own UID via user namespaces.
| Aspect | docker | podman |
|---|---|---|
| Architecture | client → persistent root daemon (dockerd) |
daemonless; direct fork/exec + conmon per container |
| Privilege (default) | daemon runs as root | rootless (user namespaces; also runs as root if you want) |
| Container lifetime | owned by the daemon; outlives your shell | child of the invoking process unless -d/detached |
| Rootless networking | n/a (root daemon) | slirp4netns/pasta; cannot bind host ports < 1024 by default |
| Compose | docker compose (v2 plugin) |
podman compose / podman-compose / podman play kube |
| Docker-API socket | /var/run/docker.sock always present |
opt-in via podman system service (then set DOCKER_HOST) |
| CLI parity | — | ~drop-in; a few inspect fields and exit-code edges differ |
For the common case, an alias covers most scripts:
# Make an existing docker-based script run under podman.
alias docker=podman            # interactive; for scripts, prefer a wrapper or ${ENGINE}

# Portable: pick the engine once and use a variable.
ENGINE=$(command -v docker || command -v podman) || { echo "no container engine" >&2; exit 1; }
"$ENGINE" run --rm alpine echo hi
Where the alias breaks: a rootless podman container can’t -p 80:80 (privileged port), a few docker inspect field paths differ, and a handful of exit-code edge cases diverge. The rule: alias for convenience, but test on the runtime you actually ship. If a script must talk to the Docker API (e.g. a tool that opens /var/run/docker.sock), run podman system service and point DOCKER_HOST at podman’s socket.
Output capture: 2>&1, --log-driver, and the timestamp question
Containers write to stdout and stderr; the runtime captures both. By default docker logs interleaves them:
docker logs myapp                # both streams, interleaved
docker logs myapp 2>/dev/null    # just stdout (stderr redirected to /dev/null by docker logs)
docker logs myapp >app.out 2>app.err  # split streams
docker logs myapp --since 5m     # last 5 minutes
docker logs myapp --tail 100     # last 100 lines
docker logs myapp --follow       # stream live (won't return until container exits or signal)
docker logs myapp --timestamps   # prepend ISO timestamps
For automation that processes logs, use --timestamps --since and parse the prefix. Without --timestamps, you cannot tell when a line was emitted (the container’s date may not match the host’s clock or timezone).
Signal forwarding gotchas
Docker treats PID 1 specially: signals sent to the container must be forwarded to PID 1. If your shell script invokes docker run and you send SIGTERM to the script, will the container shut down gracefully?
# Default: docker forwards SIGTERM/SIGINT to PID 1. PID 1 must HANDLE them.
# Many shell scripts as PID 1 do NOT trap signals → container ignores SIGTERM.
# Workaround: use `tini` or `dumb-init` as PID 1.
docker run --init myapp ...    # docker injects tini as PID 1; tini forwards signals to your real entry
docker stop sends SIGTERM, waits 10s by default, then sends SIGKILL. If your container’s PID 1 doesn’t handle SIGTERM, you lose 10 seconds and end ungracefully. --init or a proper signal-handling entry-point fixes this.
In a script:
# Trap to forward signals to a child container.
cleanup() { docker stop "$cid"; }
trap cleanup INT TERM EXIT

cid=$(docker run -d myapp)
docker logs --follow "$cid" &
log_pid=$!
wait "$log_pid"
Reading state with inspect and --format Go templates
docker inspect (and podman inspect) dumps a huge JSON object per container. Do not grep it. Pull exactly the field you want with a Go text/template via --format / -f, or pipe the whole thing to jq. The template engine is stable across versions and immune to the column-shift and locale problems that break docker ps | awk.
# One field at a time — no jq dependency.
docker inspect -f '{{.State.ExitCode}}'      web     # e.g. 137
docker inspect -f '{{.State.Status}}'        web     # e.g. exited
docker inspect -f '{{.State.Running}}'       web     # true / false
docker inspect -f '{{.RestartCount}}'        web     # e.g. 2
docker inspect -f '{{.NetworkSettings.IPAddress}}' web
docker inspect -f '{{range .Mounts}}{{.Source}}->{{.Destination}} {{end}}' web

# Guard an optional field (container with no healthcheck):
docker inspect -f '{{with .State.Health}}{{.Status}}{{else}}none{{end}}' web

# Structured output: the json template function, then jq.
docker inspect -f '{{json .State}}' web | jq
Common template fields worth memorising:
| Template | Yields |
|---|---|
{{.State.ExitCode}} |
Numeric exit code of the last run |
{{.State.OOMKilled}} |
true if the kernel OOM-killed it (pairs with exit 137) |
{{.State.Health.Status}} |
healthy / unhealthy / starting (if a healthcheck exists) |
{{.RestartCount}} |
How many times the runtime restarted it |
{{.Config.Image}} |
Image reference it was created from |
{{json .}} |
The entire object as JSON (pipe to jq) |
When you need more than one field or any computation, skip the template and let jq do it — remember docker inspect returns a JSON array (one element per container), so index .[0] for a single container:
docker inspect web | jq -r '.[0] | "\(.State.Status)\t\(.State.ExitCode)\t\(.RestartCount)"'
# representative → exited   137   2
The same idea replaces docker ps | awk for lists: docker ps also takes --format, including the json function:
docker ps --format '{{.Names}}\t{{.Status}}\t{{.Image}}'   # tab-separated, stable field order
docker ps --format '{{json .}}' | jq -r '.Names + "\t" + .Status'
Piping data in and out of containers
The most common real task is not “run a shell” — it’s move data through a container: feed a SQL dump in, pull a backup out. There are three transports, and the TTY rule is critical for all of them: -t corrupts a data stream (it turns on terminal line-discipline, translating and injecting bytes), so when you pipe data you use -i only.
# ── Data IN ────────────────────────────────────────────────
# stdin pipe (the workhorse):
cat dump.sql        | docker exec -i postgres psql -U app -d sales
echo 'FLUSHALL'     | docker exec -i redis   redis-cli
kubectl exec -i pod -- psql -U app < migration.sql

# file copy (no stream semantics, just a copy):
docker cp ./config.yaml  web:/etc/app/config.yaml
kubectl cp ./config.yaml  prod/web-0:/etc/app/config.yaml -c web   # needs `tar` in the container

# tar a whole directory in:
tar cf - -C ./seed . | docker exec -i db tar xf - -C /var/lib/import

# ── Data OUT ───────────────────────────────────────────────
# capture stdout to a host file (NOTE: no -t, or the file gets escape codes):
docker exec db pg_dump -U app sales > sales.sql
kubectl exec pod -c db -- pg_dump -U app sales > sales.sql

# copy a file/dir out:
docker cp web:/var/log/app.log ./app.log
kubectl cp prod/web-0:/var/log ./web-0-logs -c web

# stream a directory out as a tarball (survives large trees, preserves perms):
docker exec db tar cf - -C /var/lib/data . | tar xf - -C ./restore
Two gotchas: kubectl cp shells out to tar inside the container, so a distroless image without tar makes it fail — fall back to kubectl exec ... -- tar cf - ... | tar xf -. And always test with -i alone before adding anything else; a stray -t is the usual reason a copied tarball or database dump arrives corrupted.
Getting the real exit code out of a container
“Did it work?” is not one question — it depends on how you launched the container:
| Launch form | What its exit code is | How to get the container/command result |
|---|---|---|
docker run --rm img cmd (foreground) |
the container’s exit code | it’s $? directly: docker run --rm img cmd; rc=$? |
docker run -d img (detached) |
0 + prints the container ID |
docker wait $cid (blocks, prints code) or inspect -f '{{.State.ExitCode}}' after exit |
docker exec c cmd |
the command’s exit code | it’s $? directly |
kubectl exec pod -- cmd |
the command’s code… | …but a connection failure to a dying pod is also non-zero — ambiguous |
# Foreground: the exit code IS the container's. Clean and simple.
if docker run --rm myapp:test /opt/run-tests.sh; then
  echo pass
else
  echo "fail rc=$?"
fi

# Detached: capture the id, then read the real code with `docker wait`.
cid=$(docker run -d myapp:batch /opt/job.sh)
rc=$(docker wait "$cid")            # blocks until exit, prints the code on stdout
docker logs "$cid" > job.log 2>&1
docker rm "$cid" >/dev/null
[[ "$rc" -eq 0 ]] || { echo "job failed rc=$rc"; exit "$rc"; }
Two traps. First, don’t combine -d --rm when you need the exit code — --rm can remove the container before you inspect it; use foreground --rm (which returns the code directly), or detached without --rm then inspect + rm. Second, decode signal deaths: a process killed by signal N exits with 128 + N, so 137 = 128 + 9 (SIGKILL — usually the OOM killer; confirm with docker inspect -f '{{.State.OOMKilled}}' cid) and 143 = 128 + 15 (SIGTERM). A “mystery” 137 in CI is almost always the container hitting its memory limit.
kubectl: JSON Output Is the Real API
kubectl get accepts -o for output format. The interesting ones for shell automation:
-o value |
Output | Use case |
|---|---|---|
wide |
Tab-separated, includes node, IP, etc. | Quick eyeball; not for parsing (column widths shift) |
name |
Just resource names: pod/web-1 |
Fast list for piping to other kubectl commands |
json |
Full JSON | Source of truth; pipe to jq |
yaml |
Full YAML | Diffing manifests (with --export deprecated; use --show-managed-fields=false) |
jsonpath='{...}' |
jsonpath expression | Simple field extraction without a jq dependency |
jsonpath-as-json='{...}' |
JSON-encoded jsonpath result | Get arrays as JSON |
go-template='...' |
Go-template expression | Maximum flexibility but obscure syntax |
custom-columns=NAME:.metadata.name,... |
Tab-aligned table | Human-friendly; regex-fragile for parsing |
The “wide” / “table” parser trap
# Looks fine.
kubectl get pods -o wide | awk '{print $1}'
# Until a column shifts because a status string is "ContainerStatusUnknown" instead of "Running"
# and now $1 picks up the wrong field.
Never parse -o wide or column-aligned output. Always:
# Lightweight: jsonpath for one or two fields.
kubectl get pods -o jsonpath='{range .items[*]}{.metadata.name}{"\t"}{.status.phase}{"\n"}{end}'

# Heavy: -o json | jq.
kubectl get pods -o json | jq -r '.items[] | "\(.metadata.name)\t\(.status.phase)"'
Both produce TSV output with named fields, robust to ordering changes.
JSONPath vs jq: when to use which
JSONPath (built into kubectl) when:
- You want to avoid a
jqdependency. - The field path is simple: one to three levels deep.
- You don’t need filters, sorting, or transformations.
# Get a single field.
kubectl get pod web-0 -o jsonpath='{.status.podIP}'

# Iterate over array.
kubectl get pods -o jsonpath='{range .items[*]}{.metadata.name}={.status.phase}{"\n"}{end}'

# Filter (limited; only equality):
kubectl get pods -o jsonpath="{.items[?(@.status.phase=='Running')].metadata.name}"
jq (external) when:
- You need filtering on multiple conditions.
- You need to sort or compute (e.g. count Running vs not).
- You need to extract nested array fields.
- You need to produce JSON output for further processing.
# Pods not in Running state, with their reasons.
kubectl get pods -o json | jq -r '
  .items[]
  | select(.status.phase != "Running")
  | "\(.metadata.name)\t\(.status.phase)\t\(.status.reason // "")"
'

# Total restart count by container.
kubectl get pods -o json | jq -r '
  [.items[].status.containerStatuses[]?.restartCount // 0]
  | add
'

# All container images sorted unique.
kubectl get pods -A -o json | jq -r '
  [.items[].spec.containers[].image] | unique | .[]
'
The rule of thumb: if you write -o jsonpath with more than one filter or you start nesting range, switch to -o json | jq.
kubectl exec: same TTY rules apply
# CI / scripts: no TTY.
kubectl exec my-pod -c my-container -- /opt/app/script.sh

# Pipe stdin.
echo 'select 1;' | kubectl exec -i my-pod -- psql -U postgres

# Interactive (humans only):
kubectl exec -it my-pod -- bash
The -- separator is important. Without it, kubectl exec my-pod /opt/foo --bar may parse --bar as a kubectl flag.
kubectl exec is racy with pod lifecycle
# Get a pod name.
pod=$(kubectl get pod -l app=web -o jsonpath='{.items[0].metadata.name}')
# Pod may be terminating between this line and the next.
kubectl exec "$pod" -- /opt/app/script.sh
# May error: "container is terminating" or hang if pod is being recreated.
Defensive pattern:
# Retry exec a few times, picking a fresh ready pod each iteration.
exec_in_ready_pod() {
  local label="$1"; shift
  local attempts=5 pod
  for ((i=1; i<=attempts; i++)); do
    pod=$(kubectl get pod -l "$label" \
      -o jsonpath='{range .items[?(@.status.phase=="Running")]}{.metadata.name}{"\n"}{end}' \
      | head -n1)
    [[ -z "$pod" ]] && { sleep 2; continue; }
    if kubectl exec "$pod" -- "$@"; then
      return 0
    fi
    sleep 2
  done
  echo "exec failed after $attempts attempts" >&2
  return 1
}

exec_in_ready_pod app=web /opt/app/healthcheck.sh
Server-side filtering: --field-selector (and when to prefer it)
There are three places you can filter Kubernetes objects, cheapest first:
- Label selector
-l— indexed, server-side, arbitrary labels:-l app=web,tier=frontend. --field-selector— server-side, but only a small allowlist of built-in fields.jq— client-side, full power, but you first transfer every object over the wire.
Push the filter as far left (server-side) as you can, so you fetch kilobytes instead of the 100 MB that get pods -A -o json returns on a big cluster.
# Only Running pods, straight from the API — no jq needed.
kubectl get pods --field-selector=status.phase=Running

# Everything NOT running, on one node:
kubectl get pods --field-selector=status.phase!=Running,spec.nodeName=node-3

# Warning events about pods (great for triage):
kubectl get events --field-selector=type=Warning,involvedObject.kind=Pod

# Combine label + field selector + name output:
kubectl get pods -l app=web --field-selector=status.phase=Running -o name
The catch: field selectors accept only specific fields (for pods: status.phase, spec.nodeName, status.podIP, metadata.name, metadata.namespace, and a few more) — an unsupported field errors with field label not supported, whereas jq will happily read any path. That is exactly the trade-off: --field-selector for the cheap, indexed, common filters; jq for anything richer (multiple conditions on arbitrary nested fields, computation, sorting).
Streaming Logs: Bounded, Filtered, Searchable
kubectl logs and docker logs both support --follow. To stream into a pipeline that searches for errors:
# Stream logs from all pods of a deployment, prefixed with pod name, filter for ERROR.
kubectl logs -l app=web --all-containers --tail=100 --follow --prefix \
  | grep --line-buffered ERROR
The --prefix adds the pod name. --line-buffered makes grep flush per-line so you see output in real time (without it, grep buffers in 4KB chunks).
For docker:
docker logs --follow --tail=100 myapp 2>&1 \
  | grep --line-buffered -E 'ERROR|FATAL'
The 2>&1 is critical: docker’s stderr is the container’s stderr, where most errors actually go. Without it, you only see stdout.
Log capture with timeout (CI: “wait for app to log ‘Ready’”)
wait_for_log_marker() {
  local pod="$1" marker="$2" timeout="${3:-60}"
  timeout "$timeout" bash -c "
    kubectl logs --follow '$pod' 2>&1 | while IFS= read -r line; do
      printf '%s\n' \"\$line\"
      if [[ \"\$line\" == *'$marker'* ]]; then
        exit 0
      fi
    done
    exit 1
  "
}

wait_for_log_marker web-0 "Server listening on :8080" 30 \
  && echo "ready"
The outer timeout kills the whole pipeline if the marker doesn’t appear in time. The inner shell exits early when the marker is found.
Portability note:
timeoutis GNU coreutils (Linux). On macOS/BSD it isn’t installed by default — Homebrew’scoreutilsprovides it asgtimeout. In portable scripts, detect it:TIMEOUT=$(command -v timeout || command -v gtimeout). The container commands are identical everywhere; it’s the surrounding shell utilities that vary by platform.
Rollout Status: The “Done” Question
kubectl rollout status deployment/web is the canonical “is it done?” command. It blocks until rollout completes — but the definition of “complete” is subtle.
kubectl rollout restart deployment/web
kubectl rollout status deployment/web --timeout=5m
echo "rollout finished"
What “done” actually means: rollout status returns success when:
- The desired replica count matches the available count, AND
- All pods of the new generation are ready, AND
- No old-generation pods are in the deployment’s ReplicaSet.
It does NOT mean:
- All old pods have been deleted (they may still be terminating in the background).
- All connections drained.
- The new image actually works in production traffic.
For “all old pods gone” guarantees, poll explicitly:
wait_for_old_pods_gone() {
  local deploy="$1" namespace="${2:-default}" timeout="${3:-300}"
  local end=$(($(date +%s) + timeout))
  while (( $(date +%s) < end )); do
    local old_count
    old_count=$(kubectl -n "$namespace" get pods \
      -l "app=$deploy" \
      -o json \
      | jq '[.items[] | select(.metadata.deletionTimestamp != null)] | length')
    [[ "$old_count" -eq 0 ]] && return 0
    sleep 2
  done
  return 1
}
deletionTimestamp != null means the pod is being terminated (graceful shutdown in progress). When the count is 0, every old pod is fully gone.
Wait for a custom condition
# Wait until N replicas of a deployment are Ready.
wait_for_ready_replicas() {
  local deploy="$1" want="$2" namespace="${3:-default}" timeout="${4:-300}"
  local end=$(($(date +%s) + timeout))
  while (( $(date +%s) < end )); do
    local got
    got=$(kubectl -n "$namespace" get deploy "$deploy" \
      -o jsonpath='{.status.readyReplicas}')
    [[ "${got:-0}" -ge "$want" ]] && return 0
    sleep 2
  done
  return 1
}

wait_for_ready_replicas web 3 || { echo "deployment not ready"; exit 1; }
kubectl wait: the declarative alternative
When a built-in condition expresses what you want, kubectl wait is cleaner than a hand-rolled poll loop — it blocks server-side until the condition is true or the timeout fires, and returns the right exit code:
kubectl wait --for=condition=Ready   pod  -l app=web   --timeout=120s
kubectl wait --for=condition=complete job/migrate       --timeout=10m
kubectl wait --for=delete             pod/web-0         --timeout=60s

# kubectl 1.23+: wait on an arbitrary jsonpath value.
kubectl wait --for=jsonpath='{.status.readyReplicas}'=3 deploy/web --timeout=5m
Three gotchas that bite everyone:
- The resource must already exist.
kubectl apply -f x.yaml && kubectl wait ...can race — the object may not be registered whenwaitstarts. Poll for existence first, or on recent kubectl use--for=create. - Zero matches is an error. If a selector matches nothing,
waitfails withno matching resources found— guard with aget(or|| truewhen “nothing to wait for” is acceptable). - Match the condition to the resource. A Job has
complete/failed, notReady; a Pod hasReady, notcomplete. Using the wrong condition name waits forever until the timeout.
Reach for kubectl wait for standard conditions; fall back to the jq/jsonpath poll loops above for the truths kubectl can’t express — chiefly “all old pods are actually gone.”
A Drop-In Library: lib/k8s.sh
# lib/k8s.sh — kubectl helpers for shell automation.

# ─── Resolution helpers ────────────────────────────────────────────────────

# First running pod matching a label selector.
k8s_pod_running() {
  local label="$1" namespace="${2:-default}"
  kubectl -n "$namespace" get pod -l "$label" \
    -o jsonpath='{range .items[?(@.status.phase=="Running")]}{.metadata.name}{"\n"}{end}' \
    | head -n1
}

# All pod names matching a label.
k8s_pods() {
  local label="$1" namespace="${2:-default}"
  kubectl -n "$namespace" get pod -l "$label" -o jsonpath='{range .items[*]}{.metadata.name}{"\n"}{end}'
}

# Container names in a pod.
k8s_pod_containers() {
  local pod="$1" namespace="${2:-default}"
  kubectl -n "$namespace" get pod "$pod" -o jsonpath='{range .spec.containers[*]}{.name}{"\n"}{end}'
}

# ─── Status helpers ────────────────────────────────────────────────────────

k8s_pod_phase() {
  local pod="$1" namespace="${2:-default}"
  kubectl -n "$namespace" get pod "$pod" -o jsonpath='{.status.phase}'
}

k8s_pod_ready() {
  local pod="$1" namespace="${2:-default}"
  local ready
  ready=$(kubectl -n "$namespace" get pod "$pod" \
    -o jsonpath='{.status.conditions[?(@.type=="Ready")].status}')
  [[ "$ready" == "True" ]]
}

k8s_pods_not_running() {
  local namespace="${1:-default}"
  kubectl -n "$namespace" get pods -o json | jq -r '
    .items[]
    | select(.status.phase != "Running")
    | "\(.metadata.name)\t\(.status.phase)\t\(.status.reason // "")"
  '
}

# ─── Exec & logs ───────────────────────────────────────────────────────────

# Exec a command in the first ready pod matching a label, with retries.
k8s_exec_label() {
  local label="$1" namespace="$2"; shift 2
  local attempts=5 pod
  for ((i=1; i<=attempts; i++)); do
    pod=$(k8s_pod_running "$label" "$namespace")
    [[ -z "$pod" ]] && { sleep 2; continue; }
    if kubectl -n "$namespace" exec "$pod" -- "$@"; then
      return 0
    fi
    sleep 2
  done
  echo "k8s_exec_label: failed after $attempts attempts (label=$label)" >&2
  return 1
}

# Stream logs from all pods of a label, with prefix and line-buffered grep.
k8s_logs_grep() {
  local label="$1" namespace="$2" pattern="$3"
  kubectl -n "$namespace" logs -l "$label" --all-containers --tail=100 --follow --prefix 2>&1 \
    | grep --line-buffered -E "$pattern"
}

# ─── Wait helpers ──────────────────────────────────────────────────────────

# Wait until a deployment has at least N ready replicas.
k8s_wait_ready() {
  local deploy="$1" want="$2" namespace="${3:-default}" timeout="${4:-300}"
  local end=$(($(date +%s) + timeout))
  while (( $(date +%s) < end )); do
    local got
    got=$(kubectl -n "$namespace" get deploy "$deploy" \
      -o jsonpath='{.status.readyReplicas}' 2>/dev/null || echo 0)
    [[ "${got:-0}" -ge "$want" ]] && return 0
    sleep 2
  done
  return 1
}

# Wait until no pods are in the Terminating state for a label.
k8s_wait_no_terminating() {
  local label="$1" namespace="${2:-default}" timeout="${3:-300}"
  local end=$(($(date +%s) + timeout))
  while (( $(date +%s) < end )); do
    local count
    count=$(kubectl -n "$namespace" get pod -l "$label" -o json \
      | jq '[.items[] | select(.metadata.deletionTimestamp != null)] | length')
    [[ "$count" -eq 0 ]] && return 0
    sleep 2
  done
  return 1
}

# Wait until a log line matching $marker appears (with timeout).
k8s_wait_for_log() {
  local pod="$1" marker="$2" namespace="${3:-default}" timeout="${4:-60}"
  timeout "$timeout" bash -c "
    kubectl -n '$namespace' logs --follow '$pod' 2>&1 | while IFS= read -r line; do
      printf '%s\n' \"\$line\"
      [[ \"\$line\" == *'$marker'* ]] && exit 0
    done
    exit 1
  "
}

# ─── Manifest helpers ──────────────────────────────────────────────────────

# Render a manifest with `envsubst`-style substitution.
k8s_apply_template() {
  local file="$1"
  envsubst < "$file" | kubectl apply -f -
}

# Diff a manifest before applying.
k8s_diff_template() {
  local file="$1"
  envsubst < "$file" | kubectl diff -f -
}
Real-World Recipes
Recipe 1: Safe rolling restart with verification
. lib/k8s.sh

safe_restart() {
  local deploy="$1" namespace="${2:-default}"
  local want
  want=$(kubectl -n "$namespace" get deploy "$deploy" -o jsonpath='{.spec.replicas}')

  echo "restarting $deploy ($want replicas)"
  kubectl -n "$namespace" rollout restart deployment/"$deploy"

  echo "waiting for rollout..."
  kubectl -n "$namespace" rollout status deployment/"$deploy" --timeout=10m \
    || { echo "rollout failed"; return 1; }

  echo "waiting for old pods to terminate..."
  k8s_wait_no_terminating "app=$deploy" "$namespace" 600 \
    || { echo "old pods still terminating"; return 1; }

  echo "verifying $want pods are Ready..."
  k8s_wait_ready "$deploy" "$want" "$namespace" 60 \
    || { echo "not enough Ready replicas"; return 1; }

  echo "done."
}

safe_restart web
Recipe 2: Run a database migration in a one-shot job
run_migration_job() {
  local image="$1" db_url="$2" namespace="${3:-default}"
  local name="migrate-$(date +%s)"

  cat <<EOF | kubectl -n "$namespace" apply -f -
apiVersion: batch/v1
kind: Job
metadata:
  name: $name
spec:
  template:
    spec:
      restartPolicy: Never
      containers:
      - name: migrate
        image: $image
        command: ["/opt/app/migrate.sh"]
        env:
        - name: DATABASE_URL
          valueFrom:
            secretKeyRef:
              name: db-credentials
              key: url
EOF

  # Wait for completion.
  kubectl -n "$namespace" wait --for=condition=complete --timeout=10m "job/$name" \
    && { kubectl -n "$namespace" delete "job/$name"; return 0; } \
    || {
      echo "migration job failed; logs:"
      kubectl -n "$namespace" logs "job/$name"
      kubectl -n "$namespace" delete "job/$name"
      return 1
    }
}

run_migration_job myapp:v2 "$DB_URL"
Recipe 3: Collect logs from all pods of a service
# Tar up logs from all pods of a deployment for offline analysis.
collect_logs() {
  local label="$1" namespace="${2:-default}" outdir="${3:-./logs}"
  mkdir -p "$outdir"
  local pod
  while read -r pod; do
    [[ -z "$pod" ]] && continue
    echo "collecting $pod..."
    kubectl -n "$namespace" logs "$pod" --all-containers --prefix \
      > "$outdir/$pod.log" 2>&1
    # Previous container logs (if it crashed and was restarted).
    kubectl -n "$namespace" logs "$pod" --all-containers --prefix --previous 2>/dev/null \
      > "$outdir/$pod.previous.log" || rm -f "$outdir/$pod.previous.log"
  done < <(kubectl -n "$namespace" get pods -l "$label" -o jsonpath='{range .items[*]}{.metadata.name}{"\n"}{end}')

  tar czf "logs-$(date +%s).tgz" -C "$outdir" .
  echo "logs in $outdir, archive: logs-*.tgz"
}

collect_logs app=web prod /tmp/incident-logs
Recipe 4: Health-check parser with structured output
# Print a status table for all pods in a namespace, sorted by health.
namespace_health() {
  local namespace="${1:-default}"
  kubectl -n "$namespace" get pods -o json | jq -r '
    .items[]
    | {
        name: .metadata.name,
        phase: .status.phase,
        ready: ([.status.conditions[]? | select(.type=="Ready") | .status] | first // "Unknown"),
        restarts: ([.status.containerStatuses[]?.restartCount // 0] | add // 0),
        age: .status.startTime
      }
    | "\(.phase)\t\(.ready)\t\(.restarts)\t\(.name)\t\(.age)"
  ' | sort | column -t -s$'\t'
}

namespace_health prod
# Output:
# Pending  False  0  api-7d4b8f-xyz   2025-01-13T08:12:00Z
# Running  True   0  api-7d4b8f-abc   2025-01-13T07:45:00Z
# Running  True   2  worker-5f-pqr    2025-01-13T07:30:00Z
Recipe 5: Drift detection between Helm release and live state
# Compare what's deployed to what's in the chart.
helm_drift() {
  local release="$1" namespace="${2:-default}"
  helm -n "$namespace" template "$release" \
    --release-name "$release" \
    --include-crds \
    > /tmp/expected.yaml
  kubectl -n "$namespace" diff -f /tmp/expected.yaml
}
kubectl diff shells out to a diff tool (default: diff); KUBECTL_EXTERNAL_DIFF=delta gives nicer output if delta is installed.
Going deeper
The daemon round-trip — why loops are the enemy
Every docker invocation forks the CLI binary, connects to /var/run/docker.sock, hands the request to dockerd, and streams the response back. Every kubectl invocation forks kubectl, loads and parses your kubeconfig, does a TLS handshake to the API server, authenticates — and on EKS/GKE authentication itself may shell out to an exec-credential plugin (aws eks get-token, gke-gcloud-auth-plugin) that makes its own network call — then finally sends the request. That per-call overhead is a fixed tax: a few milliseconds locally, 100 ms+ to a remote cluster, more when an auth plugin runs.
In a loop over 500 items, that tax dominates — you’ve built a serial chain of 500 RPCs where one bulk call would do:
# ANTIPATTERN: 400 forks + 400 daemon round-trips, run one after another.
for id in $(docker ps -q); do
  docker inspect -f '{{.Name}} {{.State.ExitCode}}' "$id"
done

# FIX: inspect takes many IDs and returns a JSON array — ONE call.
docker inspect $(docker ps -q) --format '{{.Name}} {{.State.ExitCode}}'

# Same lesson for kubectl: fetch the whole set once, filter locally.
kubectl get pods -o json | jq -r '.items[] | "\(.metadata.name) \(.status.phase)"'
The rule: one query that returns many objects beats many queries that return one. When you genuinely must fan out (say, exec a command into each of N pods, which can’t be batched), bound the parallelism with xargs -P rather than a serial loop — but cap the degree so you don’t hammer the API server:
# Fan out exec across pods, at most 4 in flight.
kubectl get pod -l app=web -o name \
  | xargs -P4 -I{} kubectl exec {} -- /opt/app/rotate-cert.sh
Exit codes across the whole stack
Chaining containers into pipelines re-introduces the classic pipe exit-code trap. set -o pipefail (from the pipes lesson) is non-negotiable here:
# WITHOUT pipefail: if kubectl fails but jq succeeds on empty input, $? == 0. Silent bug.
kubectl get pods -o json | jq '.items | length'

# WITH pipefail: the pipeline reports the container command's real failure.
set -o pipefail
kubectl exec pod -- pg_dump sales | gzip > sales.sql.gz
# now a pg_dump failure fails the whole pipeline, even though gzip "succeeded"
Across the stack the exit-code sources are: the shell (0–255); 128 + N for a process killed by signal N (137 = SIGKILL/OOM, 143 = SIGTERM); a foreground docker run returning the container’s code; docker run -d returning 0; docker exec and kubectl exec returning the command’s code; and docker wait printing the code on stdout. The one genuinely ambiguous case is kubectl exec to a pod that’s dying — a non-zero there may mean “your command failed” or “kubectl couldn’t attach.” The only robust fix is to resolve a fresh Running pod and retry (the exec_in_ready_pod helper), so a transient attach failure doesn’t get mistaken for a real command failure.
JSONPath vs jq vs go-template — the real differences
kubectl’s -o jsonpath is a reimplementation of JSONPath, and it’s missing standard features people assume are there:
- No recursive descent (
..) and no wildcards beyond[*]. - Filters support only
==and!=— no<,>, or regex.?(@.status.phase=='Running')works;?(@.status.restartCount > 3)does not. - No functions, no arithmetic, no sorting.
- Iteration is
{range .items[*]}...{end}; every expression is wrapped in{}; literal tabs/newlines are{"\t"}/{"\n"}. - Shell-quoting is a trap: the filter uses single quotes, so wrap the whole expression in double quotes —
-o jsonpath="{.items[?(@.status.phase=='Running')].metadata.name}".
jq is a full language — filters, arithmetic, group_by, unique, string ops — and it can stream inputs too large for memory with --stream, which matters because you should never slurp a multi-hundred-MB get -A -o json into a shell variable; keep it in a pipe. -o go-template uses the same Go template engine as docker --format, so it’s maximally flexible but obscure; it’s rarely worth reaching for over jq. Decision rule: one or two simple fields → jsonpath; anything with a real filter, count, or sort → -o json | jq; go-template only when you’re already fluent in it.
Ephemeral pods and the resolve-then-act race
Pod names carry a random suffix (web-7d4b8f-abc) and change on every rollout; a pod can also vanish between “resolve” and “act” because of eviction, node drain, a rollout, or an OOM kill. Two consequences for scripts:
- Never cache a pod name across a rollout (or hard-code one) — always resolve by label at the moment of use.
- Prefer a Job over
exec-into-a-Pod for anything long-running. A Job survives node churn, hasrestartPolicyandcompletions/backoffLimit, and gives you a cleankubectl wait --for=condition=complete. Anexecinto a pod dies with the pod.
For “I need a shell in a distroless pod that has no shell,” the modern answer is ephemeral containers: kubectl debug -it POD --image=busybox --target=app attaches a debug container sharing the target’s namespaces — no need to bake bash into production images.
Rootless and least-privilege in automation
- Rootless podman internals: user namespaces map container-root to your UID; the allowed sub-ranges live in
/etc/subuidand/etc/subgid; networking goes throughslirp4netns/pasta. That’s why binding a host port below 1024 fails without extra privilege — either publish a high port (--publish 8080:80) or lowernet.ipv4.ip_unprivileged_port_start. Rootless is ideal in CI where you can’t (and shouldn’t) run a root daemon. - Least privilege for kubectl: check before you act with
kubectl auth can-i delete pods -n prod; run automation under a scoped ServiceAccount + Role, not your admin kubeconfig; use--as user --as-group groupto test what a restricted identity can do. Never bake a long-lived admin token into a script — prefer short-lived exec-credential tokens. - Registry credentials never on argv:
docker login -p "$PASSWORD"leaks the password inpsand shell history for the life of the process. Pipe it instead:echo "$REGISTRY_TOKEN" | docker login ghcr.io -u "$USER" --password-stdin. Keep the token in a secrets manager and reference it as$REGISTRY_TOKEN, never a literal. - Clean up what you start: a background
kubectl port-forwardor detacheddocker runoutlives the script unless you trap it —pf_pid=$!; trap 'kill "$pf_pid" 2>/dev/null' EXIT. This is the signal-handling lesson applied to containers.
Portability: this host, GNU vs BSD, and CI
The container CLIs (docker/podman/kubectl) behave the same on every platform — but the surrounding shell utilities do not. On this macOS authoring box the container tools aren’t installed at all (so the outputs here are representative), and the coreutils differ from the Linux the course targets: timeout is gtimeout, GNU date -d/date --iso-8601 isn’t in BSD date, GNU xargs -r (no-run-if-empty) is a no-op flag on BSD, and column -t formats differently. The safe move for real automation is to run the script inside a Linux container or CI runner where GNU tools exist, or to detect-and-adapt (command -v gtimeout || command -v timeout). The physics of the containers is portable; the shell around them is where GNU-vs-BSD bites.
Practice challenges
Work them top to bottom — they escalate from “make it run in CI” to “make it correct under real cluster conditions.” Try each before opening the solution.
1. Beginner — kill the TTY error. A CI job runs docker exec -it db pg_isready -U app and fails with the input device is not a TTY. Fix it for CI and print PASS/FAIL with the real exit code.
<details> <summary>Solution</summary>
if docker exec db pg_isready -U app; then
  echo PASS
else
  echo "FAIL rc=$?"
fi
Drop both -i and -t: nothing is piped in, and CI has no terminal for -t to allocate. Why: -t demands a controlling terminal that doesn’t exist in CI; -i is only for piping stdin, which this command doesn’t need.
</details>
2. Beginner — pipe SQL in, capture output. Run the query in report.sql against a running postgres container and save the result to report.txt on the host, with no TTY artifacts.
<details> <summary>Solution</summary>
docker exec -i postgres psql -U app -d sales < report.sql > report.txt
# equivalently: cat report.sql | docker exec -i postgres psql -U app -d sales > report.txt
Why: -i connects stdin so the file streams in; no -t, so the captured output stays clean bytes (a TTY would inject escape sequences into report.txt); host-side > captures stdout.
</details>
3. Intermediate — the same list two ways. Print every pod that is not Running as NAME<TAB>PHASE, first with -o jsonpath, then with -o json | jq. Which one extends more gracefully?
<details> <summary>Solution</summary>
# jsonpath (note the double quotes around the single-quoted filter):
kubectl get pods -o jsonpath="{range .items[?(@.status.phase!='Running')]}{.metadata.name}{'\t'}{.status.phase}{'\n'}{end}"

# jq:
kubectl get pods -o json | jq -r '.items[] | select(.status.phase!="Running") | "\(.metadata.name)\t\(.status.phase)"'
Why: both select structurally, so a new phase string like ContainerStatusUnknown can’t shift a column the way awk on -o wide would. jq wins the moment you add a second condition or also want .status.reason — jsonpath filters only do ==/!=.
</details>
4. Intermediate — inspect without grep. For container web, print status exitcode restarts health on one line using docker inspect --format, then reproduce it with docker inspect | jq. Handle a container that has no healthcheck.
<details> <summary>Solution</summary>
# Go template — {{with}}...{{else}} guards the missing Health block:
docker inspect -f '{{.State.Status}} {{.State.ExitCode}} {{.RestartCount}} {{with .State.Health}}{{.Status}}{{else}}none{{end}}' web

# jq — // provides the fallback (remember inspect returns an array):
docker inspect web | jq -r '.[0] | "\(.State.Status) \(.State.ExitCode) \(.RestartCount) \(.State.Health.Status // "none")"'
# representative → exited 137 2 none
Why: {{with .State.Health}}...{{else}}none{{end}} and // "none" both cope with the absent-healthcheck case; the template needs no jq dependency, jq is easier to extend to more fields.
</details>
5. Advanced — a truthful rolling restart. Write deploy_done DEPLOY NS that restarts a deployment and returns 0 only when the rollout is complete AND no old pods remain Terminating AND the desired replica count is Ready.
<details> <summary>Solution</summary>
deploy_done() {
  local d="$1" ns="${2:-default}" want
  want=$(kubectl -n "$ns" get deploy "$d" -o jsonpath='{.spec.replicas}')

  kubectl -n "$ns" rollout restart deploy/"$d"
  kubectl -n "$ns" rollout status deploy/"$d" --timeout=10m || return 1

  # old pods fully gone (deletionTimestamp cleared)
  local end=$(( $(date +%s) + 300 ))
  while (( $(date +%s) < end )); do
    [[ $(kubectl -n "$ns" get pod -l app="$d" -o json \
         | jq '[.items[] | select(.metadata.deletionTimestamp != null)] | length') -eq 0 ]] && break
    sleep 2
  done

  # N ready — this final test IS the return code
  [[ $(kubectl -n "$ns" get deploy "$d" -o jsonpath='{.status.readyReplicas}') -ge "$want" ]]
}
Why: rollout status alone returns before old pods finish terminating; the deletionTimestamp poll closes that gap, and the final readyReplicas comparison — left as the last expression — becomes the function’s exit code.
</details>
6. Advanced — kill the fork storm. This inspects up to 400 containers, one daemon round-trip per iteration. Rewrite it as a single call and explain the saving.
for id in $(docker ps -q); do
  docker inspect -f '{{.Name}} {{.State.ExitCode}}' "$id"
done
<details> <summary>Solution</summary>
docker inspect $(docker ps -q) --format '{{.Name}} {{.State.ExitCode}}'
# or, if you prefer jq:
docker inspect $(docker ps -q) | jq -r '.[] | "\(.Name) \(.State.ExitCode)"'
Why: docker inspect accepts many IDs at once and returns a JSON array, so you collapse 400 fork+RPC pairs into one — seconds become milliseconds. The identical principle applies to kubectl: get pods -o json | jq once, never get pod per name in a loop.
</details>
Common beginner mistakes
- “
docker execreturned 0, so my command passed.”execdoes return the inner command’s code — but people wrap it insh -c '...'that swallows the failure, or read kubectl’s connection error to a dying pod as if it were the command’s result. Right model: run the command directly (nosh -cunless you need shell features), and separate “couldn’t reach the container” from “the command failed.” - “I’ll use
-itbecause that’s what works when I test by hand.” Interactive success doesn’t transfer to CI, which has no TTY. Right model: default to no flags; add-ionly to pipe stdin;-tis for a human at a keyboard. - “I’ll parse
docker ps/kubectl getwithawk.” Those columns are for eyes and shift width without warning. Right model:--format/-o json/-o jsonpathgive named fields that never move. - “
kubectl rollout statussaid success, so the old version is gone.” It returns when the new pods are Ready and out of the ReplicaSet; old pods may still be draining connections in the background. Right model: polldeletionTimestampfor the real “all old pods gone.” - “
podmanis justdockerrenamed, so everything is identical.” Mostly — but rootless podman can’t bind ports below 1024, there’s no daemon so container lifetimes differ, and a fewinspectfields and exit-code edges diverge. Right model: alias for convenience, test on the runtime you ship. - “
docker logsis empty, so the app logged nothing.” Most apps log to stderr; a downstreamgrepon stdout alone misses it entirely. Right model:2>&1before the filter. - “I’ll loop and call
docker/kubectlonce per item.” Each call is a fork plus a full daemon/API round-trip; 500 items becomes 500 sequential RPCs. Right model: one bulk-o json/inspect $idscall piped to jq;xargs -Ponly when a task truly can’t be batched. - “I’ll hard-code the pod name I saw once.” Pod names carry a random suffix and change on every rollout. Right model: resolve by label (
-l app=web) at the moment of use.
Footgun List
-itin CI fails. No TTY in CI. Drop-t. Use-ionly if you pipe stdin.kubectl execwithout--can mis-parse arguments to your inner command. Alwayskubectl exec POD -- CMD ARGS.- Pod names with random suffixes change every rollout. Don’t hard-code
web-7d4b8f-abc; always resolve via labels. kubectl rollout statusreturns success before old pods terminate. Addk8s_wait_no_terminatingfor “fully done.”kubectl logs --previousgets the previous container’s logs (after a restart). Without--previous, you get the current run only.- Parsing
-o widebreaks when columns shift. Always JSONPath or jq. kubectl get -Afans out across all namespaces. A singlekubectl get pods -A -o jsonon a 1000-pod cluster can be 100+ MB and 10+ seconds. Filter with-lif possible.docker logsdoesn’t capture container exit code. Usedocker waitafterdocker run -dto get exit code.docker execdoesn’t run in the container’s PID namespace if you specify--pid host. Verify which namespace your exec lands in.kubectl waitrequires the resource to exist first. If youkubectl applyand immediatelykubectl wait, the wait may fail because the resource hasn’t been created yet. Add a small sleep or poll for existence.kubectl port-forwardis interactive. It forwards until killed. In scripts, run it in the background and remember to clean it up:port_forward_pid=$!; trap 'kill $port_forward_pid' EXIT.kubectl config use-contextis global. Two scripts running in parallel can fight over context. Pass--contextexplicitly:kubectl --context=prod-cluster get pods.
Quick-Reference Card
┌─ TTY MATRIX (docker / kubectl exec) ──────────────────────────────────┐
│  no flags    detached/no-stdin commands                              │
│  -i          pipe stdin into container; no TTY                       │
│  -t          allocate TTY (rare alone)                                │
│  -it         interactive shell (HUMANS ONLY; fails in CI)            │
│  docker-compose exec defaults to -it; use -T to force no-TTY in CI   │
└────────────────────────────────────────────────────────────────────────┘

┌─ JSONPATH vs jq ──────────────────────────────────────────────────────┐
│  jsonpath: simple paths, no jq dep, limited filters                  │
│  jq:       complex filters, sorting, transformations                 │
│  Rule: > 1 filter or nested range → switch to jq                     │
└────────────────────────────────────────────────────────────────────────┘

┌─ ROLLOUT "DONE" ──────────────────────────────────────────────────────┐
│  rollout status        new pods ready, old gen out of replicaset     │
│  but NOT     all old pods deleted (still terminating in background)  │
│  Add: wait_no_terminating loop for full guarantee                    │
└────────────────────────────────────────────────────────────────────────┘

┌─ ESSENTIAL COMMANDS ──────────────────────────────────────────────────┐
│  kubectl get pod -l app=web -o json | jq ...                          │
│  kubectl get pods --field-selector=status.phase=Running               │
│  kubectl logs -l app=web --all-containers --tail=N --follow --prefix  │
│  kubectl exec POD -c CONTAINER -- CMD                                 │
│  kubectl rollout restart deployment/NAME                              │
│  kubectl rollout status deployment/NAME --timeout=Nm                  │
│  kubectl wait --for=condition=Ready pod -l app=web                    │
│  kubectl diff -f manifest.yaml                                        │
└────────────────────────────────────────────────────────────────────────┘

┌─ POD LIFECYCLE ───────────────────────────────────────────────────────┐
│  Pending → ContainerCreating → Running → (Succeeded|Failed)          │
│  metadata.deletionTimestamp != null = Terminating                    │
│  status.containerStatuses[].state.{running,waiting,terminated}       │
│  status.containerStatuses[].restartCount = OOMKill / crash count     │
└────────────────────────────────────────────────────────────────────────┘

┌─ docker / podman ─────────────────────────────────────────────────────┐
│  docker run --init     PID 1 = tini; signal forwarding works         │
│  docker logs --since 5m --tail 100 --timestamps --follow             │
│  docker stop CID       SIGTERM → wait → SIGKILL after 10s            │
│  docker wait CID       prints exit code, blocks until exit           │
│  docker inspect -f '{{.State.ExitCode}}' CID                         │
│  docker inspect $(docker ps -q) | jq ...   (batch, not a loop)       │
│  exit 128+N: 137=SIGKILL/OOM  143=SIGTERM                            │
│  podman: daemonless · rootless · alias docker=podman (mostly)        │
└────────────────────────────────────────────────────────────────────────┘
Glossary
- TTY / pseudo-terminal: the terminal device a shell talks to.
-tallocates one; CI, cron, and systemd have none, so-tfails there. -i/-t/-T:-iconnects stdin (for piping data in);-tallocates a TTY (humans only);-Tis docker-compose’s flag to disable the default TTY.- PID 1: the first process in a container. The kernel gives it special signal handling; it must trap SIGTERM or the container ignores
docker stop.--initinjectstinito fix this. - daemon (
dockerd): docker’s long-running root process that actually owns containers; thedockerCLI is just a client that talks to it over a socket. - daemonless: podman’s model — no background service; the CLI
fork/execs the container directly, so it’s a child of your script. - rootless: running containers as an unprivileged user via user namespaces (podman’s default). Can’t bind host ports below 1024 without extra config.
- OCI runtime (
runc/crun): the low-level program that actually creates the container from an image + config, per the Open Container Initiative spec. containerd/conmon: docker’s container supervisor (containerd) vs podman’s tiny per-container monitor (conmon).docker runvsdocker exec:runstarts a new container from an image;execruns a command inside an already-running one.inspect: dumps a container/pod/object’s full state as JSON. Read single fields with--format; pipe the whole thing tojq.- Go template /
--format: docker/podman/kubectl’s built-in templating ({{.State.ExitCode}}) for extracting fields without a jq dependency. jq: a full JSON-processing language — filters,select, arithmetic,group_by— the workhorse for anything beyond a simple field.- JSONPath (kubectl): kubectl’s built-in field selector (
-o jsonpath='{...}'); a partial implementation — equality filters only, no functions or recursion. - label selector (
-l): server-side filter on arbitrary labels (-l app=web); indexed and cheap. - field selector (
--field-selector): server-side filter on a small allowlist of built-in fields (status.phase,spec.nodeName, …). - exit code /
128+N:$?after a command (0–255). A process killed by signal N exits128+N: 137 = SIGKILL/OOM, 143 = SIGTERM. docker wait: blocks until a container exits and prints its exit code — the way to get the code of a detached container.- Deployment / ReplicaSet: a Deployment manages rollouts; each revision is a ReplicaSet that owns the pods.
rollout statustracks the newest ReplicaSet. deletionTimestamp/ Terminating: a pod withmetadata.deletionTimestamp != nullis shutting down gracefully; poll for it being cleared everywhere to know old pods are truly gone.readyReplicas: the count of pods passing their readiness probe — the real “how many are serving traffic” number.kubectl wait/ condition: blocks until a resource reaches a condition (--for=condition=Ready,=complete,--for=delete). The resource must already exist.- Job: a run-to-completion workload; survives node churn, has
completions/backoffLimit, and a cleancondition=complete. Prefer it overexecfor long tasks. - ephemeral container /
kubectl debug: a temporary debug container attached to a running pod’s namespaces — the way to “get a shell” into a distroless image. port-forward: tunnels a local port to a pod; runs until killed, so background it andtrapthe cleanup in scripts.- kubeconfig / context / namespace: your cluster credentials file; a named cluster+user+namespace triple; and the default resource grouping. Pass
--context/-nexplicitly in scripts. --separator: ends kubectl/docker flag parsing so the rest goes to the inner command untouched (kubectl exec POD -- cmd --flag).envsubst: substitutes$VARreferences in a file from the environment — a lightweight way to template manifests beforekubectl apply -f -.docker cp/kubectl cp: copy files into/out of a container/pod.kubectl cpneedstarpresent inside the container.- OOMKilled: the kernel’s out-of-memory killer terminated the container (SIGKILL → exit 137); shows as
.State.OOMKilled=trueininspect.
What’s Next
Containers and Kubernetes give you scheduled, scaled compute. Cloud CLIs (AWS, Azure, GCP) give you the platform underneath: IAM, storage, DNS, networking. The next lesson, Cloud CLIs From Shell: AWS, Azure, GCP — Auth, Pagination, Parallel Calls & Output Discipline, covers credential resolution, the auth-environment chain, paginating large result sets without timeouts, parallelizing API calls safely, and writing scripts that don’t accidentally exceed rate limits or rotate credentials mid-run.