In a nutshell
Imagine you’re counting votes. There are two ways to do it. The first: photocopy every single ballot, pile all the copies onto one enormous table, then sort the whole mountain into stacks. You run out of table long before you run out of ballots — and the table is your machine’s RAM. The second way: walk past the ballots one at a time, and keep a small tally sheet with one line per candidate. Each ballot you see, you add a tick to that candidate’s line and move on. The tally sheet never grows past the number of candidates — a few dozen lines — no matter whether ten thousand or ten billion ballots stream past.
Streaming log analysis is the second method, and this entire lesson is about doing it well. The tally sheet keyed by candidate is awk’s associative array. The ballots are your log lines. The candidates are your distinct keys — the URLs, status codes, IPs, or query shapes you’re counting. You never need a table big enough to hold every log line at once; you only need one big enough to hold the list of distinct keys. That is why a single line of awk can summarize a 500 GB access log using about a megabyte of memory, while the “obvious” sort | uniq -c version fills your disk and dies.
Get that one idea and the rest is mechanics: stream the data past you once, aggregate only the distinct keys, then emit the result. When one core can’t keep up you map the work across cores with GNU parallel; when the logs live on a fleet you map across hosts with ssh; and when even the distinct keys won’t fit in RAM you fall back to an external-memory sort. Four patterns, one principle.
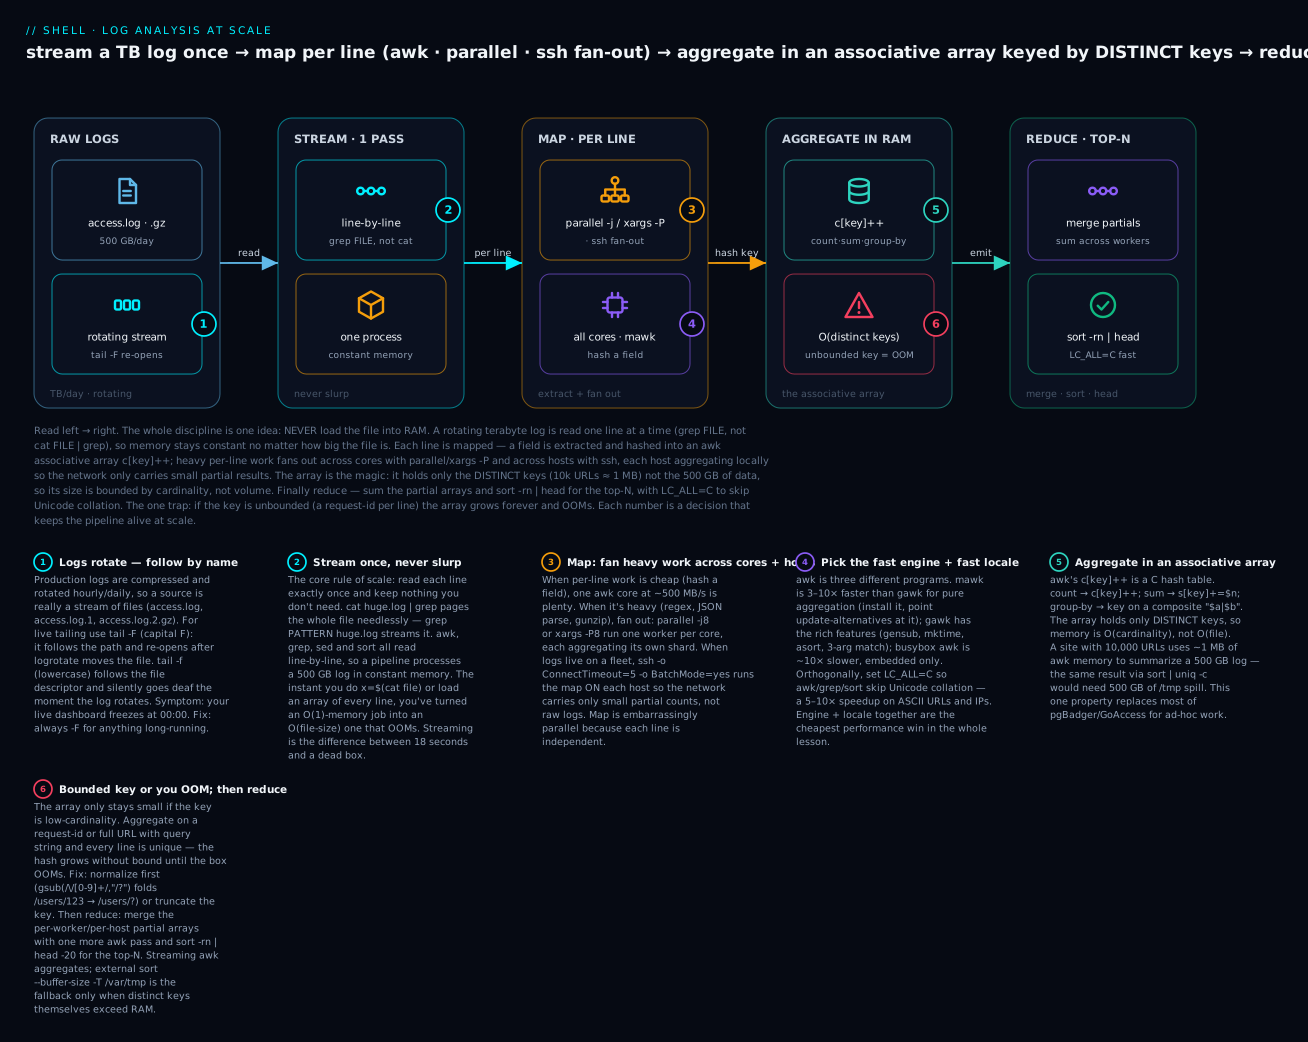
Read the diagram left to right: a rotating terabyte log is streamed one line at a time (never slurped into memory), each line is mapped — a field extracted and fanned across cores/hosts — into an associative array that holds only the distinct keys (so memory is O(cardinality), not O(file size)), and finally the partial arrays are reduced by merging and sort -rn | head for the top-N.
Level: Intermediate → Advanced · Time: ~50 min
Prerequisites & what you’ll be able to do
Know this first. This lesson assumes you’re comfortable with a few earlier building blocks:
- Pipes and exit codes — how
A | B | Cstreams and whyset -o pipefailmatters (Pipes & Pipelines). - Basic
awk,grep,sed, andjq— extracting fields and filtering lines (Text Processing: awk, jq, yq, CSV). - Bounded parallelism —
xargs -P, GNUparallel -j, and why you cap concurrency (Concurrency, parallel, xargs, FIFOs, flock).
You do not need to be an awk wizard — we build the aggregation idioms from scratch.
After this lesson you’ll be able to:
- Compute top-N anything (URLs, IPs, error messages, slow queries) from a log of any size in constant memory.
- Choose the right pattern for the job — streaming awk vs external sort vs
parallelvs ssh fan-out — and explain the memory/CPU trade-off out loud. - Parse the two log formats you’ll actually meet — nginx combined and JSON Lines — and aggregate them without loading the file.
- Produce percentiles (p50/p95/p99) and latency histograms in
awk, not just misleading means. - Map a job across cores and a fleet, then reduce correctly — and know which aggregations are safe to shard and which give wrong answers.
- Sidestep the traps that kill naive pipelines: OOM from unbounded keys,
/tmptmpfs spills, locale-slow sorts, andtail -fgoing deaf on rotation.
Why Naive Pipelines Die at Terabyte Scale
The classic Unix pipeline:
cat huge.log | grep ERROR | awk '{print $7}' | sort | uniq -c | sort -rn | head
Breaks at scale for three reasons:
catreads the entire file into memory pages it doesn’t need.sortis O(N log N) in time and O(N) in memory (or external-memory disk thrash).uniq -crequires sorted input — meaning sort already did the heavy work.
For a 500 GB log this pipeline either OOMs, fills /tmp (which sort uses for spill files), or runs for 6+ hours. The discipline of scale-friendly log analysis is streaming aggregation: process each line exactly once, aggregate in memory only the distinct keys (which is bounded by cardinality, not data volume), and emit the result.
This lesson teaches four patterns:
| Pattern | When | Memory | CPU |
|---|---|---|---|
| Streaming awk | Single host, fits in RAM by cardinality | O(distinct keys) | Single-core, I/O bound |
| GNU parallel | Single host, CPU-bound parsing | O(workers × cardinality) | All cores |
| SSH fan-out map-reduce | Multiple hosts, files on each | O(host cardinality) per node | Distributed |
| External-memory sort | Cardinality itself doesn’t fit | O(disk) | Disk-bound |
Pattern 1: Streaming awk Aggregation
awk has built-in associative arrays. This single property makes it the right tool for ~80% of log-analysis tasks. The pattern:
awk '{ count[$7]++ } END { for (k in count) print count[k], k }' access.log \
  | sort -rn | head -20
What this does:
- For each line, increment
count[<7th field>](typically the URL path in nginx combined log format). - At end-of-input, iterate the associative array and emit
<count> <key>. - Sort numerically descending, take top 20.
Memory used is bounded by the number of distinct URLs, not the log size. A site with 10,000 distinct URLs on a 500 GB log uses ~1 MB of awk memory. The same query with sort | uniq -c would need 500 GB of /tmp space.
Why awk’s Associative Arrays Are So Fast
awk’s hash tables are written in C and tuned for line-oriented data. Combined with mawk (the fastest awk implementation), throughput often exceeds 500 MB/s on a single core — faster than grep -c for many patterns because grep has to advance regex state machine, while awk just hashes a field.
Quick benchmark on a 10 GB nginx log (numbers representative — your hardware and log will differ):
mawk    aggregation:   18 sec
gawk    aggregation:   42 sec
busybox aggregation: aborted at 5 min
Always install mawk on log-analysis hosts (apt install mawk). On most distros, awk is a symlink — point it to mawk if performance matters:
update-alternatives --set awk /usr/bin/mawk
The Three awk Implementations
| Implementation | Speed | Features | Default on |
|---|---|---|---|
| gawk | Baseline | Most features (gensub, time funcs) | Most distros |
| mawk | 3-10× faster | Fewer features, no gensub |
Some Debian variants |
| busybox awk | 10× slower than gawk | Minimal | Alpine, embedded |
If your script uses gensub, mktime, strftime, or --posix flags, you need gawk. For pure aggregation pipelines, mawk is the correct choice.
Real-World Streaming awk Patterns
Top 20 slowest endpoints (by mean response time):
awk '{
  url = $7
  rt = $NF             # last field is request_time
  sum[url] += rt
  count[url]++
} END {
  for (u in sum) printf "%.3f %d %s\n", sum[u]/count[u], count[u], u
}' access.log | sort -rn | head -20
The printf "%.3f %d %s" formats numerically so sort -rn works correctly — never use print with floats because sort may treat scientific notation inconsistently.
HTTP status code time-series (per minute):
awk '{
  match($4, /\[([0-9]+\/[A-Za-z]+\/[0-9]+:[0-9]+:[0-9]+)/, m)
  bucket = m[1]   # YYYY-MM-DDTHH:MM truncated
  code = $9
  ts[bucket "|" code]++
} END {
  for (k in ts) {
    split(k, a, "|")
    print a[1], a[2], ts[k]
  }
}' access.log | sort
This produces a flat time-series suitable for piping into Grafana via the textfile collector or feeding to gnuplot. (The three-argument match(string, regex, arr) that captures groups into m is a gawk extension — on mawk or BSD/onetrueawk, use two-argument match() with substr($0, RSTART, RLENGTH), or split $4 on the : and [ characters. More on that portability wrinkle in Going deeper.)
5xx error spike detector (alerting from cron):
errors=$(awk '$9 ~ /^5/ {c++} END {print c+0}' /var/log/nginx/access.log)
if (( errors > 100 )); then
  curl -X POST "$ALERTMANAGER_URL/api/v1/alerts" \
    -d "[{\"labels\":{\"alertname\":\"5xxSpike\",\"value\":\"$errors\"}}]"
fi
The c+0 trick forces c to be numeric even if no errors were found (otherwise it’d print empty string).
Pattern 2: GNU parallel for CPU-Bound Map
When the work per line is heavy (regex compilation, JSON parsing, network lookup), single-core awk becomes the bottleneck. GNU parallel farms work across cores:
# Parse 1000 logs in parallel, 8 workers
ls /var/log/nginx/access-*.gz | parallel -j8 \
  'zcat {} | awk "/ERROR/ {c++} END {print FILENAME, c+0}"'
The -j8 is workers; {} is the input filename; each invocation is independent. parallel batches work and prints results in order (or unordered with -k flag).
Map-Reduce in One Pipeline
For aggregation across many files, the pattern is:
- Map: each file → partial aggregation (key → count).
- Reduce: merge partial aggregations → global aggregation.
ls /var/log/nginx/access-*.gz | parallel -j8 \
  'zcat {} | awk "{ count[\$7]++ } END { for (k in count) print count[k], k }"' \
  | awk '{ count[$2] += $1 } END { for (k in count) print count[k], k }' \
  | sort -rn | head -20
Stage 1 (parallel) outputs partial counts per file. Stage 2 (single awk) sums across files — note this stage is small because input is already partial-aggregated. The key insight: the reduce step’s input size is O(workers × distinct keys), not O(total log size).
parallel vs xargs
xargs -P N does parallel execution too, but lacks parallel’s:
- Per-job timeout (
--timeout). - Output buffering and ordering (
-k). - Job retry (
--retries). - ETA progress (
--eta). - Job control (
--halt).
For one-shot parallel maps, xargs -P is fine. For long-running production pipelines, parallel is worth the install.
parallel Throttling for Production
When running parallel against a database or external API, you must throttle:
# At most 4 jobs at a time, with 100ms gap between job starts
parallel -j4 --delay 0.1 './query-api.sh {}' :::: hosts.txt

# Limit by load average — pause if loadavg > 8
parallel -j4 --load 8 './heavy-job.sh {}' :::: inputs.txt

# Auto-tune to leave 2 cores free
parallel -j-2 './job.sh {}' :::: inputs.txt
The -j-2 (negative) is “all cores except 2” — useful for keeping the box responsive.
Pattern 3: Distributed Map-Reduce via SSH Fan-Out
When logs live on dozens of hosts (fleet of web servers), the pattern is:
- ssh-fan-out to run the map on each host (work happens locally, network only carries aggregated output).
- Reduce the per-host outputs centrally.
#!/usr/bin/env bash
# fleet-top-urls.sh — get top URLs across the entire web fleet
set -euo pipefail

readonly HOSTS="$(cat /etc/web-hosts.txt)"

# Map: each host runs awk locally, returns partial aggregation
for host in $HOSTS; do
  ssh -o ConnectTimeout=5 -o BatchMode=yes "$host" \
    "awk '{ c[\$7]++ } END { for (k in c) print c[k], k }' /var/log/nginx/access.log" \
    > "/tmp/fleet-map.$host" &
done
wait

# Reduce: merge per-host outputs
cat /tmp/fleet-map.* \
  | awk '{ c[$2] += $1 } END { for (k in c) print c[k], k }' \
  | sort -rn | head -20

rm /tmp/fleet-map.*
The ssh -o BatchMode=yes is critical — it prevents SSH from prompting for passwords if key auth fails, which would hang the script. The ConnectTimeout=5 bounds the wait for unreachable hosts.
Production-Grade Fan-Out With pdsh or parallel
For >20 hosts the bash loop above becomes slow and lacks failure handling. Use parallel with the --sshlogin flag:
parallel --sshlogin "@/etc/web-hosts.txt" \
  "awk '{ c[\$7]++ } END { for (k in c) print c[k], k }' /var/log/nginx/access.log" \
  | awk '{ c[$2] += $1 } END { for (k in c) print c[k], k }' \
  | sort -rn | head -20
--sshlogin @file reads hostnames from a file and runs each command remotely. parallel handles connection pooling, retries, and ordering.
Or pdsh (Parallel Distributed Shell)
pdsh is the heavyweight option, originally from LLNL clusters:
pdsh -w "$(cat /etc/web-hosts.txt | paste -sd,)" \
  "awk '{ c[\$7]++ } END { for (k in c) print c[k], k }' /var/log/nginx/access.log" \
  | awk -F: '{ c[$2] += $1 } END { for (k in c) print c[k], k }' \
  | sort -rn | head -20
pdsh prefixes each output line with hostname: which the reducer must strip via -F:. parallel doesn’t prefix unless you ask for it.
Pattern 4: External-Memory Sort When Cardinality Itself Doesn’t Fit
Sometimes the distinct keys themselves don’t fit in RAM — e.g., a per-user-id aggregation across a billion users. The streaming-awk pattern fails.
The answer is sort with explicit external-memory tuning:
# Sort with 4GB memory budget, 4-way parallel merge, /var/tmp for spill
awk '{ print $4, $7 }' huge.log \
  | sort --buffer-size=4G --parallel=4 -T /var/tmp \
  | uniq -c \
  | sort -rn \
  | head -20
Critical flags:
--buffer-size=4G— how much RAMsortmay use before spilling to disk. Default is ~1 GB on most systems; bumping it reduces spill files.--parallel=4— number of parallel sort threads.-T /var/tmp— spill directory. Critical:/tmpis often tmpfs (RAM-backed!) and small./var/tmpis real disk and persists across reboot, which is what you want for big sorts.- For ASCII-only data, set
LC_ALL=C— locale-aware sort is 5-10× slower:
LC_ALL=C sort --buffer-size=4G ...
When to Use External Sort vs. awk
| Situation | Use awk | Use external sort |
|---|---|---|
| Distinct keys < 10M | ✓ | |
| Distinct keys 10M-1B | ? (depends on RAM) | ✓ |
| Need ordering, not just counts | ✓ | |
| Heavy parsing per line | awk + parallel | sort + parallel |
The rule of thumb: streaming awk for aggregation, external sort for ordering. They’re complementary, not competing.
Parsing Common Log Formats: nginx, JSON & jq
Aggregation is only as good as your field extraction. Two formats cover the vast majority of what you’ll meet, and each has a right and a wrong way to parse it.
nginx / Apache “combined” format
The default nginx combined log line looks like this:
1.2.3.4 - - [10/Jan/2025:10:00:01 +0000] "GET /users/12 HTTP/1.1" 200 512 "-" "curl/8.0" 0.011
Because fields are space-separated, plain awk whitespace-splitting gives you a clean field map — as long as you remember the request line is quoted, so "GET, /users/12, and HTTP/1.1" land in three separate fields:
| Field | Meaning | Field | Meaning |
|---|---|---|---|
$1 |
client IP (remote_addr) |
$8 |
HTTP version (HTTP/1.1") |
$4 $5 |
[time_local +0000] |
$9 |
status code |
$6 |
method ("GET) |
$10 |
bytes sent |
$7 |
URL path | $NF |
request_time if you log it last |
The trap: the User-Agent contains spaces (Mozilla/5.0 (X11; Linux ...)), so you can not field-split it with the default separator. If you need the UA, either match it with a regex (it’s inside the last-but-two quoted field) or set FS to the double-quote character and take the quoted segments. For the common cases — count by URL, status, IP, or response time — whitespace splitting on $1/$7/$9/$NF is exactly right.
request_time is not logged by default. Add it to your log_format so $NF carries it:
log_format timed '$remote_addr - $remote_user [$time_local] '
                 '"$request" $status $body_bytes_sent '
                 '"$http_referer" "$http_user_agent" $request_time';
JSON logs: extract with jq, aggregate with awk
Structured (JSON) logging is now the norm for application logs. Each line is one JSON object — the JSON Lines / ndjson convention:
{"ts":"2025-01-10T10:00:01Z","level":"info","path":"/users/12","status":200,"rt":0.011}
{"ts":"2025-01-10T10:00:02Z","level":"error","path":"/login","status":503,"rt":0.007}
You can not reliably field-split JSON with awk — quoting, escaping, and key order make it a losing game. Use jq to extract the fields you need, then hand them to awk to aggregate. This hybrid is the workhorse pattern for JSON logs:
# Mean response time per path, top 20 slowest — jq extracts, awk aggregates
jq -r '[.path, (.status|tostring), (.rt|tostring)] | @tsv' app.jsonl \
  | awk -F'\t' '{ c[$1]++; sum[$1]+=$3 }
                END { for (p in c) printf "%.3f %d %s\n", sum[p]/c[p], c[p], p }' \
  | sort -rn | head -20
Why split the work? Because jq streams one object per line by default, so it stays O(1) in memory, and awk does the aggregation in O(distinct keys). Simple filters are pure jq:
# Count by status code
jq -r '.status' app.jsonl | sort | uniq -c | sort -rn

# Only the 5xx paths
jq -r 'select(.status >= 500) | .path' app.jsonl | sort | uniq -c | sort -rn
The one JSON footgun to memorize: jq -s (slurp) and jq 'group_by(...)' read the entire file into an array before doing anything — memory O(file size). That’s fine for a 10 MB log and fatal for a 50 GB one:
# DO NOT do this on a large file — -s slurps the whole log into RAM
jq -rs 'group_by(.level)[] | "\(.[0].level) \(length)"' app.jsonl
For big JSON logs, keep jq in its default per-line streaming mode and let awk (or sort | uniq -c) do the grouping. The rule mirrors the whole lesson: stream to extract, aggregate the distinct keys — never slurp.
Percentiles and Histograms in awk
A mean is a lie for latency. If 99% of requests take 20 ms and 1% take 4 seconds, the mean is ~60 ms — a number no real user ever experienced, and it completely hides the outage that 1% is living through. What you want is percentiles (p50/p95/p99) and a histogram of the shape. Both are doable in the shell.
Exact percentiles: extract, sort, index
The straightforward way: pull the numeric column, sort it numerically, and pick the value at the percentile index.
# p50 / p95 / p99 of request_time (last field of nginx timed log)
awk '{ print $NF }' access.log | sort -n | awk '
  { v[NR] = $1 }
  END {
    n = NR
    printf "n=%d  p50=%.3f  p95=%.3f  p99=%.3f  max=%.3f\n", \
      n, v[int(0.50*n+0.999)], v[int(0.95*n+0.999)], v[int(0.99*n+0.999)], v[n]
  }'
Representative output on a small sample:
n=8 p50=0.051 p95=1.870 p99=1.870 max=1.870
The +0.999 is a cheap ceiling so int() rounds the index up to a valid 1-based slot. This is exact, but the final awk holds every value in v[], so memory is O(N) — fine for one shard or a day’s worth of one endpoint, not for a raw 500 GB stream. (gawk users can sort inside awk with asort(); the pipe-to-sort -n form above is the portable version that works on any awk.)
Streaming histogram: O(buckets) memory, no sort
When you can’t afford to hold every value, bucket them. A fixed set of buckets uses a fixed amount of memory regardless of input size — true streaming — and a histogram is usually more useful than a bare percentile anyway because it shows the shape:
awk '{
  rt = $NF
  if      (rt < 0.01) b = "<10ms"
  else if (rt < 0.1)  b = "10-100ms"
  else if (rt < 1)    b = "100ms-1s"
  else                b = ">=1s"
  h[b]++
} END {
  order[1]="<10ms"; order[2]="10-100ms"; order[3]="100ms-1s"; order[4]=">=1s"
  for (i = 1; i <= 4; i++) {
    c = h[order[i]] + 0
    bar = ""; for (j = 0; j < c; j++) bar = bar "#"
    printf "%-10s %4d  %s\n", order[i], c, bar
  }
}' access.log
Representative output:
<10ms         2  ##
10-100ms      2  ##
100ms-1s      3  ###
>=1s          1  #
Scale the bar (c/1000 etc.) for real volumes so it fits your terminal. Because the buckets are fixed, this runs in constant memory over a terabyte log — the histogram is the shell-native answer when the exact-sort approach won’t fit. (For true mergeable streaming percentiles across shards, the real-world tools are t-digest and HdrHistogram; a fixed-bucket histogram is the good-enough approximation you can build in one line of awk.)
Slow Query Log Reduction: A Real-World Case Study
Postgres slow query logs and MySQL slow query logs are the canonical “fits in awk” workload. The classic tool pgBadger is a 5000-line Perl script that does what you can do in 50 lines of awk.
#!/usr/bin/awk -f
# pg-slowlog-reduce.awk — reduce Postgres CSV log to top-N slow queries
BEGIN { FS = "," }
/duration:/ {
  # Extract duration in ms
  match($0, /duration: ([0-9.]+) ms/, m)
  d = m[1]

  # Normalize the query — strip literal numbers and quoted strings
  q = $0
  gsub(/'\''[^'\'']*'\''/, "'\''?'\''", q)
  gsub(/[0-9]+/, "?", q)

  # Hash by normalized query
  total[q] += d
  count[q]++
  if (d > max[q]) max[q] = d
}
END {
  for (q in total) {
    printf "%.0f total_ms / %d calls / %.0f max_ms — %s\n", \
           total[q], count[q], max[q], substr(q, 1, 80)
  }
}
Run with:
awk -f pg-slowlog-reduce.awk /var/log/postgresql/postgres.log \
  | sort -rn | head -20
Normalization is the magic: gsub(/[0-9]+/, "?") collapses WHERE id=123 and WHERE id=456 into the same shape WHERE id=?, so they aggregate. Without normalization, every query would be unique and the analysis is useless.
The same pattern works for nginx URL aggregation (collapse /users/123 → /users/?):
awk '{
  url = $7
  gsub(/\/[0-9]+/, "/?", url)
  c[url]++
} END {
  for (u in c) print c[u], u
}' access.log | sort -rn | head -20
The Drop-In lib/loganalyze.sh
# lib/loganalyze.sh — sourced helpers for log analysis pipelines.
#
# Depends on mawk (preferred) or gawk.

set -o errexit -o nounset -o pipefail

la_log() { printf '[%s] [loganalyze] %s\n' "$(date -Iseconds)" "$*"; }

# Detect best awk
la_awk_path() {
  if command -v mawk >/dev/null; then echo mawk
  elif command -v gawk >/dev/null; then echo gawk
  else echo awk
  fi
}

# Top-N URL aggregator (nginx combined format).
# Args: file, n
la_top_urls() {
  local file="$1" n="${2:-20}"
  local awk_bin
  awk_bin=$(la_awk_path)

  if [[ "$file" == *.gz ]]; then
    zcat "$file"
  elif [[ "$file" == *.zst ]]; then
    zstd -d -c "$file"
  else
    cat "$file"
  fi | "$awk_bin" '{
    url = $7
    gsub(/\/[0-9]+/, "/?", url)
    c[url]++
  } END {
    for (u in c) print c[u], u
  }' | sort -rn | head -"$n"
}

# Mean and p99 response time per URL. Requires nginx with $request_time as last field.
la_response_time_stats() {
  local file="$1" n="${2:-20}"
  local awk_bin
  awk_bin=$(la_awk_path)

  cat "$file" | "$awk_bin" '{
    url = $7; rt = $NF
    gsub(/\/[0-9]+/, "/?", url)
    sum[url] += rt
    count[url]++
    n = count[url]
    times[url, n] = rt
  } END {
    for (u in sum) {
      mean = sum[u] / count[u]
      # Approximate p99: sort the recorded times for this URL
      n = count[u]
      delete arr
      for (i = 1; i <= n; i++) arr[i] = times[u, i]
      asort(arr)
      p99 = arr[int(n * 0.99)]
      printf "%.3f %.3f %d %s\n", mean, p99, n, u
    }
  }' | sort -rn -k2 | head -"$n"
}

# 5xx counter for alerting. Args: file. Returns count to stdout.
la_5xx_count() {
  local file="$1"
  awk '$9 ~ /^5/ {c++} END {print c+0}' "$file"
}

# Top error patterns from generic log file. Looks for ERROR/WARN/FATAL prefixes.
# Args: file, n
la_top_errors() {
  local file="$1" n="${2:-20}"
  awk '/(ERROR|WARN|FATAL|CRITICAL)/ {
    # Strip timestamp + thread/PID. Keep last 200 chars.
    msg = substr($0, length($0) > 200 ? length($0) - 199 : 1)
    # Normalize numbers
    gsub(/[0-9]+/, "?", msg)
    c[msg]++
  } END {
    for (m in c) print c[m], m
  }' "$file" | sort -rn | head -"$n"
}

# Distributed top-URLs across a fleet. Args: hosts_file, log_path, n
la_fleet_top_urls() {
  local hosts="$1" log="$2" n="${3:-20}"
  local tmpdir
  tmpdir=$(mktemp -d)
  trap "rm -rf '$tmpdir'" RETURN

  while read -r host; do
    [[ -z "$host" || "$host" =~ ^# ]] && continue
    ssh -o ConnectTimeout=5 -o BatchMode=yes "$host" \
      "awk '{ gsub(/\/[0-9]+/,\"/?\",\$7); c[\$7]++ } END { for(k in c) print c[k],k }' $log" \
      > "$tmpdir/$host" &
  done < "$hosts"
  wait

  cat "$tmpdir"/* \
    | awk '{ c[$2] += $1 } END { for (k in c) print c[k], k }' \
    | sort -rn | head -"$n"
}

# Slow query reducer for Postgres CSV log. Args: file, n
la_pg_slow_queries() {
  local file="$1" n="${2:-20}"
  awk '/duration:/ {
    match($0, /duration: ([0-9.]+) ms/, m)
    d = m[1]
    q = $0
    gsub(/\047[^\047]*\047/, "?", q)
    gsub(/[0-9]+/, "?", q)
    total[q] += d; count[q]++
    if (d > max[q]) max[q] = d
  } END {
    for (q in total) {
      printf "%.0f %d %.0f %s\n", total[q], count[q], max[q], substr(q,1,120)
    }
  }' "$file" | sort -rn | head -"$n"
}
Note \047 — the octal escape for a single quote. Embedding ' inside a single-quoted bash heredoc with awk gets ugly fast; \047 sidesteps the quoting nightmare.
Two gawk-only calls live in this library on purpose, because it’s for Linux log hosts where gawk (or mawk) is available: the three-argument match($0, /.../, m) and asort(arr). On a stock BSD/macOS awk those don’t exist — see Going deeper for the portable rewrites if you ever need to run these on a Mac.
Using the Library
#!/usr/bin/env bash
source /usr/local/lib/loganalyze.sh

# Top 20 URLs from yesterday's compressed log
la_top_urls /var/log/nginx/access.log.1.gz 20

# Alert on 5xx spike
errors=$(la_5xx_count /var/log/nginx/access.log)
if (( errors > 1000 )); then
  /usr/local/bin/alert "5xx spike: $errors"
fi

# Fleet-wide top URLs
la_fleet_top_urls /etc/web-hosts.txt /var/log/nginx/access.log 50

# Postgres slow queries from last hour
journalctl -u postgresql --since '1 hour ago' --no-pager > /tmp/pg-recent.log
la_pg_slow_queries /tmp/pg-recent.log 20
Streaming Real-Time vs. Batch
Everything above is batch (process a file). For real-time tail-and-aggregate, the pattern is:
# Keep a rolling 60-second 5xx window
tail -F /var/log/nginx/access.log \
  | awk '
    BEGIN { window = 60 }
    {
      now = systime()
      if ($9 ~ /^5/) {
        events[++idx] = now
      }
      # Emit count of events in last 60s
      count = 0
      for (i in events) if (events[i] >= now - window) count++
      if (NR % 100 == 0) print "5xx in last 60s:", count
    }
  '
Real-time has its own footguns: tail -F (capital F) re-opens on rotation; tail -f (lowercase) silently dies after rotation. Always use -F for production tailers.
For higher-throughput streaming, the right tool is usually Vector, Fluent Bit, or Logstash — but for ad-hoc investigation, tail -F | awk is unbeatable.
Heads-up (fixed in Going deeper): the rolling-window snippet above never deletes old entries from
events[], so on a busy endpoint that array grows without bound and the innerforloop re-scans every event on every line — O(n²). It’s fine for a quick look; the Going deeper section shows the bounded, per-second-bucket version you’d actually leave running.
The 8 Footguns
1. cat huge.log | grep Instead of grep huge.log
cat is the redundant first stage. grep already takes a filename. Fix: grep PATTERN huge.log. (Useless Use of Cat — UUOC — is a real category at scale.)
2. sort | uniq -c for Aggregation
Already covered — uses external sort for what awk does in O(distinct keys). Fix: awk '{c[$1]++} END {for(k in c) print c[k],k}'.
3. Locale-Aware Sort Slowness
LC_ALL=en_US.UTF-8 makes sort 5-10× slower than LC_ALL=C because it does Unicode collation. Fix: Set LC_ALL=C for log analysis (your hostnames and URLs are ASCII).
4. /tmp Tmpfs Filling Up
sort spills to /tmp by default. On systems where /tmp is tmpfs (RAM-backed), a 100GB sort fills RAM and OOMs the machine. Fix: sort -T /var/tmp ... to use real disk.
5. tail -f Instead of tail -F
-f (lowercase) follows by file descriptor. After log rotation, the original FD is to a deleted file; new logs go to a new file the tailer never sees. Fix: tail -F (uppercase) follows by name — re-opens on rotation.
6. awk Memory Blow-Up From Unbounded Cardinality
If the key you’re aggregating on is unbounded (every line is unique — e.g., bucketing by request-id), awk’s hash grows unbounded. Eventually OOMs. Fix: Truncate or hash the key. c[substr($1,1,32)]++ keeps only first 32 chars.
7. parallel With Stateful Workers
If your awk script depends on state across input lines (running totals, monotonic counters), running it in parallel chunks gives wrong answers — each chunk’s awk has separate state. Fix: Either restructure to be stateless (pure aggregation, then merge) or process serially.
8. SSH Fan-Out Without ConnectTimeout
A single dead host stalls the entire fan-out for ~2 minutes (TCP timeout). For 100 hosts, one dead box = 200-minute wait. Fix: Always ssh -o ConnectTimeout=5 -o BatchMode=yes. The BatchMode prevents password prompts from hanging on terminal-less environments.
Going deeper
This is the section for the reader who already writes awk one-liners in their sleep and wants the internals, the edge cases, and the “why” underneath the rules of thumb.
Why streaming actually stays flat in memory
When awk/grep/sort read a file, they pull a fixed-size buffer (tens of KB) at a time, process it, and discard it. Resident memory (RSS) stays flat no matter how big the file is — the OS pages the file through, and pages you’re done with are reclaimed. The instant you write data=$(cat file) or build an awk array that holds every line, you’ve converted an O(1)-memory job into an O(file-size) one. The whole discipline is: touch each byte once, keep only the summary. Cardinality — the count of distinct keys — is the only thing that has to fit in RAM.
The associative array is a hash table, and its keys are strings
c[k]++ is a hash of the string k plus an integer increment — roughly O(1) per line, which is why streaming aggregation beats sort’s O(N log N). Two consequences bite people:
- Keys are always strings.
c["07"]andc["7"]are different buckets. If you bucket on a zero-padded field and a non-padded one, they won’t merge. Force a canonical form (strip or add leading zeros) before using a value as a key. - Float keys are fragile.
c[$NF]where$NFis0.10vs0.1are different keys. Bucket floats into ranges (a histogram) rather than keying on the raw value.
awk portability: gawk vs mawk vs BSD/onetrueawk
The lesson uses two gawk extensions that are not portable: the three-argument match($0, /regex/, m) that captures groups, and asort(). On mawk, busybox awk, and the BSD/onetrueawk that ships on macOS, both are absent. Portable rewrites:
# Instead of: match($0, /duration: ([0-9.]+) ms/, m); d = m[1]
awk '{
  if (match($0, /duration: [0-9.]+ ms/)) {
    seg = substr($0, RSTART, RLENGTH)   # "duration: 12.3 ms"
    n = split(seg, a, /[ ]+/)           # a[2] = "12.3"
    d = a[2] + 0
  }
}'

# Instead of asort(arr) inside awk — pipe the column to sort -n
awk '{print $NF}' access.log | sort -n | awk '{ v[NR]=$1 } END { ... }'
Two-argument match() sets the globals RSTART and RLENGTH; substr() then carves out the matched text. This runs on every awk. Teach and ship the GNU/gawk form on your Linux log hosts (it’s cleaner), but know the fallback exists — this is exactly the kind of gotcha that turns a working script into a silent failure when someone runs it on a Mac laptop.
LC_ALL=C changes speed and meaning
LC_ALL=C isn’t just a 5–10× speedup — it changes behavior. Under a UTF-8 locale, sort orders by Unicode collation rules (locale-specific, culturally aware, slow) and [a-z] in a regex can match accented characters. Under C, everything is byte order: fast, deterministic, ASCII-only. For log analysis on ASCII URLs/IPs that’s exactly what you want, but if your keys contain UTF-8 (usernames, non-ASCII paths) the sort order will differ. Set it deliberately, not cargo-culted.
Decompression is often the real bottleneck
zcat/gunzip are single-threaded, so on a box with 32 cores a zcat huge.gz | awk pipeline is capped by one core doing gunzip. Two fixes: pigz -dc file.gz | awk ... decompresses on multiple cores, or shard across many compressed files with parallel so decompression itself is parallel. zstd (.zst) decompresses several times faster than gzip and is worth adopting for log archives.
Which aggregations are safe to shard — and which lie
Map-reduce across cores/hosts only gives the right answer when your aggregation is mergeable (associative and commutative). Know the two lists cold:
| Mergeable (shard freely) | Not mergeable (sharding gives wrong answers) |
|---|---|
sum, count |
exact distinct count |
min, max |
median / any percentile |
sum of squares → variance/stddev |
mode (needs the global tallies first) |
You can’t sum shard medians to get a global median, and you can’t sum shard distinct-counts to get a global distinct-count (the same user appears on many hosts). For distinct-count at scale the real answer is HyperLogLog (probabilistic, mergeable); for percentiles it’s t-digest/HdrHistogram. In pure shell, the safe move is to shard the raw keys, not the pre-computed statistic — emit key count pairs and merge those, which is mergeable, then compute the percentile centrally.
sort’s external-merge internals
Beyond --buffer-size, --parallel, and -T, two more flags matter at scale: --compress-program=gzip compresses the spill files (trades CPU for disk when /var/tmp is tight), and --stable (-s) preserves input order for equal keys. sort does a classic external merge sort: fill the buffer, sort it, spill a sorted run to -T, repeat, then k-way merge the runs. Bigger --buffer-size = fewer, larger runs = a shallower merge = less disk I/O. The /tmp-is-tmpfs trap (footgun #4) is deadly precisely because those spill runs can be larger than RAM.
The rolling-window tailer, done properly
The real-time snippet earlier leaks: events[++idx] grows forever and the inner loop is O(n²). Bucket by second instead — a fixed, self-pruning structure that’s O(1) per line:
tail -F /var/log/nginx/access.log \
  | awk '
    BEGIN { window = 60 }
    $9 ~ /^5/ {
      now = systime()
      sec[now]++                              # one counter per second
      delete sec[now - window - 1]            # prune the second leaving the window
      total = 0
      for (s in sec) if (s > now - window) total += sec[s]; else delete sec[s]
      print strftime("%T", now), "5xx/60s:", total
    }'
Memory is bounded by window (60 buckets), not by traffic. systime()/strftime() are gawk builtins — on mawk/BSD awk, feed the clock in from the shell or use the log’s own timestamp field.
Security: log lines are untrusted input
A field like $7 (the URL) or the User-Agent is attacker-controlled. Two real risks:
- Log injection / forged lines. A request path containing a newline or fake fields can inject a bogus log line or shift your field positions, poisoning the aggregation. Never
evallog content, always quote when a field flows into another shell command, and treat parsed fields as data, never code. - Sensitive data exposure. Query strings and headers leak tokens, session IDs, emails, and IPs. Be deliberate about what you
printand where you ship it — a “top URLs” report that includes?token=...in the key has just copied secrets into your dashboard. Normalize/strip query strings (gsub(/\?.*/, "", url)) before aggregating unless you specifically need them.
Practice challenges
Work these in order — they escalate from a one-liner to a distributed reduce. Build a small sample log first so you can run them locally:
printf '%s\n' \
'1.1.1.1 - - [10/Jan/2025:10:00:01 +0000] "GET /users/12 HTTP/1.1" 200 512 "-" "c" 0.011' \
'1.1.1.2 - - [10/Jan/2025:10:00:02 +0000] "GET /users/34 HTTP/1.1" 500 12 "-" "c" 0.004' \
'1.1.1.1 - - [10/Jan/2025:10:01:03 +0000] "GET /login HTTP/1.1"    200 900 "-" "c" 0.051' \
'1.1.1.3 - - [10/Jan/2025:10:01:04 +0000] "GET /login HTTP/1.1"    503 0   "-" "c" 0.007' \
'1.1.1.1 - - [10/Jan/2025:10:01:05 +0000] "GET /search HTTP/1.1"   200 1200 "-" "c" 1.870' > sample.log
1. (Beginner) Top 10 client IPs by request count. From sample.log, print each client IP and how many requests it made, busiest first.
<details> <summary>Solution</summary>
awk '{ c[$1]++ } END { for (k in c) print c[k], k }' sample.log | sort -rn | head -10
Why: field $1 is remote_addr; the associative array counts in one streaming pass, O(distinct IPs) memory. sort -rn | head gives the top-N.
</details>
2. (Beginner) Count 4xx and 5xx separately in a single pass. One read of the file, two numbers out.
<details> <summary>Solution</summary>
awk '$9 ~ /^4/ {f++} $9 ~ /^5/ {v++} END {print "4xx", f+0; print "5xx", v+0}' sample.log
Why: two independent pattern-action rules run on every line; f+0/v+0 force a numeric 0 instead of an empty string when a class never appears.
</details>
3. (Intermediate) Requests-per-minute time-series. Bucket by minute (drop the seconds) and print minute count, chronological.
<details> <summary>Solution</summary>
awk '{ t=$4; sub(/^\[/,"",t); sub(/:[0-9][0-9]$/,"",t); c[t]++ }
     END { for (m in c) print m, c[m] }' sample.log | sort
Why: $4 is [10/Jan/2025:10:00:01; strip the leading [ and the trailing :SS to get a per-minute key. Aggregate, then sort to restore time order (the log’s own timestamp, not wall-clock).
</details>
4. (Intermediate) Mean response time per path from a JSON log. Given app.jsonl (one JSON object per line with .path and .rt), print the 10 slowest paths by mean rt.
<details> <summary>Solution</summary>
jq -r '[.path, (.rt|tostring)] | @tsv' app.jsonl \
  | awk -F'\t' '{ s[$1]+=$2; c[$1]++ }
                END { for (p in s) printf "%.3f %d %s\n", s[p]/c[p], c[p], p }' \
  | sort -rn | head -10
Why: jq streams one object per line to extract the fields (O(1) memory), and awk aggregates in O(distinct paths). Never jq -s/group_by a big log — that slurps the whole file into RAM.
</details>
5. (Advanced) p95 request_time without holding the whole file in awk. Report an approximate p95 of $NF using a fixed-memory structure, and say why you didn’t just sort everything.
<details> <summary>Solution</summary>
# Streaming histogram → O(buckets) memory, independent of log size
awk '{
  b=int($NF/0.05)                 # 50ms buckets
  h[b]++; n++; if (b>maxb) maxb=b
} END {
  target=0.95*n; cum=0
  for (i=0; i<=maxb; i++) {
    cum += h[i]
    if (cum >= target) { printf "p95 ~ %.2f-%.2f s\n", i*0.05, (i+1)*0.05; break }
  }
}' sample.log
Why: an exact percentile needs every value sorted (O(N) memory via sort -n), which won’t fit a terabyte stream. Fixed-width buckets give O(buckets) memory and a p95 accurate to the bucket width — the shell-native approximation. (Widen/narrow the 0.05 bucket to trade memory for precision.)
</details>
6. (Advanced) Fleet top-URLs that survives a dead host. Run the URL map on three hosts, one of which is unreachable, without stalling the whole run, then reduce to a global top-20.
<details> <summary>Solution</summary>
for host in web1 web2 web-DEAD; do
  ssh -o ConnectTimeout=5 -o BatchMode=yes "$host" \
    "awk '{gsub(/\/[0-9]+/,\"/?\",\$7); c[\$7]++} END{for(k in c) print c[k],k}' /var/log/nginx/access.log" \
    > "/tmp/map.$host" 2>/dev/null &
done
wait
cat /tmp/map.* | awk '{ c[$2]+=$1 } END { for (k in c) print c[k], k }' | sort -rn | head -20
rm -f /tmp/map.*
Why: ConnectTimeout=5 caps the wait on the dead host to 5s instead of a ~2-minute TCP timeout; BatchMode=yes stops a hung password prompt. Each host maps locally (only small partial counts cross the network), and the central awk merge is mergeable because it’s a pure sum. For >20 hosts, swap the loop for parallel --sshlogin @hosts.txt.
</details>
Common beginner mistakes
These are the conceptual traps — the wrong mental model — as opposed to the operational footguns above.
-
“A bigger log needs more memory.” No. Streaming-aggregation memory is
O(distinct keys), completely independent of file size. A 5 TB log with 10,000 distinct URLs uses the same ~1 MB as a 5 GB one. Size drives time, not memory. Memory is driven by cardinality. -
“
awkis just for printing columns.”awk '{print $7}'is 1% of whatawkis. It’s a streaming hash-table aggregation engine —c[k]++,sum[k]+=$n, group-by on composite keys — and that’s why it replaces most ofpgBadger/GoAccess for ad-hoc work. -
“
sort | uniq -cis how you count things.” It’s the O(N log N)-on-disk way that spills to/tmp.awk '{c[$1]++}'counts in one streaming pass with O(distinct keys) memory. Reach forsort | uniq -conly when you also need the values ordered, not merely counted. -
“jq can replace awk for big JSON logs.” For extraction, yes; for aggregation at scale, no —
jq -s/group_byslurp the whole file into RAM. The scalable pattern isjq(extract, streaming) →awk(aggregate, bounded). -
“The mean latency tells me how users feel.” Means hide the tail. A 40 ms mean with a 3 s p99 means 1% of requests — often your most important users, on the biggest pages — are having a terrible time. Always look at p95/p99 and the histogram shape.
-
“More parallel workers = faster.” Past core count you just thrash the scheduler. Worse: sharding a non-mergeable aggregation (median, exact distinct-count) across workers gives a wrong answer, not merely a slow one. Shard raw keys and merge sums; never merge pre-computed medians.
-
“
tail -fwill follow my log forever.” Not across rotation.-ffollows the file descriptor and goes deaf the momentlogrotatemoves the file;-Ffollows the name and re-opens. Every long-running tailer must use-F.
Glossary
- Streaming aggregation — processing each input line exactly once and keeping only a running summary, so memory stays flat regardless of input size. The central idea of this lesson.
- Associative array —
awk’s hash-table variable (c["/login"]++). Keys are arbitrary strings; the array holds only distinct keys. - Cardinality — the number of distinct keys. This — not file size — is what has to fit in RAM for streaming aggregation.
- Map-reduce — split work into independent per-shard aggregations (map), then combine the partial results (reduce). Here: map with
parallel/ssh, reduce with one moreawkpass. - Reduce / merge — the step that sums the partial arrays from each worker or host into a global result. Only correct for mergeable aggregations.
- Mergeable aggregation — one that’s associative and commutative so shard results combine correctly:
sum,count,min,max,sum-of-squares. Not mergeable: median/percentiles, exact distinct-count, mode. - Top-N — the
... | sort -rn | head -Ntail that turns a full aggregation into the N biggest entries. - Percentile (p50/p95/p99) — the value below which that % of observations fall. p99 latency = “99% of requests were at least this fast.” Far more honest than a mean for tail-sensitive metrics.
- Histogram — counts of observations falling into fixed value-buckets. Computable in O(buckets) memory — the streaming way to see a distribution’s shape.
- External-memory sort —
sortspilling sorted runs to disk (-T) and merging them, used when data exceeds RAM. Tuned with--buffer-size,--parallel,--compress-program. - Spill file — a temporary sorted run
sortwrites to its temp dir when the in-memory buffer fills. Lands in-T(use/var/tmp, real disk — not tmpfs/tmp). LC_ALL=C— forces the byte-order “C” locale, skipping Unicode collation. 5–10× fastersort/awk/grepon ASCII data; also changes sort order and regex character-class meaning.- mawk / gawk / busybox awk — the three common
awkimplementations. mawk: fastest, fewest features. gawk: richest (gensub,mktime,asort, 3-argmatch), slower. busybox: tiny and slow (embedded/Alpine). - nginx combined format — the default access-log layout:
ip - - [time] "request" status bytes "referer" "ua". Whitespace-splittable on$1/$7/$9/$NF. - JSON Lines (ndjson) — one JSON object per line. The standard structured-log format; extract fields with
jq, aggregate withawk. jq— a streaming JSON processor. Per-line by default (O(1) memory);-s/group_byslurp the whole input (O(file size)) — avoid on big logs.- GNU
parallel— a job runner that fans commands across cores (-j) and hosts (--sshlogin), with retries, timeouts, ordering, and ETA. xargs -P— the lightweight, always-installed way to run N jobs at once. Lacksparallel’s retry/ordering/ETA niceties.- SSH fan-out — running the map command on each fleet host over
sshso only small aggregated results cross the network, then reducing centrally. BatchMode=yes/ConnectTimeout=5— the twosshoptions that make fan-out safe: no interactive password prompt to hang on, and a bounded wait so one dead host can’t stall the run.tail -F— follow a log by name, re-opening after rotation.tail -f(lowercase) follows the file descriptor and misses everything after a rotate.- Normalization — collapsing variable parts of a key so related lines aggregate:
gsub(/\/[0-9]+/,"/?")turns/users/123and/users/456into/users/?. Without it, every line is unique and aggregation is useless. request_time— nginx’s per-request duration (seconds). Not logged by default; add$request_timetolog_formatso it lands in$NF.- OOM — out-of-memory kill. Here caused by unbounded cardinality (a per-request-id key) or a
sortbuffer//tmptmpfs blowout. - tmpfs — a RAM-backed filesystem often mounted at
/tmp. Deadly forsortspills, which can exceed RAM. Pointsort -Tat real disk (/var/tmp). - UUOC — “Useless Use of Cat”:
cat file | grepwheregrep filewould do. Harmless on tiny files, a real redundant read at terabyte scale.
Quick-Reference Card
STREAMING AGGREGATION (single host)
  awk '{c[$KEY]++} END {for(k in c) print c[k],k}' | sort -rn | head
  Memory: O(distinct keys), not O(file size)

awk PERFORMANCE
  mawk:    fastest, fewer features
  gawk:    most features (gensub, mktime), slower
  busybox: 10× slower, embedded only
  Set LC_ALL=C for ASCII data → 5-10× speedup

PARALLEL (multi-core, single host)
  ls files | parallel -j8 'zcat {} | awk ... '
  Then merge with another awk pass
  -j-2 = "all cores minus 2", --load 8 = pause if loadavg > 8

SSH FAN-OUT (multi-host)
  parallel --sshlogin @hosts.txt 'awk ... /var/log/...'
  Always: ssh -o ConnectTimeout=5 -o BatchMode=yes
  Map locally on each host, reduce centrally

EXTERNAL SORT (cardinality > RAM)
  sort --buffer-size=4G --parallel=4 -T /var/tmp
  LC_ALL=C for ASCII → 5-10× speedup

JSON LOGS (extract with jq, aggregate with awk)
  jq -r '[.path,(.rt|tostring)]|@tsv' log.jsonl \
    | awk -F'\t' '{s[$1]+=$2;c[$1]++} END{...}'
  NEVER jq -s / group_by a big log → slurps whole file

PERCENTILES & HISTOGRAM
  exact:  awk '{print $NF}' | sort -n | awk '{v[NR]=$1} END{print v[int(0.95*NR+0.999)]}'
  stream: bucket $NF into fixed ranges → O(buckets) memory

NORMALIZATION (the magic for log aggregation)
  gsub(/\/[0-9]+/, "/?")   → /users/123 → /users/?
  gsub(/[0-9]+/, "?")      → strip all numerics
  gsub(/'[^']*'/, "?")     → strip quoted strings (SQL params)
  gsub(/\?.*/, "")         → strip query string (drops secrets from keys)

MERGEABLE across shards?  sum count min max ✓   median distinct mode ✗

REAL-TIME
  tail -F (capital F!) for rotation safety
  Pipe to awk with a per-second bucketed window (prune old buckets)
What’s Next
You can now extract signal from terabyte-scale logs. The next step is to act on that signal: build self-healing scripts that detect a problem (high 5xx rate, queue depth above threshold, stuck process), decide whether to remediate, and act with bounded blast-radius — without becoming the cause of the next incident through a runaway loop.
In the next lesson — Self-Healing Scripts: Detect-Decide-Act Loops, Blast-Radius Limits & Circuit Breakers — we’ll build lib/heal.sh covering detect/decide/act loops, circuit breakers that stop after N consecutive failures, blast-radius limits (“never restart more than 1 host per minute”), the dry-run discipline before any auto-remediation goes live, and the audit log every healer must write so post-incident review can answer “why did the healer do that?”