At 02:14 your checkout service starts returning 500s, and nobody knows for eleven minutes — until a customer tweets. The graphs existed; the alarm did not. Or the alarm existed but sat in INSUFFICIENT_DATA all night because the metric stopped and nobody told it what “no data” means. Or it fired forty times in an hour, so everyone muted the channel two weeks ago. Amazon CloudWatch is the service that turns “something feels slow” into a number, a threshold, and a page — and doing that well is a real skill, not a checkbox. Most teams have CloudWatch turned on and still miss outages, because they never learned the parts that actually decide whether you get woken up: percentiles, evaluation windows, missing-data handling, and the difference between a metric you can alarm on and one you can’t.
CloudWatch is AWS’s built-in observability service, and it has three pillars you will live in daily. Metrics are ordered time-series of numbers — CPU, latency, queue depth, your own business counters — each pinned to a namespace and a set of dimensions. Alarms watch a metric (or a math expression over several) and change state when it crosses a threshold, then fire actions — notify an SNS topic, scale an Auto Scaling group, stop or reboot an instance, open a Systems Manager OpsItem. Dashboards are the shared glass wall of widgets your team stares at during an incident. Around those three sit Logs, Logs Insights, Events (EventBridge), the CloudWatch agent, Synthetics, RUM and Contributor Insights — but metrics, alarms and dashboards are the load-bearing 80%, and this article is a hands-on tour of exactly those.
By the end you will have published your own custom metric with put-metric-data, learned the cheaper Embedded Metric Format (EMF) path for high-cardinality data, written a metric-math expression, and built a p99 latency alarm that only fires when 3 of the last 5 minutes breach — with TreatMissingData set so a dead metric doesn’t hide the outage — wired to an SNS topic, all with both the aws CLI and Terraform, then a dashboard, then a clean teardown. After that comes a symptom → cause → confirm → fix troubleshooting playbook for the dozen ways CloudWatch quietly does nothing. Read the prose once; keep the tables open the next time an alarm lies to you.
What problem this solves
Running anything in the cloud without metrics is flying with the instruments taped over. You cannot answer “is it slow?”, “is it slower than yesterday?”, “how many users saw an error?”, or “should we scale out?” — and you certainly cannot answer them at 2 a.m. before a customer does. The pain is not “we have no data”; AWS emits mountains of it for free. The pain is that raw data is not an answer: a CPU graph nobody looks at prevents zero outages, and an alarm that fires on every transient blip trains your team to ignore the one that matters. Alert fatigue — muting a noisy channel and then missing the real page — is a leading cause of long incidents, and it is an engineering failure, not a discipline failure. It comes from alarms built without evaluation windows, without missing-data handling, and without composition to collapse a storm of child alarms into one signal.
The second failure is subtler: the metric you need often does not exist by default. EC2 never publishes guest memory or disk-used % — the hypervisor cannot see inside your OS — so a box thrashing at 99% RAM shows a calm CPU graph and no alarm until it OOM-kills your process. Your application’s real health lives in numbers AWS has never heard of: orders per minute, cache hit ratio, p99 checkout latency, queue age. Nobody publishes those but you. And when you do publish them, small mistakes — the wrong namespace, a mistyped dimension, the wrong region, or a pre-aggregated statistic set that makes percentiles impossible — mean your metric silently does not appear or your alarm silently cannot be built.
Who hits this: literally everyone running workloads on AWS, but it bites hardest in three roles. Ops/SRE need alarms that page correctly and dashboards that shorten an incident. Developers need custom and business metrics and need to alarm on error rate, not error count. Architects and exam candidates (CLF-C02, SAA-C03, SOA-C02, DVA-C02) get tested on exactly the mechanics that trip people up — periods vs resolution, M-of-N, TreatMissingData, anomaly and composite alarms, and which action a threshold can drive. Here is the whole surface on one screen, with the classic beginner trap attached to each piece:
| Piece | What it is | You create it with | The beginner trap |
|---|---|---|---|
| Namespace | A container that groups metrics | Chosen at publish time (AWS/… or your own) |
Publishing to AWS/… (reserved) or a typo’d custom namespace |
| Metric | A named time-series of datapoints | Auto-created on first PutMetricData |
Expecting it instantly; new metrics take a minute to list |
| Dimension | A name/value pair that scopes a metric | Part of the metric identity | A different dimension set is a different metric |
| Statistic | How datapoints in a period aggregate | Chosen at read/alarm time | Alarming on Average when p99 is the real story |
| Percentile | p90/p99 of the distribution | ExtendedStatistic |
Impossible on a pre-aggregated StatisticSet |
| Period | The aggregation bucket width | Set on the alarm/graph | Confusing period (bucket) with resolution (granularity) |
| Resolution | Standard 60 s vs high-res 1 s | StorageResolution on publish |
High-res everywhere → surprise bill |
| Custom metric | A number only you know | put-metric-data or EMF |
Wrong region/namespace → “it’s not showing up” |
| Metric math | Expressions over metrics | --metrics / metric_query |
A SEARCH() returns many series; can’t alarm directly |
| Alarm | State machine over a metric | put-metric-alarm |
No M-of-N → it flaps on every blip |
| TreatMissingData | What “no data” means | Alarm attribute | Default missing → stuck INSUFFICIENT_DATA |
| Composite alarm | AND/OR over child alarms | put-composite-alarm |
Not used → a storm of 40 child pages |
| Alarm action | What a state change triggers | SNS / ASG / EC2 / SSM ARN | Alarm red, nothing happened (unconfirmed SNS) |
| Dashboard | Shared widget board | put-dashboard (JSON) |
Blank widget = wrong region/dimension |
| CloudWatch agent | Publishes mem/disk from EC2 | Installed on the box | Expecting memory metrics without it |
Learning objectives
By the end of this article you can:
- Describe a metric precisely — namespace + name + dimensions — and explain why each unique dimension set is a separate metric that you pay for and must match exactly to query.
- Choose the right statistic (Average, Sum, Minimum, Maximum, SampleCount) and percentile (p90/p99, trimmed mean) for a question, and know when a percentile is impossible.
- Distinguish period (aggregation bucket) from resolution (standard 60 s vs high-resolution 1 s), and recall the retention/rollup schedule that ages data from 1 s to 15 months.
- Publish custom metrics two ways —
PutMetricData(value, StatisticSet, or Values/Counts) and the Embedded Metric Format for cheap high-cardinality — and pick the right one. - Write metric-math expressions using
SUM,RATE,DIFF,FILL,SEARCHandANOMALY_DETECTION_BAND, and know which expressions you can and cannot put an alarm on. - Build a threshold alarm end to end: comparison operator, evaluation periods and datapoints-to-alarm (M-of-N),
TreatMissingData, the three states, and anomaly and composite alarms to cut noise. - Wire alarm actions — SNS, EC2 Auto Scaling, EC2 stop/terminate/reboot/recover, SSM OpsItem — to the correct state, and confirm they actually fired.
- Assemble a dashboard of metric/text/log/alarm widgets with variables and cross-region sources, install the CloudWatch agent for EC2 memory/disk, and run a symptom → fix troubleshooting playbook.
Prerequisites & where this fits
You need an AWS account with permission to call cloudwatch:*, sns:* and (for the anomaly/agent bits) ssm:* in a personal or sandbox account — never straight into production. Install and configure the AWS CLI v2 (aws configure or aws sso login) and, for the IaC half, Terraform ≥ 1.5 with the aws provider. You should be comfortable reading JSON and running a shell; you do not need prior CloudWatch experience. Everything in the lab fits inside the always-free CloudWatch tier — 10 custom metrics, 10 alarms, 1 million API requests, 3 dashboards — so the running cost is effectively ₹0. The only line items that could bill a few paise are high-resolution metrics or a fourth dashboard, and the lab uses neither; the teardown removes the alarms and dashboard, and custom metrics simply age out.
Where this sits: CloudWatch is the observability substrate under every other AWS service you run. Metrics and alarms feed EC2 Auto Scaling (an alarm is what actually triggers a step-scaling policy), so pair this with EC2 Auto Scaling Hands-On: Launch Templates, Scaling Policies & Instance Refresh. The other half of CloudWatch — logs — has its own hands-on companion in the wave’s CloudWatch Logs Insights querying article; reach for it when your signal lives in log lines, not numbers (and note that EMF in this article is the bridge between the two). When an alarm should fire and doesn’t, the wave’s dedicated CloudWatch alarm-not-triggering troubleshooting article is the deep playbook this one points to. And when a single number can’t explain why a request is slow across five services, that is a job for tracing — see the wave’s X-Ray distributed tracing hands-on. This article is the metrics-alarms-dashboards core those four orbit.
A quick map of who owns what, so when CloudWatch “does nothing” you look in the right place first:
| Layer | What lives here | Who owns it | What it can cause |
|---|---|---|---|
| Source | EC2/RDS/ELB/Lambda + the agent + your app | AWS + you | No memory metric (no agent); metric in the wrong region |
| Publish | PutMetricData / EMF / metric filters |
You | Wrong namespace/dimension/region → “not showing up” |
| Metric store | Namespaces, dimensions, resolution, rollup | AWS (CloudWatch) | Percentile impossible on a StatisticSet; data aged out |
| Read/transform | Statistics + metric math | You (at query time) | SEARCH() can’t be alarmed; math syntax errors |
| Alarm | Threshold, M-of-N, missing-data, composite | You | Flapping; stuck INSUFFICIENT_DATA; no page |
| Action | SNS / ASG / EC2 / SSM | You | Alarm red but nothing happened (unconfirmed sub) |
| View | Dashboards + widgets | You | Blank widget (region/dimension mismatch) |
Core concepts
CloudWatch has more surfaces than most people realise, and knowing which one owns your problem saves hours. The table below is the whole family; this article lives in the top three rows, and the rest are one-line orientation so you know where to go next.
| Surface | What it stores/does | Unit of work | Where it fits |
|---|---|---|---|
| Metrics | Numeric time-series | A datapoint (value, timestamp, unit) | This article — the core |
| Alarms | State machine over a metric/expression | A state change → action | This article — the page |
| Dashboards | Shared widget boards | A widget (JSON) | This article — the glass wall |
| Logs | Raw text/JSON log events | A log event in a stream/group | Sibling: Logs Insights |
| Logs Insights | Query language over logs | A query returning fields | Sibling: Logs Insights |
| Events / EventBridge | Event bus + rules | An event matched to a target | Event-driven wiring |
| CloudWatch agent | Publishes host metrics/logs from EC2/on-prem | mem/disk/procs + logs | This article — EC2 mem/disk |
| Synthetics | Scripted canaries probing endpoints | A canary run + metric | Uptime from outside |
| RUM | Real-user browser telemetry | A page-load beacon | Front-end performance |
| Contributor Insights | Top-N contributors from logs/metrics | A rule → contributor ranking | “Who is the noisy tenant?” |
| ServiceLens / X-Ray | Traces + service map | A trace segment | Sibling: X-Ray tracing |
| Application Signals | Auto SLOs/golden signals for apps | An SLO over a service | Higher-level app health |
The anatomy of a metric
A metric is not just “a number.” It is uniquely identified by three things, and if any of them differs you are looking at a different metric. Get this model right and 80% of “my metric isn’t showing up” evaporates.
| Part | What it is | Example | Notes / gotcha |
|---|---|---|---|
| Namespace | Top-level container | AWS/EC2, KloudVin/App |
AWS/* is reserved — you can’t publish into it |
| Metric name | The thing measured | CPUUtilization, RequestLatency |
Case-sensitive |
| Dimensions | Name/value pairs scoping it | InstanceId=i-0abc, Service=checkout |
Up to 30 per metric; the set is part of identity |
| Value | The measurement | 187.0 |
A double; can be negative |
| Timestamp | When it happened | 2026-07-14T02:14:00Z |
Up to 2 weeks in the past, 2 h in the future |
| Unit | The measure’s unit | Milliseconds, Count, Percent |
Metadata only — CloudWatch never converts |
| StorageResolution | 60 s (standard) or 1 s (high-res) | 1 |
Set at publish; drives cost and retention |
The identity rule catches everyone: publishing RequestLatency with Service=checkout and later with Service=checkout,Env=prod creates two metrics, and a graph or alarm on one shows nothing from the other. Every unique combination of namespace + name + the full dimension set is a distinct, separately-billed custom metric. That is powerful (you can slice by any dimension) and dangerous (high-cardinality dimensions like CustomerId explode your metric count and bill) — which is exactly the problem EMF solves later.
Metrics: namespaces, dimensions, statistics and resolution
Namespaces — where metrics live
Every AWS service publishes into a reserved AWS/<service> namespace; your own metrics go into any namespace you name (convention: Company/App). You never mix the two — AWS/* is read-only to you. Knowing the common AWS namespaces tells you what is available for free before you write a single custom metric.
| Namespace | Service | Notable metrics (default) | Notably absent |
|---|---|---|---|
AWS/EC2 |
EC2 instances | CPUUtilization, NetworkIn/Out, StatusCheckFailed* |
Memory, disk-used % (need the agent) |
AWS/EBS |
EBS volumes | VolumeReadOps, VolumeQueueLength, BurstBalance |
Filesystem free space |
AWS/ApplicationELB |
ALB | RequestCount, TargetResponseTime, HTTPCode_Target_5XX_Count |
Per-URL latency |
AWS/NetworkELB |
NLB | ActiveFlowCount, ProcessedBytes, TCP_*_Reset_Count |
HTTP status (L4 only) |
AWS/RDS |
RDS/Aurora | CPUUtilization, DatabaseConnections, FreeableMemory, ReadLatency |
Query-level detail (need PI) |
AWS/Lambda |
Lambda | Invocations, Errors, Duration, Throttles, ConcurrentExecutions |
Per-request business metrics |
AWS/SQS |
SQS queues | ApproximateNumberOfMessagesVisible, ApproximateAgeOfOldestMessage |
— |
AWS/DynamoDB |
DynamoDB | ConsumedRead/WriteCapacityUnits, ThrottledRequests, SuccessfulRequestLatency |
— |
AWS/S3 |
S3 (daily storage; request metrics opt-in) | BucketSizeBytes, NumberOfObjects |
Per-request unless enabled |
AWS/ApiGateway |
API Gateway | Count, 4XXError, 5XXError, Latency, IntegrationLatency |
— |
AWS/AutoScaling |
ASG | GroupInServiceInstances, GroupDesiredCapacity |
— |
AWS/Billing |
Estimated charges (us-east-1 only) | EstimatedCharges |
Only in us-east-1 |
CWAgent |
The CloudWatch agent | mem_used_percent, disk_used_percent, swap_used_percent |
Whatever you don’t configure |
Dimensions — the scope, and the cardinality trap
Dimensions let you ask “latency for the checkout service in prod” instead of one blurred average. But every distinct combination is its own metric and its own line on the bill. The rule of thumb: dimensions should be low-cardinality (service, environment, region, instance) — never unbounded IDs.
| Dimension design | Cardinality | Cost impact | Verdict |
|---|---|---|---|
Service, Env |
Handful | Tiny | Ideal — slice by team-owned axes |
InstanceId |
Tens–hundreds | Moderate | Fine for fleets you can bound |
AvailabilityZone, Region |
Single digits | Tiny | Ideal |
StatusCode (2xx/4xx/5xx) |
~5 | Tiny | Ideal |
CustomerId, RequestId, UserId |
Unbounded | Explodes | Never a dimension — use EMF context instead |
| No dimensions | 1 | Tiny | OK for a single global counter |
You publish dimensions as part of the datapoint; you must repeat the exact set to query. list-metrics --namespace KloudVin/App shows every metric-and-dimension combination that exists, which is the fastest way to spot a typo that forked a metric.
Statistics — how datapoints collapse into a graph
CloudWatch stores individual datapoints, but a graph or alarm shows one value per period, computed by a statistic. Choosing the statistic is the analysis: Average hides the bad tail, Maximum shows the worst single datapoint, and p99 shows the experience of your unluckiest 1% of requests — usually the number that matters for latency.
| Statistic | What it computes over the period | Best for | Trap |
|---|---|---|---|
Average |
Mean of datapoints | Utilisation trends (CPU) | Hides spikes and the tail |
Sum |
Total of datapoints | Counts (requests, errors, bytes) | Meaningless for gauges like CPU% |
Minimum |
Smallest datapoint | Floor (min free memory) | Ignores the bad majority |
Maximum |
Largest datapoint | Worst-case (max latency, queue age) | One outlier dominates |
SampleCount |
Number of datapoints | Throughput / how many samples | Not the metric’s value |
p90 / p99 / p99.9 |
Percentile of the distribution | Latency SLOs | Needs raw data (not a StatisticSet) |
pXX.X (any) |
Arbitrary percentile | Custom SLOs | Same raw-data requirement |
tmNN (trimmed mean) |
Mean after trimming extremes | Stable average ignoring outliers | Advanced; not on all metrics |
wmNN (Winsorized mean) |
Mean with extremes clamped | Outlier-robust average | Advanced |
PR(a:b) (percentile rank) |
% of samples in a range | “What % were < 200 ms?” | Advanced |
TC(a:b) (trimmed count) |
Count within a range | Bounded counting | Advanced |
IQM |
Interquartile mean (middle 50%) | Robust central tendency | Advanced |
For latency, p99 is almost always the right alarm statistic and Average is almost always wrong: a service can hold a 40 ms average while 1% of users wait 3 seconds. But percentiles have a hard prerequisite — CloudWatch needs the individual values to compute them. AWS metrics that support percentiles (ALB TargetResponseTime, EC2 CPUUtilization, RDS latencies) store them; a custom metric only supports percentiles if you publish raw values (or Values/Counts arrays). Publish a pre-aggregated StatisticSet and p99 returns nothing forever — the most common “why is my percentile blank?” cause.
Periods and resolution — the two knobs people conflate
Period and resolution sound alike and are not. Resolution is how finely CloudWatch stores the data — the smallest bucket a datapoint can occupy. Period is how you aggregate those stored datapoints when you graph or alarm. You choose resolution once, at publish time; you choose period every time you read.
| Concept | What it controls | Values | Set where | Cost/behaviour |
|---|---|---|---|---|
| StorageResolution | Storage granularity | 60 (standard) or 1 (high-res) |
Publish (--storage-resolution) |
High-res costs the same per metric but enables sub-minute alarms |
| Standard resolution | 1-minute datapoints | 60 s | Default | Free-tier friendly; most metrics |
| High resolution | 1-second datapoints | 1 s | Custom metrics only | Sub-minute graphs; high-res alarms cost 3× |
| Period (read) | Aggregation bucket | 1, 5, 10, 30 s (high-res) or any multiple of 60 s | Graph/alarm | Bigger period = smoother, fewer datapoints read |
| Detailed monitoring (EC2) | 1-min instead of 5-min AWS metrics | on/off | Instance setting | ~₹175/instance/mo; not the same as the agent |
A high-resolution custom metric can be read at 1/5/10/30-second periods (and 60 s+); a standard metric can only be read at 60 s and above. High-res alarms can use 10 s or 30 s periods and react in seconds — but they are billed at $0.30/alarm-month versus $0.10 for standard, and most workloads never need sub-minute reaction. Reserve high-res for genuinely fast-moving signals (a trading path, a real-time queue), not “to be safe.”
Retention and roll-up — your data ages and blurs
CloudWatch keeps every metric for 15 months, but not at full fidelity. As data ages, it is rolled up into coarser buckets: your 1-second datapoints become 1-minute, then 5-minute, then 1-hour aggregates. Query old data at a fine period and you get nothing — you must ask for a period that still exists at that age.
| Data age | Finest available period | Retained for | Implication |
|---|---|---|---|
| < 3 hours (high-res only) | 1 s | 3 hours | Sub-minute detail vanishes fast |
| ≤ 15 days | 60 s (1 min) | 15 days | Standard metrics at full 1-min |
| ≤ 63 days | 300 s (5 min) | 63 days | 1-min data rolled to 5-min |
| ≤ 455 days | 3600 s (1 h) | 455 days (~15 mo) | Only hourly granularity remains |
| > 455 days | — | Deleted | Export to S3/Timestream for long-term |
Two consequences. First, you cannot “zoom in” on last quarter’s spike to the second — that fidelity is gone; if you need it, ship metrics to long-term storage. Second, an alarm or dashboard that requests a period finer than what exists at that age silently returns no data — set graph periods sensibly for the time range you’re viewing.
Units — labels, not conversions
A datapoint carries a unit as metadata. CloudWatch never converts between units; the unit only labels axes and lets you filter. Publishing Bytes and later reading as Kilobytes does not divide by 1024 — it just fails to match. Use one consistent unit per metric.
| Category | Units |
|---|---|
| Time | Seconds, Microseconds, Milliseconds |
| Data size | Bytes, Kilobytes, Megabytes, Gigabytes, Terabytes |
| Data (bits) | Bits, Kilobits, Megabits, Gigabits, Terabits |
| Rate — data | Bytes/Second, Kilobytes/Second, … Terabits/Second |
| Rate — count | Count/Second |
| Ratio | Percent |
| Count | Count |
| None | None (default when omitted) |
Custom metrics: PutMetricData and the Embedded Metric Format
AWS metrics tell you the infrastructure is healthy; custom metrics tell you the business is. Orders per minute, cache hit ratio, checkout p99, queue-processing lag — nobody publishes those but you, and there are two ways to do it that differ enormously in cost at scale.
PutMetricData — the direct API
PutMetricData is the straight path: call the API (or aws cloudwatch put-metric-data) with a namespace, metric name, dimensions, value and unit. The metric is auto-created on the first successful call. You can send a single value, a StatisticSet (pre-aggregated), or Values + Counts arrays (many values in one call — the recommended high-throughput form because it still supports percentiles).
| Publish form | Fields | Percentiles? | When to use | Gotcha |
|---|---|---|---|---|
| Single value | --value 187 |
Yes (each point is raw) | Low volume, per-event | 1000 metrics/request cap |
| Values + Counts | --values with counts |
Yes | High volume, batched | Best default for throughput |
| StatisticSet | SampleCount,Sum,Min,Max |
No | You already aggregated client-side | Percentiles become impossible |
| High-resolution | any + --storage-resolution 1 |
Yes | Sub-minute signals | 3× alarm cost; 3 h retention |
Key limits to remember: one PutMetricData request carries up to 1,000 metrics and 1 MB (HTTP POST, gzip allowed); timestamps may be up to 2 weeks old or 2 hours in the future; and the API is billed at roughly $0.01 per 1,000 requests — so batching many datapoints per call matters at volume. The classic mistake is calling PutMetricData once per request per metric from a hot path: that is both slow (a synchronous API call in your latency budget) and expensive. Batch, or use EMF.
# One datapoint (auto-creates the metric on first call)
aws cloudwatch put-metric-data \
  --namespace "KloudVin/App" \
  --metric-name RequestLatency \
  --dimensions Service=checkout,Env=prod \
  --unit Milliseconds \
  --value 187

# A high-resolution datapoint (1-second granularity)
aws cloudwatch put-metric-data --namespace "KloudVin/App" \
  --metric-name RequestLatency --dimensions Service=checkout,Env=prod \
  --unit Milliseconds --value 210 --storage-resolution 1

# A pre-aggregated StatisticSet — CHEAP but percentiles become impossible
aws cloudwatch put-metric-data --namespace "KloudVin/App" \
  --metric-name RequestLatency --dimensions Service=checkout,Env=prod \
  --unit Milliseconds \
  --statistic-values SampleCount=100,Sum=21000,Minimum=90,Maximum=560
Embedded Metric Format — cheap high-cardinality from logs
The Embedded Metric Format (EMF) flips the model: instead of calling the metrics API, you write a specially-structured JSON log line to CloudWatch Logs, and CloudWatch extracts metrics from it automatically. The magic is that the log line can carry unlimited high-cardinality context (customer ID, request ID, trace ID) as ordinary fields you can query in Logs Insights, while only the fields you list under _aws.CloudWatchMetrics become billable metrics. You get “metric + full context” in one write, and you never pay for a CustomerId dimension explosion.
| Aspect | PutMetricData |
EMF (log-based) |
|---|---|---|
| How | Synchronous metrics API call | Write a JSON log line to stdout / a log group |
| Cost model | Per custom metric + per API request | Per log ingestion + per defined metric |
| High cardinality | Dangerous (each dim combo billed) | Safe — extra fields stay as log context |
| Percentiles | Yes (raw values) | Yes |
| Latency impact | API call in your path | Just a log write (async) |
| Query the context later | No | Yes — Logs Insights over the same line |
| Best for | Low-volume, infra-adjacent counters | High-volume app metrics with rich context |
An EMF log event looks like this — CloudWatch reads _aws and turns RequestLatency and Errors into metrics under two dimension sets, while RequestId and CustomerId remain queryable context that never becomes a metric:
{
  "_aws": {
    "Timestamp": 1752460800000,
    "CloudWatchMetrics": [
      {
        "Namespace": "KloudVin/App",
        "Dimensions": [["Service"], ["Service", "Env"]],
        "Metrics": [
          { "Name": "RequestLatency", "Unit": "Milliseconds" },
          { "Name": "Errors", "Unit": "Count" }
        ]
      }
    ]
  },
  "Service": "checkout",
  "Env": "prod",
  "RequestId": "b3f1a7c2-9e11-4c7a-8f0e-2a1d",
  "CustomerId": "cus_8841",
  "RequestLatency": 187,
  "Errors": 0
}
| EMF field | Meaning | Notes |
|---|---|---|
_aws.Timestamp |
Epoch millis for the metrics | Required |
_aws.CloudWatchMetrics[] |
One or more metric directives | Each has its own namespace/dims/metrics |
Namespace |
Target namespace | Your custom namespace |
Dimensions |
Array of arrays — each inner array is one dimension set | [["Service"],["Service","Env"]] = two metrics each |
Metrics[] |
{Name, Unit} per metric |
Values pulled from top-level fields |
| Top-level fields | The actual values + free context | Only ones named in Metrics become metrics |
On Lambda you just print EMF JSON to stdout and it is captured; elsewhere the CloudWatch agent, FireLens, or the aws-embedded-metrics libraries emit it. There are more ways to get numbers into CloudWatch than these two — here is the full menu so you pick deliberately:
| Method | Path | High-cardinality-safe | Typical use |
|---|---|---|---|
PutMetricData |
Direct API | No | Infra counters, batch jobs |
| EMF | JSON log → auto-extract | Yes | App metrics with context |
| Metric filter | Pattern over existing logs → metric | N/A | Count “ERROR” lines, extract a field |
| CloudWatch agent | Host mem/disk/procs + StatsD/collectd | Partly | EC2/on-prem system metrics |
| StatsD / collectd | Agent sub-protocols | No | App/agent-emitted metrics |
| AWS service metrics | Emitted automatically | N/A | Free infra metrics |
Metric math: turning raw series into answers
A single raw metric rarely answers the real question. You do not want error count, you want error rate; you do not want bytes, you want bytes/second; you do not want three separate lines, you want their sum. Metric math computes new time-series from existing ones, on the fly, at graph or alarm time — no re-publishing. Each input metric or expression gets an Id (m1, e1), and expressions reference those Ids.
| Function | What it does | Example | Notes |
|---|---|---|---|
+ - * / ^ |
Arithmetic on series | 100*errors/requests |
Error rate % |
SUM([m1,m2]) |
Sum across series | SUM(SEARCH(...)) |
Fleet total |
AVG, MIN, MAX, STDDEV |
Aggregations across series | MAX([m1,m2,m3]) |
Worst of N |
RATE(m1) |
Per-second rate of change | RATE(m1) |
Counter → rate |
DIFF(m1) |
Difference from previous datapoint | DIFF(m1) |
Delta |
DIFF_TIME(m1) |
Seconds between datapoints | — | Gap detection |
FILL(m1, x) |
Fill gaps with a value/LINEAR/REPEAT |
FILL(m1, 0) |
Treat missing as 0 |
METRICS() |
All metrics in the request | SUM(METRICS()) |
Sum everything graphed |
SEARCH(q, stat, period) |
Dynamic multi-series query | SEARCH('{AWS/EC2,InstanceId} CPUUtilization','Average',300) |
Returns many series |
ANOMALY_DETECTION_BAND(m1, n) |
Expected-value band ±n std-dev | ANOMALY_DETECTION_BAND(m1, 2) |
Powers anomaly alarms |
IF(cond, a, b) |
Conditional per datapoint | IF(m1>100, 1, 0) |
Boolean gating |
RUNNING_SUM(m1) |
Cumulative sum | — | Running totals |
PERIOD(m1) |
The metric’s period (s) | m1/PERIOD(m1) |
Sum→rate manually |
REMOVE_EMPTY(...) |
Drop empty series | REMOVE_EMPTY(SEARCH(...)) |
Clean graphs |
SORT, SLICE |
Order/limit series | SLICE(SORT(...,DESC),0,5) |
Top-5 |
ABS, CEIL, FLOOR |
Element-wise math | ABS(DIFF(m1)) |
— |
Three functions carry most of the weight in practice:
FILLdecides what a gap means.FILL(m1, 0)treats missing datapoints as zero — right for a request counter (no data = no requests), wrong for latency (no data ≠ 0 ms). ChoosingFILLcorrectly is the math-side twin ofTreatMissingDataon alarms.RATEand theSum/PERIODtrick convert a counter into a rate.RATE(m1)gives per-second change;m1/PERIOD(m1)turns a per-periodSuminto a per-second rate you can compare across period sizes.ANOMALY_DETECTION_BAND(m1, 2)returns an upper/lower band two standard deviations wide, learned from the metric’s history and seasonality. You graph the band as a shaded envelope and alarm when the metric leaves it — the basis of anomaly alarms below.
Two alarm-time rules bite beginners. First, an alarm’s metric-math expression must return exactly one time-series — so you can alarm on 100*errors/requests (one line) but not directly on a bare SEARCH() (many lines); wrap it in an aggregation like SUM(SEARCH(...)) first. Second, in the --metrics JSON, every raw input you don’t want plotted sets ReturnData: false, and exactly one expression sets ReturnData: true — that is the line the alarm evaluates.
# get-metric-data with a math expression: error-rate % over the last hour
START=$(date -u -v-1H +%Y-%m-%dT%H:%M:%SZ 2>/dev/null || date -u -d '1 hour ago' +%Y-%m-%dT%H:%M:%SZ)
END=$(date -u +%Y-%m-%dT%H:%M:%SZ)
aws cloudwatch get-metric-data --start-time "$START" --end-time "$END" \
  --metric-data-queries '[
    {"Id":"errors","MetricStat":{"Metric":{"Namespace":"KloudVin/App","MetricName":"Errors","Dimensions":[{"Name":"Service","Value":"checkout"}]},"Period":60,"Stat":"Sum"},"ReturnData":false},
    {"Id":"requests","MetricStat":{"Metric":{"Namespace":"KloudVin/App","MetricName":"Requests","Dimensions":[{"Name":"Service","Value":"checkout"}]},"Period":60,"Stat":"Sum"},"ReturnData":false},
    {"Id":"error_rate","Expression":"100*errors/requests","Label":"Error rate %","ReturnData":true}
  ]'
Alarms: thresholds, M-of-N, missing data, and composition
An alarm watches one metric or one math expression and moves between three states, firing actions on each transition. Getting an alarm right is the difference between a page that matters and forty pages that don’t.
The three states
| State | Meaning | Common cause |
|---|---|---|
OK |
The metric is within threshold | Normal operation |
ALARM |
The metric breached per your M-of-N rule | The actual problem — or a bad threshold |
INSUFFICIENT_DATA |
Not enough datapoints to decide | New alarm, stopped metric, wrong dimension, missing-data = missing |
Threshold, comparison operator, and M-of-N
You define a threshold and a comparison operator, then a window: over the last N evaluation periods, if M of them breach, go to ALARM. That M-of-N rule (datapoints-to-alarm out of evaluation-periods) is the single most important anti-flapping tool — 3 of 5 rides out a one-minute blip that 1 of 1 would page on.
| Comparison operator | Fires when metric is… | Use |
|---|---|---|
GreaterThanThreshold |
> threshold | Latency, error rate, queue age |
GreaterThanOrEqualToThreshold |
≥ threshold | Status checks (≥1) |
LessThanThreshold |
< threshold | Free memory, healthy hosts |
LessThanOrEqualToThreshold |
≤ threshold | Throughput floor |
LessThanLowerOrGreaterThanUpperThreshold |
Outside an anomaly band | Anomaly alarms |
GreaterThanUpperThreshold |
Above the band | Anomaly (spike only) |
LessThanLowerThreshold |
Below the band | Anomaly (drop only) |
| Alarm knob | What it controls | Example | Effect |
|---|---|---|---|
--period |
Datapoint width (s) | 60 |
Bucket the metric into 1-min points |
--evaluation-periods (N) |
Window length | 5 |
Look at the last 5 datapoints |
--datapoints-to-alarm (M) |
Breaches needed | 3 |
Fire when 3 of those 5 breach |
--threshold |
The boundary | 250 |
250 ms |
--comparison-operator |
Direction | GreaterThanThreshold |
Above 250 ms |
--statistic / --extended-statistic |
How to aggregate | p99 |
The tail, not the average |
--datapoints-to-alarm < N |
M-of-N | 3/5 |
Anti-flap window |
--evaluate-low-sample-count-percentile |
Percentile with few samples | ignore |
Don’t alarm on 1–2 samples of noise |
TreatMissingData — the setting that decides whether you get paged
When a datapoint is missing (the metric stopped, the box died, traffic dropped to zero), CloudWatch must decide what “no data” means for the alarm. This is TreatMissingData, and the default — missing — is why so many alarms sit in INSUFFICIENT_DATA during the exact outage they were meant to catch.
| Value | Missing datapoints are treated as… | Behaviour | When to use |
|---|---|---|---|
missing (default) |
Neither good nor bad | Missing points don’t count; can end in INSUFFICIENT_DATA |
Rarely what you want for outage detection |
notBreaching |
Good (within threshold) | Gaps push toward OK |
Sparse-but-fine metrics (batch jobs) |
breaching |
Bad (over threshold) | Gaps trigger ALARM |
“No heartbeat = incident” (a stopped metric is the outage) |
ignore |
— | Alarm keeps its current state through gaps | Avoid state churn on flaky metrics |
The teaching example: an alarm on request latency with TreatMissingData=missing will not fire when the service dies and stops emitting latency at all — because there’s no breaching datapoint, only absence, and absence is “neither.” Set it to breaching when a missing metric genuinely means “down,” and the same dead service now pages you. The wave’s CloudWatch alarm-not-triggering troubleshooting article is the deep dive on this exact failure family; treat TreatMissingData as a required decision on every alarm, not a default you skip.
Anomaly-detection alarms
Static thresholds break for metrics with daily/weekly seasonality — 200 orders/min is normal at noon and alarming at 3 a.m. Anomaly detection learns the expected pattern and alarms on deviation. You build a band with ANOMALY_DETECTION_BAND(m1, n) (n = band width in standard deviations, commonly 2) and use a band comparison operator. It needs a couple of weeks of history to train and will be noisy before then.
| Alarm type | Threshold source | Best for | Cost note |
|---|---|---|---|
| Static | A fixed number you set | Clear SLOs (p99 < 250 ms) | 1 alarm |
| Anomaly | A learned band ± n σ | Seasonal metrics, “unusual” | Billed as 3 alarm-metrics |
| Composite | Boolean over other alarms | Noise reduction, root-cause | $0.50/alarm-month |
Composite alarms — collapsing the storm
When one root cause (a database failover) trips twenty child alarms, twenty pages fire and the on-call drowns. A composite alarm evaluates a boolean rule over other alarms’ states and fires once. It is how mature teams turn “40 pages” into “checkout is unhealthy.”
| Composite building block | Syntax | Meaning |
|---|---|---|
ALARM("name") |
Function | True when that child is in ALARM |
OK("name") |
Function | True when that child is OK |
INSUFFICIENT_DATA("name") |
Function | True when that child is INSUFFICIENT_DATA |
AND |
Operator | Both must be true |
OR |
Operator | Either true |
NOT |
Operator | Negate |
( ) |
Grouping | Precedence |
A rule like ALARM(kv-latency-p99) AND ALARM(kv-checkout-error-rate) pages only when both the tail latency and the error rate are bad — a far stronger “customers are actually hurting” signal than either alone. Composite alarms can also suppress their children’s individual actions during a known parent condition (an ActionsSuppressor), so maintenance windows don’t spray noise.
Alarm actions: what a state change actually does
An alarm that only turns red is a dashboard decoration. Actions make it do something, and actions attach per state — --alarm-actions fire on entering ALARM, --ok-actions on returning to OK, --insufficient-data-actions on going blind. Wire recovery to ALARM and the “all clear” to OK.
| Action | ARN shape / target | What it does | Notes |
|---|---|---|---|
| SNS notify | arn:aws:sns:…:topic |
Email/SMS/Slack/Lambda/anything subscribed | Most common; subscription must be confirmed |
| EC2 Auto Scaling | Scaling-policy ARN | Scale the ASG out/in | The link between alarms and autoscaling |
| EC2 stop | arn:aws:automate:<region>:ec2:stop |
Stop the instance | Cost control on idle |
| EC2 terminate | …:ec2:terminate |
Terminate the instance | Ephemeral fleets |
| EC2 reboot | …:ec2:reboot |
Reboot | Self-heal a hung box |
| EC2 recover | …:ec2:recover |
Recover to new hardware | Only on StatusCheckFailed_System, supported types |
| SSM OpsItem | arn:aws:ssm:<region>:<acct>:opsitem:<severity> |
Open an OpsCenter item | Ops workflow integration |
| SSM Incident | arn:aws:ssm-incidents::<acct>:response-plan/<name> |
Start an incident response plan | Incident Manager |
| State-transition list | Fires when the alarm enters… | Typical wiring |
|---|---|---|
AlarmActions |
ALARM |
Page + scale-out + open OpsItem |
OKActions |
OK |
“Resolved” notification |
InsufficientDataActions |
INSUFFICIENT_DATA |
Alert that monitoring itself broke |
# EC2 auto-recovery: reboot-to-new-hardware when the system status check fails
aws cloudwatch put-metric-alarm \
  --alarm-name kv-ec2-recover \
  --namespace AWS/EC2 --metric-name StatusCheckFailed_System \
  --dimensions Name=InstanceId,Value=i-0abc1234def567890 \
  --statistic Maximum --period 60 --evaluation-periods 2 \
  --threshold 1 --comparison-operator GreaterThanOrEqualToThreshold \
  --alarm-actions arn:aws:automate:ap-south-1:ec2:recover
The most common “alarm red but nothing happened” cause is an unconfirmed SNS subscription — the topic exists, the alarm targets it, but the email was never confirmed, so nothing is delivered. describe-alarm-history shows the action fired; the missing link is downstream in SNS.
Dashboards and the CloudWatch agent
Dashboards — the shared glass wall
A dashboard is a JSON document of widgets laid out on a 24-column grid. It is the artifact your team stares at during an incident, so it should show the golden signals (latency, traffic, errors, saturation) at a glance, not 60 sparklines.
| Widget type | Shows | Use |
|---|---|---|
metric (line) |
Time-series lines | Latency, CPU, error rate |
metric (stacked area) |
Stacked series | Traffic by status code |
metric (number) |
Single current value | “Requests/min: 4,210” |
metric (gauge) |
Value against a range | Utilisation dial |
metric (bar/pie) |
Categorical comparison | Errors by service |
text |
Markdown | Titles, runbook links, context |
log |
Logs Insights query results | Recent errors inline |
alarm |
Live alarm status grid | “What’s red right now” |
alarmStatus |
Aggregated alarm health | NOC wall |
custom |
Lambda-rendered HTML/image | Bespoke visuals |
| Dashboard feature | What it does | Why it matters |
|---|---|---|
| Variables | Dropdown that swaps a dimension (Service, InstanceId) |
One dashboard for every service, not one per service |
| Cross-region | Widget pulls metrics from another region | Global view on one board |
| Cross-account | Widget pulls from linked accounts | Central monitoring account |
| Period override | Force a graph period | Consistent granularity |
| Live data | Show the latest, still-incomplete datapoint | Real-time feel (can look jagged) |
| Annotations | Horizontal (threshold) / vertical (deploy) / alarm lines | See “we crossed the line here” |
| Auto dashboards | Per-service dashboards AWS generates | Zero-effort starting point |
The number-one dashboard failure is a blank widget, and it is almost always one of two things: the widget’s region points somewhere the metric doesn’t live, or a dimension value is mistyped so it matches no metric. A dashboard is region-scoped by default; a widget for an ap-south-1 metric on a dashboard you built in us-east-1 draws nothing until you set the widget’s region explicitly.
The CloudWatch agent — memory and disk from EC2
EC2’s built-in metrics come from the hypervisor, which can see CPU, network and status checks but cannot see inside your guest OS — so memory and disk-used % are simply absent. The CloudWatch agent runs on the instance, reads the OS, and publishes those into the CWAgent namespace. If you have ever wondered why there’s no memory graph for your instance, this is why.
| Agent-collected metric | Namespace | What it measures |
|---|---|---|
mem_used_percent |
CWAgent |
RAM in use % |
mem_available |
CWAgent |
Free RAM |
swap_used_percent |
CWAgent |
Swap pressure |
disk_used_percent |
CWAgent |
Filesystem full % (per mount) |
disk_inodes_free |
CWAgent |
Inode exhaustion |
diskio_io_time |
CWAgent |
Disk busy time |
netstat_tcp_established |
CWAgent |
Open TCP connections |
processes_running |
CWAgent |
Runnable processes |
cpu_usage_iowait |
CWAgent |
CPU waiting on I/O |
| StatsD/collectd metrics | CWAgent |
App-emitted metrics |
| Agent config section | Purpose | Key fields |
|---|---|---|
agent |
Global settings | metrics_collection_interval, region, debug |
metrics.namespace |
Where metrics go | Default CWAgent |
metrics.metrics_collected |
What to collect | mem, disk, cpu, net, statsd |
metrics.append_dimensions |
Auto dimensions | InstanceId, AutoScalingGroupName |
metrics.aggregation_dimensions |
Roll-up axes | e.g. by ASG |
logs |
Log collection | Log groups/streams, retention |
You install the agent via SSM (AmazonCloudWatch-ManageAgent / the amazon-cloudwatch-agent package), give the instance role the CloudWatchAgentServerPolicy managed policy, and hand it a config (a local JSON file or an SSM Parameter Store parameter). The agent config wizard (amazon-cloudwatch-agent-config-wizard) generates a starter config. Collect a sensible interval (60 s is plenty for most; 10 s only if you truly need it) — the agent bills as custom metrics, so collecting fifty per box across a big fleet adds up.
Architecture at a glance
The diagram below is the exact pipeline you build in the lab, drawn left to right. On the left, sources emit metrics: an EC2 instance runs the CloudWatch agent (so memory and disk-used % actually exist), and your app publishes custom metrics with PutMetricData and EMF. Those land in CloudWatch Metrics under a namespace and dimensions, at standard 60 s or high-res 1 s resolution. Metric math turns raw series into the numbers you alarm on — a p99 latency line, a RATE, an ANOMALY_DETECTION_BAND. A p99 alarm evaluates that line with M-of-N (3 of 5) and a TreatMissingData policy; a composite alarm ANDs several children to cut noise. On a state change to ALARM, actions fire: an SNS topic notifies humans and an Auto Scaling policy scales out. Everything — the metrics and the live alarm state — rolls up onto a dashboard of metric, log and alarm widgets.
The six numbered badges mark the six places this pipeline quietly fails, and the legend narrates each as symptom · confirm · fix — the same map as the troubleshooting playbook, drawn onto the architecture so you can see where each failure lives.
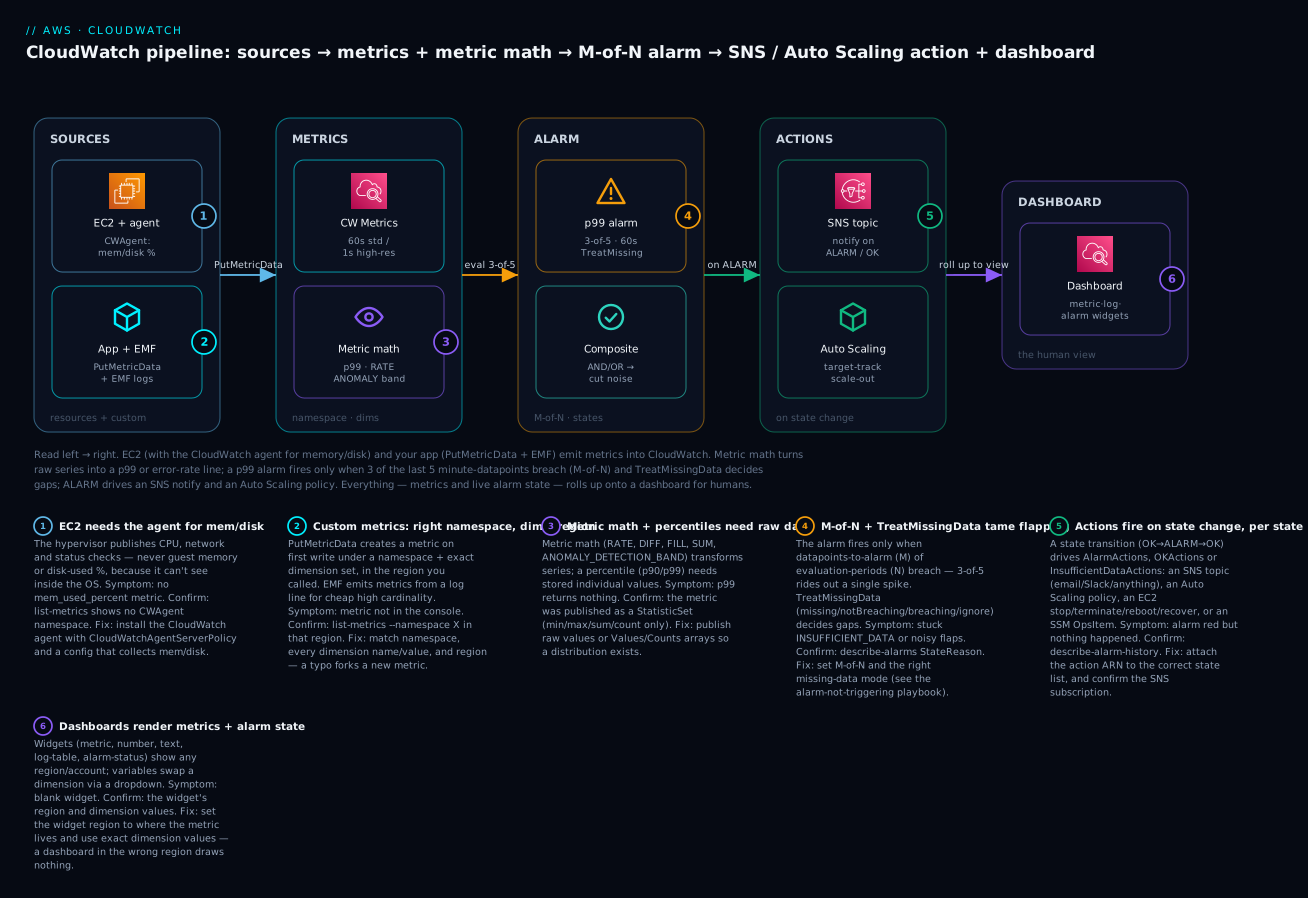
| Badge | Failure class | Lives at | Playbook row |
|---|---|---|---|
| 1 | No memory/disk metric | EC2 without the agent | row 12 |
| 2 | Custom metric not showing | Publish (namespace/dim/region) | rows 1, 2 |
| 3 | Percentile blank / math error | Metric math + stats | rows 3, 4, 5 |
| 4 | Stuck INSUFFICIENT_DATA / flapping | Alarm M-of-N + missing data | rows 6, 7, 8 |
| 5 | Alarm red, nothing happened | Actions + SNS | rows 9, 10 |
| 6 | Blank dashboard widget | Region/dimension | row 11 |
Real-world scenario
KloudMart is a mid-size Indian e-commerce team running checkout on an EC2 Auto Scaling group behind an ALB, with orders written to DynamoDB. Their monitoring “worked” — a CPU dashboard, a CPUUtilization > 80% alarm — right up until a Friday-evening sale, when checkout latency climbed to 4 seconds and conversions cratered for nineteen minutes before anyone noticed. The postmortem found three separate CloudWatch failures stacked on top of each other, and fixing them is a tour of everything in this article.
Failure one: the wrong statistic. The latency alarm watched ALB TargetResponseTime on Average, which sat at a comfortable 180 ms even while p99 hit 4 s — a classic tail hidden by a mean. They rebuilt it on p99 with a GreaterThanThreshold of 250 ms. Because a single slow datapoint shouldn’t page, they set 3-of-5 (datapoints-to-alarm 3, evaluation-periods 5, period 60 s), so it fires on a sustained problem, not a blip.
Failure two: missing-data blindness. During the worst 90 seconds the checkout instances were so saturated they briefly stopped emitting the custom OrdersCompleted metric entirely. The old alarm on that metric used the default TreatMissingData=missing, so the gap read as “neither good nor bad” and the alarm stayed green through the outage. They switched the heartbeat-style alarms to breaching — now silence itself pages, because for a checkout flow no completed orders for two minutes is the incident. They also added an anomaly-detection alarm on OrdersCompleted so a drop from the normal Friday-evening pattern (which a static threshold can’t capture — 400/min is normal at 8 p.m., alarming at 4 a.m.) trips on deviation.
Failure three: alarm-storm and no memory signal. When the group finally scaled, a dozen instance-level alarms and the ALB 5xx alarm all fired at once, so the on-call got sixteen pages in ninety seconds and muted the channel — missing the one that mattered. They wrapped the fleet in a composite alarm (ALARM(checkout-p99) AND ALARM(checkout-5xx)) that pages once with a clear “checkout is unhealthy,” and moved the child alarms to notify-only. Separately, they discovered the instances had been memory-starved, not CPU-bound — but there was no memory metric because the CloudWatch agent was never installed. They rolled the agent out via SSM with CloudWatchAgentServerPolicy, added mem_used_percent and disk_used_percent, and found the real bottleneck.
Two sale-cycles later, the same traffic surge produced one page — the composite alarm — at the 250 ms p99 threshold, ninety seconds in, with a runbook link on the dashboard’s text widget and the Auto Scaling policy already adding capacity off the p99 alarm’s scaling action. Mean-time-to-detect went from nineteen minutes to under two. Nothing here was exotic; it was just CloudWatch used the way this article teaches instead of the way it ships.
Advantages and disadvantages
| Advantages | Disadvantages |
|---|---|
| Native to AWS — every service publishes metrics for free, no agents to deploy | EC2 memory/disk need the agent; not everything is free out of the box |
| Deep IAM, tag, and cross-account/region integration | Query language (Logs Insights) and metric-math syntax are AWS-specific to learn |
| Alarms drive real actions (autoscale, recover, notify) | Percentiles impossible on pre-aggregated StatisticSets |
| Metric math + anomaly + composite = sophisticated alerting without extra tools | High-cardinality via dimensions is costly; you must know to use EMF |
| Generous free tier; pay-per-use beyond it | Custom metrics ($0.30 each) and high-res alarms ($0.30) add up at scale |
| Retention up to 15 months with automatic roll-up | Fine-grained (sub-minute, long-term) data disappears via roll-up |
| One console for metrics, logs, traces, dashboards, alarms | Cross-service dashboards need deliberate region/account setup |
| No infrastructure to run or scale | Less flexible dashboarding than Grafana/third-party for complex viz |
CloudWatch wins decisively when you want zero operational overhead and tight AWS integration — alarms that actually do things, metrics that appear automatically, and one bill. It is a weaker fit when you need rich, cross-cloud dashboards or very high-cardinality analytics; teams at that scale often ship CloudWatch metrics into Grafana or a dedicated observability platform while keeping CloudWatch as the collection and alarm-action layer. For the vast majority of AWS workloads, native CloudWatch done properly is more than enough — and cheaper than it looks if you avoid the high-cardinality and high-res traps.
Hands-on lab
You will publish a custom latency metric, seed it with data, build a metric-math error-rate expression, create a p99 M-of-N alarm with TreatMissingData wired to SNS, add a metric-math alarm and a composite alarm, build a dashboard, trigger the alarm, then tear it all down. Everything fits the free tier. Set your region once — the lab uses ap-south-1 (Mumbai); change it if you prefer.
Step 0 — environment
export AWS_REGION=ap-south-1
export NS="KloudVin/App"
aws sts get-caller-identity   # confirm you're in the right account
Step 1 — create the SNS topic and subscribe
SNS_ARN=$(aws sns create-topic --name kv-cloudwatch-alarms --query TopicArn --output text)
echo "$SNS_ARN"
aws sns subscribe --topic-arn "$SNS_ARN" --protocol email \
  --notification-endpoint you@example.com
# ⚠️ Open the confirmation email and click the link, or NOTHING will be delivered.
aws sns list-subscriptions-by-topic --topic-arn "$SNS_ARN" \
  --query 'Subscriptions[].SubscriptionArn'   # "PendingConfirmation" until you click
Expected: the second command prints an ARN ending in ...:PendingConfirmation until you confirm, then a real subscription ARN.
Step 2 — publish and seed a custom metric
Publish one datapoint, then seed ~20 raw values so percentiles have a distribution to work with (raw values — not a StatisticSet — so p99 is possible):
aws cloudwatch put-metric-data --namespace "$NS" --metric-name RequestLatency \
  --dimensions Service=checkout,Env=prod --unit Milliseconds --value 187

for i in $(seq 1 20); do
  aws cloudwatch put-metric-data --namespace "$NS" --metric-name RequestLatency \
    --dimensions Service=checkout,Env=prod --unit Milliseconds \
    --value $(( (RANDOM % 120) + 120 ))
  # also publish Requests/Errors for the metric-math alarm
  aws cloudwatch put-metric-data --namespace "$NS" --metric-name Requests \
    --dimensions Service=checkout --unit Count --value 1
  [ $((i % 7)) -eq 0 ] && aws cloudwatch put-metric-data --namespace "$NS" \
    --metric-name Errors --dimensions Service=checkout --unit Count --value 1
  sleep 3
done
Step 3 — verify the metric exists (the “not showing up” check)
aws cloudwatch list-metrics --namespace "$NS" \
  --query 'Metrics[].{Name:MetricName,Dims:Dimensions}' --output table
Expected: RequestLatency, Requests and Errors appear with their dimensions. If nothing shows: wait 60 s (new metrics lag), and re-check the namespace spelling and region — the top three causes of an invisible metric.
Step 4 — read it back with a metric-math expression
START=$(date -u -v-1H +%Y-%m-%dT%H:%M:%SZ 2>/dev/null || date -u -d '1 hour ago' +%Y-%m-%dT%H:%M:%SZ)
END=$(date -u +%Y-%m-%dT%H:%M:%SZ)
aws cloudwatch get-metric-data --start-time "$START" --end-time "$END" \
  --metric-data-queries '[
    {"Id":"p99","MetricStat":{"Metric":{"Namespace":"KloudVin/App","MetricName":"RequestLatency","Dimensions":[{"Name":"Service","Value":"checkout"},{"Name":"Env","Value":"prod"}]},"Period":60,"Stat":"p99"}},
    {"Id":"errors","MetricStat":{"Metric":{"Namespace":"KloudVin/App","MetricName":"Errors","Dimensions":[{"Name":"Service","Value":"checkout"}]},"Period":60,"Stat":"Sum"},"ReturnData":false},
    {"Id":"requests","MetricStat":{"Metric":{"Namespace":"KloudVin/App","MetricName":"Requests","Dimensions":[{"Name":"Service","Value":"checkout"}]},"Period":60,"Stat":"Sum"},"ReturnData":false},
    {"Id":"error_rate","Expression":"100*errors/requests","Label":"Error rate %","ReturnData":true}
  ]' --query 'MetricDataResults[].{Id:Id,Values:Values}'
Expected: a p99 series with real millisecond values and an error_rate series in percent. If p99 is empty, you published a StatisticSet somewhere — percentiles need raw values.
Step 5 — create the p99 M-of-N alarm (CLI)
aws cloudwatch put-metric-alarm \
  --alarm-name kv-latency-p99 \
  --alarm-description "checkout p99 latency > 250ms for 3 of 5 minutes" \
  --namespace "$NS" --metric-name RequestLatency \
  --dimensions Name=Service,Value=checkout Name=Env,Value=prod \
  --extended-statistic p99 \
  --period 60 --evaluation-periods 5 --datapoints-to-alarm 3 \
  --threshold 250 --comparison-operator GreaterThanThreshold \
  --treat-missing-data notBreaching \
  --alarm-actions "$SNS_ARN" --ok-actions "$SNS_ARN"
aws cloudwatch describe-alarms --alarm-names kv-latency-p99 \
  --query 'MetricAlarms[0].{State:StateValue,Reason:StateReason}'
Expected: state starts INSUFFICIENT_DATA, then settles to OK once enough datapoints exist.
Step 6 — add a metric-math alarm and a composite alarm
# Error-rate alarm on a math expression (one series → alarmable)
aws cloudwatch put-metric-alarm \
  --alarm-name kv-checkout-error-rate \
  --evaluation-periods 5 --datapoints-to-alarm 3 \
  --threshold 2 --comparison-operator GreaterThanThreshold \
  --treat-missing-data notBreaching \
  --alarm-actions "$SNS_ARN" --ok-actions "$SNS_ARN" \
  --metrics '[
    {"Id":"errors","MetricStat":{"Metric":{"Namespace":"KloudVin/App","MetricName":"Errors","Dimensions":[{"Name":"Service","Value":"checkout"}]},"Period":60,"Stat":"Sum"},"ReturnData":false},
    {"Id":"requests","MetricStat":{"Metric":{"Namespace":"KloudVin/App","MetricName":"Requests","Dimensions":[{"Name":"Service","Value":"checkout"}]},"Period":60,"Stat":"Sum"},"ReturnData":false},
    {"Id":"error_rate","Expression":"100*errors/requests","Label":"Error rate %","ReturnData":true}
  ]'

# Composite: page once only when BOTH are bad
aws cloudwatch put-composite-alarm \
  --alarm-name kv-checkout-unhealthy \
  --alarm-rule "ALARM(kv-latency-p99) AND ALARM(kv-checkout-error-rate)" \
  --alarm-actions "$SNS_ARN"
Step 7 — build the dashboard
aws cloudwatch put-dashboard --dashboard-name kv-checkout --dashboard-body '{
  "widgets": [
    {"type":"text","x":0,"y":0,"width":24,"height":2,
     "properties":{"markdown":"# Checkout — golden signals\nRunbook: https://wiki.internal/checkout"}},
    {"type":"metric","x":0,"y":2,"width":12,"height":6,
     "properties":{"title":"Latency p50/p90/p99 (ms)","region":"ap-south-1","period":60,
       "metrics":[
         ["KloudVin/App","RequestLatency","Service","checkout","Env","prod",{"stat":"p50","label":"p50"}],
         [".",".",".",".",".",".",{"stat":"p90","label":"p90"}],
         [".",".",".",".",".",".",{"stat":"p99","label":"p99"}]
       ]}},
    {"type":"metric","x":12,"y":2,"width":12,"height":6,
     "properties":{"title":"Error rate %","region":"ap-south-1","period":60,
       "metrics":[
         [{"expression":"100*errors/requests","label":"Error rate %","id":"e1"}],
         ["KloudVin/App","Errors","Service","checkout",{"id":"errors","stat":"Sum","visible":false}],
         ["KloudVin/App","Requests","Service","checkout",{"id":"requests","stat":"Sum","visible":false}]
       ]}},
    {"type":"alarm","x":0,"y":8,"width":24,"height":3,
     "properties":{"title":"Checkout alarms",
       "alarms":["arn:aws:cloudwatch:ap-south-1:'"$(aws sts get-caller-identity --query Account --output text)"':alarm:kv-checkout-unhealthy"]}}
  ]
}'
echo "Open: https://ap-south-1.console.aws.amazon.com/cloudwatch/home?region=ap-south-1#dashboards:name=kv-checkout"
Step 8 — trigger the alarm
Push several datapoints above 250 ms so 3 of 5 minutes breach:
for i in $(seq 1 5); do
  aws cloudwatch put-metric-data --namespace "$NS" --metric-name RequestLatency \
    --dimensions Service=checkout,Env=prod --unit Milliseconds --value 600
  sleep 60
done
aws cloudwatch describe-alarms --alarm-names kv-latency-p99 \
  --query 'MetricAlarms[0].StateValue'   # → "ALARM" after ~3 breaching minutes
aws cloudwatch describe-alarm-history --alarm-name kv-latency-p99 \
  --history-item-type StateUpdate --max-records 5 \
  --query 'AlarmHistoryItems[].HistorySummary'
Expected: state flips to ALARM, you get an email (if you confirmed the subscription), and describe-alarm-history shows the transition.
Step 9 — the same stack as Terraform
provider "aws" { region = "ap-south-1" }

resource "aws_sns_topic" "alarms" { name = "kv-cloudwatch-alarms" }

resource "aws_sns_topic_subscription" "email" {
  topic_arn = aws_sns_topic.alarms.arn
  protocol  = "email"
  endpoint  = "you@example.com"   # confirm via the email link
}

resource "aws_cloudwatch_metric_alarm" "latency_p99" {
  alarm_name          = "kv-latency-p99"
  alarm_description   = "checkout p99 latency > 250ms for 3 of 5 minutes"
  namespace           = "KloudVin/App"
  metric_name         = "RequestLatency"
  dimensions          = { Service = "checkout", Env = "prod" }
  extended_statistic  = "p99"
  period              = 60
  evaluation_periods  = 5
  datapoints_to_alarm = 3
  threshold           = 250
  comparison_operator = "GreaterThanThreshold"
  treat_missing_data  = "notBreaching"
  alarm_actions       = [aws_sns_topic.alarms.arn]
  ok_actions          = [aws_sns_topic.alarms.arn]
}

resource "aws_cloudwatch_metric_alarm" "error_rate" {
  alarm_name          = "kv-checkout-error-rate"
  comparison_operator = "GreaterThanThreshold"
  evaluation_periods  = 5
  datapoints_to_alarm = 3
  threshold           = 2
  treat_missing_data  = "notBreaching"
  alarm_actions       = [aws_sns_topic.alarms.arn]
  ok_actions          = [aws_sns_topic.alarms.arn]

  metric_query {
    id          = "error_rate"
    expression  = "100*errors/requests"
    label       = "Error rate %"
    return_data = true
  }
  metric_query {
    id = "errors"
    metric {
      metric_name = "Errors"
      namespace   = "KloudVin/App"
      period      = 60
      stat        = "Sum"
      dimensions  = { Service = "checkout" }
    }
  }
  metric_query {
    id = "requests"
    metric {
      metric_name = "Requests"
      namespace   = "KloudVin/App"
      period      = 60
      stat        = "Sum"
      dimensions  = { Service = "checkout" }
    }
  }
}

# Anomaly-detection alarm on p99 (learns the pattern, alarms on deviation)
resource "aws_cloudwatch_metric_alarm" "latency_anomaly" {
  alarm_name          = "kv-latency-anomaly"
  comparison_operator = "GreaterThanUpperThreshold"
  evaluation_periods  = 5
  datapoints_to_alarm = 3
  threshold_metric_id = "ad1"
  treat_missing_data  = "notBreaching"
  alarm_actions       = [aws_sns_topic.alarms.arn]

  metric_query {
    id          = "ad1"
    expression  = "ANOMALY_DETECTION_BAND(m1, 2)"
    label       = "RequestLatency (expected band)"
    return_data = true
  }
  metric_query {
    id          = "m1"
    return_data = true
    metric {
      metric_name = "RequestLatency"
      namespace   = "KloudVin/App"
      period      = 60
      stat        = "p99"
      dimensions  = { Service = "checkout", Env = "prod" }
    }
  }
}

resource "aws_cloudwatch_composite_alarm" "unhealthy" {
  alarm_name    = "kv-checkout-unhealthy"
  alarm_rule    = "ALARM(${aws_cloudwatch_metric_alarm.latency_p99.alarm_name}) AND ALARM(${aws_cloudwatch_metric_alarm.error_rate.alarm_name})"
  alarm_actions = [aws_sns_topic.alarms.arn]
}

resource "aws_cloudwatch_dashboard" "checkout" {
  dashboard_name = "kv-checkout"
  dashboard_body = jsonencode({
    widgets = [
      { type = "text", x = 0, y = 0, width = 24, height = 2,
        properties = { markdown = "# Checkout — golden signals" } },
      { type = "metric", x = 0, y = 2, width = 12, height = 6,
        properties = {
          title = "Latency p99 (ms)", region = "ap-south-1", period = 60,
          metrics = [["KloudVin/App", "RequestLatency", "Service", "checkout", "Env", "prod", { stat = "p99" }]]
        } }
    ]
  })
}
terraform init && terraform apply
Step 10 — teardown
# CLI resources
aws cloudwatch delete-alarms --alarm-names kv-latency-p99 kv-checkout-error-rate kv-checkout-unhealthy
aws cloudwatch delete-dashboards --dashboard-names kv-checkout
aws sns delete-topic --topic-arn "$SNS_ARN"
# Terraform
terraform destroy
⚠️ Costs: everything above is free-tier (≤10 alarms, ≤3 dashboards, <1M API calls). The anomaly alarm is billed as ~3 alarm-metrics, so delete it if you’re at the free-tier edge. You cannot delete a custom metric — RequestLatency, Requests, Errors simply stop receiving data and age out of the roll-up; you’re only billed for months in which a custom metric receives data.
Common mistakes & troubleshooting
This is the heart of using CloudWatch well. The playbook below is symptom → root cause → confirm (exact command) → fix. When an alarm should fire and doesn’t, the wave’s dedicated CloudWatch alarm-not-triggering troubleshooting article is the extended version of rows 6–8.
| # | Symptom | Root cause | Confirm (exact command / path) | Fix |
|---|---|---|---|---|
| 1 | Custom metric never appears in console | Wrong namespace, dimension, or region | aws cloudwatch list-metrics --namespace KloudVin/App --region ap-south-1 |
Match namespace spelling, exact dimension name/value set, and region of the publish call |
| 2 | Metric shows but is empty on a graph | Querying a different dimension set than published | Compare Dimensions in list-metrics output to your graph query |
Use the exact same dimensions; a superset/subset is a different metric |
| 3 | p99/p90 returns nothing |
Published as a StatisticSet (no raw distribution) | Check how you call put-metric-data — --statistic-values = no percentiles |
Publish raw --values or Values/Counts arrays instead |
| 4 | Alarm won’t create on my expression | SEARCH() or a multi-series math returns many series |
The --metrics expression’s ReturnData:true line isn’t a single series |
Wrap in SUM(...)/AVG(...) so it returns one series |
| 5 | Metric-math error / red expression | Syntax: bad Id ref, mismatched periods, wrong function name | CloudWatch console shows the math error inline; check Ids (m1,e1) |
Fix Id references, align periods, verify function spelling (ANOMALY_DETECTION_BAND, not ANOMALY_BAND) |
| 6 | Alarm stuck in INSUFFICIENT_DATA |
TreatMissingData=missing + sparse/stopped metric |
aws cloudwatch describe-alarms --alarm-names X --query 'MetricAlarms[0].StateReason' |
Set --treat-missing-data breaching (heartbeat) or notBreaching; verify the metric is actually flowing |
| 7 | Alarm never fires during a real outage | Metric stopped and missing-data treated as missing/notBreaching |
get-metric-data shows a gap during the incident window |
Use breaching for heartbeat metrics so silence = ALARM |
| 8 | Alarm flaps (fires and clears constantly) | No M-of-N; single blip trips it | describe-alarm-history shows rapid OK↔ALARM churn |
Set datapoints-to-alarm 3 of evaluation-periods 5; widen period; consider ignore |
| 9 | Alarm is ALARM but no notification |
Unconfirmed SNS subscription, or wrong action list | aws sns list-subscriptions-by-topic shows PendingConfirmation |
Confirm the subscription; ensure the topic ARN is in --alarm-actions |
| 10 | Auto Scaling / EC2 action never runs | Action ARN wrong, or on the wrong state list | describe-alarms --query 'MetricAlarms[0].AlarmActions' |
Put the scaling-policy/automate:...:ec2:* ARN in the correct state list; recover needs StatusCheckFailed_System |
| 11 | Dashboard widget is blank | Widget region/dimension mismatch | Open the widget’s source; check region and dimension values |
Set the widget region to where the metric lives; fix dimension values |
| 12 | No memory/disk metric for EC2 | The CloudWatch agent isn’t installed | list-metrics --namespace CWAgent returns nothing |
Install the agent + CloudWatchAgentServerPolicy; collect mem/disk |
| 13 | Surprise CloudWatch bill | High-resolution metrics/alarms or high-cardinality dimensions | Cost Explorer → CloudWatch; count custom metrics via list-metrics |
Drop to standard resolution; move CustomerId-type context to EMF, not dimensions |
| 14 | Old spike can’t be zoomed to the second | Roll-up: fine data aged out | Query returns coarse points only for old ranges | Accept the retention schedule; export to S3 for long-term fidelity |
Beyond the table, three failures are worth prose because they burn the most hours:
The silent stopped metric. The single nastiest CloudWatch failure is an alarm that stays green through an outage because the metric it watches stopped emitting. With the default TreatMissingData=missing, no datapoints means “no opinion,” so a service that dies and goes quiet never breaches. The fix is a decision, not a setting change: for any metric where absence is the incident (a heartbeat, orders/min, health-check success), set TreatMissingData=breaching. Test it by simply not sending data and confirming the alarm goes red.
The StatisticSet percentile trap. Teams “optimise” custom-metric costs by pre-aggregating client-side and publishing a StatisticSet (SampleCount/Sum/Min/Max) — then discover months later that p99 is permanently blank, because a StatisticSet carries no distribution to compute a percentile from. Once published that way, there is no retroactive fix; you must re-instrument to publish raw values or Values/Counts arrays. If percentiles matter (they do, for latency), never publish that metric as a StatisticSet.
Cardinality cost blowups. A single innocuous change — adding a CustomerId or RequestId dimension to a custom metric — can turn ten metrics into ten million overnight, each billed at $0.30/month, and the bill is the first you hear of it. Keep dimensions low-cardinality (service, env, region, status class) and push unbounded context into EMF log fields, where it stays queryable in Logs Insights without ever becoming a billable metric.
Best practices
| # | Practice | Why |
|---|---|---|
| 1 | Alarm on p99, not Average, for latency |
The mean hides the tail your users actually feel |
| 2 | Always set M-of-N (e.g. 3-of-5) | Rides out single-datapoint blips; the #1 anti-flap tool |
| 3 | Make TreatMissingData a deliberate choice on every alarm |
Default missing hides outages when the metric stops |
| 4 | Use breaching for heartbeat metrics |
Silence = incident for health-critical signals |
| 5 | Wrap alarm storms in composite alarms | One clear page instead of forty; prevents alert fatigue |
| 6 | Push high-cardinality context to EMF, not dimensions | Full context, queryable, without a metric-count explosion |
| 7 | Keep dimensions low-cardinality | Cost and clarity; unbounded IDs blow up both |
| 8 | Reserve high-resolution for genuinely fast signals | 3× alarm cost and 3-hour retention otherwise wasted |
| 9 | Publish raw values if you ever need percentiles | StatisticSets make percentiles impossible forever |
| 10 | Install the CloudWatch agent for memory/disk on every EC2 | The hypervisor can’t see inside your OS |
| 11 | Manage alarms/dashboards as code (Terraform) | Reviewable, repeatable, drift-detectable |
| 12 | Put runbook links in a dashboard text widget | Shortens MTTR — context is right where the incident is |
| 13 | Tag alarms and set clear names (team-service-signal) |
Ownership and searchability at 2 a.m. |
| 14 | Use anomaly detection for seasonal metrics | Static thresholds can’t fit a daily/weekly pattern |
Security notes
CloudWatch is IAM-governed like everything else, and the least-privilege split matters because “who can write metrics” and “who can silence alarms” are very different powers. Publishing metrics needs only cloudwatch:PutMetricData (which, notably, cannot be scoped to a specific namespace by resource — it is all-or-nothing, so treat write access carefully). Reading dashboards is separate from editing them; deleting alarms is a privileged, audited action.
| Concern | Control | Detail |
|---|---|---|
| Publish metrics | cloudwatch:PutMetricData |
Can’t be resource-scoped to a namespace; grant deliberately |
| Read metrics/alarms | cloudwatch:GetMetricData, DescribeAlarms, ListMetrics |
Safe read-only for dashboards |
| Manage alarms | cloudwatch:PutMetricAlarm, DeleteAlarms, SetAlarmState |
Privileged — SetAlarmState can fake a state |
| Manage dashboards | cloudwatch:PutDashboard, DeleteDashboards |
Separate from viewing |
| Agent role | CloudWatchAgentServerPolicy on the instance profile |
Least-priv managed policy for the agent |
| Encryption at rest | AWS-managed by default | Logs (and thus EMF) support KMS CMKs |
| Alarm action targets | SNS topic policy / cross-account | The alarm can only notify topics it’s allowed to |
| Audit | CloudTrail on cloudwatch:* |
Track who muted/deleted an alarm |
| Cross-account | CloudWatch observability access manager (OAM) links | Central monitoring account, read-only sink |
| Metric-stream export | Kinesis Firehose role | Least-priv role for streaming metrics out |
Two security-flavoured gotchas: SetAlarmState lets a principal force an alarm into any state (useful for testing, dangerous in prod — someone can force OK and mask a real problem), so restrict it. And because PutMetricData can’t be namespace-scoped, a compromised writer can pollute any custom namespace with garbage datapoints; monitor for anomalous metric creation and keep write credentials tight. Turn on CloudTrail for CloudWatch management events so a deleted or silenced alarm leaves a trail.
Cost & sizing
CloudWatch is cheap until it isn’t, and the “isn’t” is always one of three things: too many custom metrics (usually from high-cardinality dimensions), high-resolution everything, or a pile of alarms. Here are the levers (us-east-1 list prices; ap-south-1 is similar; ₹ at ~₹85/USD).
| Driver | Price (approx, us-east-1) | ₹ approx | Notes |
|---|---|---|---|
| Custom metric | $0.30/metric/mo (first 10k) | ~₹25 | Tapers: $0.10 (10k–250k), $0.05, $0.02 at volume |
| Standard alarm | $0.10/alarm-mo | ~₹8.5 | Per metric alarm |
| High-resolution alarm | $0.30/alarm-mo | ~₹25 | 3× — only for sub-minute needs |
| Composite alarm | $0.50/alarm-mo | ~₹42 | Cheaper than the pages it prevents |
| Anomaly-detection alarm | ~3× a standard alarm | ~₹25 | Billed as 3 alarm-metrics |
| Dashboard | $3/dashboard/mo (after 3 free) | ~₹255 | Flat per dashboard |
PutMetricData/GetMetricData API |
$0.01 / 1,000 requests (metrics) | ~₹0.85 | Batch to reduce; first 1M free |
| EC2 detailed monitoring | ~$2.10/instance/mo | ~₹178 | 1-min AWS metrics; not the agent |
| Logs ingestion (EMF) | ~$0.50/GB ingested | ~₹42 | EMF cost is log ingestion + defined metrics |
| Free tier (always free) | Amount |
|---|---|
| Custom metrics | 10 |
| Alarms | 10 (standard-resolution) |
| API requests | 1,000,000 |
| Dashboards | 3 (up to 50 metrics) |
| Logs | 5 GB ingest / 5 GB store / 5 GB scan |
Right-sizing rules of thumb: consolidate metrics — a Service dimension across five services is five metrics, not five hundred, so keep dimensions bounded. Use EMF when you want rich context, because you pay log ingestion once and only for the metrics you define, versus a custom metric per dimension combination. Prefer standard resolution and standard alarms unless you have a proven sub-minute need. And remember the biggest cost is not the CloudWatch bill — it is the outage a missing or muted alarm let run for nineteen minutes.
Interview & exam questions
1. What three things uniquely identify a CloudWatch metric? Namespace, metric name, and the full set of dimensions. Any difference — a different dimension, a typo, another region — is a different metric. This is why “my metric isn’t showing up” is usually a namespace/dimension/region mismatch. (CLF-C02, SOA-C02)
2. Difference between period and resolution? Resolution is the storage granularity (standard 60 s vs high-resolution 1 s), set once at publish time via StorageResolution. Period is the aggregation bucket you choose at read/alarm time. High-res metrics can be read at 1/5/10/30 s periods; standard only at 60 s and above. (SOA-C02)
3. Why might a p99 statistic return no data on a custom metric? Because it was published as a StatisticSet (SampleCount/Sum/Min/Max), which carries no distribution. Percentiles need the individual raw values — publish --values or Values/Counts arrays instead. (DVA-C02)
4. Explain M-of-N in an alarm. datapoints-to-alarm (M) out of evaluation-periods (N): the alarm enters ALARM only when M of the last N periods breach. It prevents flapping on a single blip — e.g. 3-of-5 rides out one bad minute but fires on a sustained problem. (SOA-C02)
5. What does TreatMissingData=breaching do and when do you use it? It treats missing datapoints as if they breached the threshold, so gaps push the alarm to ALARM. Use it for heartbeat metrics where absence is the incident — a service that stops emitting orders/min or health-check successes should page. (SOA-C02)
6. Why does an alarm sit in INSUFFICIENT_DATA? Not enough datapoints to evaluate — a brand-new alarm, a stopped/sparse metric, a wrong dimension so it matches nothing, or TreatMissingData=missing with gaps. Confirm with describe-alarms StateReason; fix the data flow or set an appropriate missing-data mode. (SOA-C02)
7. When would you use a composite alarm? To collapse many child alarms into one signal — page once when a boolean rule (e.g. ALARM(a) AND ALARM(b)) is true, instead of forty pages from a single root cause. It’s the primary tool against alert fatigue, and can suppress child actions during known conditions. (SOA-C02, SAP)
8. What actions can a CloudWatch alarm trigger? Notify an SNS topic; execute an EC2 Auto Scaling policy; stop/terminate/reboot/recover an EC2 instance (recover only on StatusCheckFailed_System); create a Systems Manager OpsItem or start an Incident Manager plan. Actions attach per state (Alarm/OK/InsufficientData). (SOA-C02, SAA-C03)
9. Why doesn’t EC2 have a memory metric by default, and how do you get one? EC2’s default metrics come from the hypervisor, which cannot see inside the guest OS, so memory and disk-used % are absent. Install the CloudWatch agent (with CloudWatchAgentServerPolicy) to publish mem_used_percent, disk_used_percent, etc., into the CWAgent namespace. (SOA-C02)
10. What is the Embedded Metric Format and why use it? A JSON log structure CloudWatch auto-extracts metrics from. It lets you emit metrics and unlimited high-cardinality context (customer/request IDs) in one log write — the context stays queryable in Logs Insights without becoming billable dimensions. Ideal for high-volume app metrics. (DVA-C02)
11. You can’t create an alarm on your metric-math expression — why? The alarm’s evaluated expression must return exactly one time-series. A bare SEARCH() returns many; wrap it in an aggregation like SUM(SEARCH(...)). Also ensure exactly one query has ReturnData:true. (SOA-C02, DVA-C02)
12. How does anomaly detection differ from a static threshold? Anomaly detection learns the metric’s expected pattern (including daily/weekly seasonality) and builds a band ±n standard deviations wide via ANOMALY_DETECTION_BAND; the alarm fires on deviation from expected, not a fixed number. Use it when “normal” changes with time of day. (SOA-C02, SAP)
Quick check
- You publish
RequestLatencywithService=checkout, then later withService=checkout,Env=prod. How many metrics exist, and why does a graph on the first show nothing from the second? - Your custom latency metric’s
p99is permanently blank. What did you almost certainly do at publish time, and how do you fix it? - A service crashes and stops emitting its metric entirely; your latency alarm stays green all night. Which single alarm setting is wrong, and what should it be for a heartbeat?
- You need an alarm to fire only when checkout is sustained-slow, not on one blip. Which two parameters do you set, and to what kind of values?
- Your EC2 instance has no memory graph. Why, and what’s the fix?
Answers
- Two metrics — a metric’s identity includes its full dimension set, so
{Service}and{Service,Env}are distinct. A graph queries one exact set; it can’t “see” the other’s datapoints. - You published a StatisticSet (
--statistic-values), which has no distribution for a percentile. Re-instrument to publish raw--values (orValues/Countsarrays); there’s no retroactive fix for the old data. TreatMissingData— it’s on the defaultmissing(ornotBreaching), so absence reads as “no opinion.” For a heartbeat set it tobreaching, so silence itself triggersALARM.--evaluation-periods(N) and--datapoints-to-alarm(M) — an M-of-N window like 3 of 5 with a 60 s period fires on a sustained breach but rides out a single bad minute.- EC2’s default metrics come from the hypervisor, which can’t see guest memory. Install the CloudWatch agent (with
CloudWatchAgentServerPolicy) to publishmem_used_percentintoCWAgent.
Glossary
| Term | Definition |
|---|---|
| Namespace | A container grouping metrics; AWS/* is reserved, your own is any name you pick. |
| Metric | A time-series identified by namespace + name + dimensions. |
| Dimension | A name/value pair that scopes a metric; part of its identity; keep low-cardinality. |
| Statistic | How datapoints in a period aggregate: Average, Sum, Minimum, Maximum, SampleCount. |
| Percentile | pXX of the distribution (p90/p99); needs stored raw values, not a StatisticSet. |
| Period | The aggregation bucket width chosen at read/alarm time. |
| Resolution | Storage granularity: standard (60 s) or high-resolution (1 s), set at publish. |
| StatisticSet | Pre-aggregated publish form (SampleCount/Sum/Min/Max); blocks percentiles. |
| PutMetricData | The API/CLI that publishes custom metric datapoints. |
| EMF | Embedded Metric Format — a JSON log CloudWatch extracts metrics from, keeping context queryable. |
| Metric math | On-the-fly expressions over metrics (RATE, DIFF, FILL, SUM, SEARCH, ANOMALY_DETECTION_BAND). |
| Alarm | A state machine over a metric/expression that fires actions on state change. |
| M-of-N | datapoints-to-alarm of evaluation-periods; the anti-flapping window. |
| TreatMissingData | How an alarm treats gaps: missing / notBreaching / breaching / ignore. |
| INSUFFICIENT_DATA | Alarm state when there aren’t enough datapoints to evaluate. |
| Composite alarm | A boolean (AND/OR/NOT) alarm over other alarms’ states, to cut noise. |
| Anomaly detection | A learned expected-value band; alarms on deviation, not a fixed threshold. |
| CloudWatch agent | An on-instance agent that publishes memory/disk and custom logs (CWAgent). |
| Dashboard | A JSON board of widgets (metric/text/log/alarm) on a 24-column grid. |
| Roll-up | Automatic aggregation of aging data into coarser periods over 15 months. |
Next steps
- Turn an alarm into elastic capacity. Wire a scaling policy to a CloudWatch alarm in EC2 Auto Scaling Hands-On: Launch Templates, Scaling Policies & Instance Refresh.
- Query the other half — logs. When your signal is in log lines, not numbers, work through the wave’s CloudWatch Logs Insights querying hands-on (and remember EMF bridges logs and metrics).
- Fix the alarm that won’t fire. The wave’s CloudWatch alarm-not-triggering troubleshooting article is the deep playbook for INSUFFICIENT_DATA, missing-data and M-of-N failures this article introduced.
- See why a request is slow across services. A single metric can’t explain a distributed slowdown — follow the wave’s X-Ray distributed tracing hands-on for request-level traces and service maps.
- Harden it for production. Move high-cardinality context to EMF, wrap noisy alarms in composites, add anomaly detection to seasonal metrics, and put runbook links on every dashboard before it’s on your critical path.