The pager goes off at 02:14 and the graph is the one everybody hates: a wall of HTTP 502 climbing off the baseline behind your Application Load Balancer. Someone in the incident channel is already typing “the ALB is broken,” someone else is restarting instances, and a third person is drafting a support case. All three are probably wrong, because an ALB 5xx is not one failure — it is a family of very different failures that happen to share a first digit. A 502 is a broken conversation with the target. A 503 is no target to talk to at all. A 504 is a target that answered too slowly. And a 500 might be your identity provider, not your app. Treat them as one bucket and you will spend the night editing the wrong setting.
The single most important habit — the one that separates a five-minute fix from a five-hour goose chase — is to ask who generated the 5xx before you ask which code it is. Every 5xx the ALB emits is either ELB-generated (the load balancer answered the client itself because the target could not) or target-generated (your application returned the error and the ALB merely forwarded it). AWS exposes this split as two distinct CloudWatch metrics — HTTPCode_ELB_5XX_Count versus HTTPCode_Target_5XX_Count — and in two distinct fields of the access log — elb_status_code versus target_status_code. Read that split first and the entire diagnosis forks cleanly: ELB-side means you debug the ALB↔target path, target-side means you debug the application and leave the ALB alone.
This article is a working playbook, not a tour. You will learn to decode every ALB status code (502, 503, 504 in depth, plus 460, 463, 500, 561), to read the three access-log timing fields (request_processing_time / target_processing_time / response_processing_time) that pinpoint which hop died, to interpret target-health reason codes, and to run a symptom→root-cause→confirm→fix table you can keep open during an incident. You will reproduce the nastiest 502 of them all — the keep-alive / idle-timeout mismatch — with aws CLI and Terraform, watch it appear in HTTPCode_ELB_502_Count, and fix it by raising the server’s keep-alive above the ALB’s 60-second idle timeout. Then you tear it all down so it costs nothing.
What problem this solves
When an ALB starts returning 5xx, the business impact is immediate and total: checkout fails, the API returns errors, the mobile app shows a spinner. But the ALB is a shared choke point that sits between the internet and everything you run, so the cause can live in any of five places — the client connection, the ALB’s own listener and auth actions, the target group’s health state, the connection between ALB and target, or the application code itself. Without a method, every incident becomes a random walk: restart the instances (fixes nothing if it’s a keep-alive bug), raise the timeout (fixes nothing if the app is crashing), open a support case (fixes nothing if it’s your security group).
The pain is worst for teams who never turned on the two signals that make ALB failures legible. Access logs are off by default. The ELB-vs-target CloudWatch split exists but nobody alarms on it separately. So when 502s hit, the team is flying blind — they can see that requests fail but not where, and they cannot tell an application bug (which they must fix in code) from a load-balancer path problem (which they fix in config). This article gives you the exact metrics, log fields, and CLI paths to answer “which hop, which side, which fix” in minutes, and the muscle memory to never confuse a 502 with a 503 again.
Who hits this: anyone running EC2, ECS, EKS or Lambda behind an ALB — which is nearly everyone with a production web tier on AWS. It is squarely in SOA-C02 (SysOps, the troubleshooting cert), SAA-C03 (Solutions Architect Associate), and ANS-C01 (Advanced Networking Specialty), all of which test the ELB-vs-target distinction and the meaning of specific ELB status codes.
Learning objectives
By the end of this article you can:
- Split any 5xx by origin in under a minute using
HTTPCode_ELB_5XX_CountvsHTTPCode_Target_5XX_Count, and know why that single comparison forks the entire investigation. - Decode every ALB status code — 502, 503, 504, 460, 463, 500, 561 — down to the specific root cause and the metric or log field that confirms each.
- Read ALB access logs like an X-ray: use
request_processing_time,target_processing_timeandresponse_processing_time(and their-1sentinel) to localise the failing hop, and pairelb_status_codewithtarget_status_code. - Interpret target-health
reasoncodes (Target.FailedHealthChecks,Target.ResponseCodeMismatch,Target.Timeout,Elb.RegistrationInProgress, …) and map each to a fix. - Diagnose the three nastiest real failures: the keep-alive 502, the idle-timeout 504, and the intermittent 502 that only appears during scale-out.
- Run a ≥16-row troubleshooting playbook that takes you from symptom to fix with exact commands.
- Reproduce and fix a keep-alive 502 end to end with
awsCLI and Terraform, and configure server keep-alive correctly for nginx, Node, gunicorn and Apache. - Set the right CloudWatch alarms so the ELB-vs-target split pages you with the answer already attached.
Prerequisites & where this fits
You should be comfortable with the ALB, NLB and API Gateway comparison — what an Application Load Balancer is, what a listener and a target group are, and how it differs from an NLB. You should know your way around the aws elbv2 CLI, CloudWatch metrics, and a target running on EC2 or a container. Basic VPC networking helps, because two of the codes (504, and some 502s) are really security-group or NACL problems in disguise — the same failure class covered in Security Groups vs NACLs.
Where this fits: this is the diagnosis half of load balancing. The ALB & target groups hands-on builds the thing; this article fixes it when it breaks. It sits alongside the VPC connectivity troubleshooting playbook (which owns the “silent timeout” layer below the ALB) and Route 53 health checks & failover (which owns the DNS layer above it). When a 5xx storm hits, you will often touch all three — but the ALB’s own status codes are where you start, because the ALB is the one component that tells you which layer failed if you know how to read it.
Core concepts
An ALB is a reverse proxy. It terminates the client connection, makes its own separate connection to a target, forwards the request, reads the response, and relays it back. That “two connections, one proxy” model is the mental key to every 5xx: a 5xx can be born on the front connection, inside the ALB, on the back connection, or inside the target — and the ALB labels each differently.
The ALB maintains a pool of keep-alive connections to your targets and reuses them across requests to avoid a fresh TCP+TLS handshake every time. It also enforces an idle timeout (default 60 seconds) on both the client-side and target-side connections: if no bytes flow for that long, the ALB closes the connection. Those two facts — connection reuse and the idle timeout — are behind the two most confusing 5xx bugs in all of AWS (the keep-alive 502 and the idle-timeout 504), so hold onto them.
The first and only question that matters at the start is the origin split:
| Origin | CloudWatch metric | Access-log field | Meaning | Where you debug |
|---|---|---|---|---|
| ELB-generated | HTTPCode_ELB_5XX_Count (and _502_, _503_, _504_, _500_) |
elb_status_code set, target_status_code = - |
The ALB answered the client itself because the target couldn’t | The ALB↔target path, health, timeouts, connections |
| Target-generated | HTTPCode_Target_5XX_Count (class-level only) |
target_status_code = a real code (500/502/503/…) |
Your application returned the error; the ALB forwarded it verbatim | The application code and app logs |
| Both | Compare the two side by side | Both fields populated | Mixed incident — split by code before acting | Follow whichever metric moved |
Two subtleties that trip people up. First, the ELB side has per-code metrics (HTTPCode_ELB_502_Count, _503_, _504_, _500_) but the target side does not — there is only HTTPCode_Target_5XX_Count at the class level, so to see whether the app returned a 500 vs a 503 you must read target_status_code in the access log. Second, when the ALB generates the code, target_status_code is - and one of the timing fields is -1; that pairing is your signature that “the ALB never got a clean response.”
Here is the request lifecycle and the point at which each failure class can appear:
| Stage | What the ALB does | 5xx that can originate here | Signal |
|---|---|---|---|
| Front connection accept | TLS handshake, read request line + headers | 460 (client closed), 463 (XFF > 30 IPs), 400 | elb_status_code, matched_rule_priority |
| Listener rules / auth | Evaluate rules, run authenticate-oidc/authenticate-cognito |
500, 561 (auth errors) | actions_executed, error_reason |
| Target selection | Pick a healthy target from the group | 503 (no healthy target) | HealthyHostCount, HTTPCode_ELB_503 |
| Back connection | Reuse/open connection, send request | 502 (target closed / TLS fail), 504 (connect timeout) | TargetConnectionErrorCount, target_processing_time = -1 |
| Await response | Wait for target to send headers within idle timeout | 504 (target too slow), 502 (bad/oversized headers) | target_processing_time, HTTPCode_ELB_504/502 |
| Relay response | Stream the target’s response to the client | 502 (target closed mid-response), target-5xx forwarded | response_processing_time, target_status_code |
And the 30-second triage, in decision-table form — the shape of “if you see this, it’s probably that, do this” you run before opening a single config screen:
| If you see… | It’s probably… | Do this first |
|---|---|---|
| 502 climbing with load, app 5xx flat | Keep-alive < idle timeout | Check TargetConnectionErrorCount; raise app keep-alive |
| 502 only on some routes | Oversized/malformed response headers | Look at sent_bytes 0 + the app’s header sizes |
| 503 flat-out, all requests | Zero healthy targets | describe-target-health → read the reason code |
| 504 clustered at ~60s | Target slower than idle timeout | Read target_processing_time; profile the endpoint |
| 500/561, app never logged the request | Auth action / IdP failure | Read actions_executed + error_reason |
Real target_status_code (500/502/503) |
Application error | Read app logs — the ALB is innocent |
| 460/463 | Client-side / XFF | Read elb_status_code; tune client or edge |
The first question: ELB-generated vs target-generated
Before you look at which code, split the storm by side. Put HTTPCode_ELB_5XX_Count and HTTPCode_Target_5XX_Count on one graph. Whichever line moved tells you which half of the world to debug. This is the single most valuable 30 seconds of any ALB incident.
The full CloudWatch metric set for an ALB lives in the AWS/ApplicationELB namespace. These are the ones you actually use during a 5xx incident:
| Metric | Side | Granularity | What it tells you | Use it for |
|---|---|---|---|---|
HTTPCode_ELB_5XX_Count |
ELB | class | ALB generated a 5xx | The master “is it the ALB?” signal |
HTTPCode_ELB_502_Count |
ELB | per-code | Bad gateway from the ALB | Target closed / bad headers / keep-alive |
HTTPCode_ELB_503_Count |
ELB | per-code | Service unavailable from the ALB | No/insufficient healthy targets, capacity |
HTTPCode_ELB_504_Count |
ELB | per-code | Gateway timeout from the ALB | Target slower than idle timeout |
HTTPCode_ELB_500_Count |
ELB | per-code | Internal error from the ALB | Auth action error, oversized claims |
HTTPCode_Target_5XX_Count |
Target | class only | The app returned a 5xx | Application bug — read app logs |
HTTPCode_Target_4XX_Count |
Target | class only | The app returned a 4xx | Usually not your ALB problem |
TargetConnectionErrorCount |
ELB↔target | count | ALB could not open a connection to a target | 502 diagnosis, SG/keep-alive |
TargetResponseTime |
ELB↔target | seconds | Time from request-sent to response-received | 504 diagnosis, latency creep |
HealthyHostCount |
Target group | count (per AZ) | Number of healthy targets | 503 diagnosis |
UnHealthyHostCount |
Target group | count (per AZ) | Number of failing health checks | 503 diagnosis |
RequestCount |
ELB | count | Total requests processed | Denominator for error rate |
RejectedConnectionCount |
ELB | count | Connections rejected at the LB’s connection cap | Capacity-driven 503 |
ActiveConnectionCount |
ELB | count | Concurrent front+back connections | Capacity headroom |
ClientTLSNegotiationErrorCount |
Front | count | Client TLS handshakes that failed | Not a 5xx, but pairs with 460s |
The decision is mechanical:
| If the line that moved is… | The 5xx is… | Go debug… | Do NOT… |
|---|---|---|---|
HTTPCode_ELB_5XX_Count only |
ELB-generated | health, timeouts, connections, SGs, keep-alive | edit application code |
HTTPCode_Target_5XX_Count only |
target-generated (app) | application code + app logs | touch idle timeout, health check, or the ALB |
| Both, together | mixed | split further by per-code ELB metric + target_status_code |
assume one cause fixes both |
| Neither, but users report errors | upstream (CloudFront/WAF/Route 53) or client | the layer in front of the ALB | stare at the ALB |
And because a “5xx to the user” can be born at any layer, confirm it is even the ALB’s before you debug it. Each layer stamps a different fingerprint:
| Layer (front to back) | 5xx it injects | How to tell it’s this layer | Where you’d actually fix it |
|---|---|---|---|
| Client / browser | Perceived 5xx, cancelled requests | ALB RequestCount normal, no matching log line |
Client code / network |
| Route 53 | None (DNS resolves or it doesn’t) | dig returns the ALB; failover flipped |
Health-check / record config |
| CloudFront | 502/503/504 from the CDN edge | CloudFront 5xxErrorRate up, ALB flat |
Origin settings / origin timeout |
| WAF (on the ALB) | 403 (block), not 5xx | WAF BlockedRequests; actions_executed has waf |
Rule tuning |
| ALB | 460/463/500/502/503/504/561 | HTTPCode_ELB_* moves; access log line exists |
This article |
| Target / app | Any target 5xx | HTTPCode_Target_5XX_Count; real target_status_code |
Application code |
Pull the split from the CLI in one shot:
# Which side is generating the 5xx, last 30 minutes, 1-minute bins?
LB="app/prod-alb/50dc6c495c0c9188"   # the LoadBalancer dimension value (see below)
for M in HTTPCode_ELB_5XX_Count HTTPCode_Target_5XX_Count HTTPCode_ELB_502_Count \
         HTTPCode_ELB_503_Count HTTPCode_ELB_504_Count; do
  echo "== $M =="
  aws cloudwatch get-metric-statistics \
    --namespace AWS/ApplicationELB --metric-name "$M" \
    --dimensions Name=LoadBalancer,Value="$LB" \
    --start-time "$(date -u -v-30M +%Y-%m-%dT%H:%M:%SZ)" \
    --end-time   "$(date -u +%Y-%m-%dT%H:%M:%SZ)" \
    --period 60 --statistics Sum \
    --query 'sort_by(Datapoints,&Timestamp)[].[Timestamp,Sum]' --output text
done
The LoadBalancer dimension value is the tail of the ARN — everything after loadbalancer/. Get it with aws elbv2 describe-load-balancers --names prod-alb --query 'LoadBalancers[0].LoadBalancerArn' and strip the prefix.
The ALB status-code reference
This is the table to keep open. Every code the ALB can put on the wire, who generates it, the real cause, how to confirm, and the fix. Codes in the 5xx range from the ALB are always ELB-generated; a matching code with a populated target_status_code is target-generated and means something completely different.
| Code | Generated by | Meaning | Most likely cause | Confirm | Fix |
|---|---|---|---|---|---|
| 460 | ELB | Client closed the connection before the ALB replied | Client timeout, user navigated away, mobile network drop, cancelled fetch | Access log: elb_status_code 460, target_status_code - |
Increase client timeout; add client retry; check for client-side idle-timeout shorter than response time |
| 463 | ELB | X-Forwarded-For header carried more than 30 IPs |
Proxy chain adding hops, header injection | Access log: elb_status_code 463 |
Cap/strip XFF at the edge; use routing.http.xff_header_processing.mode |
| 500 | ELB | Internal error, or authenticate action failed | IdP misconfigured, oversized claims/cookies from OIDC, ALB internal | actions_executed includes authenticate, error_reason set; HTTPCode_ELB_500_Count |
Fix IdP config; reduce claim size; retry (if genuinely internal) |
| 502 | ELB | Bad gateway — the target’s response was unusable | Target closed connection, malformed/oversized headers, app crashed mid-response, keep-alive shorter than idle timeout, TLS handshake to target failed | HTTPCode_ELB_502_Count; log target_status_code -, target_processing_time -1; TargetConnectionErrorCount |
Raise app keep-alive > 60s; shrink response headers; fix app crash; fix backend TLS |
| 503 | ELB | Service unavailable — no target to route to | Zero healthy targets, zero registered targets, target group not associated, capacity, ASG scaled to 0 | HealthyHostCount = 0; HTTPCode_ELB_503_Count; describe-target-health |
Repair health check; register targets; associate target group; add capacity |
| 504 | ELB | Gateway timeout — target did not respond in time | Target slower than the idle timeout (60s), target still processing, SG dropping the response packets, slow DB | HTTPCode_ELB_504_Count; log target_processing_time ≈ idle timeout, target_status_code - |
Speed up target/DB; raise idle_timeout; fix SG/NACL on response path |
| 561 | ELB | Authentication error from the identity provider | User pool/OIDC returned an error, unauthorized client | error_reason in log; HTTPCode_ELB_5XX_Count |
Fix the IdP/Cognito app client config |
500/502/503 with target_status_code set |
Target | Your app returned this code | Application bug, upstream dependency down, app’s own gateway timeout | HTTPCode_Target_5XX_Count; log target_status_code is a real code, timing normal |
Fix it in the application — the ALB is innocent |
| 400 | ELB | Malformed request | Bad request line/headers, HTTP desync | HTTPCode_ELB_4XX_Count; classification field |
Fix client; review desync_mitigation_mode |
| 401 | ELB or Target | Unauthorized | Auth action denied, or app auth | actions_executed |
Depends on side |
| 000 (log only) | — | Connection closed before a full response (logged as elb_status_code?) |
Client dropped during streaming | Log inspection | Client-side |
A code many engineers never notice until it burns them: 500 and 561 are usually authentication problems, not application problems. If you attach an authenticate-oidc or authenticate-cognito action to a listener rule and the IdP is misconfigured — wrong client secret, callback URL mismatch, or an IdP that returns more claims than fit in the session cookie — the ALB returns 500 or 561, and HTTPCode_ELB_5XX_Count climbs while your app never sees the request. The tell is the actions_executed and error_reason fields in the access log naming the authenticate action.
Reading ALB access logs: which hop failed
CloudWatch tells you which side and which code; the access log tells you which hop and why. Access logs are off by default — turn them on before you need them (there is no retroactive log). They land in S3 as gzipped, space-delimited files.
The ALB emits two related-but-different log streams — know which to reach for:
| Log | What it records | Turn 5xx into… | Enable attribute |
|---|---|---|---|
| Access logs | Every request: status codes, timing fields, target, rule | The per-hop fingerprint of a 5xx | access_logs.s3.enabled |
| Connection logs | TLS handshakes, connection-level errors, client cert | Front-connection failures (460, TLS) the access log can miss | connection_logs.s3.enabled |
| CloudWatch metrics | Aggregated counts per minute | The origin split and the alarm | on by default |
| VPC Flow Logs (on the ENIs) | ACCEPT/REJECT per packet | The 504-that’s-really-a-security-group | separate feature |
The full field layout, in order, is dense — but only a handful matter during a 5xx. Here is the complete list so you can index correctly, with the diagnostic ones flagged:
| # | Field | Example | Diagnostic value for 5xx |
|---|---|---|---|
| 1 | type |
https, h2, grpcs, ws |
Protocol; gRPC/h2 have their own quirks |
| 2 | time |
2026-07-14T02:14:33.123456Z |
When the ALB finished the response |
| 3 | elb |
app/prod-alb/50dc6c49… |
Which ALB |
| 4 | client:port |
203.0.113.10:54692 |
The caller |
| 5 | target:port |
10.0.2.15:8080 |
Which target got it (- if none — 503!) |
| 6 | request_processing_time |
0.001 or -1 |
Front→ALB→target dispatch time; -1 = never dispatched |
| 7 | target_processing_time |
59.998 or -1 |
Time waiting on the target; ≈idle timeout = 504, -1 = target never responded |
| 8 | response_processing_time |
0.002 or -1 |
ALB→client relay time; -1 = target closed mid-response |
| 9 | elb_status_code |
502 |
What the client got |
| 10 | target_status_code |
200 or - |
What the target returned; - = ELB generated the code |
| 11 | received_bytes |
412 |
Request size |
| 12 | sent_bytes |
0 |
Response size (0 on many ELB 5xx) |
| 13 | request |
"GET https://… HTTP/1.1" |
The request line |
| 14 | user_agent |
"curl/8.4" |
Client identity |
| 15 | ssl_cipher |
ECDHE-… |
Front TLS |
| 16 | ssl_protocol |
TLSv1.3 |
Front TLS |
| 17 | target_group_arn |
arn:aws:…:targetgroup/… |
Which group |
| 18 | trace_id |
"Root=1-…" |
X-Ray / correlation |
| 19 | domain_name |
api.example.com |
SNI host |
| 20 | chosen_cert_arn |
arn:aws:acm:… |
Which cert |
| 21 | matched_rule_priority |
10 |
Which listener rule matched |
| 22 | request_creation_time |
2026-07-14T02:14:33Z |
When the request arrived |
| 23 | actions_executed |
authenticate,forward |
The action chain; names auth failures |
| 24 | redirect_url |
- |
For redirect actions |
| 25 | error_reason |
AuthTokenTimeout |
Why an action failed (500/561) |
| 26 | target:port_list |
10.0.2.15:8080 |
All targets tried |
| 27 | target_status_code_list |
502 |
Codes from each retry |
| 28 | classification |
Acceptable/Ambiguous/Severe |
HTTP desync classification |
| 29 | classification_reason |
- |
Why classified |
The three timing fields are the X-ray. They partition the request into hops, and the value -1 is a sentinel meaning “this hop never completed”:
| Field | Measures the hop | Normal value | -1 means |
A large value means |
|---|---|---|---|---|
request_processing_time |
Client-request-received → sent to target | ~0.000–0.005s | ALB could not dispatch to a target (target closed the connection, or malformed request) — pairs with 502/400 | Rare; front-end congestion |
target_processing_time |
Request-sent-to-target → first response byte back | app’s real latency | ALB never got a response (target closed, connect fail) — pairs with 502/504 | Target is slow; at ≈idle-timeout → 504 |
response_processing_time |
Response-received-from-target → relay to client | ~0.000–0.005s | ALB could not finish relaying (client or target closed mid-stream) — pairs with 460/502 | Slow client download |
Now the pattern-matching. The combination of elb_status_code, target_status_code, and the timing fields is a fingerprint:
elb_status_code |
target_status_code |
Timing signature | Diagnosis |
|---|---|---|---|
| 502 | - |
target_processing_time = -1 |
Target closed the connection / bad response — the classic 502 |
| 502 | - |
request_processing_time = -1 |
ALB couldn’t even send the request — target dropped a reused keep-alive connection |
| 504 | - |
target_processing_time ≈ 60 (idle timeout) |
Target too slow — genuine gateway timeout |
| 503 | - |
target:port = -, all timing -1 |
No healthy/registered target selected |
| 500 | - |
actions_executed has authenticate, error_reason set |
Auth action failed, not the app |
| 460 | - |
response_processing_time = -1 |
Client closed before the ALB replied |
| 200/500/502 | 500/502 (real code) |
target_processing_time normal |
Target-generated — the app returned it; ALB is fine |
| 502 | - |
sent_bytes = 0, headers oversized in app logs |
Response headers exceeded the ALB limit |
Query these fast with Amazon Athena — the standard way to grep ALB logs at scale. Create the table once (partition projection keeps it cheap), then filter to the failures:
-- One-time: point Athena at your ALB log bucket (fields match the layout above)
CREATE EXTERNAL TABLE alb_logs (
  type string, time string, elb string, client_port string, target_port string,
  request_processing_time double, target_processing_time double, response_processing_time double,
  elb_status_code int, target_status_code string, received_bytes bigint, sent_bytes bigint,
  request string, user_agent string, ssl_cipher string, ssl_protocol string,
  target_group_arn string, trace_id string, domain_name string, chosen_cert_arn string,
  matched_rule_priority string, request_creation_time string, actions_executed string,
  redirect_url string, error_reason string, target_port_list string,
  target_status_code_list string, classification string, classification_reason string
)
ROW FORMAT SERDE 'org.apache.hadoop.hive.serde2.RegexSerDe'
WITH SERDEPROPERTIES ('serialization.format'='1',
 'input.regex'='([^ ]*) ([^ ]*) ([^ ]*) ([^ ]*) ([^ ]*) ([-.0-9]*) ([-.0-9]*) ([-.0-9]*) ([-0-9]*) (-|[-0-9]*) ([-0-9]*) ([-0-9]*) \"([^\"]*)\" \"([^\"]*)\" ([A-Z0-9-_]+) ([A-Za-z0-9.-]*) ([^ ]*) \"([^\"]*)\" \"([^\"]*)\" \"([^\"]*)\" ([-.0-9]*) ([^ ]*) \"([^\"]*)\" \"([^\"]*)\" ([^ ]*) \"([^\"]*)\" \"([^\"]*)\" \"([^ ]*)\" \"([^ ]*)\"')
LOCATION 's3://my-alb-logs/AWSLogs/111122223333/elasticloadbalancing/ap-south-1/';

-- All ELB-generated 502s in the incident window, with the timing fingerprint
SELECT time, client_port, target_port, target_processing_time,
       request_processing_time, elb_status_code, target_status_code
FROM alb_logs
WHERE elb_status_code = 502 AND target_status_code = '-'
  AND parse_datetime(time,'yyyy-MM-dd''T''HH:mm:ss.SSSSSS''Z')
      > current_timestamp - interval '30' minute
ORDER BY time;
Target-health reason codes
A 503 almost always means the target group has no healthy targets — so describe-target-health and its reason codes are your 503 decoder ring. Health is a per-target state machine; the state plus the reason tells you exactly what to fix.
The target-health states:
| State | Meaning | Traffic? | Typical cause |
|---|---|---|---|
initial |
Registered, first health checks not yet complete | No | Just registered; slow start; Elb.RegistrationInProgress |
healthy |
Passing health checks | Yes | Normal |
unhealthy |
Failing health checks | No | Bad path/matcher/port, app down, SG blocks health-check port |
unused |
Not receiving traffic | No | Target group unassociated, or target in a disabled AZ |
draining |
Deregistering, finishing in-flight requests | Finishing only | Deployment / scale-in with connection draining |
unavailable |
Health status unavailable | No | Elb.InternalError, health checks disabled |
The reason codes (the TargetHealth.Reason field):
| Reason | State | What it means | Fix |
|---|---|---|---|
Elb.RegistrationInProgress |
initial | Target just registered; checks starting | Wait; if permanent, check registration |
Elb.InitialHealthChecking |
initial | Running the first HealthyThresholdCount checks |
Wait one full interval × threshold |
Target.ResponseCodeMismatch |
unhealthy | Health check got a code outside the matcher (e.g. 302/404/500 when matcher = 200) | Fix the health path or widen the matcher |
Target.Timeout |
unhealthy | Health check request timed out | App slow on /health; raise timeout; check SG |
Target.FailedHealthChecks |
unhealthy | Connection to the health-check port failed | Wrong port, SG blocks it, app not listening |
Target.NotInUse |
unused | Target group not associated with any active listener, or AZ not enabled | Associate the group; enable the AZ |
Target.IpUnusable |
unavailable | The IP can’t be used (e.g. out of the VPC CIDR) | Register a valid in-VPC target |
Target.InvalidState |
unavailable | Target stopped/terminated | Replace the target |
Target.HealthCheckDisabled |
unavailable | Health checks turned off | Enable health checks |
Target.DeregistrationInProgress |
draining | Deregistration + connection draining underway | Expected during deploy/scale-in |
Elb.InternalError |
unavailable | Health checks failing due to an ALB internal error | Retry; open a case if persistent |
The command, and how to read it:
aws elbv2 describe-target-health \
  --target-group-arn arn:aws:elasticloadbalancing:ap-south-1:111122223333:targetgroup/prod-tg/abc123 \
  --query 'TargetHealthDescriptions[].{id:Target.Id,port:Target.Port,state:TargetHealth.State,reason:TargetHealth.Reason,desc:TargetHealth.Description}' \
  --output table
If every row is unhealthy / Target.ResponseCodeMismatch, your health-check path is returning something other than 200 — the single most common cause of a “503 out of nowhere” after a deploy that changed the /health route. If every row is unhealthy / Target.FailedHealthChecks, the ALB can’t even open the health-check port — a security-group or “app not listening” problem.
The commands you actually run during a 5xx incident, in the order you reach for them:
| Command | What it answers | Reach for it when |
|---|---|---|
aws cloudwatch get-metric-statistics … HTTPCode_ELB_5XX_Count vs …_Target_5XX_Count |
Which side generated it | Always — step one |
aws cloudwatch get-metric-statistics … HTTPCode_ELB_502/503/504_Count |
Which ELB code | ELB side moved |
aws elbv2 describe-target-health |
Why targets are unhealthy | 503 / HealthyHostCount low |
aws elbv2 describe-target-group-attributes |
Deregistration delay, slow start, stickiness | Deploy/scale-out 5xx |
aws elbv2 describe-load-balancer-attributes |
Idle timeout, access-log state, desync mode | 504, or “are logs even on?” |
aws elbv2 describe-listeners / describe-rules |
Auth actions, routing | 500/561, wrong routing |
| Athena on the access log | The per-hop timing fingerprint | Any ELB-generated 5xx |
aws ec2 describe-flow-logs / query |
Silent packet drops | 504 with target_processing_time -1 |
Target type also changes the 5xx surface — an IP target, a Lambda target, and an ALB-as-target don’t fail the same way:
| Target type | 502 nuance | 503 nuance | 504 nuance |
|---|---|---|---|
instance |
Keep-alive, SG on the ENI | ASG detach, AZ mismatch | Slow app / DB |
ip (e.g. ECS awsvpc, on-prem) |
Stale IP after task churn | IP not registered / drained | Cross-account/on-prem latency |
lambda |
Malformed Lambda response JSON = 502 | Concurrency throttle can surface as 5xx | Lambda timeout < ALB idle → 502, not 504 |
alb (ALB-as-target of an NLB) |
Inner ALB’s own 5xx forwarded | Inner ALB health | Two idle timeouts stacked |
Anatomy of a 502 Bad Gateway
A 502 means the ALB reached the target but the response was unusable. That “reached but unusable” is the key: the network path is fine (that would be a 504 or 503), but the HTTP conversation broke. Five distinct root causes wear the same 502 mask:
| Root cause | What actually happens | Confirm | Fix |
|---|---|---|---|
| Keep-alive shorter than idle timeout | ALB reuses a pooled connection; the target already closed it (its keep-alive expired first); ALB sends on a dead socket → RST | TargetConnectionErrorCount > 0; log request_processing_time -1; intermittent, load-correlated |
Set app keep-alive > 60s (the ALB idle timeout) |
| Target closed connection mid-response | App started a response then the worker crashed/OOM’d/was killed | Log response_processing_time -1, sent_bytes small; app logs show crash/OOM |
Fix the crash; raise memory/worker limits |
| Malformed / oversized response headers | Target sent invalid HTTP or headers larger than the ALB allows (huge Set-Cookie, giant Location) |
sent_bytes 0; app emits large headers; 502 only on certain routes |
Shrink headers/cookies; fix invalid header chars |
| App crashed before responding | Worker died right after accepting the request | target_processing_time -1, target_status_code -; app logs show 500→exit |
Fix the app bug; add a supervisor/restart |
| Backend TLS handshake failed | Target group protocol is HTTPS and the target’s cert/cipher is rejected | 502 on an HTTPS target group; target TLS logs | Fix the target cert/cipher; or use HTTP to target inside the VPC |
The header-size limit deserves a note because it produces a maddening “works in curl, 502 through the ALB” symptom. The ALB enforces a maximum on the response header block; a target that piles on cookies or emits an oversized Location header can breach it, and the ALB converts the unusable response into a 502 with sent_bytes 0. It is route-specific (only the endpoints that set the big header fail), which fools people into blaming the ALB intermittently. The fix is in the app: trim cookies, cap header sizes, and never round-trip large state in a header.
Anatomy of a 503 Service Unavailable
A 503 means the ALB had a request to route and nowhere healthy to send it. Unlike 502/504, a 503 is often not about the connection at all — it is about inventory. The causes:
| Root cause | What actually happens | Confirm | Fix |
|---|---|---|---|
| Zero healthy targets | Every target is failing health checks | HealthyHostCount = 0; describe-target-health all unhealthy |
Fix health-check path/matcher/port; fix the app |
| Zero registered targets | The group is empty (ASG detached, deploy removed all) | describe-target-health returns [] |
Register targets; check ASG target-group attachment |
| Target group not associated | Listener rule points nowhere, or group has no listener | Target.NotInUse; listener has no forward to this group |
Associate the group with a listener/rule |
| AZ not enabled / cross-zone off | Targets live only in an AZ the ALB isn’t in, cross-zone disabled | Targets unused; ALB subnets vs target AZs mismatch |
Enable the AZ on the ALB; enable cross-zone |
| Capacity / connection cap | ALB rejecting connections at its limit (rare; ALB auto-scales) | RejectedConnectionCount > 0; sudden 10x spike |
Pre-warm via support for known events; scale targets |
| ASG scaled to 0 / all draining | A scale-in or deploy left nothing serving | HealthyHostCount = 0, all draining |
Fix min capacity; stagger deploys |
One nuance that separates ALB from the old Classic Load Balancer: the ALB does not expose a SurgeQueueLength or SpilloverCount metric — those are CLB concepts. The ALB scales its own capacity automatically (measured in LCUs), so a pure “surge queue full” 503 is far rarer than on CLB. For a genuinely massive, instantaneous traffic spike (a flash sale, a live event), the ALB may briefly 503 while it scales; the mitigation is to request pre-warming through AWS Support ahead of the event and to make sure your targets have capacity, because in practice the 503 is almost always “no healthy targets,” not “ALB out of capacity.”
Anatomy of a 504 Gateway Timeout
A 504 means the ALB connected to the target and waited, but the target did not send a response before the idle timeout (default 60s). The ALB gives up, closes the connection, and synthesises the 504. The causes:
| Root cause | What actually happens | Confirm | Fix |
|---|---|---|---|
| Target slower than idle timeout | The endpoint genuinely takes > 60s | Log target_processing_time ≈ 60; TargetResponseTime high |
Speed up the endpoint; raise idle_timeout; make it async |
| Slow downstream (DB, API) | The app is blocked on a slow query/dependency | App logs show long query; TargetResponseTime tracks it |
Fix the query/index; add a timeout+cache in the app |
| SG/NACL drops the response path | The response packets are silently dropped | Log target_processing_time = -1 or ≈timeout; Flow Logs REJECT |
Fix the security group / NACL (ephemeral ports) |
| Target still processing after client left | Long job, client gave up, ALB times out | target_processing_time high; 504 + 460 pairs |
Use async (202 + poll) for long work |
| Idle timeout too low for the workload | Legit long request (report, upload) exceeds 60s | Consistent 504 at exactly the timeout on known-slow routes | Raise idle_timeout (1–4000s) for that ALB |
The timeout hierarchy is worth internalising, because a 504 is a mismatch in this chain — the outermost timeout fires before an inner one finishes:
| Layer | Setting | Default | Note |
|---|---|---|---|
| Client | HTTP client timeout | varies | If shorter than the ALB, you get a 460 not a 504 |
| ALB | idle_timeout.timeout_seconds |
60s | Range 1–4000; applies to both front and back connections |
| Target keep-alive | server keep-alive timeout | varies (nginx 75s, Node 5s!) | Must be > ALB idle to avoid the 502 |
| App request timeout | framework/gunicorn --timeout |
e.g. gunicorn 30s | If shorter than ALB, app 500/worker-kill before ALB 504 |
| Downstream | DB/HTTP client timeout | varies | The real bottleneck for most 504s |
Timeouts and keep-alive: the settings that cause and cure
Two ALB target-group and load-balancer attributes are behind most 502/504 incidents. Know their defaults, ranges, and the failure each mistuning causes:
| Attribute | Scope | Default | Range | Mistuned → | Set with |
|---|---|---|---|---|---|
idle_timeout.timeout_seconds |
ALB | 60s | 1–4000 | Too low → 504 on slow routes; too high → resources held | modify-load-balancer-attributes |
deregistration_delay.timeout_seconds |
TG | 300s | 0–3600 | Too high → slow deploys; too low → 502 on in-flight requests during deploy | modify-target-group-attributes |
slow_start.duration_seconds |
TG | 0 (off) | 30–900 | Off → new targets flooded → 502/timeouts on cold caches | modify-target-group-attributes |
load_balancing.algorithm.type |
TG | round_robin |
round_robin | least_outstanding_requests |
RR with uneven latency → hot targets → 504 | modify-target-group-attributes |
stickiness.enabled |
TG | false | — | On with dead sticky target → 502/503 for that client | modify-target-group-attributes |
routing.http.desync_mitigation_mode |
ALB | defensive |
monitor|defensive|strictest |
strictest may 400 edge cases |
modify-load-balancer-attributes |
routing.http.drop_invalid_header_fields.enabled |
ALB | false | — | Off → some malformed headers pass; on → dropped | modify-load-balancer-attributes |
The health-check settings decide how fast a bad target is pulled (503 prevention) and how fast a recovered one returns:
| Setting | Default (ALB) | Range | Effect on 5xx |
|---|---|---|---|
HealthCheckProtocol |
HTTP | HTTP/HTTPS | Wrong protocol → all unhealthy → 503 |
HealthCheckPath |
/ |
any | Wrong path → ResponseCodeMismatch → 503 |
HealthCheckPort |
traffic-port | traffic-port / number | Wrong port → FailedHealthChecks → 503 |
HealthCheckIntervalSeconds |
30 | 5–300 | Longer → slow to detect a bad target |
HealthCheckTimeoutSeconds |
5 | 2–120 | Too low → healthy target flagged (Target.Timeout) |
HealthyThresholdCount |
5 | 2–10 | Higher → slower to return a recovered target |
UnhealthyThresholdCount |
2 | 2–10 | Higher → slower to pull a bad target → more 5xx |
Matcher (HttpCode) |
200 | 200–499 | Too strict → ResponseCodeMismatch → 503 |
Protocol nuances: HTTP/2, gRPC and WebSockets
The protocol version of the target group (protocol_version = HTTP1 / HTTP2 / GRPC) changes what a 5xx even means and which matcher applies:
| Protocol | 5xx behaviour | Matcher | Gotcha |
|---|---|---|---|
| HTTP/1.1 (default) | Standard 502/503/504 | HTTP codes (200) | Keep-alive rules as described |
| HTTP/2 | Same ELB codes; multiplexed streams | HTTP codes | A stream reset can surface as 502 |
| gRPC | ALB maps to gRPC status | gRPC codes (0, 12, …) |
Health matcher is a gRPC code, not 200 — mismatch → 503 |
WebSocket (ws/wss) |
Upgrade held open; idle timeout still applies | HTTP codes | Long-lived socket idle > timeout → dropped (looks like a hang, not a clean 5xx) |
The three nastiest failures
Most 5xx are quick once you read the origin split. Three are genuinely hard because they are intermittent and load-correlated, which defeats “restart it and see.”
1. The keep-alive 502 (idle-timeout mismatch)
This is the single most misdiagnosed ALB error. The ALB keeps a pool of connections open to your targets and reuses them. The ALB will hold a connection for up to its idle timeout (60s). If your server’s keep-alive timeout is shorter — say the Node.js default of 5 seconds, or an nginx keepalive_timeout set below 60 — then the target closes an idle pooled connection first. The ALB, not knowing it’s dead, picks that connection to send the next request, the target sends a TCP RST, and the ALB returns a 502 with request_processing_time = -1.
The signature is unmistakable once you know it: intermittent 502s that rise with traffic, HTTPCode_ELB_502_Count climbing, TargetConnectionErrorCount climbing, and access-log entries with target_status_code = - and a -1 timing field. It is never 100% of requests — only the ones that happen to land on a just-closed connection — which is why restarting instances “fixes” it for a few minutes (fresh connections) and then it comes back.
The fix is a one-liner in the app, and the rule is absolute: the target’s keep-alive must be longer than the ALB idle timeout.
| Server | Setting | Bad default | Fix (ALB idle 60s) |
|---|---|---|---|
| nginx | keepalive_timeout |
75s (usually OK) | keepalive_timeout 75; |
Node.js http |
server.keepAliveTimeout |
5000ms | server.keepAliveTimeout = 65000; server.headersTimeout = 66000; |
| gunicorn | --keep-alive |
2s | --keep-alive 75 |
| Apache httpd | KeepAliveTimeout |
5s | KeepAliveTimeout 75 |
Go http.Server |
IdleTimeout |
0 (unbounded, OK) | IdleTimeout: 75 * time.Second |
| Envoy | common_http_protocol_options.idle_timeout |
varies | idle_timeout: 75s |
The Node.js one is the famous trap: for years the default keepAliveTimeout was 5s, and both keepAliveTimeout and headersTimeout must exceed the ALB idle timeout, with headersTimeout set slightly higher than keepAliveTimeout.
2. The idle-timeout 504
A slow endpoint (a report, a large upload, a synchronous call to a slow dependency) that legitimately runs past 60 seconds produces a 504 at exactly the idle timeout — target_processing_time will read ~59.9s and elb_status_code 504. The trap is the reflex to “just raise the timeout.” Sometimes that is right (a report endpoint that genuinely needs 120s), but raising idle_timeout to paper over a slow query only moves the wall and holds connections longer, inflating your LCU cost and your blast radius. The senior move: first ask whether the work should be synchronous at all. Long jobs belong behind a 202-Accepted + poll or a queue; only raise the idle timeout for legitimately long-but-bounded requests, and raise it on a dedicated ALB or listener for those routes, not globally.
3. The intermittent 502 during scale-out
During an auto-scaling scale-out or a rolling deploy, brand-new targets pass their first health check and start receiving traffic before their caches are warm or their connection pools are established. The result is a burst of 502s (and sometimes 504s) that correlates precisely with scaling events and then vanishes — impossible to reproduce on a stable fleet. Two fixes: enable slow start (slow_start.duration_seconds, 30–900s) so the ALB ramps traffic to a new target gradually instead of flooding it, and make sure deregistration delay (connection draining, default 300s) is long enough that scale-in doesn’t cut in-flight requests (a 502 source in the other direction). Pair those with a health-check path that actually exercises the dependencies (DB connection, cache) so a target is only “healthy” when it can really serve.
Architecture at a glance
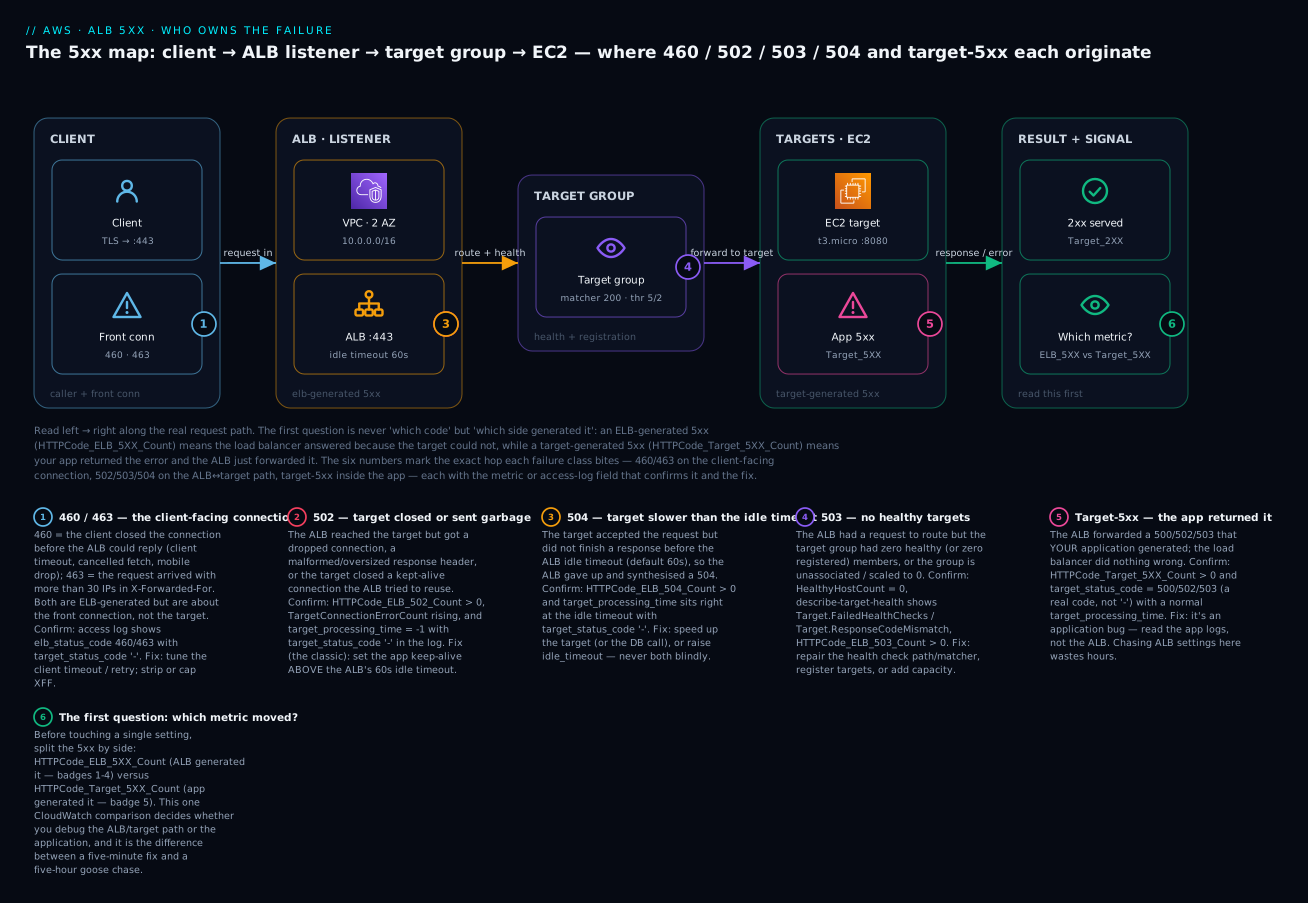
The diagram traces a single request left to right along the real path — client → ALB listener (in the VPC) → target group → EC2 target — and drops a numbered badge at the exact hop each failure class is born. Follow the flow: the client opens a TLS connection to the ALB on :443 (badge 1 marks the client-facing failures, 460/463); the ALB evaluates rules and picks a target from the group, where a shortage of healthy targets produces the 503 (badge 4); it opens or reuses a back connection to the EC2 target, where a closed/garbled response is the 502 (badge 2) and a too-slow response is the 504 (badge 3); the target’s own 5xx (badge 5) is forwarded verbatim; and the “SIGNAL” node (badge 6) is the habit that ties it together — read HTTPCode_ELB_5XX_Count vs HTTPCode_Target_5XX_Count first to decide which side you are even debugging. The legend narrates each number as code · confirm · fix.
Real-world scenario
Meridian Retail runs its checkout API on ECS Fargate behind an ALB in ap-south-1, roughly 4,000 requests/minute at peak. After a routine deploy that bumped the Node.js runtime, the on-call started seeing a slow drip of 502s — never more than 0.4% of requests, never in a pattern anyone could pin down. The first instinct was the deploy, so they rolled back; the 502s stayed. Next they blamed a bad Fargate task and cycled the service twice; each time the 502s disappeared for ten minutes and returned. By hour three there was a support case open and a theory that “the ALB is flaky in ap-south-1.”
The engineer who broke it did exactly one thing first: she put HTTPCode_ELB_502_Count, HTTPCode_Target_5XX_Count, and TargetConnectionErrorCount on one graph. HTTPCode_Target_5XX_Count was flat at zero — the application was never returning an error. HTTPCode_ELB_502_Count and TargetConnectionErrorCount moved together and both scaled with request volume. That pairing — ELB-generated 502 + connection errors + load correlation, with the app innocent — is the keep-alive signature. She pulled three sample 502s from the access log via Athena: every one had target_status_code = - and request_processing_time = -1.
The root cause was the runtime bump. The old image had pinned server.keepAliveTimeout = 65000; the new base image reset it to the Node default of 5000ms, well under the ALB’s 60-second idle timeout. Every time the ALB reused a pooled connection that the task had already closed, it got an RST and returned a 502. The fix was two lines restored to the server bootstrap — server.keepAliveTimeout = 65000; server.headersTimeout = 66000; — shipped in a 20-minute patch deploy. The 502s went to zero and stayed there.
The post-mortem actions were as important as the fix: they added a CloudWatch alarm on HTTPCode_ELB_502_Count (separate from target 5xx) so the next occurrence pages with the origin already identified; they added a contract test asserting keepAliveTimeout > 60000 so a base-image change can never silently reintroduce it; and they wrote the ELB-vs-target split into the runbook as step one. Three hours of guessing became a permanent five-minute diagnosis.
Advantages and disadvantages
The ALB’s rich, code-specific error semantics are a double-edged sword: they tell you exactly what failed if you invest in reading them, and tell you nothing if you don’t.
| Advantages of the ALB’s 5xx model | Disadvantages / gotchas |
|---|---|
| ELB-vs-target split localises the failure instantly | Only if you look — default dashboards blur them into one “5xx” |
| Per-code ELB metrics (502/503/504/500) pinpoint the class | No per-code target metric — you must read the access log |
Access logs carry per-hop timing (the -1 sentinel) |
Off by default; no retroactive logs; S3 + query cost |
Health reason codes explain every 503 |
Requires knowing the reason-code vocabulary |
| Idle timeout is tunable per ALB (1–4000s) | The 60s default silently causes 502 (keep-alive) and 504 |
| Auto-scaling capacity (no CLB surge queue to manage) | Brief 503 possible on massive spikes; needs pre-warm request |
| Slow start + draining smooth deploys | Off by default → scale-out 502s until enabled |
| Desync mitigation protects against HTTP smuggling | strictest can 400 legitimate-but-ambiguous requests |
The through-line: the ALB is observable to the point of being self-diagnosing, but every one of those signals is opt-in. The teams that suffer are the ones who never enabled access logs and never split the CloudWatch metrics, so a 502 is just a 502.
Hands-on lab
You will reproduce a keep-alive 502 on purpose by setting a target’s keep-alive below the ALB idle timeout, confirm it via HTTPCode_ELB_502_Count and the access log, then fix it by raising the server keep-alive — and tear it all down. This is free-tier-friendly (one t3.micro, an ALB, and an S3 bucket for logs), but ⚠️ the ALB itself is not free (roughly ₹1.5–2/hour + LCU), so do the teardown.
Step 0 — Prerequisites
aws sts get-caller-identity            # confirm the account/region
export AWS_REGION=ap-south-1
export VPC=vpc-0abc...                 # a VPC with 2 public subnets in 2 AZs
export SUBNETS="subnet-0aaa subnet-0bbb"
export AMI=$(aws ssm get-parameters --names \
  /aws/service/ami-amazon-linux-latest/al2023-ami-kernel-default-x86_64 \
  --query 'Parameters[0].Value' --output text)
Step 1 — A security group that lets the ALB reach the target
SG=$(aws ec2 create-security-group --group-name alb-lab-sg \
  --description "ALB lab" --vpc-id $VPC --query GroupId --output text)
# allow HTTP from anywhere to the ALB, and ALB->target on 8080 (simplify: same SG)
aws ec2 authorize-security-group-ingress --group-id $SG --protocol tcp --port 80   --cidr 0.0.0.0/0
aws ec2 authorize-security-group-ingress --group-id $SG --protocol tcp --port 8080 --source-group $SG
Step 2 — Launch a target whose keep-alive is deliberately too short
The user-data starts a tiny Python server with keep-alive = 2s — far below the ALB’s 60s idle timeout. This is the bug.
cat > userdata.sh <<'EOF'
#!/bin/bash
dnf -y install python3
cat > /opt/app.py <<'PY'
from http.server import BaseHTTPRequestHandler, ThreadingHTTPServer
class H(BaseHTTPRequestHandler):
    protocol_version = "HTTP/1.1"     # enable keep-alive
    timeout = 2                        # BUG: close idle conns after 2s (< ALB 60s)
    def do_GET(self):
        body=b"ok"
        self.send_response(200); self.send_header("Content-Length",str(len(body)))
        self.end_headers(); self.wfile.write(body)
    def log_message(self,*a): pass
srv=ThreadingHTTPServer(("0.0.0.0",8080),H)
srv.serve_forever()
PY
python3 /opt/app.py &
EOF

INSTANCE=$(aws ec2 run-instances --image-id $AMI --instance-type t3.micro \
  --security-group-ids $SG --subnet-id $(echo $SUBNETS | cut -d' ' -f1) \
  --user-data file://userdata.sh \
  --tag-specifications 'ResourceType=instance,Tags=[{Key=Name,Value=alb-lab}]' \
  --query 'Instances[0].InstanceId' --output text)
aws ec2 wait instance-running --instance-ids $INSTANCE
Step 3 — ALB, target group (with access logs on), listener
# S3 bucket for access logs (needs the ELB service account policy in prod; simplified here)
LOGBUCKET=alb-lab-logs-$RANDOM
aws s3 mb s3://$LOGBUCKET

ALB_ARN=$(aws elbv2 create-load-balancer --name alb-lab \
  --subnets $SUBNETS --security-groups $SG --type application \
  --query 'LoadBalancers[0].LoadBalancerArn' --output text)

# Turn access logs ON (off by default) and confirm idle timeout is 60s
aws elbv2 modify-load-balancer-attributes --load-balancer-arn $ALB_ARN --attributes \
  Key=access_logs.s3.enabled,Value=true Key=access_logs.s3.bucket,Value=$LOGBUCKET \
  Key=idle_timeout.timeout_seconds,Value=60

TG_ARN=$(aws elbv2 create-target-group --name alb-lab-tg --protocol HTTP --port 8080 \
  --vpc-id $VPC --target-type instance --health-check-path / --matcher HttpCode=200 \
  --query 'TargetGroups[0].TargetGroupArn' --output text)
aws elbv2 register-targets --target-group-arn $TG_ARN --targets Id=$INSTANCE

aws elbv2 create-listener --load-balancer-arn $ALB_ARN --protocol HTTP --port 80 \
  --default-actions Type=forward,TargetGroupArn=$TG_ARN

DNS=$(aws elbv2 describe-load-balancers --load-balancer-arns $ALB_ARN \
  --query 'LoadBalancers[0].DNSName' --output text)
Step 4 — Wait for healthy, then drive traffic that triggers the 502
# Wait until the target is healthy
aws elbv2 describe-target-health --target-group-arn $TG_ARN \
  --query 'TargetHealthDescriptions[0].TargetHealth' --output json
# Expected eventually: {"State":"healthy"}

# Hammer with keep-alive so connections sit idle > 2s between reuse, then get reused
for i in $(seq 1 200); do
  curl -s -o /dev/null -w "%{http_code}\n" --keepalive-time 5 http://$DNS/ &
  sleep 0.3
done | sort | uniq -c
Expected output — a mix, with a slice of 502s appearing as the ALB reuses connections the target has already closed:
    182 200
     18 502
Step 5 — Confirm the origin: ELB-generated, not the app
LB_DIM=$(aws elbv2 describe-load-balancers --load-balancer-arns $ALB_ARN \
  --query 'LoadBalancers[0].LoadBalancerArn' --output text | sed 's#.*loadbalancer/##')

aws cloudwatch get-metric-statistics --namespace AWS/ApplicationELB \
  --metric-name HTTPCode_ELB_502_Count --dimensions Name=LoadBalancer,Value=$LB_DIM \
  --start-time "$(date -u -v-10M +%Y-%m-%dT%H:%M:%SZ)" \
  --end-time   "$(date -u +%Y-%m-%dT%H:%M:%SZ)" \
  --period 60 --statistics Sum --query 'Datapoints[].Sum' --output text
# Expected: non-zero  → the ALB generated the 502

aws cloudwatch get-metric-statistics --namespace AWS/ApplicationELB \
  --metric-name HTTPCode_Target_5XX_Count --dimensions Name=LoadBalancer,Value=$LB_DIM \
  --start-time "$(date -u -v-10M +%Y-%m-%dT%H:%M:%SZ)" \
  --end-time   "$(date -u +%Y-%m-%dT%H:%M:%SZ)" \
  --period 60 --statistics Sum --query 'Datapoints[].Sum' --output text
# Expected: empty / 0 → the APP never errored. This is a keep-alive 502.
Give the logs a few minutes to land, then look at a 502 line in S3: you will find elb_status_code 502, target_status_code -, and request_processing_time -1 — the keep-alive fingerprint.
Step 6 — Fix it: raise the server keep-alive above the ALB idle timeout
Change the target’s server keep-alive from 2s to 75s (> the ALB’s 60s). Re-deploy the app (edit /opt/app.py timeout = 75, restart), or replace the instance with corrected user-data. Then re-run Step 4:
200 200
The 502s are gone and HTTPCode_ELB_502_Count flatlines. Same fix in production is server.keepAliveTimeout = 65000 (Node), keepalive_timeout 75 (nginx), or --keep-alive 75 (gunicorn).
Step 7 — Teardown (do this — the ALB costs money)
aws elbv2 delete-listener --listener-arn $(aws elbv2 describe-listeners \
  --load-balancer-arn $ALB_ARN --query 'Listeners[0].ListenerArn' --output text)
aws elbv2 delete-load-balancer --load-balancer-arn $ALB_ARN
sleep 30
aws elbv2 delete-target-group --target-group-arn $TG_ARN
aws ec2 terminate-instances --instance-ids $INSTANCE
aws ec2 wait instance-terminated --instance-ids $INSTANCE
aws ec2 delete-security-group --group-id $SG
aws s3 rb s3://$LOGBUCKET --force
The same, in Terraform
For repeatability, here is the lab as Terraform — note the target group, the access-logs attribute, and the idle timeout made explicit:
resource "aws_lb" "lab" {
  name               = "alb-lab"
  load_balancer_type = "application"
  subnets            = var.subnet_ids
  security_groups    = [aws_security_group.lab.id]
  idle_timeout       = 60                       # the value the app keep-alive must exceed

  access_logs {                                 # OFF by default — turn it on
    bucket  = aws_s3_bucket.logs.id
    enabled = true
  }
}

resource "aws_lb_target_group" "lab" {
  name        = "alb-lab-tg"
  port        = 8080
  protocol    = "HTTP"
  vpc_id      = var.vpc_id
  target_type = "instance"

  health_check {
    path                = "/"
    matcher             = "200"
    interval            = 30
    timeout             = 5
    healthy_threshold   = 5
    unhealthy_threshold = 2
  }

  deregistration_delay = 30      # short for a lab; 300 default in prod
  slow_start           = 30      # ramp new targets to avoid scale-out 502s
}

resource "aws_lb_listener" "http" {
  load_balancer_arn = aws_lb.lab.arn
  port              = 80
  protocol          = "HTTP"
  default_action {
    type             = "forward"
    target_group_arn = aws_lb_target_group.lab.arn
  }
}

resource "aws_lb_target_group_attachment" "lab" {
  target_group_arn = aws_lb_target_group.lab.arn
  target_id        = aws_instance.lab.id
  port             = 8080
}
terraform apply to build, terraform destroy to tear down.
Common mistakes & troubleshooting
This is the playbook. Keep it open during an incident. Each row is symptom (code) → root cause → confirm (the exact metric / access-log field / target-health check) → fix.
| # | Symptom (code) | Root cause | Confirm | Fix |
|---|---|---|---|---|
| 1 | Intermittent 502, rises with load | App keep-alive < ALB idle timeout (60s) | HTTPCode_ELB_502_Count + TargetConnectionErrorCount up; log request_processing_time -1, target_status_code - |
Set app keep-alive > 60s (Node keepAliveTimeout=65000) |
| 2 | 502 on specific routes only | Response headers oversized / malformed | Log sent_bytes 0; app emits big Set-Cookie/Location |
Shrink headers/cookies in the app |
| 3 | 502 with response_processing_time -1 |
App crashed / worker killed mid-response | App logs show OOM/crash; short sent_bytes |
Fix crash; raise memory/worker limits |
| 4 | 502 on an HTTPS target group | Backend TLS handshake failed | 502 only when TG protocol is HTTPS | Fix target cert/cipher, or use HTTP inside the VPC |
| 5 | 503 everywhere, sudden | Zero healthy targets | HealthyHostCount 0; describe-target-health all unhealthy |
Fix health-check path/matcher/port; fix app |
| 6 | 503 after a deploy | Health path changed / matcher wrong | Target.ResponseCodeMismatch; /health returns 302/404/500 |
Restore health path or widen matcher |
| 7 | 503, describe-target-health empty |
No registered targets (ASG detached) | Target list []; ASG target-group attachment missing |
Reattach ASG; register targets |
| 8 | 503, targets unused |
Target group not associated / AZ disabled | Target.NotInUse; ALB subnets vs target AZ mismatch |
Associate group; enable AZ; enable cross-zone |
| 9 | 504 at exactly ~60s | Target slower than idle timeout | Log target_processing_time ≈ 60, target_status_code -; TargetResponseTime high |
Speed up target/DB; raise idle_timeout; go async |
| 10 | 504 with target_processing_time -1 |
SG/NACL drops the response path | VPC Flow Logs REJECT on ephemeral ports | Fix SG egress / NACL ephemeral range |
| 11 | 500/561, app never sees request | Auth action (OIDC/Cognito) failed | Log actions_executed has authenticate, error_reason set |
Fix IdP client/secret/callback; reduce claim size |
| 12 | 460 in logs | Client closed before ALB replied | Log elb_status_code 460, response_processing_time -1 |
Increase client timeout; add retry |
| 13 | 463 in logs | X-Forwarded-For > 30 IPs |
Log elb_status_code 463 |
Cap/strip XFF at the edge |
| 14 | 502/504 burst during scale-out | New targets flooded before warm | 5xx correlates with ASG scaling events | Enable slow_start; warm caches; better health path |
| 15 | 502 during deploy/scale-in | In-flight requests cut by deregistration | 502s spike as targets drain | Raise deregistration_delay; graceful shutdown |
| 16 | App returns 500 but you blame the ALB | Target-generated 5xx | HTTPCode_Target_5XX_Count up; log target_status_code 500 |
Fix the application — the ALB is innocent |
| 17 | 5xx but both ELB & target metrics flat | Failure is upstream (CloudFront/WAF/Route 53) | ALB RequestCount normal; errors only at the edge |
Debug the layer in front of the ALB |
| 18 | Sticky users get 502/503 | Stickiness pinned to a dead target | stickiness.enabled true; that client only |
Shorten stickiness; fix/replace the target |
Beyond the table, three prose notes on the failures that eat the most hours:
“It’s the ALB” when the app returned the 5xx. The most expensive mistake is chasing ALB settings for a target-generated 5xx. If HTTPCode_Target_5XX_Count is the metric moving and target_status_code shows a real 500/502/503, the load balancer did its job perfectly and forwarded your app’s error. No amount of idle-timeout tuning, health-check tweaking, or ALB config will help; the bug is in the application. Split the origin first, always.
Health checks that lie. A health check hitting a static / that returns 200 even when the database is down means the ALB keeps routing to a target that 500s every real request — so you get target-5xx while HealthyHostCount says everything is fine. Conversely, a health check pointed at a heavy endpoint can Target.Timeout under load and pull healthy targets, manufacturing a 503. Point health checks at a lightweight route that genuinely exercises the critical dependencies, and match the matcher to what that route actually returns.
The idle-timeout tug-of-war. The 60-second ALB idle timeout is simultaneously too long for the keep-alive 502 (the target must outlast it) and too short for slow endpoints (which 504 at it). You cannot fix both with one number. The correct posture: keep the ALB at a sane idle timeout, make server keep-alive comfortably longer (75s), and move genuinely slow work off the synchronous path rather than inflating the timeout globally.
Best practices
- Split the origin before anything else.
HTTPCode_ELB_5XX_CountvsHTTPCode_Target_5XX_Countis step one of every incident. It decides whether you debug the ALB path or the app. - Turn on access logs now, not during the incident — there are no retroactive logs. Add the S3 bucket and an Athena table so you can query the timing fingerprint in minutes.
- Alarm on the per-code ELB metrics separately (
HTTPCode_ELB_502_Count,_503_,_504_) and onHTTPCode_Target_5XX_Count, so the page arrives with the origin already identified. - Set server keep-alive above the ALB idle timeout (75s vs 60s) on every target, and add a test that fails if it isn’t — this kills the keep-alive 502 permanently.
- Point health checks at a route that exercises real dependencies, and match the
Matcherto what it returns. A lying health check causes both false 503s and hidden target-5xx. - Enable slow start on target groups behind auto-scaling to prevent scale-out 502/504 bursts.
- Tune deregistration delay to cover your longest in-flight request so deploys and scale-in don’t cut connections (a 502 source).
- Move long work off the synchronous path (202 + poll / queue) instead of raising
idle_timeoutglobally. - Watch
TargetConnectionErrorCountandTargetResponseTimeas leading indicators — connection errors precede 502 storms, response-time creep precedes 504s. - Keep
HealthyHostCountalarmed per AZ; a single-AZ health collapse is a 503 waiting to happen. - Document the origin-split and the code table in the runbook — the fastest incident is one where step one is written down.
The alarm set that makes a 5xx page with the diagnosis attached — each one is cheap and points at a distinct cause:
| Alarm on | Threshold (tune to traffic) | It means | Pages you toward |
|---|---|---|---|
HTTPCode_ELB_5XX_Count |
> 0 sustained 2 min | ALB generated errors | The ALB/target path |
HTTPCode_Target_5XX_Count |
> 0 sustained 2 min | App returned errors | The application |
HTTPCode_ELB_502_Count |
> baseline | Keep-alive / bad response | Server keep-alive |
HTTPCode_ELB_504_Count |
> 0 | Slow targets | Endpoint / DB latency |
HealthyHostCount |
< 1 (per AZ) | 503 imminent | Health check / capacity |
TargetResponseTime p99 |
> SLA | 504 building | Performance |
TargetConnectionErrorCount |
> 0 sustained | Connection failures | Keep-alive / SG |
RejectedConnectionCount |
> 0 | Capacity cap hit | Pre-warm / scale |
Security notes
- Least privilege for reading the signals. The on-call needs
elasticloadbalancing:Describe*,cloudwatch:GetMetric*, and read access to the access-log S3 bucket and its Athena table — nothing that can modify the ALB. Split diagnostic (read) from remediation (write) roles. - Protect the access-log bucket. ALB access logs contain client IPs, user agents, request lines (which may carry query strings), and
trace_ids. Turn on default encryption (SSE-S3 or SSE-KMS), block public access, and apply a lifecycle policy to expire logs — they are PII-adjacent. - Auth-action failures (500/561) are a security signal, not just an availability one. A spike in
error_reasonon theauthenticateaction can mean a misconfigured IdP or an attack against your login flow. Alarm on it and correlate with WAF. - Desync mitigation defends against request smuggling. Keep
routing.http.desync_mitigation_modeatdefensive(default) orstrictest;monitoronly classifies without blocking. Theclassificationfield in the log (Ambiguous/Severe) surfaces smuggling attempts that can manifest as odd 400/5xx. The mode decides what happens to each class:
classification |
monitor |
defensive (default) |
strictest |
|---|---|---|---|
Acceptable |
Forwarded | Forwarded | Forwarded |
Ambiguous |
Forwarded (logged) | Forwarded, connection closed after | Blocked (400) |
Severe |
Forwarded (logged) | Blocked (400) | Blocked (400) |
- Don’t leak internals in error bodies. ELB-generated 5xx return a generic AWS error page (good), but target-generated 5xx can leak stack traces — make the app return sanitized error bodies so a 500 doesn’t hand an attacker your framework and version.
- Put a WAF in front for 5xx amplification. A scraper hammering a slow endpoint turns into a 504 storm and an LCU bill; rate-limit at the edge, as covered for CDN-fronted origins, so abuse dies before it reaches the ALB.
Cost & sizing
The ALB itself is not free, and two of your diagnostic tools (access logs, CloudWatch) add small costs — worth knowing so an incident doesn’t surprise you on the bill.
| Cost driver | How it’s charged | Rough figure (ap-south-1) | Note |
|---|---|---|---|
| ALB hours | Per hour the ALB exists | ~₹1.7/hour (~$0.0225) | Runs 24×7; the fixed base cost |
| LCU-hours | max of new conns, active conns, processed bytes, rule evals | ~₹0.6/LCU-hour (~$0.008) | A 504 storm holding connections inflates active-connection LCUs |
| Access logs (S3) | Storage + PUTs | pennies–₹ per GB | Free to enable; you pay S3 storage/requests |
| Athena queries | Per TB scanned | ~₹360/TB (~$5/TB) | Use partition projection + column filters to keep scans tiny |
| CloudWatch metrics | Standard ALB metrics free; alarms priced | ~₹8/alarm/month (~$0.10) | Alarm on the per-code metrics — cheap insurance |
| Data processing | Included in LCU (bytes dimension) | — | Large responses raise the bytes LCU |
Sizing guidance for avoiding capacity-driven 5xx:
| Concern | Signal to watch | Action |
|---|---|---|
| Connection-cap 503 | RejectedConnectionCount > 0 |
Request pre-warm for known spikes; scale targets |
| LCU cost creep | ActiveConnectionCount, ProcessedBytes |
Cut idle timeout for short requests; compress responses |
| 504 from slow targets holding connections | TargetResponseTime, active-conn LCU |
Async long work; add caching |
| Free-tier relevance | — | The ALB is not in the always-free tier; new accounts get 750 ALB hours + 15 LCUs/month for 12 months |
The single biggest cost lever during a 5xx incident is not to fix a 504 by raising the idle timeout blindly — longer-held connections raise active-connection LCUs across the whole ALB. Fix the slow target instead.
Interview & exam questions
1. What is the single most important first step when an ALB returns 5xx, and why? Compare HTTPCode_ELB_5XX_Count with HTTPCode_Target_5XX_Count. It tells you whether the load balancer generated the error (target couldn’t respond → debug the ALB/target path) or the application generated it and the ALB forwarded it (→ debug the app). It forks the entire investigation and prevents hours of debugging the wrong side. (SOA-C02, SAA-C03)
2. An ALB returns intermittent 502s that scale with traffic; HTTPCode_Target_5XX_Count is zero. What is the likely cause and fix? The keep-alive / idle-timeout mismatch: the target’s keep-alive timeout is shorter than the ALB’s 60s idle timeout, so the ALB reuses a connection the target already closed and gets an RST. Fix by setting the server keep-alive above 60s (e.g. Node keepAliveTimeout = 65000). (SOA-C02, ANS-C01)
3. Distinguish a 502, 503, and 504 in one sentence each. 502 = the ALB reached the target but got an unusable/closed response; 503 = the ALB had nowhere healthy to route (no healthy/registered targets); 504 = the target was reached but didn’t respond within the idle timeout. (SAA-C03)
4. In an ALB access log, what does target_status_code = - combined with target_processing_time = -1 tell you? The ALB never received a usable response from the target and generated the code itself (ELB-generated 5xx), typically a 502 from a closed connection or a 503 with no target selected. A real numeric target_status_code would mean the target returned the code. (SOA-C02)
5. What does HealthyHostCount = 0 produce, and what are the top three causes? A 503 (HTTPCode_ELB_503_Count). Top causes: health-check path/matcher wrong after a deploy (Target.ResponseCodeMismatch), health-check port blocked or app not listening (Target.FailedHealthChecks), or no registered targets (ASG detached). (SOA-C02)
6. When is a 500 from an ALB not an application error? When it comes from an authenticate-oidc/authenticate-cognito action failing — misconfigured IdP, wrong client secret/callback, or oversized claims. The actions_executed field shows authenticate and error_reason is populated; the app never sees the request. Code 561 is the related IdP-error case. (ANS-C01)
7. Why might raising the ALB idle timeout to fix a 504 be the wrong move? Because it papers over a slow target instead of fixing it, holds connections longer (raising active-connection LCU cost), and increases blast radius. The correct fix is usually to speed up the endpoint or make long work asynchronous; raise the timeout only for legitimately long-but-bounded requests, ideally on a dedicated listener. (SAA-C03)
8. What is TargetConnectionErrorCount and which 5xx does it help diagnose? It counts connections the ALB could not successfully establish to targets. It is a leading indicator of 502s (especially the keep-alive variety) and of security-group problems on the ALB→target path. (SOA-C02)
9. How do you confirm whether a 504 is the target being slow versus the network dropping the response? Read target_processing_time: a large positive value near the idle timeout means the target is genuinely slow; -1 means the ALB never got a response at all, pointing at a security-group/NACL drop on the response path — confirm with VPC Flow Logs REJECT entries. (ANS-C01)
10. Why is there no per-code CloudWatch metric for target-generated 5xx? AWS only exposes HTTPCode_Target_5XX_Count at the class level; to see whether the app returned a 500 vs 502 vs 503 you must read target_status_code in the access log. The ELB side does have per-code metrics (502/503/504/500). (SOA-C02)
11. What ALB feature prevents a burst of 502/504 when auto-scaling adds targets, and how? Slow start (slow_start.duration_seconds), which ramps traffic to a newly healthy target over 30–900s instead of immediately sending its full share, giving caches and connection pools time to warm. (SAA-C03)
12. A user reports errors but both HTTPCode_ELB_5XX_Count and HTTPCode_Target_5XX_Count are flat. Where do you look? Upstream of the ALB — CloudFront, WAF, or Route 53 — or the client itself. If RequestCount on the ALB is normal, the failing requests never reached it. (SOA-C02)
Quick check
- Which two CloudWatch metrics do you compare first, and what does each tell you?
- Your access log shows
elb_status_code 502,target_status_code -,request_processing_time -1. What is the bug and the one-line fix? - What target-health reason code means the health check got a response code outside the matcher, and what 5xx does it cause?
- Give the rule relating server keep-alive to the ALB idle timeout.
- When is a 500 from the ALB an identity-provider problem rather than an app problem?
Answers
HTTPCode_ELB_5XX_Count(the ALB generated it — debug the ALB/target path) vsHTTPCode_Target_5XX_Count(the app generated it — debug the application). The comparison decides which side you debug.- The keep-alive 502: the target closed a pooled connection the ALB tried to reuse because its keep-alive is shorter than the ALB’s 60s idle timeout. Fix: set server keep-alive above 60s (e.g. Node
keepAliveTimeout = 65000, nginxkeepalive_timeout 75). Target.ResponseCodeMismatch— it makes the targetunhealthy, and if all targets fail this way the ALB returns 503.- The server’s keep-alive timeout must be greater than the ALB idle timeout (default 60s); otherwise the target closes reused connections first and the ALB returns 502.
- When the 5xx comes from an
authenticate-oidc/authenticate-cognitolistener action failing (the log’sactions_executedshowsauthenticateanderror_reasonis set); code 561 is the related IdP-error signal.
Glossary
- ELB-generated 5xx — an error the ALB produces itself because the target couldn’t respond; counted in
HTTPCode_ELB_5XX_Count, withtarget_status_code = -in the log. - Target-generated 5xx — an error your application returns that the ALB forwards verbatim; counted in
HTTPCode_Target_5XX_Count, with a realtarget_status_code. - Idle timeout — the ALB attribute (
idle_timeout.timeout_seconds, default 60s) after which an idle front or back connection is closed; the number server keep-alive must exceed. - Keep-alive (server) — how long a target holds an idle connection open for reuse; if shorter than the ALB idle timeout, it causes the keep-alive 502.
request_processing_time/target_processing_time/response_processing_time— the three access-log timing fields for the dispatch, wait, and relay hops;-1means the hop never completed.target_status_code— the code the target returned;-means the ALB generated the response.- Target health reason — the
TargetHealth.Reasonfromdescribe-target-health(e.g.Target.ResponseCodeMismatch,Target.FailedHealthChecks) explaining an unhealthy target. - Slow start — a target-group feature that ramps traffic to a newly healthy target gradually to avoid scale-out 502/504.
- Deregistration delay (connection draining) — how long the ALB lets in-flight requests finish on a deregistering target (default 300s) before cutting it.
- LCU (Load Balancer Capacity Unit) — the ALB’s usage-based billing unit (new/active connections, processed bytes, rule evaluations).
- 460 / 463 — client-facing ELB codes: the client closed early (460) or sent more than 30 XFF IPs (463).
- 500 / 561 — ELB codes usually signalling an authenticate-action / identity-provider failure, not an app error.
- Desync mitigation mode — an ALB setting (
monitor/defensive/strictest) that classifies and blocks ambiguous requests to prevent HTTP request smuggling.
Next steps
- Build the thing you just learned to debug: Elastic Load Balancing: ALB & Target Groups Hands-On.
- Understand when an ALB is even the right choice: AWS Load Balancers and API Gateway: ALB, NLB and API Gateway Compared.
- Chase the “silent timeout” layer below the ALB (the 504-that’s-really-a-security-group): Security Groups vs NACLs: A Deep Dive and a Connectivity-Blocking Troubleshooting Guide and the VPC Connectivity Troubleshooting Playbook.
- Own the DNS layer above the ALB: Route 53 Health Checks & DNS Failover: Setup and a Why-Isn’t-It-Failing-Over Playbook.