At 03:12 the primary region degrades. Your load balancer in us-east-1 is throwing connection resets, the dashboards are red, and you feel calm for exactly one reason: you built Route 53 DNS failover for this. You have a PRIMARY record pointing at us-east-1 and a SECONDARY pointing at us-west-2, a health check on the primary, and a runbook that says “do nothing — it fails over automatically.” Ten minutes later traffic is still landing on the dead primary. Users are still erroring. The failover you tested six months ago, once, is not happening. This is the most common — and most infuriating — high-availability incident on AWS, because the machinery is invisible: a health checker somewhere on the public internet is (or isn’t) probing your endpoint, a resolver two networks away is (or isn’t) still handing out the old IP, and the AWS Console cheerfully shows the health check as “Healthy” when your service is anything but.
This is the playbook for that incident. Amazon Route 53 is AWS’s authoritative DNS service, and its health checks are small agents distributed across AWS regions that probe an endpoint, roll their observations into a single healthy/unhealthy verdict, and let a failover routing policy return a different answer when the primary is down. That sounds simple, and the happy path is. The failure modes are not — and they are almost never “Route 53 is broken.” They are TTL caching that outlives your patience, a health check that was never actually associated with the record, an evaluate_target_health flag pointing the wrong way, a security group that silently drops the health-checker probes, an HTTPS check failing an SNI handshake, a string match looking for text that moved past byte 5,120, or a private target that Route 53’s public checkers can never reach. Each has a specific symptom, a specific command that confirms it, and a specific fix.
By the end you will stop staring at a green “Healthy” badge wondering why the phone is still ringing. You will read the failover as a pipeline — client resolver → recursive DNS → Route 53 failover record → health-check verdict → primary/secondary endpoint — and localise the failure to exactly one hop. You will know the three health-check types (endpoint, calculated, CloudWatch-alarm) and when only one of them can even see your target; you will know why detection takes ninety seconds and how to make it thirty; and you will know when to stop trusting inference entirely and flip a deterministic Application Recovery Controller routing control instead. Every diagnosis comes with both an aws CLI command and a Terraform snippet, and the playbook itself is a table you keep open at 03:12.
What problem this solves
DNS failover exists to answer one question automatically: when the thing I named is unreachable, hand callers a different address. Without it, a regional impairment means a human has to notice, decide, and manually re-point a record — minutes to hours of downtime, at 3am, under pressure, exactly when humans are worst. Route 53 health checks turn that into a control loop: probe continuously, and the moment the primary fails, change the answer.
What breaks without a correct setup is worse than having none, because it fails silently and it fails when you’re most exposed. Teams build failover, test it once by stopping a container (which works, because that path is clean), and ship it. Then the real incident is different in some small way — the region degrades rather than dies, the load balancer still accepts TCP but 500s every request, the health-check path happens to be cached, the TTL is 300 seconds instead of 60 — and the failover that “worked in the demo” does nothing. The team burns the outage manually re-pointing DNS, which is the exact thing they paid to avoid, and then can’t explain to the post-mortem why the automation didn’t fire.
Who hits this: anyone running active-passive or active-active across regions or across on-prem-plus-cloud; anyone fronting an ALB, NLB, CloudFront, S3 website or API Gateway with a failover record; anyone who has ever written the sentence “Route 53 will handle it.” It bites hardest on three groups — teams with alias records (the evaluate_target_health trap is near-universal), teams with private or on-prem targets (endpoint checks physically cannot reach them), and teams with strict network security (their own security groups and WAFs block the checkers that are supposed to save them).
To frame the whole field before the deep dive, here is every symptom class this article covers, what it really means, and the first place to look:
| Symptom class | What’s actually happening | First question to ask | First place to look | Most common single cause |
|---|---|---|---|---|
| Primary dead, traffic still lands on it | Route 53 flipped, but callers cached the old IP | Did the answer change, or just the client’s cache? | dig +noall +answer app.example.com (watch TTL) |
TTL too high (300s+) on the failover record |
| Health check “Healthy” but service is down | The check passes a path/port that isn’t the real health | Is the check testing what users test? | aws route53 get-health-check-status |
Shallow path (/) or checking TCP not HTTP |
| Health check flapping / falsely unhealthy | Checkers can’t reach a healthy endpoint | Can the checker IPs actually connect? | get-checker-ip-ranges vs SG/NACL/WAF |
Security group blocks the Route 53 CIDRs |
| Primary unhealthy but no failover | The verdict never reaches the record | Is the health check associated with the record? | list-resource-record-sets (HealthCheckId) |
Health check not attached, or ETH=false |
| Failover slow (60–120s+) | It IS working — just at DNS speed | Interval × threshold + TTL = how long? | health-check config + record TTL | Standard 30s interval × 3 + 60s TTL |
| Private/on-prem target never healthy | Public checkers can’t route to a private IP | Is the target reachable from the internet? | Target has a public path? | Endpoint check on a private ALB |
Learning objectives
By the end of this article you can:
- Configure all three Route 53 health-check types — endpoint (HTTP/HTTPS/TCP), calculated, and CloudWatch-alarm — and choose the only one that can see a given target.
- Build active-passive (failover) and active-active (weighted/latency/multivalue + health checks) DNS topologies with
awsCLI and Terraform, and explain exactly how Route 53 decides which record to return. - Explain the alias
evaluate_target_healthinteraction and diagnose the single most common cause of “no failover” from the record configuration alone. - Compute failover detection time from request interval, failure threshold and the 18%-of-checkers rule, and cut it from ~90s to ~30s deliberately.
- Fetch and allow the health-checker source IP ranges so security groups, NACLs and WAFs stop making a healthy endpoint look dead.
- Diagnose HTTPS SNI/certificate failures, string-match mismatches, shallow-path false positives, and public-only-checker limits — each with the exact confirming command.
- Fail over deterministically with Application Recovery Controller routing controls when health-check inference is too slow or unreliable during a large event.
- Run the playbook: map any “why isn’t it failing over” symptom to a root cause, a confirming command, and a fix.
Prerequisites & where this fits
You should know DNS basics: A/AAAA/CNAME records, what a TTL (time to live) does to caching, that resolvers are recursive and cache answers, and that a hosted zone in Route 53 holds your records. You should be comfortable with the AWS CLI (aws route53, aws cloudwatch), reading JSON output, and the idea of an ALB/NLB target group with its own health checks (distinct from Route 53’s). Terraform familiarity helps — every operation here has an aws_route53_* resource.
This sits in the Networking / High Availability track, downstream of routing-policy fundamentals and upstream of full multi-region design. Route 53 failover is one mechanism inside a bigger resilience story: it re-points names, but it does not replicate your data, warm your standby, or drain connections — those belong to the application and data tiers. Pair this with an active-active data design (AWS Multi-Region Active-Active Architecture: Route 53, Global Tables and Aurora Global Database) and a recovery strategy for the state behind the endpoints (AWS Backup and Disaster Recovery: Protect Workloads Across Regions). A companion piece on Route 53 record types and routing policies, and one on ALB 5xx troubleshooting, are natural neighbours to this article.
A quick map of who owns which hop, so during an incident you call the right person and open the right console:
| Layer | What lives here | Who usually owns it | Failure classes it causes |
|---|---|---|---|
| Client / app resolver | OS + app DNS cache, connection reuse | App / frontend team | Stale IP after failover (client-side TTL) |
| Recursive resolver (ISP/8.8.8.8) | Caches the answer for the TTL | Out of your control | Slow failover; can’t be flushed on demand |
| Route 53 hosted zone | Records, failover policy, TTL | Platform / networking | Wrong record config, ETH flag, missing HC association |
| Health check (endpoint) | Public checker fleet probing your endpoint | Platform / networking | False unhealthy (blocked IPs), false healthy (shallow path) |
| Health check (calculated / CloudWatch) | Combines children / reads an alarm | Platform + observability | Alarm mis-scoped; InsufficientData handling |
| Target endpoint (ALB/NLB/EC2/API) | The thing being probed | App / platform | Real outage, SNI/cert, private-only reachability |
Core concepts
Six mental models make every later diagnosis obvious.
A health check evaluates an endpoint; a routing policy uses that verdict to change an answer. These are two separate objects. The health check (aws_route53_health_check) has its own ID and lives independently — it probes and produces a healthy/unhealthy verdict, visible whether or not any record uses it. The record (aws_route53_record) references that verdict via HealthCheckId (or, for aliases, evaluate_target_health). The number-one “no failover” bug is a perfectly working health check that no record is actually wired to — the verdict has nowhere to go.
Route 53 fails open, deliberately. If every record in a failover or multivalue group is unhealthy, Route 53 does not return NXDOMAIN — it treats them all as healthy and answers anyway, so a broken health check can’t black-hole your whole domain. This is a safety feature and a trap: a misconfigured check that marks everything unhealthy looks like it’s “doing nothing,” because fail-open hands back the primary as if it were fine.
Detection is a control loop with a clock. A distributed fleet of checkers probes your endpoint every request interval (30s standard, or 10s “fast”). An individual checker declares the endpoint down after failure threshold consecutive failures (default 3). Route 53 aggregates the fleet: if more than 18% of checkers report healthy, the endpoint is healthy. Then the new status must propagate to the DNS answer. So the floor on failover is roughly interval × threshold (≈90s standard, ≈30s fast) before any client even asks again.
TTL is the second clock, and it’s on the client’s wrist, not yours. Route 53 changes the authoritative answer the instant it marks the primary down. But recursive resolvers and clients cached the old answer for its TTL, and they will keep using the dead IP until that TTL expires — Route 53 cannot reach out and flush them. Total user-visible failover time is detection + TTL + client behaviour. A 300-second TTL means five extra minutes of outage no health check can shorten.
Alias records don’t have a TTL you set, and their health follows the target — if you let it. An alias is a Route 53-specific pointer to an AWS resource (ELB, CloudFront, S3 website, another record). It has no editable TTL (Route 53 uses the target’s, often 60s for ELB) and it has a special flag, evaluate_target_health: when true on an ELB alias, the record’s health follows the ELB’s target-group health automatically. When false (the default in many templates) and with no explicit health check attached, the alias is always considered healthy — which is exactly why failover silently never fires.
Route 53’s checkers live on the public internet. Endpoint health checks originate from AWS-owned IP ranges out on the internet — they resolve or connect to your FQDN/IP from outside. They cannot reach a private ALB, an instance with only a private IP, or an on-prem box behind a firewall. For anything not publicly reachable, an endpoint check is the wrong tool; you use a CloudWatch-alarm health check instead, which reads an alarm state rather than dialling the endpoint.
The vocabulary in one table
Pin down every moving part before the deep sections. The glossary repeats these for lookup; this is the mental model side by side:
| Concept | One-line definition | Where it lives | Why it matters to failover |
|---|---|---|---|
| Hosted zone | Container for a domain’s records | Route 53 | Where failover records and TTLs live |
| Health check | An agent’s verdict on an endpoint/alarm | Route 53 (own ID) | The signal; useless until a record uses it |
| Endpoint check | Probes HTTP/HTTPS/TCP from the internet | Public checker fleet | Can’t see private/on-prem targets |
| Calculated check | Boolean over child checks | Route 53 | Combine “any 1 of 3 AZs up” logic |
| CloudWatch check | Mirrors a CloudWatch alarm state | Route 53 + CloudWatch | The only way to health-check private targets |
| Failover record | PRIMARY / SECONDARY pair, same name | Route 53 record | The active-passive mechanism |
evaluate_target_health |
Alias follows target’s own health | Alias record | false + no HC = always healthy = no failover |
| Request interval | Seconds between probes (30 or 10) | Health-check config | Half of the detection-time equation |
| Failure threshold | Consecutive fails before “unhealthy” | Health-check config | The other half; default 3 |
| 18% rule | >18% of checkers healthy ⇒ healthy | Aggregation logic | Why a few blocked checkers don’t flip it |
| TTL | Seconds resolvers cache the answer | Record (non-alias) | The delay you can’t flush; keep it low |
| Fail-open | All-unhealthy ⇒ treated all-healthy | Route 53 behaviour | Broken checks look like “nothing happens” |
| Routing control | Deterministic on/off switch (ARC) | Application Recovery Controller | Fail over without trusting inference |
The three health-check types at a glance
Every health check is exactly one of three types. Picking the wrong type is the difference between a check that can see your target and one that structurally cannot:
| Type | What it does | Can see private targets? | Typical use | API Type values |
|---|---|---|---|---|
| Endpoint | Probes an HTTP/HTTPS/TCP endpoint from the public internet | No | Public ALB/NLB/EC2/website | HTTP, HTTPS, HTTP_STR_MATCH, HTTPS_STR_MATCH, TCP |
| Calculated | Combines up to 256 child health checks with a threshold | Inherits children | “Healthy if ≥1 of 3 AZ checks pass” | CALCULATED |
| CloudWatch alarm | Mirrors the state of a CloudWatch alarm | Yes (via metrics) | Private ALB, RDS, queue depth, custom metric | CLOUDWATCH_METRIC |
| Recovery control | Reflects an ARC routing-control state | Yes (deterministic) | Deliberate, human/automation-driven failover | RECOVERY_CONTROL |
Route 53 health checks are not your load balancer’s health checks
Two different systems probe your endpoint, and conflating them causes real outages (the Meridian scenario below hinges on exactly this). Your ALB/NLB target-group health check decides which targets the load balancer sends traffic to within a region; the Route 53 health check decides which region/record DNS hands out. One can say “healthy” while the other should say “down”:
| Aspect | Route 53 health check | ALB/NLB target-group health check |
|---|---|---|
| Scope | Which DNS record/region to return | Which targets in a group get traffic |
| Runs from | Public AWS checker fleet (internet) | The load balancer, inside the VPC |
| Sees private targets? | No (endpoint type) | Yes (it’s inside the VPC) |
| Drives | DNS failover / weighted / latency | In-region target rotation |
Alias evaluate_target_health |
Can follow the ALB’s result | Is the result being followed |
| Typical trap | Shallow Route 53 check masks a bad region | Shallow ALB / masks bad backends |
| You still need both | Yes — regional failover | Yes — in-region health |
Health check types, end to end
This is the depth anchor. Each type has its own settings, defaults, limits and gotchas — go option by option.
Endpoint health checks (HTTP / HTTPS / TCP)
An endpoint check tells the fleet to connect to FullyQualifiedDomainName (or a static IPAddress) on a Port, optionally request a ResourcePath, and judge the response. The full option set, with defaults and the trade-off for each:
| Setting | Values | Default | When to change | Trade-off / gotcha |
|---|---|---|---|---|
Type |
HTTP / HTTPS / HTTP_STR_MATCH / HTTPS_STR_MATCH / TCP |
none (required) | Match your protocol | TCP checks only that the port opens — not that the app works |
IPAddress |
Static IPv4/IPv6 | unset | Fixed IP; avoids checker-side DNS | If unset, checkers resolve the FQDN themselves |
FullyQualifiedDomainName |
DNS name | unset | Named endpoints; sets HTTP Host/SNI |
Must resolve to the real endpoint, not the failover record (loop) |
Port |
1–65535 | 80 (HTTP) / 443 (HTTPS) | Non-standard ports | Must be open to the checker CIDRs |
ResourcePath |
e.g. /health |
/ |
Always set a real health path | / often returns 200 while the app is broken |
RequestInterval |
30 or 10 | 30 | 10 for fast detection | 10s “fast” is a paid feature |
FailureThreshold |
1–10 | 3 | 2 for faster, higher for flap-resistance | Lower = jumpier; higher = slower |
MeasureLatency |
true/false | false | Want CloudWatch latency metrics | Paid feature; immutable after create |
Inverted |
true/false | false | Health means “string absent” etc. | Flips the verdict — easy to confuse |
Disabled |
true/false | false | Pause a check without deleting | Disabled check is treated as healthy |
EnableSNI |
true/false | true (HTTPS) | Endpoint needs SNI (most do) | Off ⇒ TLS handshake may fail on shared hosts |
SearchString |
≤255 chars | unset | *_STR_MATCH types only |
Only the first 5,120 response bytes are searched |
Regions |
≥3 of the checker regions | all | Restrict checker geography | Fewer regions ⇒ blunter 18% math |
HealthThreshold |
1–256 | n/a | Calculated only | For CALCULATED type |
The strict response-timing contract is what makes “it works in my browser but the check fails” real — the checkers are less patient than you are:
| Check type | Must establish TCP within | Must get a valid response within | Counts as failure when |
|---|---|---|---|
| HTTP | 4 seconds | HTTP 2xx/3xx within 2s of connecting | Timeout, 4xx/5xx, or reset |
| HTTPS | 4 seconds (+ TLS handshake) | 2xx/3xx within 2s after TLS | TLS handshake fails, or bad status |
| HTTP/HTTPS_STR_MATCH | 4 seconds | Body with the string in first 5,120 bytes | String absent in that window |
| TCP | 10 seconds | (connection established = healthy) | Port closed/filtered/timeout |
Which endpoint subtype to pick, and what each one actually verifies versus misses — the depth ladder from “port opens” to “the body is correct”:
| Subtype | Verifies | Misses | Pick when |
|---|---|---|---|
TCP |
The port accepts a connection | Everything above L4 — the app can be 500ing | Non-HTTP service, or you only care the port is open |
HTTP |
A 2xx/3xx on the path over port 80 | TLS/cert health; response body correctness | Plain-HTTP endpoint with a real health path |
HTTPS |
TLS handshake + 2xx/3xx on 443 | Response body correctness | The real path callers use (recommended default) |
HTTP_STR_MATCH |
2xx/3xx and a string in the body | TLS health | You need to confirm content, not just status, over HTTP |
HTTPS_STR_MATCH |
TLS + 2xx/3xx + string in the body | Nothing at L4–L7 you configured | The deepest public check — status, TLS, and content |
Request interval × failure threshold is your detection budget. The combinations and what they cost you in seconds:
| Interval | Failure threshold | Approx. time to “unhealthy” | Cost note | When to use |
|---|---|---|---|---|
| 30s (standard) | 3 (default) | ~90s | Cheapest | Default; tolerant of blips |
| 30s | 2 | ~60s | Cheapest | Slightly faster, a bit jumpier |
| 30s | 1 | ~30s | Cheapest | Fast but flaps on a single blip |
| 10s (fast) | 3 | ~30s | Fast-interval surcharge | Good balance for critical paths |
| 10s | 2 | ~20s | Fast-interval surcharge | Aggressive detection |
| 10s | 1 | ~10s | Fast-interval surcharge | Fastest; reserve for very stable endpoints |
Create an HTTPS endpoint check with a real path, fast interval and latency metrics — CLI then Terraform:
aws route53 create-health-check \
  --caller-reference "primary-$(date +%s)" \
  --health-check-config '{
    "Type":"HTTPS",
    "FullyQualifiedDomainName":"origin-use1.example.com",
    "Port":443,
    "ResourcePath":"/healthz",
    "RequestInterval":10,
    "FailureThreshold":3,
    "MeasureLatency":true,
    "EnableSNI":true,
    "Regions":["us-east-1","us-west-2","eu-west-1"]
  }'
resource "aws_route53_health_check" "primary" {
  fqdn              = "origin-use1.example.com"
  type              = "HTTPS"
  port              = 443
  resource_path     = "/healthz"
  request_interval  = 10          # fast (paid); 30 = standard
  failure_threshold = 3
  measure_latency   = true        # immutable after create
  enable_sni        = true
  regions           = ["us-east-1", "us-west-2", "eu-west-1"]
  tags = { Name = "primary-use1-https" }
}
The ResourcePath design is where shallow checks hide outages. What to include and never include in a health path:
| Return 200 when… | Include in the check | Never include |
|---|---|---|
| The process is up and can serve | In-process readiness (config loaded, pool warm) | A slow report/aggregate query |
| A required dependency is reachable | A fast, cached DB/dependency ping | An external third-party API you don’t control |
| This node can serve a real request | A cheap synthetic call | Anything that can itself hang |
| — | — | Optional/best-effort downstreams (cache, search) |
Calculated health checks
A calculated health check has no endpoint of its own — it combines up to 256 child health checks with a HealthThreshold: “healthy if at least N children are healthy.” Use it to express real availability logic — “the region is up if any 2 of its 3 AZ endpoints are up” — and to avoid one AZ blip flipping the whole record.
| Setting | Values | Meaning | Gotcha |
|---|---|---|---|
ChildHealthChecks |
list of HC IDs (≤256) | The children to combine | Children must already exist |
HealthThreshold |
0–256 | Min healthy children to be healthy | 0 ⇒ always healthy (rarely what you want) |
Inverted |
true/false | Flip the calculated result | Confusing; document it |
Type |
CALCULATED |
Marks it calculated | No interval/path here |
resource "aws_route53_health_check" "region_use1" {
  type                   = "CALCULATED"
  child_health_checks    = [
    aws_route53_health_check.az_a.id,
    aws_route53_health_check.az_b.id,
    aws_route53_health_check.az_c.id,
  ]
  child_health_threshold = 2      # healthy if any 2 of 3 AZs are up
  tags = { Name = "use1-region-2of3" }
}
CloudWatch-alarm health checks
A CloudWatch-alarm health check mirrors an alarm: the health check is healthy when the alarm is OK and unhealthy when the alarm is ALARM. This is the only health check that can reflect a private target’s health — you alarm on a metric the target emits (ALB HealthyHostCount, RDS DatabaseConnections, SQS ApproximateNumberOfMessagesVisible, or a custom app metric) and the health check follows it. It also lets you express health no endpoint probe can, like “queue backlog < 1000.”
The critical knob is InsufficientDataHealthStatus — what the check reports when the alarm has no data (a brand-new alarm, or metrics stopped flowing):
InsufficientDataHealthStatus |
Behaviour on INSUFFICIENT_DATA |
When to pick it |
|---|---|---|
Healthy |
Treat as healthy (fail-open) | Avoid false failover on a metric gap |
Unhealthy |
Treat as unhealthy (fail-closed) | A data gap is a problem worth failing over |
LastKnownStatus |
Keep the previous verdict | Ride out brief metric gaps without flipping |
# 1) Alarm on the private ALB's healthy host count (region where the ALB lives)
aws cloudwatch put-metric-alarm --region us-east-1 \
  --alarm-name "alb-use1-healthy-hosts" \
  --namespace AWS/ApplicationELB --metric-name HealthyHostCount \
  --dimensions Name=LoadBalancer,Value=app/int-alb/50dc... Name=TargetGroup,Value=targetgroup/tg/abcd... \
  --statistic Minimum --period 60 --evaluation-periods 2 \
  --threshold 1 --comparison-operator LessThanThreshold \
  --treat-missing-data breaching

# 2) Health check that mirrors that alarm
aws route53 create-health-check --caller-reference "priv-alb-$(date +%s)" \
  --health-check-config '{
    "Type":"CLOUDWATCH_METRIC",
    "AlarmIdentifier":{"Region":"us-east-1","Name":"alb-use1-healthy-hosts"},
    "InsufficientDataHealthStatus":"LastKnownStatus"
  }'
resource "aws_route53_health_check" "private_alb" {
  type                            = "CLOUDWATCH_METRIC"
  cloudwatch_alarm_name           = aws_cloudwatch_metric_alarm.alb_healthy_hosts.alarm_name
  cloudwatch_alarm_region         = "us-east-1"
  insufficient_data_health_status = "LastKnownStatus"
  tags = { Name = "private-alb-via-alarm" }
}
Picking the type — the decision table
Match the target to the only type that can actually judge it:
| If your target is… | Use this type | Because |
|---|---|---|
| A public ALB/NLB/EC2/website | Endpoint (HTTP/HTTPS) | Checkers can reach it and test a real path |
| A public endpoint where “up” means specific text | Endpoint *_STR_MATCH |
Confirms the body, not just a 200 |
| A raw TCP service (SMTP, custom port) | Endpoint TCP |
No HTTP semantics to test |
| Multiple endpoints with “N of M” logic | Calculated | Combines children with a threshold |
| A private ALB/instance/on-prem box | CloudWatch alarm | Public checkers can’t route to it |
| Database/queue/custom metric health | CloudWatch alarm | There’s no HTTP endpoint to probe |
| Deliberate, instant, human-controlled failover | Recovery control (ARC) | Deterministic, not inferred |
Failover routing: how a record is marked unhealthy
Failover routing is the active-passive mechanism. You create two records with the same name and type, one with Failover=PRIMARY and one with Failover=SECONDARY, each with a set_identifier. Route 53 returns the primary while its health check is healthy, and switches to the secondary the moment the primary is unhealthy. The mechanics:
| Element | Requirement | What happens if you get it wrong |
|---|---|---|
| Same name + type | Both records identical name/type | Different names ⇒ two unrelated records, no failover |
set_identifier |
Unique per record in the group | Duplicate ⇒ API rejects the change |
Failover role |
Exactly one PRIMARY, one SECONDARY | Two PRIMARY ⇒ invalid; no SECONDARY ⇒ nothing to fail to |
| Primary health signal | A HealthCheckId or alias evaluate_target_health=true |
Neither ⇒ primary always healthy ⇒ never fails over |
| Secondary health signal | Optional but recommended | Unhealthy secondary + fail-open ⇒ still returns it |
Active-passive is one shape; here’s how it compares to the active-active options and when each is right:
| Topology | Routing policy | Health checks | Traffic split | Use when |
|---|---|---|---|---|
| Active-passive | Failover (PRIMARY/SECONDARY) | On primary (and secondary) | 100% primary until it fails | Warm standby; simplest DR |
| Active-active (weighted) | Weighted + HC per record | On every record | By weight; unhealthy dropped | Blue/green, gradual shift |
| Active-active (latency) | Latency + HC per record | On every record | Nearest healthy region | Global low-latency apps |
| Active-active (multivalue) | Multivalue answer + HC | On every record | Up to 8 healthy IPs returned | Simple client-side spread |
| Geolocation/Geoproximity | Geo + HC + failover fallback | On regional records | By client location | Compliance/geo routing |
How Route 53 turns the health verdict into an answer, for a failover pair:
| Primary health | Secondary health | Route 53 returns | Note |
|---|---|---|---|
| Healthy | Healthy | Primary | Normal steady state |
| Unhealthy | Healthy | Secondary | The failover you want |
| Healthy | Unhealthy | Primary | Secondary’s state is irrelevant while primary is up |
| Unhealthy | Unhealthy | Primary (fail-open) | Nothing healthy ⇒ returns primary anyway |
| Healthy | (no secondary) | Primary | You lose the safety net if you omit it |
Create the failover pair (non-alias A records to two EIPs), CLI then Terraform:
# PRIMARY A record, gated by the primary health check, 60s TTL
aws route53 change-resource-record-sets --hosted-zone-id Z123EXAMPLE \
  --change-batch '{
    "Changes":[{
      "Action":"UPSERT",
      "ResourceRecordSet":{
        "Name":"app.example.com","Type":"A","TTL":60,
        "SetIdentifier":"primary","Failover":"PRIMARY",
        "HealthCheckId":"'"$PRIMARY_HC_ID"'",
        "ResourceRecords":[{"Value":"52.20.10.10"}]
      }
    }]
  }'
resource "aws_route53_record" "primary" {
  zone_id        = aws_route53_zone.main.zone_id
  name           = "app.example.com"
  type           = "A"
  ttl            = 60
  set_identifier = "primary"
  failover_routing_policy { type = "PRIMARY" }
  health_check_id = aws_route53_health_check.primary.id
  records         = ["52.20.10.10"]
}

resource "aws_route53_record" "secondary" {
  zone_id        = aws_route53_zone.main.zone_id
  name           = "app.example.com"
  type           = "A"
  ttl            = 60
  set_identifier = "secondary"
  failover_routing_policy { type = "SECONDARY" }
  health_check_id = aws_route53_health_check.secondary.id
  records         = ["34.210.20.20"]
}
The total user-visible failover time is the sum of both clocks — detection (interval × threshold) plus the TTL callers cached. This is the table to reason with when someone asks “how fast does it fail over?”:
| Interval × threshold | Record TTL | Approx. detection | Worst-case cache wait | Total failover (typical) | Use for |
|---|---|---|---|---|---|
| 30s × 3 (standard) | 300s | ~90s | up to 300s | ~2–6.5 min | Legacy default — too slow for tier-1 |
| 30s × 3 | 60s | ~90s | up to 60s | ~1.5–2.5 min | Reasonable general default |
| 10s × 3 (fast) | 60s | ~30s | up to 60s | ~1–1.5 min | Good tier-1 balance |
| 10s × 2 (fast) | 30s | ~20s | up to 30s | ~30–50s | Aggressive; stable endpoints only |
| ARC routing control | 60s | instant (deliberate flip) | up to 60s | ~1 min, deterministic | Tier-1 grey failures |
Deterministic failover with Application Recovery Controller
When a region degrades rather than cleanly dies, endpoint inference gets unreliable — the ALB may still answer the checkers from the outside while every real request fails inside. Application Recovery Controller (ARC) replaces inference with a routing control: an on/off switch, backed by a five-Region cluster with a highly available data plane, that you flip (by hand or automation) to force failover. You wire it to Route 53 with a RECOVERY_CONTROL health check that reflects the routing-control state. Flip the control Off and the health check goes unhealthy deterministically — no waiting on 18% math, no hoping the probe agrees with reality.
resource "aws_route53_health_check" "primary_arc" {
  type                = "RECOVERY_CONTROL"
  routing_control_arn = aws_route53recoverycontrolconfig_routing_control.primary.arn
  tags = { Name = "primary-arc-routing-control" }
}
ARC’s value is a data plane that stays up when the control plane doesn’t — you can toggle failover during exactly the large-scale event when the normal Route 53 console might be stressed. Use it for tier-1 systems where “the health check disagreed with reality” is unacceptable.
Alias records and evaluate_target_health
This is the single most common cause of “no failover,” so it gets its own section. An alias record points at an AWS resource. Whether the alias is considered healthy depends on evaluate_target_health (ETH) — and ETH means different things for different target types, and is not even allowed for some:
| Alias target | ETH supported? | If ETH=true | If ETH=false | For failover you must… |
|---|---|---|---|---|
| ALB / NLB / CLB | Yes | Follows the LB’s target-group health | Always healthy | Set ETH=true, or attach a health check |
| S3 website endpoint | No (always healthy) | n/a | Always healthy | Attach an explicit health check |
| CloudFront distribution | No | n/a | Always healthy | Attach an explicit health check |
| API Gateway (edge) | No | n/a | Always healthy | Attach an explicit health check |
| Global Accelerator | No | n/a | Always healthy | Attach an explicit health check |
| VPC interface endpoint | Yes | Follows endpoint health | Always healthy | Set ETH=true |
| Another record in same zone | Yes | Follows that record’s health | Uses its own value | Point at a health-checked record |
The interaction that trips everyone: when you attach both a HealthCheckId and evaluate_target_health=true to an alias, both must be healthy for the record to be healthy (logical AND). And when you attach neither to an alias whose target doesn’t support ETH (CloudFront, S3, API GW), the record is always healthy — failover is structurally impossible.
| Alias config | HealthCheckId | ETH | Effective health | Failover works? |
|---|---|---|---|---|
| ELB alias, ETH on | none | true | ELB target-group health | Yes |
| ELB alias, HC only | set | false | The health check | Yes |
| ELB alias, both | set | true | HC AND ELB health | Yes (stricter) |
| ELB alias, neither | none | false | Always healthy | No |
| CloudFront/S3 alias, HC attached | set | false (forced) | The health check | Yes |
| CloudFront/S3 alias, nothing | none | false | Always healthy | No |
# ELB alias PRIMARY that follows the ALB's own target health — the clean pattern
resource "aws_route53_record" "primary_alias" {
  zone_id        = aws_route53_zone.main.zone_id
  name           = "app.example.com"
  type           = "A"
  set_identifier = "primary"
  failover_routing_policy { type = "PRIMARY" }
  alias {
    name                   = aws_lb.primary.dns_name
    zone_id                = aws_lb.primary.zone_id
    evaluate_target_health = true   # <-- the flag that makes failover real
  }
}
Confirm the flag on a live record from the CLI — this one command settles most “why no failover” arguments:
aws route53 list-resource-record-sets --hosted-zone-id Z123EXAMPLE \
  --query "ResourceRecordSets[?Name=='app.example.com.'].{Set:SetIdentifier,Failover:Failover,HC:HealthCheckId,Alias:AliasTarget.EvaluateTargetHealth}" \
  --output table
The health-checker fleet and the IPs you must allow
Endpoint checks come from a fleet of AWS-owned public IPs spread across regions. If your own security controls drop those probes, a perfectly healthy endpoint reads unhealthy — the “stuck failover” that has nothing to do with your app. Fetch the current ranges; they change, so automate this rather than hard-coding:
# Authoritative source #1: the Route 53 API returns checker CIDR ranges
aws route53 get-checker-ip-ranges --output text

# Authoritative source #2: the global ip-ranges.json, filtered to the service
curl -s https://ip-ranges.amazonaws.com/ip-ranges.json \
  | jq -r '.prefixes[] | select(.service=="ROUTE53_HEALTHCHECKS") | .ip_prefix'
The checkers are spread across AWS regions; you can restrict which ones probe you via the Regions setting (minimum 3), which also sharpens or blunts the 18% math. The regions the fleet draws from, and what restricting them does:
| Checker region | Role in the fleet | Restrict when | Effect of excluding it |
|---|---|---|---|
us-east-1 (N. Virginia) |
Default checker + where HC metrics live | Rarely — keep it | Lose a core checker and the metric home region |
us-west-1 / us-west-2 |
West-coast probing | Geo/compliance limits | Fewer US vantage points |
eu-west-1 (Ireland) |
European vantage | Non-EU-only apps | Blind to EU-path issues |
ap-southeast-1/2, ap-northeast-1 |
Asia-Pacific vantage | Non-APAC apps | Blind to APAC-path issues |
sa-east-1 (São Paulo) |
South America vantage | Non-LATAM apps | Blind to LATAM-path issues |
| Fewer than all | You picked ≥3 regions | Reduce probe load / geo rules | Blunter 18% aggregation; fewer perspectives |
Then allow them to your health-check port. In Terraform, drive a security group straight from the data source so it self-updates:
data "aws_ip_ranges" "r53_health" {
  services = ["route53_healthchecks"]
}

resource "aws_security_group_rule" "allow_r53_health" {
  type              = "ingress"
  security_group_id = aws_security_group.alb.id
  from_port         = 443
  to_port           = 443
  protocol          = "tcp"
  cidr_blocks       = data.aws_ip_ranges.r53_health.cidr_blocks
  description       = "Route 53 health checkers -> ALB 443"
}
Everything that can silently drop the checkers, and how each shows up:
| Blocker | How it drops the probe | How to confirm | Fix |
|---|---|---|---|
| Security group | No ingress rule for checker CIDRs on the port | Flow logs show REJECT from checker IPs | Allow ROUTE53_HEALTHCHECKS on the port |
| Network ACL | Subnet-level deny (stateless — need return rule too) | NACL rules vs checker CIDRs | Allow inbound and ephemeral outbound |
| AWS WAF | Rule blocks the checker IPs/User-Agent | WAF sampled requests show BLOCK | Allow-list the checker CIDRs above the block rule |
| Geo/CDN rules | Country block hits a checker region | Which checker regions fail in status | Include checker regions, or restrict Regions |
| Rate limiting | Frequent probes trip a per-IP limit | 429s to checker IPs | Exempt the checker CIDRs |
| On-prem firewall | Corporate FW drops public probes | Firewall logs | Allow the CIDRs, or use a CloudWatch check |
Host/SNI filtering |
Vhost rejects the checker’s Host header | Server logs show 404/403 for the FQDN | Set FullyQualifiedDomainName to the served vhost |
Architecture at a glance
The diagram traces the failover exactly as it runs, then pins each “why isn’t it failing over” cause to the hop where it bites. Read it left to right: a client resolves app.example.com through its recursive resolver, which caches the answer for the record’s TTL (badge 1 — the delay you can’t flush). The query reaches the Route 53 failover record; if it’s an alias, its health is governed by evaluate_target_health (badge 2 — the flag that, set wrong, makes the primary look permanently healthy). Route 53’s verdict comes from the health-check fleet — the public checkers probing your endpoint every 30s or 10s, aggregated by the 18% rule (badge 3 — interval × threshold is why detection takes ~90s) — or, for private targets, from a CloudWatch alarm (badge 5). The checkers hit the primary ALB in us-east-1, whose security group must allow the checker CIDRs or a healthy endpoint reads down (badge 4). When the primary is genuinely unhealthy it’s marked UNHEALTHY after the threshold, and Route 53 answers with the secondary ALB in us-west-2 — which callers only reach once their cached TTL expires. For a large regional event, badge 6 swaps inference for an ARC routing control.
The whole method lives in this picture: localise the symptom to a hop, read the badge, run the confirming command in the playbook, apply the fix. The first question on every incident is “did the answer change, or just the client’s cache?” — dig the record and dig from a fresh resolver, and the hop that’s lying reveals itself.
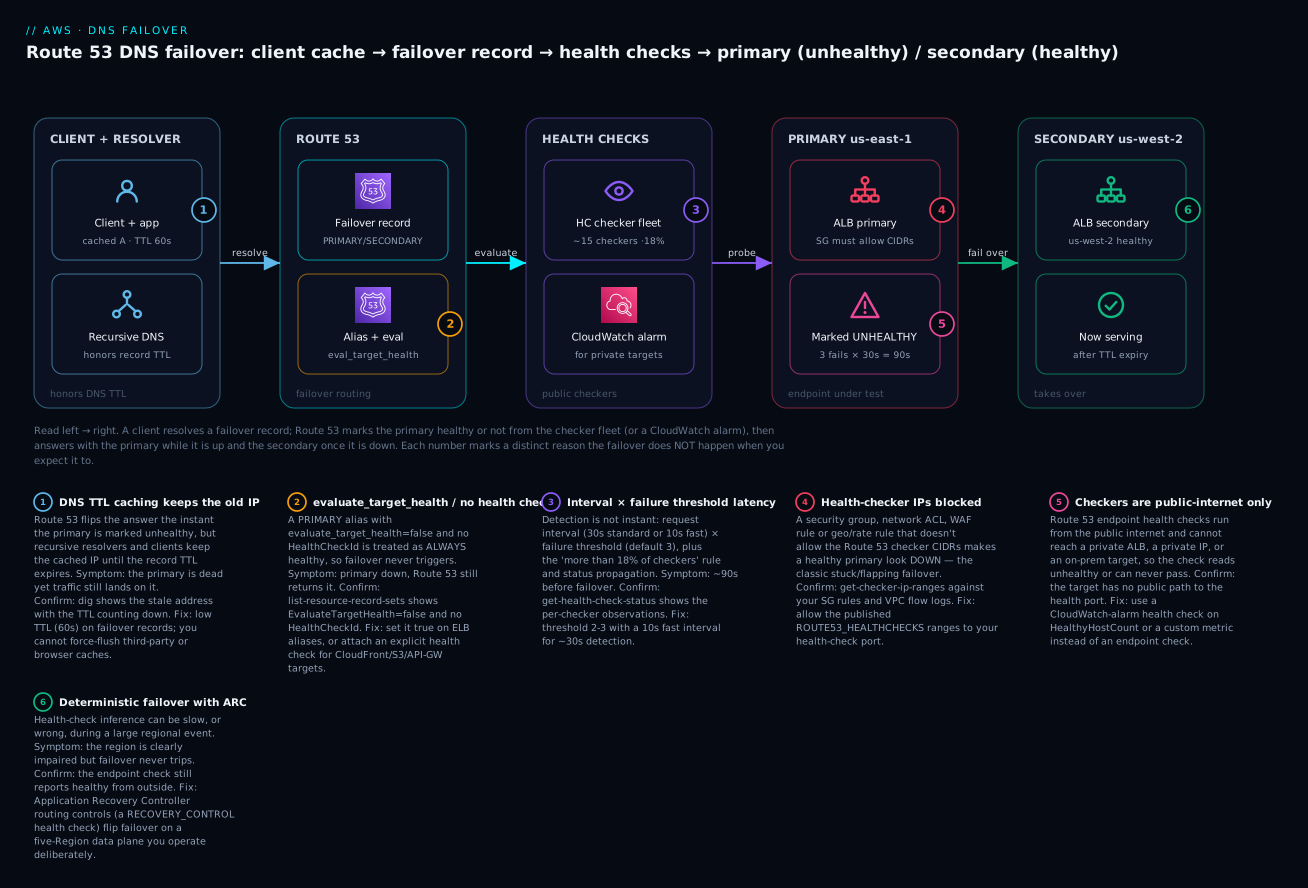
Real-world scenario
Meridian Payments runs a card-authorisation API active-passive across us-east-1 (primary) and us-west-2 (secondary). The public entry point is auth.meridianpay.com, a Route 53 failover alias pair pointing at a public ALB in each region. Behind each ALB sits an ECS service; data is an Aurora Global Database with the writer in us-east-1. The platform team is five engineers; the Route 53 spend is trivial — a handful of health checks. Their runbook, in bold at the top: “Regional failover is automatic. Do not touch DNS.”
At 03:12 on a Tuesday, us-east-1 had a partial networking impairment: the ALB still accepted TCP connections and completed TLS, but ~70% of backend requests timed out. The on-call engineer watched the primary’s Route 53 health check stay stubbornly Healthy for eleven minutes while the error rate climbed to 68%. Failover never fired. Following the runbook, they waited — the runbook said it was automatic. Revenue impact was real and the incident bridge filled up.
The first breakthrough was asking the diagram’s question: did the answer change, or did nothing change? dig auth.meridianpay.com still returned the us-east-1 ALB. So Route 53 hadn’t flipped — the health check genuinely thought the primary was fine. aws route53 get-health-check-status showed all checkers Success: the health check was TCP on port 443. It was testing whether the port opened — which it did — not whether the API worked, which it didn’t. The check was structurally blind to the actual failure.
The second finding compounded it. Someone pulled the record config: the primary alias had EvaluateTargetHealth: true — good — but the ALB’s own target group used a health-check path of / that returned 200 from the web tier even when the backend timed out. So both signals Route 53 could see (the Route 53 TCP check and the ALB target health) were shallow, and both said “healthy.” The failover machinery was working perfectly; it was being fed a lie.
They fixed it live in two moves. First, immediate mitigation: they had recently piloted Application Recovery Controller for exactly this “grey failure” case. They flipped the us-east-1 routing control Off; the RECOVERY_CONTROL health check went unhealthy deterministically, Route 53 answered with us-west-2, and — because they’d set the failover record TTL to 60s — traffic drained to the healthy region within about ninety seconds. Error rate fell to near zero. Second, the durable fix over the next week: they replaced the Route 53 TCP check with an HTTPS check on /healthz — a path that actually exercises a backend round-trip and a database ping — dropped the interval to 10s with a threshold of 3 (~30s detection), and rewrote the ALB target-group health path to the same deep /healthz. The next quarterly game-day induced a grey failure and failover fired automatically in under two minutes, no human required.
The incident as a timeline, because the order of the mistakes is the lesson:
| Time | Symptom | Action taken | Effect | What it should have been |
|---|---|---|---|---|
| 03:12 | Backend timeouts, errors climbing | (alert fires) | — | Ask: did the DNS answer change? |
| 03:15 | HC still “Healthy” | Wait — “failover is automatic” | No change; errors to 40% | dig the record; get-health-check-status |
| 03:20 | Still on primary | Consider manual DNS edit | Hesitation (runbook says don’t) | Recognise the TCP check is shallow |
| 03:23 | Root cause: TCP check + / path |
Realise both signals are shallow | Understanding, not yet fixed | — |
| 03:26 | Mitigated | Flip ARC routing control Off | Failover in ~90s (60s TTL) | Correct night-of action |
| +1 week | Fixed | HTTPS /healthz, 10s×3, deep ALB path |
Auto-failover < 2 min at game-day | The real fix is a deep check |
Advantages and disadvantages
DNS-level failover is powerful precisely because it’s above your infrastructure — and that height is also its limit. Weigh it honestly:
| Advantages (why DNS failover helps) | Disadvantages (why it bites) |
|---|---|
| Works for anything with a name — ELB, EC2, on-prem, third-party — not just AWS-native targets | It only re-points a name; it doesn’t drain connections, replicate data, or warm a standby |
| Health checks and failover are managed, distributed, and cheap (cents/month) | The verdict is inferred from probes; a shallow check or grey failure fools it |
Fail-open means a broken check can’t NXDOMAIN your whole domain |
Fail-open also means a broken check “does nothing” — the failure is silent |
| Calculated + CloudWatch checks express rich health logic (N-of-M, private targets, custom metrics) | More check types = more places to misconfigure InsufficientData / thresholds |
| ARC routing controls give deterministic, human-controlled failover with an HA data plane | ARC is extra cost and setup; overkill for tier-2/3 systems |
| No client changes — the failover is transparent to callers | You inherit DNS’s Achilles heel: TTL caching you cannot flush on demand |
| Latency/weighted/multivalue + health checks enable true active-active, not just DR | Client and resolver caching make failover a DNS-speed event (tens of seconds to minutes), never instant |
Where DNS failover sits against the other failover mechanisms — pick the layer that matches your failover speed and scope:
| Mechanism | Failover speed | Scope | Best for | Where it’s wrong |
|---|---|---|---|---|
| Route 53 DNS failover | Tens of seconds to minutes (TTL-bound) | Cross-region / cross-provider by name | Regional DR, active-active routing | Sub-second needs; DNS-ignoring clients |
| ALB/NLB across AZs | Seconds (in-region) | Within one region, across AZs | AZ-level HA behind one endpoint | Cross-region failover |
| AWS Global Accelerator | Seconds (anycast, no DNS wait) | Cross-region via static anycast IPs | Fast global failover, no TTL games | When you need per-record DNS logic |
| Multi-AZ (RDS/Aurora) | Seconds to ~1 min | Single database, across AZs | Database HA | Application/regional routing |
| Client-side retry/SDK | Immediate | Whatever the client knows | Fast retry to a known backup | Naming/discovery of the backup |
DNS failover is the right tool for cross-region DR and active-active routing; it is the wrong tool when you need sub-second, connection-level failover (that’s an Application/Network Load Balancer or Global Accelerator’s anycast job) or when your callers are long-lived connections that ignore DNS changes entirely. The disadvantages are all manageable — deep checks, low TTLs, ARC for tier-1 — but only if you know they exist, which is the entire point of the playbook below.
Hands-on lab
Build an active-passive failover with an endpoint health check, break the primary and watch it fail over, then reproduce a stuck failover by blocking the checker IPs — all with free-tier-friendly pieces. You need a registered domain in a Route 53 public hosted zone and two small public HTTP targets (two t3.micro EC2 instances, or two S3 website buckets, or two ALBs). Substitute your zone ID and endpoints. Health checks cost cents; delete at the end.
Step 1 — Variables.
ZONE_ID=Z123EXAMPLE                 # your public hosted zone
NAME=app.lab.example.com
PRIMARY_IP=52.20.10.10              # primary public endpoint
SECONDARY_IP=34.210.20.20           # secondary public endpoint
Step 2 — Create the primary endpoint health check (HTTP /healthz, standard 30s × 3 so it’s free-tier-cheap):
PRIMARY_HC_ID=$(aws route53 create-health-check \
  --caller-reference "primary-$(date +%s)" \
  --health-check-config "{\"Type\":\"HTTP\",\"IPAddress\":\"$PRIMARY_IP\",\"Port\":80,\"ResourcePath\":\"/healthz\",\"RequestInterval\":30,\"FailureThreshold\":3}" \
  --query 'HealthCheck.Id' --output text)
echo "Primary HC: $PRIMARY_HC_ID"
Expected: a health-check ID like abcd1234-.... Give it ~60–90s, then confirm the fleet sees it healthy:
aws route53 get-health-check-status --health-check-id "$PRIMARY_HC_ID" \
  --query 'HealthCheckObservations[].{Region:Region,IP:IPAddress,Status:StatusReport.Status}' \
  --output table
Expected: several rows, Status containing Success: HTTP Status Code 200.
Step 3 — Create the failover PRIMARY and SECONDARY records (60s TTL for fast failover):
aws route53 change-resource-record-sets --hosted-zone-id "$ZONE_ID" --change-batch "{
  \"Changes\":[
    {\"Action\":\"UPSERT\",\"ResourceRecordSet\":{\"Name\":\"$NAME\",\"Type\":\"A\",\"TTL\":60,
      \"SetIdentifier\":\"primary\",\"Failover\":\"PRIMARY\",\"HealthCheckId\":\"$PRIMARY_HC_ID\",
      \"ResourceRecords\":[{\"Value\":\"$PRIMARY_IP\"}]}},
    {\"Action\":\"UPSERT\",\"ResourceRecordSet\":{\"Name\":\"$NAME\",\"Type\":\"A\",\"TTL\":60,
      \"SetIdentifier\":\"secondary\",\"Failover\":\"SECONDARY\",
      \"ResourceRecords\":[{\"Value\":\"$SECONDARY_IP\"}]}}
  ]}"
Step 4 — Confirm steady state resolves to the primary:
dig +short "$NAME" @8.8.8.8
# Expected: 52.20.10.10  (the primary)
Step 5 — Break the primary and watch failover. Stop the primary’s web server (or return non-200 on /healthz). Watch the health check flip, then watch DNS:
# Poll the health check until it goes unhealthy (~90s: 30s interval × 3)
watch -n 10 "aws route53 get-health-check-status --health-check-id $PRIMARY_HC_ID \
  --query 'HealthCheckObservations[].StatusReport.Status' --output text"

# Once unhealthy, DNS should return the secondary (allow TTL to expire)
watch -n 5 "dig +short $NAME @8.8.8.8"
# Expected: flips from 52.20.10.10 to 34.210.20.20
You just observed the two clocks: ~90s detection (interval × threshold) plus up to 60s TTL. Total ~2–2.5 minutes — and you can now feel why lowering the interval to 10s and the TTL to 60s matters.
Step 6 — Reproduce a STUCK failover (blocked checker IPs). Restore the primary so it’s genuinely healthy again, then block the checkers at the security group (if your endpoint is behind an SG). Remove the ingress rule that allows the ROUTE53_HEALTHCHECKS ranges (or add an explicit deny at a NACL). Now the health check flips to unhealthy even though the endpoint is fine:
aws route53 get-health-check-status --health-check-id "$PRIMARY_HC_ID" \
  --query 'HealthCheckObservations[].StatusReport.Status' --output text
# Expected: "Failure: Connection timed out" — a healthy endpoint reading DOWN
The confirming move: compare the checker ranges against what your SG allows.
aws route53 get-checker-ip-ranges --output text | head
# These CIDRs must be permitted to your health-check port. If they aren't, THIS is your stuck failover.
Re-add the ingress rule for the checker CIDRs; within a few intervals the check recovers to healthy. You’ve now seen both a real failover and a false unhealthy — the two halves of every incident.
Validation checklist and what each step proves:
| Step | What you did | What it proves | Real-world analogue |
|---|---|---|---|
| 2 | Endpoint HC on /healthz |
The check has its own verdict, visible via status | Every failover starts here |
| 3 | Failover pair, HC on primary | The verdict must be attached to the record | The “no failover” bug when it isn’t |
| 5 | Break primary, watch flip | Detection = interval × threshold, then TTL | The two clocks of DNS failover |
| 6 | Block checker IPs | A healthy endpoint can read down | The classic stuck/flapping failover |
Teardown (⚠️ deletes the records and check):
# Delete both records (must match exactly, so DELETE what you created)
aws route53 change-resource-record-sets --hosted-zone-id "$ZONE_ID" --change-batch "{
  \"Changes\":[
    {\"Action\":\"DELETE\",\"ResourceRecordSet\":{\"Name\":\"$NAME\",\"Type\":\"A\",\"TTL\":60,\"SetIdentifier\":\"primary\",\"Failover\":\"PRIMARY\",\"HealthCheckId\":\"$PRIMARY_HC_ID\",\"ResourceRecords\":[{\"Value\":\"$PRIMARY_IP\"}]}},
    {\"Action\":\"DELETE\",\"ResourceRecordSet\":{\"Name\":\"$NAME\",\"Type\":\"A\",\"TTL\":60,\"SetIdentifier\":\"secondary\",\"Failover\":\"SECONDARY\",\"ResourceRecords\":[{\"Value\":\"$SECONDARY_IP\"}]}}
  ]}"

aws route53 delete-health-check --health-check-id "$PRIMARY_HC_ID"
Cost note. A basic health check is about $0.50/month; running this lab for an hour is a fraction of a rupee. The only lingering charge is the health check itself — the teardown removes it.
Common mistakes & troubleshooting
This is the playbook — the part you bookmark. First the scannable table you read at 03:12, then the expanded reasoning for the entries that bite hardest, then a health-check status reference.
| # | Symptom | Root cause | Confirm (exact command / console path) | Fix |
|---|---|---|---|---|
| 1 | Primary dead, traffic still on it after minutes | TTL caching — resolvers/clients keep the old IP | dig +noall +answer app.example.com shows old IP with TTL counting down |
Lower record TTL to 60s (or less); wait out existing caches |
| 2 | Health check green, but the service is broken | Shallow path (/) or TCP check — tests port, not the app |
get-health-check shows Type=TCP or ResourcePath=/ |
Deep HTTP(S) /healthz that exercises a real dependency |
| 3 | Healthy endpoint reads unhealthy; failover stuck on secondary | Security group / NACL / WAF drops the checker IPs | get-checker-ip-ranges vs SG rules; VPC flow logs show REJECT from checker CIDRs |
Allow ROUTE53_HEALTHCHECKS ranges to the health port |
| 4 | Primary unhealthy but no failover | Health check not associated with the record | list-resource-record-sets shows no HealthCheckId on primary |
Attach HealthCheckId (or fix alias ETH — row 5) |
| 5 | Alias primary never fails over | evaluate_target_health=false and no health check |
list-resource-record-sets → AliasTarget.EvaluateTargetHealth=false, no HealthCheckId |
Set ETH=true (ELB) or attach a health check (CloudFront/S3/API GW) |
| 6 | Failover takes 90–120s+ | Standard 30s interval × 3 threshold + TTL | get-health-check interval/threshold; record TTL |
Fast 10s interval, threshold 2–3, TTL 60s |
| 7 | Private ALB / on-prem target always unhealthy | Endpoint checkers are public-internet-only | Target has only a private IP / no public route | Use a CLOUDWATCH_METRIC check on a metric alarm |
| 8 | HTTPS check fails though the site loads in a browser | SNI/cert: handshake fails, or FQDN ≠ cert SAN | get-health-check-status shows TLS/handshake failure |
Set FullyQualifiedDomainName to the cert’s name; EnableSNI=true; renew cert |
| 9 | *_STR_MATCH check unhealthy though the string is on the page |
String is past the first 5,120 response bytes | Fetch the endpoint; the marker appears late in the body | Move the health marker into the first 5,120 bytes |
| 10 | Health check flaps healthy/unhealthy | Threshold too low, or intermittent endpoint / one bad checker region | get-health-check-status shows mixed per-region results |
Raise failure threshold; fix the flapping node; check the 18% math |
| 11 | Everything “healthy,” but the app is regionally degraded (grey failure) | Fail-open + shallow inference can’t see partial failure | Errors high yet HealthCheckStatus=1 in CloudWatch |
Deep check; move to ARC routing control for deterministic failover |
| 12 | Failover to secondary, but secondary also fails | Fail-open returns primary when all unhealthy; or secondary was never truly ready | get-health-check-status on secondary; test it directly |
Keep the standby warm and health-checked; verify it independently |
| 13 | Console shows Healthy; CloudWatch alarm won’t trigger | Route 53 metrics are only in us-east-1 |
Alarm created in wrong region for AWS/Route53 |
Create the alarm and read metrics in us-east-1 |
| 14 | CloudWatch-metric check flaps at deploy/low traffic | Alarm goes INSUFFICIENT_DATA; check flips |
describe-alarms shows INSUFFICIENT_DATA transitions |
Set InsufficientDataHealthStatus=LastKnownStatus; tune treat-missing-data |
| 15 | Health checker probes hammer the origin / skew logs | Many checkers × short interval = steady probe load | Access logs full of checker-CIDR requests to /healthz |
Cheap health path; restrict Regions; standard interval where fine |
| 16 | New record change “didn’t take” | Change is PENDING, or you edited the wrong record in the set |
get-change --id /change/C... = INSYNC?; check SetIdentifier |
Wait for INSYNC; match name+type+set-identifier exactly |
The expanded form for the ones that cost the most hours:
1. Primary is dead but traffic still lands on it. Root cause: TTL caching. Route 53 flipped the authoritative answer, but a recursive resolver (and the client’s own OS/app cache) is still serving the old IP until the TTL expires. Confirm: dig +noall +answer app.example.com shows the stale IP and a TTL counting down; query the authoritative nameserver directly (dig app.example.com @ns-XXX.awsdns-YY.com) and you’ll see the new answer — proving Route 53 is right and the cache is stale. Fix: set the failover record TTL to 60s (or lower) before you need it; you cannot flush third-party or browser caches on demand, so the pre-set TTL is the only lever. Alias records already use a low target TTL (≈60s for ELB), which is one reason to prefer them.
3. A healthy endpoint reads unhealthy and failover is stuck. Root cause: your own security group, NACL, or WAF is dropping the Route 53 checker probes, so the fleet times out against a fine endpoint. NACLs are stateless — you must allow both the inbound probe and the outbound ephemeral response. Confirm: aws route53 get-checker-ip-ranges and compare to your SG/NACL/WAF rules; enable VPC flow logs and look for REJECT from checker CIDRs to your health port. Fix: allow the ROUTE53_HEALTHCHECKS ranges (drive them from the aws_ip_ranges data source so they self-update); for WAF, put an allow rule for those CIDRs above your block rules.
5. An alias primary never fails over. Root cause: the alias has evaluate_target_health=false and no attached health check, so Route 53 considers it always healthy. This is epidemic because many templates default ETH to false, and because CloudFront/S3/API-Gateway aliases can’t use ETH at all. Confirm: aws route53 list-resource-record-sets and read AliasTarget.EvaluateTargetHealth and HealthCheckId on the primary. Fix: for ELB aliases set ETH=true; for CloudFront/S3/API-GW aliases attach an explicit HealthCheckId, because ETH is unavailable for those targets.
7. A private or on-prem target is always unhealthy. Root cause: endpoint checks originate from the public internet and cannot route to a private IP, an internal ALB, or an on-prem host behind a firewall. No amount of path/threshold tuning fixes a reachability impossibility. Confirm: the target has only a private address or no public path to the health port. Fix: switch to a CLOUDWATCH_METRIC health check that mirrors an alarm on a metric the target emits (ALB HealthyHostCount, a custom app metric via put-metric-data, etc.), and set InsufficientDataHealthStatus deliberately.
8. An HTTPS check fails though the site loads fine in a browser. Root cause: an SNI/certificate problem the browser forgives but the checker doesn’t — the checker sends SNI = the FQDN you configured, and if that FQDN isn’t in the cert’s SAN, or the cert is expired, or the server needs a TLS version/cipher the checker won’t negotiate, the handshake fails. Confirm: get-health-check-status shows a TLS/handshake failure, not an HTTP status. Fix: set FullyQualifiedDomainName to a name the cert actually covers, keep EnableSNI=true, and renew/repair the certificate.
11. Everything’s healthy but the region is degraded (the grey failure). Root cause: Route 53 fails open and your checks only test shallow signals, so a partial failure — TLS completes, port opens, / returns 200, but real requests time out — is invisible to inference. Confirm: application error rate is high while HealthCheckStatus=1 in CloudWatch (us-east-1). Fix: deepen the check to exercise a real backend round-trip; for tier-1 systems, stop trusting inference and use an ARC routing control you flip deliberately.
The health-check status / error reference — what get-health-check-status and the console actually say, and what each means:
| Status / message | Meaning | Likely cause | How to confirm | Fix |
|---|---|---|---|---|
Success: HTTP Status Code 200 |
Checker got a good response | Healthy | — | — |
Failure: Connection timed out |
No TCP/response in the window | Blocked checker IPs, endpoint down, wrong port | get-checker-ip-ranges vs SG; test the port publicly |
Allow checker CIDRs; open the port; fix the endpoint |
Failure: Connection refused |
Port reachable but nothing listening | Service down / wrong port | Probe the port yourself | Start the service; correct the port |
Failure: HTTP Status Code 403/404/500 |
Got a bad HTTP status | Wrong path, auth on the path, app error | curl the exact ResourcePath |
Fix path / remove auth / fix the app |
Failure: Resolved IP ... not reachable |
FQDN resolved but not connectable | DNS points somewhere wrong; private IP | dig the FQDN from outside |
Point FQDN at a public endpoint |
Failure: The SSL handshake failed |
TLS negotiation failed | Cert/SNI mismatch, expired cert, TLS version | openssl s_client -servername <fqdn> |
Fix cert/SNI; renew; EnableSNI=true |
Failure: String not found in body |
*_STR_MATCH didn’t match |
String absent or past 5,120 bytes | Fetch body; find the marker’s offset | Move marker into first 5,120 bytes |
Failure: Health check is disabled |
Check is paused | Disabled=true (treated healthy) |
get-health-check |
Re-enable it |
INSUFFICIENT_DATA (CloudWatch type) |
Alarm has no data | New alarm, metric gap, wrong region | describe-alarms state |
Set InsufficientDataHealthStatus; fix metric flow |
Aggregate Healthy with mixed rows |
>18% of checkers succeed | Some regions blocked, most fine | Per-region rows in status | Fix the blocked regions or accept the 18% math |
And the fast decision table when you’re mid-incident:
| If you see… | It’s probably… | Do this first |
|---|---|---|
Old IP in dig, TTL counting down |
TTL caching | Lower TTL (for next time); wait out the cache |
| Green check, broken app | Shallow / or TCP check |
Deepen the health path |
Connection timed out from checkers |
Blocked checker IPs | get-checker-ip-ranges; open the SG/NACL/WAF |
No HealthCheckId on the record |
Unassociated check | Attach the check / fix alias ETH |
EvaluateTargetHealth=false on alias |
The ETH trap | ETH=true or explicit health check |
| Private target, always down | Public-only checkers | CloudWatch-alarm check |
| SSL handshake failure | SNI/cert mismatch | Fix FQDN/cert; EnableSNI |
High errors, HealthCheckStatus=1 |
Grey failure + fail-open | Deep check or ARC routing control |
The whole method rests on one question — did the authoritative answer change, or is a cache stale? — so you must know which layer each query hits:
| Query | Answer source | What it tells you |
|---|---|---|
dig app.example.com (default resolver) |
Whatever your resolver cached | Client experience — may be stale |
dig app.example.com @8.8.8.8 |
Google’s recursive cache | A second cache’s view — cross-check staleness |
dig app.example.com @ns-XXX.awsdns-YY.com |
Route 53 authoritative NS | The truth — what Route 53 decided right now |
dig +noall +answer app.example.com |
(any) with TTL shown | The remaining TTL — how long the cache persists |
dig +trace app.example.com |
Full delegation walk | Which nameservers are authoritative |
The diagnostic command cheat-sheet — one command per question you’ll ask mid-incident:
| Question | Command | Key field to read |
|---|---|---|
| Did the answer change or is it cached? | dig ... @<authoritative-ns> vs @8.8.8.8 |
Compare the returned IPs |
| Is the check healthy right now, and from where? | aws route53 get-health-check-status --health-check-id <id> |
StatusReport.Status per region |
| What is the check actually testing? | aws route53 get-health-check --health-check-id <id> |
Type, ResourcePath, interval, threshold |
| Is the check attached to the record? | aws route53 list-resource-record-sets --hosted-zone-id <z> |
HealthCheckId, AliasTarget.EvaluateTargetHealth |
| Which checker IPs must I allow? | aws route53 get-checker-ip-ranges |
The CIDR list vs your SG rules |
| Did my record change apply? | aws route53 get-change --id /change/<id> |
Status = INSYNC |
| Is a CloudWatch-metric check’s alarm firing? | aws cloudwatch describe-alarms --alarm-names <name> --region us-east-1 |
StateValue |
| Are checkers being rejected at the network? | VPC flow logs filtered to checker CIDRs | REJECT actions |
Best practices
- Health-check the right depth. A
/healthzthat exercises a real backend round-trip and a fast dependency ping — never/and never a bareTCPcheck for an HTTP service. Shallow checks are why “healthy” and “broken” coexist. - Set a low TTL on failover records before the incident (60s or lower). TTL is the delay you cannot flush; you only get to choose it in advance. Prefer alias records where you can — they already use a low target TTL.
- Always associate the health check with the record. A working check that no record references is the classic silent “no failover.” Verify
HealthCheckId/ alias ETH withlist-resource-record-sets. - Get
evaluate_target_healthright per target type. ETH=true for ELB/VPC-endpoint aliases; an explicit health check for CloudFront/S3/API-Gateway aliases (ETH isn’t available there). - Allow the checker CIDRs from a live data source. Drive security-group and WAF allow-lists from
aws route53 get-checker-ip-ranges/ theaws_ip_rangesdata source so they self-update when AWS changes the ranges. - Use CloudWatch-alarm checks for anything private or metric-shaped. Private ALBs, databases, queue depth, custom SLIs — endpoint checks structurally can’t see these.
- Tune interval and threshold to the tier. Fast 10s × 3 (~30s) for tier-1 public paths; standard 30s × 3 (~90s) where a slower, cheaper, flap-resistant check is fine.
- Keep the standby warm and independently verified. DNS failover only re-points the name; the secondary must already be healthy, scaled, and data-ready — health-check it separately so you’re not failing over to a second outage.
- For tier-1 grey-failure scenarios, use ARC routing controls. Deterministic, human/automation-driven failover with a five-Region data plane beats hoping inference agrees with reality.
- Alarm on
HealthCheckStatusandHealthCheckPercentageHealthy(inus-east-1) so you learn a check flipped before users do, and can distinguish a real flip from a partial-region blip. - Test failover on a schedule (game-days), inducing grey failures, not just clean stops. The demo that “worked” tested the easy path; the incident won’t be that clean.
- Treat records, checks and TTLs as code (Terraform), reviewed in PRs — a wrong ETH flag or a 300s TTL is a latent outage that a review catches.
The alerts worth wiring before the next incident — leading indicators, not the lagging “site down”:
| Alert on | Metric (namespace AWS/Route53, us-east-1) |
Threshold (starting point) | Why it’s leading |
|---|---|---|---|
| Primary flipped unhealthy | HealthCheckStatus (Minimum) |
< 1 for 2 datapoints | The failover is happening — confirm it’s real |
| Fleet agreement dropping | HealthCheckPercentageHealthy |
< 100% sustained | Some checkers/regions failing before the 18% flip |
| Connection latency creeping | ConnectionTime |
> your SLO | Endpoint slowing toward the 4s/2s limits |
| TLS handshake slow | SSLHandshakeTime |
> your SLO | Cert/TLS trouble before a hard handshake failure |
| Child-check erosion (calculated) | ChildHealthCheckHealthyCount |
< threshold + 1 | One more child down flips the calculated check |
Security notes
- Allow-list the checkers narrowly, not the world. Open only the health-check port to the
ROUTE53_HEALTHCHECKSCIDRs — never0.0.0.0/0“to make the check pass.” Scope by port and source range, sourced from the live data source. - Don’t leak topology through
/healthz. The health path should return a terse status, not internal hostnames, versions, dependency names, or stack traces. It’s reachable from the public checker fleet — treat it as public. - Keep endpoint checks on TLS where possible. HTTPS checks confirm the TLS path callers actually use; a passing HTTP check on 80 tells you nothing about your 443 cert.
- Least-privilege the DNS control plane. Scope IAM for
route53:ChangeResourceRecordSets,route53:*HealthCheck*to the specific hosted zone / checks; DNS is a high-blast-radius surface — a wrong or malicious record change is an outage or a hijack. - Prefer private health signals for private tiers. A CloudWatch-alarm check keeps the target off the public internet entirely — no public health endpoint to attack — while still driving failover.
- Consider DNSSEC for the zone. Signing the zone protects the integrity of the failover answers against spoofing; it doesn’t change failover behaviour but hardens the channel that carries it.
- Audit record and check changes. CloudTrail logs
ChangeResourceRecordSetsand health-check edits; alert on unexpected changes to failover records — a silent ETH flip or TTL bump is a latent incident.
The security controls that also prevent these incidents — secure and resilient pull the same way here:
| Control | Mechanism | Secures against | Also prevents |
|---|---|---|---|
| Scoped checker allow-list | SG/WAF rule to ROUTE53_HEALTHCHECKS CIDRs |
Exposing the port to the internet | False-unhealthy stuck failover (row 3) |
Terse /healthz |
App design | Topology/secret leakage | Debugging noise; probe-driven info leaks |
| Least-privilege Route 53 IAM | Scoped route53:* policy |
Rogue record changes / hijack | Fat-finger failover-record breakage |
| CloudWatch-alarm check for private tiers | CLOUDWATCH_METRIC type |
Public exposure of internal targets | Impossible-reachability “always unhealthy” |
| DNSSEC on the zone | Zone signing | Answer spoofing/cache poisoning | Failover answers being tampered en route |
| CloudTrail on DNS/HC changes | Audit + alerting | Unnoticed malicious/accidental edits | Silent ETH/TTL regressions |
Cost & sizing
Route 53 health checks are among the cheapest resilience you can buy — the bill is driven by count and optional features, not traffic:
- Basic endpoint health check on an AWS endpoint: about $0.50/month each. On an endpoint outside AWS, about $0.75/month.
- Optional features add per-feature surcharges (roughly $1/month each on AWS endpoints, $2 on non-AWS): HTTPS, string matching, fast 10-second interval, and latency measurement. A fast HTTPS string-match latency check on a non-AWS endpoint stacks several surcharges — enable only what a given tier needs.
- Calculated and CloudWatch-metric health checks are around $0.50–$1.00/month each; the CloudWatch alarm they read is billed separately as a standard alarm.
- DNS queries are billed per million (standard vs latency/geo/geoproximity rates); failover routing itself adds no premium beyond the query and the checks.
- ARC (Application Recovery Controller) clusters and routing controls carry their own (higher) cost — justified for tier-1, overkill for tier-2/3.
Sizing is about feature choice and interval, not capacity. The drivers and what each buys you:
| Cost driver | What you pay for | Rough monthly (USD / INR) | What it buys | Watch-out |
|---|---|---|---|---|
| Basic AWS-endpoint check | One endpoint check | ~$0.50 / ~₹42 | The core signal | Shallow if you skip features |
| Non-AWS endpoint check | Off-AWS target | ~$0.75 / ~₹63 | Health-check third parties | Pricier than AWS targets |
| Fast interval (10s) | Faster detection | +~$1 / ~₹84 | ~30s vs ~90s detection | Only where speed matters |
| HTTPS + string match | Real TLS + body check | +~$1 each / ~₹84 each | Catches cert & content faults | Adds up if applied everywhere |
| Latency measurement | CloudWatch latency metrics | +~$1 / ~₹84 | Trend/alert on slowness | Immutable after create |
| Calculated / CloudWatch check | Combine / private-target health | ~$0.50–$1 / ~₹42–84 | N-of-M and private tiers | Alarm billed separately |
| ARC routing control | Deterministic failover HA data plane | Cluster + control (higher) | Tier-1 grey-failure failover | Overkill below tier-1 |
A realistic small active-passive setup: two endpoint checks (primary + secondary), fast interval on the primary, HTTPS on both — call it ~$4–5/month all-in. Even a rich multi-region active-active with a dozen checks and a couple of calculated rollups lands in the low tens of dollars. The lesson mirrors the Meridian story: the expensive part of failover is never the health check — it’s the outage you take when the cheap check was shallow.
Interview & exam questions
1. Why does a Route 53 failover sometimes take minutes even though the health check flipped in ~90 seconds? Because there are two clocks. Detection is request interval × failure threshold (≈90s standard). But recursive resolvers and clients cached the old answer for the record’s TTL and keep using the dead IP until it expires — Route 53 can’t flush them. Total failover ≈ detection + TTL + client behaviour. Lower the TTL (60s) in advance and use a fast 10s interval to shrink both.
2. An alias failover record’s primary is down but Route 53 keeps returning it. What’s the most likely cause? The alias has evaluate_target_health=false and no attached health check, so Route 53 treats it as always healthy. Confirm with list-resource-record-sets (read EvaluateTargetHealth and HealthCheckId). Fix: set ETH=true for ELB aliases, or attach an explicit health check for CloudFront/S3/API-Gateway aliases, which can’t use ETH.
3. How do you health-check a target that has no public endpoint — a private ALB or a database? You can’t use an endpoint check; Route 53’s checkers are public-internet-only. Use a CloudWatch-alarm health check (CLOUDWATCH_METRIC) that mirrors an alarm on a metric the target emits (e.g., ALB HealthyHostCount, a custom metric). Set InsufficientDataHealthStatus deliberately so a metric gap doesn’t flap the check.
4. What is the “18%” rule and why does it exist? Route 53 aggregates a distributed checker fleet: if more than 18% of checkers report an endpoint healthy, it’s considered healthy. It prevents a few checkers with a transient network problem (or a single blocked region) from falsely flipping a healthy endpoint. It’s why one blocked checker region rarely trips failover, but a security-group block affecting most of the fleet does.
5. Why might a healthy endpoint show as unhealthy, and how do you confirm it? Your own security group, NACL, or WAF is dropping the checker probes. Confirm with aws route53 get-checker-ip-ranges compared to your rules, plus VPC flow logs showing REJECT from checker CIDRs. Fix by allowing the ROUTE53_HEALTHCHECKS ranges to the health port (remember NACLs are stateless — allow the return traffic too).
6. What does Route 53 do when every record in a failover group is unhealthy? It fails open — treats them all as healthy and returns an answer anyway (usually the primary), rather than returning NXDOMAIN. This avoids a broken health check black-holing the whole domain, but it also means a misconfigured check “does nothing,” which looks like failover isn’t working.
7. When would you choose Application Recovery Controller over normal health-check failover? For tier-1 systems facing grey failures, where endpoint inference is too slow or can be fooled (the ALB answers checkers but real requests fail). ARC routing controls give deterministic, human/automation-driven failover backed by a five-Region data plane that stays available during a large event — you flip a switch instead of hoping the probe agrees with reality.
8. Difference between a calculated health check and a CloudWatch-alarm health check? A calculated check combines up to 256 child health checks with a threshold (“healthy if ≥N children healthy”) — pure boolean logic over other checks. A CloudWatch-alarm check mirrors a single alarm’s state (OK=healthy, ALARM=unhealthy), which lets it reflect metrics and private targets an endpoint check can’t reach.
9. Your HTTPS health check fails but the site works in a browser. Why? Almost always SNI/certificate: the checker sends SNI equal to the configured FQDN and validates the TLS handshake; if the FQDN isn’t in the cert’s SAN, the cert is expired, or the server needs a TLS version the checker won’t use, the handshake fails. Browsers are more forgiving. Fix the FQDN/cert and keep EnableSNI=true.
10. How do you make failover detection ~30 seconds instead of ~90? Use the fast 10-second request interval (a paid feature) with a failure threshold of 3 (~30s), and pair it with a 60s (or lower) TTL so clients pick up the change quickly. Deepen the path so the fast check is also accurate — a fast shallow check just fails fast and wrong.
11. A *_STR_MATCH check is unhealthy though the search string is clearly on the page. What’s wrong? Route 53 only searches the first 5,120 bytes of the response body. If your health marker appears after that (large HTML, the marker at the bottom), it’s never found. Move the marker into the first 5,120 bytes — ideally return a tiny dedicated health body.
12. Where do Route 53 health-check metrics live, and why does that trip people up? In CloudWatch, namespace AWS/Route53, only in us-east-1, regardless of where your resources are. Engineers create the alarm in their app’s region, see no data, and think the check is broken. Create and read the alarm in us-east-1.
These map to SAA-C03 (Solutions Architect Associate) — design resilient, highly available architectures; SOA-C02 (SysOps Administrator) — implement and troubleshoot health checks, DNS, and monitoring; and ANS-C01 (Advanced Networking Specialty) — advanced Route 53 routing, hybrid DNS, and failover. The DR-strategy framing also touches SAP-C02. A compact cert map for revision:
| Question theme | Primary cert | Objective area |
|---|---|---|
| Failover, TTL, health-check types | SAA-C03 | Design highly available, resilient architectures |
| Troubleshooting checks, blocked IPs, metrics | SOA-C02 | Monitoring, troubleshooting, DNS operations |
| Routing policies, calculated checks, hybrid | ANS-C01 | Advanced Route 53 and network resilience |
| ARC, multi-region DR patterns | SAP-C02 | Design for organizational resilience |
| evaluate_target_health, alias behaviour | SAA-C03 / SOA-C02 | Route 53 record configuration |
| CloudWatch-alarm checks, private targets | SOA-C02 | Observability-driven health signals |
Quick check
- Route 53 marked your primary unhealthy 30 seconds ago, but users still hit it. Name the two clocks that govern total failover time and which one you can only set in advance.
- An alias failover record won’t fail over. Which single flag do you check first, and what value breaks failover?
- True or false: you can use an endpoint (HTTP) health check to monitor a private internal ALB. If false, what do you use instead?
- A healthy endpoint reads unhealthy from the checkers. What’s the most likely cause and the exact command that confirms it?
- Your app is regionally degraded (high errors) but every health check is green. What Route 53 behaviour explains this, and what’s the tier-1 fix?
Answers
- Detection (
request interval × failure threshold, ≈90s standard / ≈30s fast) and TTL caching (resolvers/clients keep the old IP until the record TTL expires). You can only set the TTL in advance — you can’t flush existing caches during the incident. evaluate_target_healthon the alias. If it’sfalse(and no health check is attached), Route 53 treats the primary as always healthy, so failover never triggers. Set it true for ELB aliases, or attach an explicit health check for CloudFront/S3/API-GW aliases.- False. Route 53 endpoint checkers run from the public internet and can’t reach a private ALB. Use a CloudWatch-alarm health check (
CLOUDWATCH_METRIC) that mirrors an alarm on a metric the ALB emits (e.g.,HealthyHostCount). - Your security group / NACL / WAF is blocking the checker IPs. Confirm with
aws route53 get-checker-ip-rangescompared against your ingress rules (and VPC flow logs showing REJECTs from those CIDRs). Fix by allowing theROUTE53_HEALTHCHECKSranges to the health port. - Fail-open plus shallow inference: Route 53 returns the primary as if healthy because the check only tests a shallow signal (TCP/
/) that a partial “grey” failure doesn’t trip. Tier-1 fix: deepen the health check and/or use an ARC routing control for deterministic, human-driven failover.
Glossary
- Hosted zone — the Route 53 container holding a domain’s records, including failover records and their TTLs.
- Health check — an independent Route 53 object (with its own ID) that probes an endpoint or reads an alarm and produces a healthy/unhealthy verdict; useless for failover until a record references it.
- Endpoint health check — an
HTTP/HTTPS/TCP(± string-match) check run by a public checker fleet; can’t see private/on-prem targets. - Calculated health check — a
CALCULATEDcheck that is healthy when at leastHealthThresholdof its child checks are healthy. - CloudWatch-alarm health check — a
CLOUDWATCH_METRICcheck that mirrors a CloudWatch alarm (OK=healthy, ALARM=unhealthy); the way to health-check private/metric-shaped targets. - Failover routing — an active-passive policy: a PRIMARY and SECONDARY record with the same name/type, where Route 53 returns the primary while it’s healthy and the secondary when it isn’t.
evaluate_target_health(ETH) — an alias flag making the record’s health follow its AWS target’s health;falsewith no attached check means “always healthy,” the top cause of no-failover.- Request interval — seconds between probes: 30 (standard) or 10 (fast, paid).
- Failure threshold — consecutive failed probes before a checker declares the endpoint unhealthy (1–10, default 3).
- 18% rule — Route 53 considers an endpoint healthy if more than 18% of checkers report it healthy; smooths out isolated checker failures.
- TTL (time to live) — seconds a resolver/client caches a DNS answer; the failover delay you can only set in advance, not flush on demand.
- Fail-open — when all records in a group are unhealthy, Route 53 treats them as healthy and still answers (no
NXDOMAIN). - Health-checker IP ranges — the AWS-owned public CIDRs the checkers use (
aws route53 get-checker-ip-ranges/ROUTE53_HEALTHCHECKSinip-ranges.json); must be allowed by your SG/NACL/WAF. - SNI (Server Name Indication) — the hostname the HTTPS checker presents in the TLS handshake; a mismatch with the cert’s SAN fails the check.
- Application Recovery Controller (ARC) — an AWS service whose routing controls provide deterministic, HA (five-Region) failover; wired to Route 53 via a
RECOVERY_CONTROLhealth check. InsufficientDataHealthStatus— for CloudWatch-alarm checks, what the check reports when the alarm has no data (Healthy,Unhealthy, orLastKnownStatus).
Next steps
You can now build DNS failover correctly and localise any “why isn’t it failing over” to a hop and a fix. Build outward:
- Next: AWS Multi-Region Active-Active Architecture: Route 53, Global Tables and Aurora Global Database — put failover routing to work over replicated data, so the region you fail to can actually serve.
- Related: AWS Backup and Disaster Recovery: Protect Workloads Across Regions — the recovery strategy behind the endpoints failover re-points, including RTO/RPO and warm-standby patterns.
- Related: a Route 53 records and routing-policies deep dive (simple, weighted, latency, geolocation, geoproximity, multivalue) — the routing foundation this article’s failover sits on.
- Related: an ALB 5xx (502/503/504) troubleshooting playbook — the layer behind the health check, where “the endpoint answers but every request fails” originates.
- Related: revisit the health-checker allow-listing pattern whenever you tighten security groups or WAF — the most common way a hardening change silently breaks a working failover.