The page fires at 03:20: 4XXError on the prod stage is a wall of red and the mobile team says “the API just started throwing 403s.” Before you touch a single setting you owe yourself three answers: which status code exactly, which layer of API Gateway generated it, and what does the responseType say. Get those wrong and you will “fix” CORS on a request that was really a throttle, widen an IAM policy for a 403 that was really a stage that never got deployed, or raise a Lambda timeout for a 502 that was really a function returning the wrong response shape. Amazon API Gateway fails in a small, finite set of very specific ways, and every one of them has an exact HTTP status, an exact responseType string, an exact access-log field that confirms it, and an exact fix.
This is the reference you keep open during the incident. API Gateway is not one thing — it is a pipeline (WAF → authorizer → throttle and usage plan → request validation → integration → integration response → gateway response), and each stage can reject a request with its own status code and its own signature. A 403 can be born in six different places; a 429 comes from one of four throttle layers plus the token bucket; a 5xx is almost always your integration, and the difference between a 502 (Lambda returned a malformed proxy shape), a 504 (the backend blew past the 29-second integration timeout) and a 500 (the authorizer errored) is the difference between a two-line code fix and a two-hour goose chase. The whole skill of operating API Gateway at 3 a.m. is naming the layer fast from the signal — and the signal lives in the access log $context fields and a handful of CloudWatch metrics, not in guesswork.
By the end you will read $context.error.responseType, $context.status, $context.integrationStatus, $context.integrationLatency and $context.authorizer.error like an instrument panel; know from one CloudWatch comparison (Latency vs IntegrationLatency) whether the delay is in your backend or in API Gateway’s own overhead; and carry a status + responseType → layer → root cause → confirm → fix playbook you can run under pressure. Everything is shown in both aws CLI (apigateway, apigatewayv2, logs, cloudwatch) and Terraform, with real limits, error strings and $context variables — never a hand-waved number. It maps directly to the API Gateway troubleshooting and observability domains of DVA-C02, SOA-C02 and SAA-C03.
What problem this solves
API Gateway sits at the front door of most serverless and microservice architectures, which means when it returns an error, every client sees it — and the error it returns is frequently misleading on purpose. The single most infamous example is Missing Authentication Token: it almost never means a token is missing. It means the request hit a path or method that API Gateway has no route for, or a stage that was never deployed. Teams burn hours adding authorizers and API keys to fix an auth error that was really a typo in the URL. The same misdirection runs through the whole error surface: a Forbidden that’s an unattached API key, a 500 that’s an authorizer exception, a 502 where your Lambda ran perfectly and returned 200 to API Gateway, which then rejected the shape of that 200.
What breaks without this knowledge is your mean-time-to-resolution and, quietly, your users’ trust. A team ships an API behind a custom domain, forgets the base-path mapping, and every request 403s with Missing Authentication Token — the API works fine on its execute-api URL, so they assume DNS. Another sets a tiny usage-plan quota for a partner, the partner’s nightly batch 429s at request 101, and because API Gateway has no dedicated throttle metric, nobody can see it in CloudWatch and everyone blames the network. A third puts a Lambda proxy integration into production, returns a bare object from the handler instead of the { statusCode, body } envelope, and ships a 502 to production on the happy path — the Lambda Errors metric is flat, so they debug the wrong service. None of these are exotic. They are the default behaviour of a rich, multi-layer service when you do not know which layer speaks which error.
Who hits this: anyone running an API past “hello world.” It bites hardest on teams new to API Gateway’s split between REST APIs (the feature-rich v1 with Gateway Responses, usage plans, mapping templates and WAF) and HTTP APIs (the cheaper, faster v2 with different, simpler error behaviour), on anyone fronting Lambda proxy integrations (where the response shape is a contract you can violate silently), on teams using custom domains and private endpoints (where base-path mappings and resource policies add two more 403 origins), and on anyone who assumed a 5xx meant “AWS is broken” rather than “my integration is.” The fix is almost never “retry and hope.” It is: read the status code, read the responseType, name the layer, confirm on the one field or metric that proves it, and apply the one setting that addresses that layer.
Here is the whole failure field on one screen — the status, the responseType that usually accompanies it, the layer it is born in, the one-line tell, and the first fix — so you can orient before the deep dive:
| Status you see | Usual responseType |
Layer it’s born in | The one-line tell | First fix |
|---|---|---|---|---|
| 403 Forbidden | MISSING_AUTHENTICATION_TOKEN |
Routing | Wrong path/method, or stage not deployed | Deploy the stage; fix the path/method |
| 403 Forbidden | ACCESS_DENIED / INVALID_SIGNATURE |
Auth (IAM) | not authorized to perform: execute-api:Invoke |
Fix the IAM/resource policy or SigV4 signing |
| 403 Forbidden | INVALID_API_KEY (body: Forbidden) |
API keys | Key missing, invalid, or not in a plan on this stage | Attach the key to a usage plan bound to the stage |
| 403 Forbidden | WAF_FILTERED |
Security | A WAF Web ACL blocked the request | Inspect WAF sampled requests; tune the rule |
| 403 Forbidden | ACCESS_DENIED (base-path / private) |
Custom domain / private API | Missing base-path mapping or endpoint-policy deny | Add the mapping; allow the aws:SourceVpce |
| 401 Unauthorized | UNAUTHORIZED |
Auth (authorizer) | Missing/expired/invalid token | Fix the token or the authorizer identity source |
| 429 Too Many Requests | THROTTLED |
Throttle | Token bucket empty (rate/burst) | Raise account/stage/method/plan rate + burst |
| 429 Too Many Requests | QUOTA_EXCEEDED |
Usage plan | Daily/weekly/monthly quota spent | Raise the quota, or issue a new key |
| 502 Bad Gateway | (DEFAULT_5XX) |
Integration | Lambda returned a malformed proxy shape | Return { statusCode, body: "<string>" } |
| 503 Service Unavailable | (DEFAULT_5XX) |
Integration | Backend / VPC-link target unavailable | Restore backend health; check the VPC link |
| 504 Gateway Timeout | INTEGRATION_TIMEOUT |
Integration | Backend slower than the 29 s ceiling | Speed up the backend; async pattern; raise quota |
| 500 Internal Server Error | API_CONFIGURATION_ERROR / AUTHORIZER_FAILURE |
Config / Auth | Bad mapping template, or authorizer threw | Fix the VTL template; fix the authorizer |
Learning objectives
By the end of this article you can:
- Trace a request through the API Gateway pipeline (WAF → authorizer → throttle/usage-plan → validation → integration → integration response → gateway response) and name the exact stage that generated any given error.
- Decode all six origins of a 403 —
MISSING_AUTHENTICATION_TOKEN(routing / not deployed), IAMACCESS_DENIED/INVALID_SIGNATURE,INVALID_API_KEY(Forbidden),WAF_FILTERED, custom-domain base-path mapping, and private-API endpoint policy — from the status body andresponseTypealone. - Distinguish 401 (
UNAUTHORIZED— the authorizer or JWT said no) from a 403 authorizer Deny and a 500AUTHORIZER_FAILURE, and know which one Cognito, a Lambda authorizer, and an HTTP-API JWT authorizer each emit. - Explain the token-bucket model and the four throttle layers (account, stage, per-method, usage-plan), tell
THROTTLEDfromQUOTA_EXCEEDED, and confirm a 429 despite there being noThrottleCountmetric. - Root-cause the three 5xx that matter: a 502 from a malformed Lambda proxy response (where
integrationStatus = 200butstatus = 502), a 504 from the 29-second integration timeout, and a 500 from an authorizer or config error — and the REST-vs-HTTP-API differences in how each behaves. - Customize error bodies and — critically — CORS headers on errors with Gateway Responses, and recite the full
$context.error.responseTypereference with default status codes. - Read the access-log
$contextfields (status,integrationStatus,integration.error,authorizer.error,error.message,error.responseType) and the metrics (4XXError,5XXError,Count,LatencyvsIntegrationLatency), and use theLatency − IntegrationLatencydecode to place a delay in the backend versus API Gateway’s own overhead. - Run a
status + responseType → layer → root cause → confirm → fixplaybook end to end, and reproduce and fix a 502, a 504 and a 429 in a hands-on lab.
Prerequisites & where this fits
You should already be comfortable with API Gateway basics: a REST API has resources (paths) and methods (HTTP verbs) wired to integrations (Lambda, HTTP, AWS-service, or a mock), deployed to a stage (prod, dev) that gives you the invoke URL https://{api-id}.execute-api.{region}.amazonaws.com/{stage}. You should know what a Lambda proxy integration is (API Gateway passes the whole request to Lambda and expects a specific response envelope back), be able to run aws from a shell and read JSON with --query, and be able to read a Terraform aws provider block. HTTP status codes, CORS, and the idea of an authorizer should be familiar.
This is the operational, incident-time companion to the design-side reference. If you have never built one of these APIs, start with the build-it-first walkthrough Amazon API Gateway Hands-On: REST vs HTTP APIs, Authorizers & Throttling — it covers resources, methods, integrations, the five authorizer types, usage plans and CORS in depth, and this article assumes you have seen them. The compute behind most integrations, and its own failure modes, are in AWS Lambda Errors, Timeouts & Cold Starts: The Troubleshooting Playbook — many an API Gateway 502/504 is really a Lambda problem, and the two playbooks are meant to be read together. When the front door is an ALB instead, the sibling reference is ALB 5xx Errors Decoded: A 502 / 503 / 504 Troubleshooting Playbook, and the decision of which front door you should be on in the first place is AWS Load Balancers and API Gateway: ALB, NLB and API Gateway Compared.
Before the deep dive, fix the mental model of where each failure lives, so you look in the right layer first:
| Pipeline layer | What lives here | Failure classes it causes | First place to look |
|---|---|---|---|
| Edge / WAF | AWS WAF Web ACL, TLS, region/edge endpoint | 403 WAF_FILTERED, TLS errors |
WAF sampled requests; $context.wafResponseCode |
| Routing / domain | Resource + method match, custom domain, base-path mapping | 403 MISSING_AUTHENTICATION_TOKEN, 404 |
$context.resourcePath; base-path mapping; is the stage deployed? |
| Authorization | IAM, Cognito, Lambda authorizer, JWT (HTTP) | 401 UNAUTHORIZED, 403 ACCESS_DENIED, 500 AUTHORIZER_FAILURE |
$context.authorizer.error, $context.authorizer.status |
| Throttle / metering | Account/stage/method throttle, usage plan + API key | 429 THROTTLED, 429 QUOTA_EXCEEDED, 403 INVALID_API_KEY |
Access log status=429; usage-plan config |
| Validation | Request validators, JSON-schema models, media types | 400 BAD_REQUEST_BODY/PARAMETERS, 415, 413 |
$context.error.message; the request validator |
| Integration | Lambda proxy, HTTP, VPC link, AWS service | 502 (shape), 503 (unavailable), 504 (timeout), 500 (config) |
$context.integrationStatus, $context.integrationLatency, execution logs |
| Observability | Execution logs, access logs, metrics, X-Ray | You can’t confirm anything | Account CloudWatch role set? Access logging on? |
Core concepts
The request pipeline — every error has a birthplace
An API Gateway request is not handled in one step; it flows through an ordered pipeline, and the first stage that rejects it decides the status code. Memorize this order, because it tells you which layer to inspect and, just as importantly, which layers the request never reached.
| # | Pipeline stage | What it does | Rejects with | Reached only if… |
|---|---|---|---|---|
| 1 | Edge / WAF | TLS terminate; AWS WAF Web ACL evaluation | 403 WAF_FILTERED |
Always (if a Web ACL is attached) |
| 2 | Route match | Match path + method to a resource/method | 403 MISSING_AUTHENTICATION_TOKEN, 404 RESOURCE_NOT_FOUND |
Request passed WAF |
| 3 | Authorizer | IAM / Cognito / Lambda / JWT identity check | 401 UNAUTHORIZED, 403 ACCESS_DENIED, 500 AUTHORIZER_FAILURE |
A route matched |
| 4 | API key + usage plan | Validate x-api-key, check plan membership |
403 INVALID_API_KEY |
apiKeyRequired is set |
| 5 | Throttle | Account → stage → method → plan token buckets | 429 THROTTLED, 429 QUOTA_EXCEEDED |
Auth + key passed |
| 6 | Request validation | Required params; JSON-schema body model | 400 BAD_REQUEST_PARAMETERS/BODY, 415, 413 |
Not throttled |
| 7 | Integration request | VTL mapping template → backend request | 500 API_CONFIGURATION_ERROR |
Validation passed |
| 8 | Integration | Call Lambda / HTTP / VPC link / AWS service | 502, 503, 504 INTEGRATION_TIMEOUT |
Mapping succeeded |
| 9 | Integration response | Map backend status/body → method response | 502 (malformed proxy shape) |
Integration returned |
| 10 | Gateway response | Render the final 4xx/5xx (body + CORS headers) | — (it renders the error) | Any earlier stage failed |
Two consequences fall straight out of this order. First, a 403 at stage 2 means stages 3–10 never ran — so there is no authorizer log, no integration latency, nothing downstream to inspect; the request died at the door. Second, the “gateway response” at stage 10 is where the body and headers of every error are decided, which is why customizing Gateway Responses is how you fix both ugly error bodies and the missing-CORS-on-errors problem that makes a clean 401 look like a browser CORS failure.
The two logging systems — you need both, and one is off by default
API Gateway has two independent CloudWatch logging systems, and confusing them wastes incidents. Execution logging is the verbose, per-request internal trace (method request headers, the endpoint URI, the integration response, the failure reason) written to a log group API Gateway names for you. Access logging is the one-line-per-request structured record you define with $context variables, written to a log group you name — this is the one you build dashboards and metric filters on.
| Aspect | Execution logging | Access logging |
|---|---|---|
| What it captures | Full internal trace: request/response, integration, errors | One structured line per request, fields you choose |
| Log group | API-Gateway-Execution-Logs_{api-id}/{stage} (auto) |
Any log group ARN you set |
| Turned on by | Stage methodSettings: loggingLevel = INFO/ERROR, dataTraceEnabled |
Stage accessLogSettings: destinationArn + format |
| Granularity | Per method (or */* for all) |
Per stage |
| Best for | Deep single-request forensics (the 502 reason string) | Dashboards, metric filters, throttle counting, $context |
| Gotcha | dataTraceEnabled logs full payloads — sensitive + costly |
Needs a valid format; empty/invalid format = silent no-logs |
| Shared prerequisite | Both need the account-level CloudWatch Logs role ARN set once per region | Same — no role = no logs, no error |
That last row is the single most common “logging is broken” cause: API Gateway can only write to CloudWatch Logs if you have set an account-level IAM role (cloudwatchRoleArn) once per region. Miss it and you enable logging, see nothing, and assume the API isn’t erroring — when it is, invisibly.
# One-time per region: let API Gateway write to CloudWatch Logs (the classic missing step)
aws iam create-role --role-name apigw-cloudwatch \
  --assume-role-policy-document '{"Version":"2012-10-17","Statement":[{"Effect":"Allow","Principal":{"Service":"apigateway.amazonaws.com"},"Action":"sts:AssumeRole"}]}'
aws iam attach-role-policy --role-name apigw-cloudwatch \
  --policy-arn arn:aws:iam::aws:policy/service-role/AmazonAPIGatewayPushToCloudWatchLogs
aws apigateway update-account \
  --patch-operations op=replace,path=/cloudwatchRoleArn,value=arn:aws:iam::111122223333:role/apigw-cloudwatch
# Terraform: the account role, plus a stage with BOTH logging systems on
resource "aws_api_gateway_account" "this" {
  cloudwatch_role_arn = aws_iam_role.apigw_cw.arn
}

resource "aws_api_gateway_stage" "prod" {
  rest_api_id   = aws_api_gateway_rest_api.api.id
  deployment_id = aws_api_gateway_deployment.d.id
  stage_name    = "prod"

  access_log_settings {                       # access logging (you pick the fields)
    destination_arn = aws_cloudwatch_log_group.access.arn
    format = jsonencode({
      requestId        = "$context.requestId"
      status           = "$context.status"
      responseType     = "$context.error.responseType"
      errorMessage     = "$context.error.message"
      integrationStatus= "$context.integrationStatus"
      integrationError = "$context.integration.error"
      authorizerError  = "$context.authorizer.error"
      latency          = "$context.responseLatency"
      integrationLat   = "$context.integrationLatency"
      wafCode          = "$context.wafResponseCode"
      apiKeyId         = "$context.identity.apiKeyId"
      sourceIp         = "$context.identity.sourceIp"
    })
  }
}

resource "aws_api_gateway_method_settings" "all" {  # execution logging (verbose trace)
  rest_api_id = aws_api_gateway_rest_api.api.id
  stage_name  = aws_api_gateway_stage.prod.stage_name
  method_path = "*/*"
  settings {
    logging_level      = "INFO"
    data_trace_enabled = true   # ⚠️ logs full payloads — dev only
    metrics_enabled    = true
  }
}
REST APIs vs HTTP APIs — the error behaviour is genuinely different
The same request can produce different errors depending on whether you are on a REST API (apigateway, v1) or an HTTP API (apigatewayv2, v2). This table is load-bearing: several “why is my HTTP API behaving differently” incidents are answered by one row.
| Behaviour | REST API (v1) | HTTP API (v2) |
|---|---|---|
| Unmatched route | 403 {"message":"Missing Authentication Token"} |
404 {"message":"Not Found"} |
| Integration timeout | 29 s default max (raisable above 29 s via quota request) | 30 s max, not raisable |
| Gateway Responses (custom 4xx/5xx bodies) | Full support, 20+ responseTypes |
Not supported — fixed error bodies |
| API keys + usage plans | Yes (rate/burst/quota per key) | No native usage plans / API keys |
| Request/response mapping (VTL) | Yes | No (parameter mapping only) |
| Request validation (JSON-schema) | Yes | No |
| AWS WAF | Yes (attach Web ACL to a stage) | No (front with CloudFront + WAF) |
| Authorizer failure (Lambda) | 500 AUTHORIZER_FAILURE |
500 (simple response false → 403) |
| JWT authorizer | via Cognito authorizer | Native JWT: 401 bad token, 403 bad scope |
Access log $context |
Rich, $context.error.responseType etc. |
Similar set, some fields differ/renamed |
| Cost | Higher (per million + features) | ~70% cheaper per million |
The practical upshot: HTTP APIs give you fewer knobs and therefore fewer error origins, but also fewer diagnostic surfaces — you cannot customize a Gateway Response or count throttles with a usage plan. Most of this playbook is written for REST APIs (the richer, more error-prone surface); HTTP-API-specific behaviour is called out per section.
403 Forbidden: six different failures wearing one status code
The 403 is the most over-triggered, most misdiagnosed status in all of API Gateway, because at least six unrelated failures all surface as 403. The responseType and the exact body message disambiguate them — never debug a 403 without reading both. Here is the complete field:
responseType |
Body message | Born in | Root cause | Confirm | Fix |
|---|---|---|---|---|---|
MISSING_AUTHENTICATION_TOKEN |
Missing Authentication Token |
Routing | Path/method has no route, or stage not deployed, or wrong stage in URL | $context.error.responseType; get-resources has no match; is there a deployment? |
Create the resource+method; deploy the stage; fix the URL |
ACCESS_DENIED |
User: ... is not authorized to perform: execute-api:Invoke |
Auth (IAM) | IAM identity/resource policy denies execute-api:Invoke |
Body names the ARN; check resource policy + caller IAM | Grant execute-api:Invoke on the method ARN; fix resource policy |
INVALID_SIGNATURE |
The request signature ... does not match |
Auth (IAM) | SigV4 signing wrong (clock skew, wrong secret/region/service) | responseType=INVALID_SIGNATURE; check clock + creds |
Re-sign correctly; sync clock; correct region/service in the signer |
INVALID_API_KEY |
Forbidden |
API keys | apiKeyRequired=true and key missing/invalid, or not in a usage plan on this stage |
responseType=INVALID_API_KEY; is key in a plan bound to the stage? |
Send valid x-api-key; attach the key to a usage plan on the stage |
WAF_FILTERED |
Forbidden |
Security | AWS WAF Web ACL rule blocked the request | $context.wafResponseCode; WAF sampled requests |
Tune/allowlist the WAF rule; fix the false positive |
ACCESS_DENIED (custom domain) |
Missing Authentication Token / Forbidden |
Custom domain | Base-path mapping missing or points at the wrong stage | Request works on execute-api URL, 403 on custom domain |
Create/repair the base-path mapping |
ACCESS_DENIED (private API) |
... not authorized ... |
Private API | Resource policy or VPC-endpoint policy denies the aws:SourceVpce |
responseType=ACCESS_DENIED from inside the VPC only |
Allow the aws:SourceVpce/aws:SourceVpc in the resource policy |
EXPIRED_TOKEN |
The security token ... has expired |
Auth (IAM) | Temporary AWS credentials expired | responseType=EXPIRED_TOKEN |
Refresh the credentials / role session |
Missing Authentication Token — the 403 that is really a 404
This is the one that has cost the industry the most collective hours. 403 {"message":"Missing Authentication Token"} is API Gateway’s response when it cannot match the request path and method to any route — and it phrases a routing miss as an auth error for historical, security-through-obscurity reasons (it declines to confirm whether a route exists). The four real causes, in order of how often they bite:
| Cause | What actually happened | Confirm | Fix |
|---|---|---|---|
| Wrong path or method | POST /order but only /orders exists, or GET where only POST is defined |
aws apigateway get-resources shows no matching path/method |
Correct the client URL/verb, or add the resource+method |
| Stage not deployed | You created/changed methods but never created a deployment | No deployment for the stage, or an old one | aws apigateway create-deployment --stage-name prod |
| Wrong stage in the URL | Calling /dev when it’s deployed to /prod (or vice-versa) |
The other stage works | Use the correct stage path segment |
| Missing base-path mapping | Custom domain has no mapping for that base path | Works on the raw execute-api URL |
Add the base-path mapping to the domain |
The tell that separates this from a genuine auth failure: there is no authorizer in the picture at all. If you have not attached an authorizer and you are getting “Missing Authentication Token,” it is a route/deploy problem 100% of the time. And the cruelest variant is after a change: you edit a method in the console or via CLI, test it, and it 403s — because API Gateway changes are inert until you deploy them to a stage. The mutation exists on the API but not on the stage the URL points at.
# Confirm the route exists, then (the usual fix) deploy the stage
aws apigateway get-resources --rest-api-id abcd1234 \
  --query 'items[].{path:path,methods:keys(resourceMethods||`{}`)}'
aws apigateway create-deployment --rest-api-id abcd1234 --stage-name prod
Private APIs — the three access controls behind one 403
A private API (endpoint type PRIVATE, reached only through an interface VPC endpoint) adds two more places a 403 can be born, and they fail so similarly that people fix the wrong one. Check all three, in order:
| Control | Governs | 403 when it’s wrong | Fix |
|---|---|---|---|
| Resource policy (on the API) | Which VPC endpoints / principals may invoke | No aws:SourceVpce (or principal) allow statement |
Allow the specific aws:SourceVpce/aws:SourceVpc |
VPC endpoint policy (on the execute-api VPCE) |
What that endpoint is allowed to reach | Endpoint policy denies the API or execute-api:Invoke |
Allow execute-api:Invoke on the API ARN |
| Security group (on the VPCE network interfaces) | Network reachability to the endpoint | Port 443 not open from the caller’s subnet | Open 443 inbound from the client SG/CIDR |
The tell that it’s a private-API 403 rather than an ordinary one: it happens only from inside the VPC (the request never leaves to the public execute-api edge), and the resource policy is almost always the culprit — a private API with no resource policy denies everything by default.
401 Unauthorized: the authorizer said no
A 401 in API Gateway is specifically the authorizer (or the native JWT authorizer on HTTP APIs) rejecting the request’s identity — and it is worth separating cleanly from the authorizer denying (which is a 403) and the authorizer erroring (which is a 500). One authorizer produces all three depending on what it returns.
| Outcome | Status | responseType |
What the authorizer did | Confirm |
|---|---|---|---|---|
| Token missing / fails identity source | 401 |
UNAUTHORIZED |
TOKEN authorizer got no/badly-shaped token, or returned the literal Unauthorized |
$context.authorizer.status; body Unauthorized |
| Explicit Deny policy | 403 |
ACCESS_DENIED |
Authorizer returned an IAM policy with Effect: Deny |
Body: not authorized to access this resource |
| Authorizer threw / timed out | 500 |
AUTHORIZER_FAILURE |
The authorizer Lambda errored or exceeded its timeout | $context.authorizer.error populated |
| Authorizer misconfigured | 500 |
AUTHORIZER_CONFIGURATION_ERROR |
Bad authorizer setup (e.g. bad role, unreachable) | responseType=AUTHORIZER_CONFIGURATION_ERROR |
| Cognito: invalid/expired JWT | 401 |
UNAUTHORIZED |
Cognito user-pool authorizer rejected the token | $context.authorizer.error; token exp |
| HTTP API JWT: bad token | 401 |
(fixed) | JWT missing/expired/wrong iss/aud |
HTTP-API access log; JWT claims |
| HTTP API JWT: insufficient scope | 403 |
(fixed) | Token valid but lacks the route’s required scope | Route’s authorizationScopes vs token scope |
Which authorizer you chose decides how a rejection looks, so knowing each type’s failure signature is half the diagnosis:
| Authorizer type | Identifies via | 401 when… |
403 when… |
500 when… |
|---|---|---|---|---|
IAM (AWS_IAM) |
SigV4 signature | — (bad signature is a 403) | execute-api:Invoke denied; signature/policy rejects |
— |
| Cognito user pool | Cognito JWT in Authorization |
Token missing/expired/invalid | Valid token, scope/group not allowed | Pool/config unreachable |
| Lambda TOKEN | One header token + an identity-source regex | Returns Unauthorized or regex miss |
Returns a Deny policy |
Function throws / times out |
| Lambda REQUEST | Any headers/query/path/context | Returns Unauthorized |
Returns a Deny policy |
Function throws / times out |
| JWT (HTTP API) | OAuth2/OIDC JWT (iss/aud) |
Bad/expired/missing JWT | Valid JWT, missing required scope | Misconfigured issuer/JWKS |
The clean mental split for JWT/OAuth: 401 = we don’t know who you are (authentication failed); 403 = we know who you are, but you can’t do this (authorization failed). HTTP APIs implement this distinction natively and correctly. For a REST-API Lambda authorizer, you control it: return the string Unauthorized (or throw) for a 401, return a Deny policy for a 403, and make sure the function never simply errors — an unhandled exception becomes a 500 AUTHORIZER_FAILURE, which reads to the client as “the API is broken,” not “you’re not allowed.”
# Test a REST-API authorizer in isolation — see exactly what it returns before blaming it
aws apigateway test-invoke-authorizer --rest-api-id abcd1234 \
  --authorizer-id auth123 \
  --headers Authorization=Bearer_badtoken
# Look at the returned policy (Allow/Deny) and the log; a thrown error here = your 500
429 Too Many Requests: the token bucket and four throttle layers
A 429 means the request was rejected by a rate limiter, not by your code. API Gateway throttles with a token-bucket algorithm at four layers, and a 429 can come from any of them. Understanding the bucket is the whole game: the burst is the bucket’s capacity (how many tokens can exist at once), the rate is how many tokens refill per second, each request removes one token, and an empty bucket returns 429 {"message":"Too Many Requests"} with responseType=THROTTLED. A separate, longer-window quota counter (per day/week/month, usage plans only) returns 429 with responseType=QUOTA_EXCEEDED when spent.
| Throttle layer | Scope | Default | responseType |
Set via |
|---|---|---|---|---|
| Account | All APIs in the account, per Region | 10,000 rps steady, 5,000 burst (soft, raisable) | THROTTLED |
Service Quotas request |
| Stage (default method) | Every method on a stage | Inherits account | THROTTLED |
Stage throttle / methodSettings */* |
| Per-method | One resource+method on a stage | Inherits stage | THROTTLED |
methodSettings on {resource}/{METHOD} |
| Usage plan (per API key) | A key’s traffic to a stage | Whatever you set | THROTTLED (rate/burst) + QUOTA_EXCEEDED (quota) |
create-usage-plan --throttle + --quota |
The layers are evaluated most-specific-first, so the effective limit is the tightest one that applies to the request. A common surprise: a per-method throttle of 5 rps caps that method even though the stage and account allow thousands — someone set it months ago and forgot. The token-bucket parameters, precisely:
| Parameter | Meaning | Empty/exhausted result | Where it applies |
|---|---|---|---|
Rate limit (rateLimit) |
Steady-state refill, requests/second | Sustained overage → 429 THROTTLED |
All four layers |
Burst limit (burstLimit) |
Bucket capacity — max simultaneous | A spike beyond it → 429 THROTTLED |
All four layers |
Quota (limit + period) |
Total requests per DAY/WEEK/MONTH |
Counter spent → 429 QUOTA_EXCEEDED |
Usage plans only |
The layers are checked most-specific-first, and the first ceiling the request crosses is the one that throttles it — which is why a forgotten per-method limit can throttle a method while the stage and account sit idle:
| Order | Limit evaluated | Scope | If exceeded |
|---|---|---|---|
| 1 | Usage-plan per-method override | One key, one method | 429 THROTTLED |
| 2 | Usage-plan rate/burst + quota | One key, all methods | 429 THROTTLED / QUOTA_EXCEEDED |
| 3 | Per-method stage throttle | All callers, one method | 429 THROTTLED |
| 4 | Stage default, then account (10k/5k) | All callers, all methods | 429 THROTTLED |
And here is the single most important 429 gotcha: API Gateway has no dedicated throttle metric. The AWS/ApiGateway namespace emits Count, 4XXError, 5XXError, Latency, IntegrationLatency, CacheHitCount and CacheMissCount — and 429s are counted inside 4XXError, indistinguishable from 400s and 403s at the metric level. To see throttling specifically you must go to the access log, filter status = 429, and split on $context.error.responseType (THROTTLED vs QUOTA_EXCEEDED). Build a CloudWatch Logs metric filter on that if you want a graph. Teams waste hours looking for a throttle metric that does not exist.
# Tighten a per-method throttle (REST): all methods, or one method
aws apigateway update-stage --rest-api-id abcd1234 --stage-name prod \
  --patch-operations \
    op=replace,path=/*/*/throttling/rateLimit,value=100 \
    op=replace,path=/*/*/throttling/burstLimit,value=50

# A usage plan with a deliberately tiny quota (partner tier)
aws apigateway create-usage-plan --name partner-basic \
  --throttle rateLimit=10,burstLimit=5 \
  --quota limit=1000,period=DAY \
  --api-stages apiId=abcd1234,stage=prod

# CONFIRM a 429 from access logs (there is no ThrottleCount metric)
aws logs filter-log-events --log-group-name /apigw/access/orders-prod \
  --filter-pattern '{ $.status = "429" }' \
  --query 'events[].message' --output text
# Terraform: stage-level default throttle + a metered usage plan
resource "aws_api_gateway_method_settings" "throttle" {
  rest_api_id = aws_api_gateway_rest_api.api.id
  stage_name  = aws_api_gateway_stage.prod.stage_name
  method_path = "*/*"
  settings {
    throttling_rate_limit  = 100
    throttling_burst_limit = 50
    metrics_enabled        = true
  }
}

resource "aws_api_gateway_usage_plan" "partner_basic" {
  name = "partner-basic"
  api_stages {
    api_id = aws_api_gateway_rest_api.api.id
    stage  = aws_api_gateway_stage.prod.stage_name
  }
  throttle_settings { rate_limit = 10  burst_limit = 5 }
  quota_settings   { limit = 1000  period = "DAY" }
}
5xx: 502, 503, 504 and 500 — where the server broke
A 5xx from API Gateway is almost always about the integration — the backend it called on your behalf — not about AWS being down. The four codes are precise, and the difference between them tells you exactly where to look. Read $context.integrationStatus and $context.integrationLatency first; they separate “the backend answered badly” from “the backend never answered in time.”
| Status | responseType |
Meaning | Root cause | Confirm | Fix |
|---|---|---|---|---|---|
| 500 | API_CONFIGURATION_ERROR |
API Gateway couldn’t process the integration config | Broken VTL mapping template; bad stage variable; wrong integration URI | Execution log names the template/line; $context.error.message |
Fix the mapping template / stage variable |
| 500 | AUTHORIZER_FAILURE |
The authorizer errored or timed out | Authorizer Lambda threw / exceeded timeout | $context.authorizer.error set |
Fix the authorizer code/perms/timeout |
| 502 | (DEFAULT_5XX) |
Bad gateway — integration returned something unusable | Lambda proxy returned a malformed shape; non-JSON body where JSON expected | integrationStatus=200 but status=502; log: Malformed Lambda proxy response |
Return { statusCode, headers, body:"<string>" } |
| 503 | (DEFAULT_5XX) |
Service unavailable | Backend down; VPC-link NLB has no healthy target; integration overloaded | integrationStatus=503/-; backend/VPC-link health |
Restore backend; fix VPC-link target health |
| 504 | INTEGRATION_TIMEOUT |
Gateway timeout — integration exceeded the limit | Backend slower than the 29 s ceiling (REST) / 30 s (HTTP) | integrationLatency ≈ 29000; log: Execution failed due to a timeout error |
Speed up backend; async/202 pattern; raise the 29 s quota |
| 504 | INTEGRATION_FAILURE |
Integration returned an unrecoverable error | Integration connection reset / unreachable endpoint | $context.integration.error; integrationStatus=- |
Fix connectivity; retry/backoff at the backend |
Which 5xx you get, and whose fault it is, depends on the integration type — specifically on who is responsible for shaping the response:
| Integration type | Who shapes the response | Typical 5xx failure |
|---|---|---|
Lambda proxy (AWS_PROXY) |
Your handler must return {statusCode, headers, body} |
502 on a malformed / bare-object shape |
| Lambda (non-proxy) | An integration-response VTL template you write | 500 API_CONFIGURATION_ERROR on a broken template |
| HTTP / HTTP_PROXY | The backend’s status is passed through | 502/503/504 from the backend or the connection |
| AWS service (e.g. SQS, DynamoDB) | A mapping template → the service API | 500 on a bad template; the service error mapped through |
The 502 that is really a 200 — malformed Lambda proxy response
This is the 5xx that fools everyone, because your Lambda succeeded. In a Lambda proxy integration, API Gateway hands the whole request to Lambda and expects a very specific envelope back:
| Field | Required? | Type | If you get it wrong |
|---|---|---|---|
statusCode |
Yes | integer | Missing → 502 Malformed Lambda proxy response |
body |
Yes (for a body) | string (JSON-stringified, not an object) | Object instead of string → 502 |
headers |
Optional | object of string values | Non-string values can break rendering |
isBase64Encoded |
Optional | boolean | Wrong for binary → corrupted/502 payloads |
multiValueHeaders |
Optional | object of string arrays | Malformed → 502 |
| (returning a bare object) | — | — | return {"ok":true} → 502, not 200 |
When the handler returns the wrong shape — the classic being a bare return {"ok": true} instead of return {"statusCode": 200, "body": json.dumps({"ok": True})} — Lambda runs perfectly and returns 200 to API Gateway, which then rejects the shape and synthesizes a 502 to the client. The fingerprint is unmistakable once you know it: in the access log, $context.integrationStatus = 200 while $context.status = 502, integrationLatency is normal, the Lambda Errors metric is flat, and the execution log says Execution failed due to configuration error: Malformed Lambda proxy response. You will debug the wrong service for an hour if you trust the Lambda metrics; trust the integrationStatus vs status split instead.
The 504 at exactly 29 seconds — the integration timeout
API Gateway will wait a maximum of 29 seconds (REST APIs, default) for an integration to respond before it gives up and returns a 504 with responseType=INTEGRATION_TIMEOUT. This ceiling is independent of your Lambda’s own timeout (which can be up to 900 s) — Lambda keeps running and billing after API Gateway has already 504’d the client, which is a real cost and correctness trap. The fingerprint: $context.integrationLatency pinned at ~29,000 ms, the execution log line Execution failed due to a timeout error, and — the tell that it’s the gateway not the backend giving up — the backend (Lambda/EC2) log shows the work continuing past the 504. As of 2024, REST APIs can request a quota increase above 29 s, but HTTP APIs are hard-capped at 30 s and not raisable. The right fix is rarely “wait longer”: it is to make the call fast, or to switch to an asynchronous pattern — return 202 Accepted immediately, do the work in the background (Step Functions, SQS + Lambda), and let the client poll or receive a webhook.
Gateway Responses: customizing 4xx/5xx bodies and CORS-on-errors
Every error above is ultimately rendered by a Gateway Response — the pipeline’s final stage. On REST APIs you can customize the body, status code and headers of each responseType, which is how you turn a terse {"message":"Forbidden"} into a structured error your clients can parse, and — far more importantly — how you put CORS headers on error responses. This is the reference every senior keeps bookmarked: the full responseType set with default status codes.
responseType |
Default status | Class | Fires when |
|---|---|---|---|
ACCESS_DENIED |
403 | Auth | IAM/authorizer explicit Deny; resource-policy deny |
API_CONFIGURATION_ERROR |
500 | Config | Invalid mapping template, bad stage var, bad integration |
AUTHORIZER_CONFIGURATION_ERROR |
500 | Auth | API Gateway can’t reach/parse the authorizer |
AUTHORIZER_FAILURE |
500 | Auth | Authorizer Lambda threw or timed out |
BAD_REQUEST_PARAMETERS |
400 | Validation | Required query/header/path parameter missing |
BAD_REQUEST_BODY |
400 | Validation | Body fails the JSON-schema model |
DEFAULT_4XX |
(4xx) | Fallback | Any 4xx with no specific type set — add CORS here |
DEFAULT_5XX |
(5xx) | Fallback | Any 5xx with no specific type set — add CORS here |
EXPIRED_TOKEN |
403 | Auth | Temporary AWS credentials expired (IAM auth) |
INTEGRATION_FAILURE |
504 | Integration | Integration returned an unrecoverable error |
INTEGRATION_TIMEOUT |
504 | Integration | Integration exceeded the 29 s ceiling |
INVALID_API_KEY |
403 | Keys | apiKeyRequired but key missing/invalid/not in a plan |
INVALID_SIGNATURE |
403 | Auth | SigV4 signature mismatch (IAM auth) |
MISSING_AUTHENTICATION_TOKEN |
403 | Routing | Route (resource+method) not found / not deployed |
QUOTA_EXCEEDED |
429 | Throttle | Usage-plan quota (day/week/month) exhausted |
REQUEST_TOO_LARGE |
413 | Payload | Request body over the 10 MB limit |
RESOURCE_NOT_FOUND |
404 | Routing | Resource explicitly not found |
THROTTLED |
429 | Throttle | Account/stage/method/plan rate+burst bucket empty |
UNAUTHORIZED |
401 | Auth | Authorizer returned Unauthorized / token failed identity source |
UNSUPPORTED_MEDIA_TYPE |
415 | Validation | Content-Type not accepted by the model/mapping |
WAF_FILTERED |
403 | Security | AWS WAF Web ACL blocked the request |
The CORS-on-errors trap
Here is a bug that generates a flood of “the API is down” reports when it isn’t: CORS headers you configured on your method/integration responses are NOT applied to Gateway Responses. So when API Gateway returns a 401, 403, 429 or 500 from an early pipeline stage (before your integration ran), the response has no Access-Control-Allow-Origin header — and a browser therefore reports it as a CORS error, hiding the real 401/429 from your frontend entirely. The developer sees “CORS policy blocked” and debugs CORS for hours; the real problem is an expired token or a throttle. The fix is to add the CORS headers to the DEFAULT_4XX and DEFAULT_5XX Gateway Responses so every error carries them:
# Put CORS headers on ALL 4xx errors so the browser sees the real status, not a CORS error
aws apigateway put-gateway-response --rest-api-id abcd1234 \
  --response-type DEFAULT_4XX \
  --response-parameters '{"gatewayresponse.header.Access-Control-Allow-Origin":"'"'"'*'"'"'"}'
# Terraform: CORS on default errors + a structured 429 body
resource "aws_api_gateway_gateway_response" "cors_4xx" {
  rest_api_id   = aws_api_gateway_rest_api.api.id
  response_type = "DEFAULT_4XX"
  response_parameters = {
    "gatewayresponse.header.Access-Control-Allow-Origin"  = "'*'"
    "gatewayresponse.header.Access-Control-Allow-Headers" = "'Content-Type,Authorization,x-api-key'"
  }
}

resource "aws_api_gateway_gateway_response" "throttled" {
  rest_api_id   = aws_api_gateway_rest_api.api.id
  response_type = "THROTTLED"
  status_code   = "429"
  response_templates = {
    "application/json" = "{\"error\":$context.error.messageString,\"type\":\"$context.error.responseType\",\"requestId\":\"$context.requestId\"}"
  }
  response_parameters = {
    "gatewayresponse.header.Access-Control-Allow-Origin" = "'*'"
    "gatewayresponse.header.Retry-After"                 = "'1'"
  }
}
Reading the signal: access-log $context, execution logs, and the metrics
You never fix an API Gateway problem you haven’t confirmed on a field or metric first. The access log is your primary instrument — but only if it carries the right $context variables. These are the fields that actually resolve incidents, and what each one tells you.
$context field |
What it is | What it confirms |
|---|---|---|
$context.status |
Final status returned to the client | The class (403/429/502/504) |
$context.error.responseType |
The Gateway Response type | The exact sub-cause (THROTTLED vs QUOTA_EXCEEDED, etc.) |
$context.error.message |
API Gateway’s error message string | Human-readable reason |
$context.error.messageString |
Quoted version (for JSON templates) | Use in Gateway Response templates |
$context.integrationStatus |
Status the integration returned | 200 here + 502 in status = malformed proxy shape |
$context.integration.status |
Same, newer form | Integration’s own status |
$context.integration.error |
Error message from the integration | Why the integration failed |
$context.integrationErrorMessage |
Integration error (legacy field) | Backend error text |
$context.integrationLatency |
Backend-only latency (ms) | ~29,000 = the 29 s timeout |
$context.responseLatency |
Total end-to-end latency (ms) | Compare with integrationLatency |
$context.authorizer.error |
Authorizer error message | The authorizer threw/failed |
$context.authorizer.status |
Authorizer’s returned status | 401/403/500 from auth |
$context.authorizer.latency |
Authorizer invocation time | Slow/timing-out authorizer |
$context.wafResponseCode |
WAF’s verdict | 403 blocks came from WAF |
$context.identity.apiKeyId |
The API key used | Which key hit a quota |
$context.identity.sourceIp |
Caller IP | Who is generating the errors |
$context.identity.userArn |
IAM caller ARN | Which principal was denied |
When the access log tells you the class but not the why, drop into the execution log for that request — its lines are verbose but predictable, and a handful of them decide the diagnosis:
| Execution-log line (excerpt) | What it tells you |
|---|---|
Method request path: {...} / Method request headers: |
The request as API Gateway parsed it (routing + validation) |
Endpoint request URI: ... |
The integration URL it actually called |
Received response. Status: 200 |
The integration’s own status — compare with the final status |
Execution failed due to configuration error: Malformed Lambda proxy response |
The 502 — Lambda returned a bad proxy shape |
Execution failed due to a timeout error |
The 504 — the 29 s integration timeout fired |
Lambda execution failed with status 200 due to customer function error: ... |
The Lambda threw; API Gateway received the error payload |
Method completed with status: 502 |
The final status returned to the client |
Latency vs IntegrationLatency — where did the time go?
Two latency metrics, and their difference is a diagnostic in itself. Latency is the total time from API Gateway receiving the request to returning the response; IntegrationLatency is only the backend portion. Subtract them and you get API Gateway’s own overhead — authorizer, mapping templates, throttling checks.
| What you observe | It means | Do this |
|---|---|---|
IntegrationLatency high, ≈ Latency |
The backend is slow — 504 risk at 29 s | Speed up/scale the integration; async pattern |
Latency high, IntegrationLatency low |
API Gateway overhead — usually a slow authorizer or heavy VTL | Cache the authorizer (TTL); simplify mapping templates |
| Both low, but 5xx | Not latency — it’s a shape/config error | Check integrationStatus vs status (the 502) |
IntegrationLatency pinned ~29,000 ms |
The 29 s integration timeout fired | 504; make the call fast or go async |
The CloudWatch metrics themselves are few — know them cold, and know their gaps:
| Metric | Namespace | Confirms | Read it as |
|---|---|---|---|
Count |
AWS/ApiGateway | Traffic baseline | Denominator for error rate |
4XXError |
AWS/ApiGateway | Client-side errors (incl. 401/403/404/429) | 429s hide here — split via access logs |
5XXError |
AWS/ApiGateway | Server-side errors (500/502/503/504) | Rising → integration/authorizer problem |
Latency |
AWS/ApiGateway | Total round-trip time | p99 near 29 s → 504 imminent |
IntegrationLatency |
AWS/ApiGateway | Backend-only time | Compare with Latency for the decode above |
CacheHitCount / CacheMissCount |
AWS/ApiGateway | REST cache effectiveness | Low hit rate → cache key/TTL wrong |
(no ThrottleCount) |
— | — | There is none — count 429s from access logs |
# Split latency: is the delay in the backend or in API Gateway's overhead?
aws cloudwatch get-metric-statistics --namespace AWS/ApiGateway \
  --metric-name IntegrationLatency --dimensions Name=ApiName,Value=orders Name=Stage,Value=prod \
  --start-time "$(date -u -v-1H +%FT%TZ)" --end-time "$(date -u +%FT%TZ)" \
  --period 300 --statistics Average p99

# Confirm 5xx and split by responseType from access logs (Logs Insights)
aws logs start-query --log-group-name /apigw/access/orders-prod \
  --start-time $(date -u -v-1H +%s) --end-time $(date -u +%s) \
  --query-string 'fields @timestamp, status, responseType, integrationStatus | filter status >= 500 | stats count() by responseType, integrationStatus'
Keep this access-log query cookbook — each turns a vague “it’s erroring” into a confirmed layer in one paste (run against your access-log group in Logs Insights):
| Goal | Logs Insights query |
|---|---|
| Throttles (the missing metric) | filter status="429" | stats count() by responseType (splits THROTTLED vs QUOTA_EXCEEDED) |
| The malformed-proxy 502 | filter status="502" and integrationStatus="200" | stats count() by bin(5m) |
| The 29-second 504 | filter responseType="INTEGRATION_TIMEOUT" | stats count(), avg(integrationLat) by bin(5m) |
| 403 breakdown | filter status="403" | stats count() by responseType (routing vs IAM vs key vs WAF) |
| Authorizer failures | filter authorizerError != "" | stats count() by authorizerError |
| Slow authorizer (overhead) | filter latency > 1000 and integrationLat < 200 | stats count() by bin(5m) |
A fast triage decision table for the first 60 seconds of an incident:
| If you see… | It’s probably… | Do this first |
|---|---|---|
403, no authorizer attached |
Route/deploy miss (MISSING_AUTHENTICATION_TOKEN) |
Check the path/method; deploy the stage |
403 Forbidden, key in use |
API key not in a plan on this stage | Attach the key to a usage plan bound to the stage |
403, only on the custom domain |
Base-path mapping | Repair the base-path mapping |
401 UNAUTHORIZED |
Bad/expired token | Fix the token / authorizer identity source |
429, 4XXError up but no throttle graph |
Throttle (no metric exists) | Filter access logs status=429; raise limits |
502, Lambda Errors flat |
Malformed proxy shape | integrationStatus=200 + status=502 → fix the envelope |
504, IntegrationLatency ≈ 29 s |
29 s integration timeout | Speed up backend / go async |
500, $context.authorizer.error set |
Authorizer threw | Fix the authorizer code/timeout |
5xx, integrationStatus = real 5xx |
The backend returned it | Debug the backend, not API Gateway |
| Browser “CORS blocked” on error | Missing CORS on Gateway Responses | Add CORS to DEFAULT_4XX/DEFAULT_5XX |
Architecture at a glance
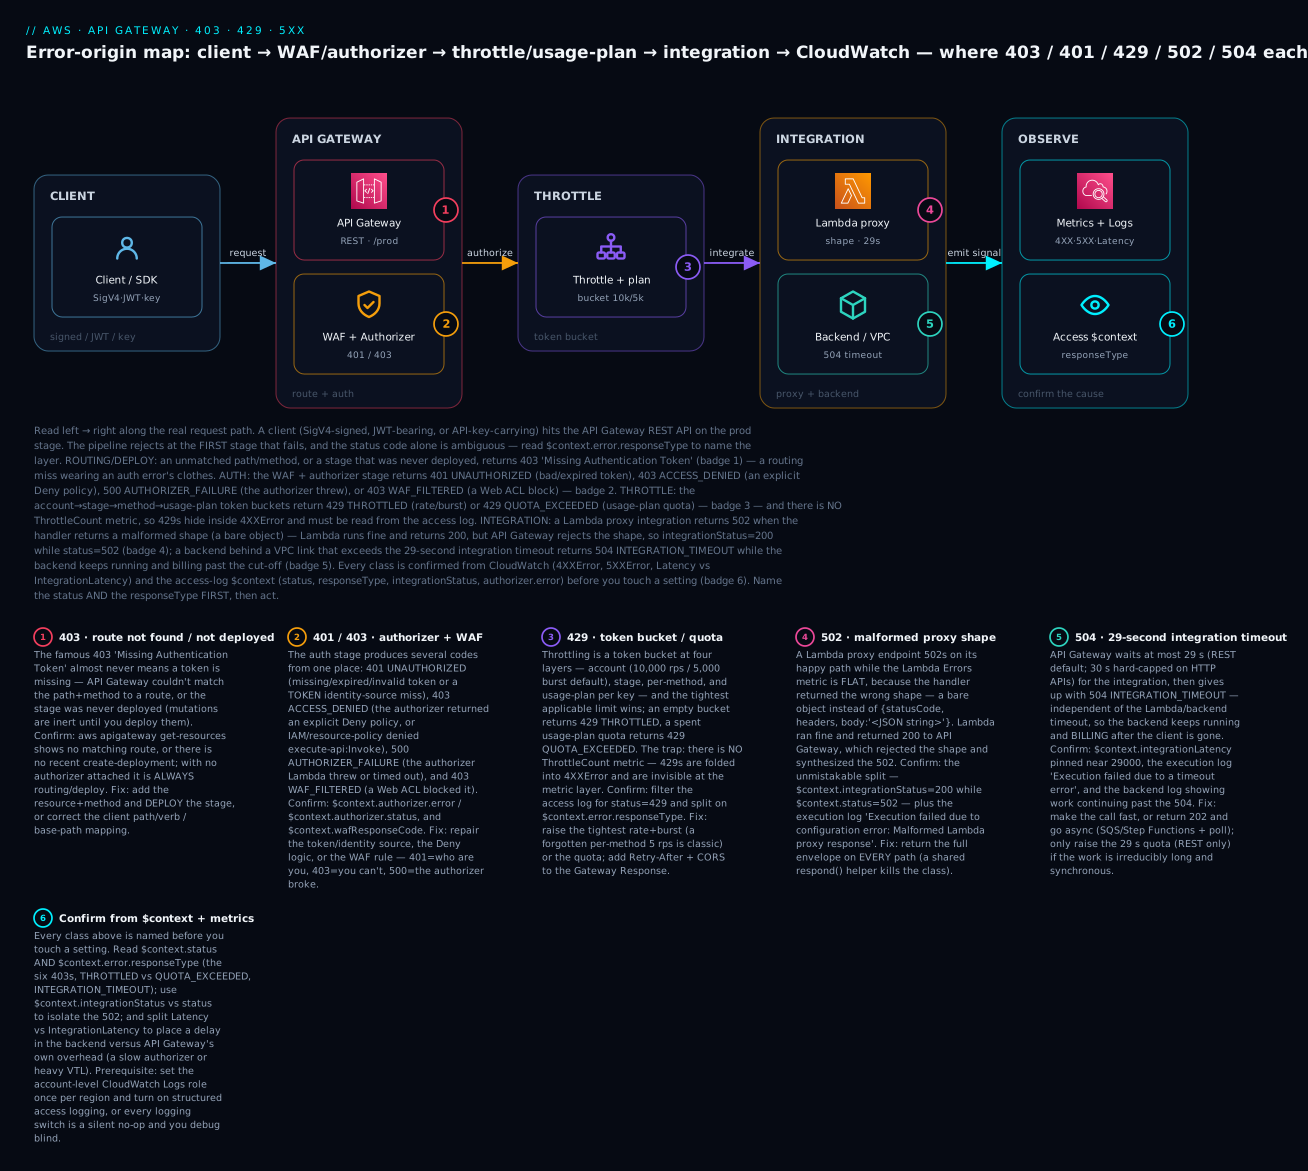
The diagram traces the real path a request takes through API Gateway and pins each error class to the exact hop where it is born. Read left to right: a client (SigV4-signed, JWT-bearing, or API-key-carrying) hits the API Gateway edge, where WAF and the authorizer run first (401/403 origin), then the throttle and usage-plan token bucket (429 origin), then the integration to Lambda proxy (the 502 malformed-shape origin) or a backend behind a VPC link (the 504 timeout origin) — and every outcome is confirmed from CloudWatch metrics and the access-log $context on the right. The six numbered badges mark where 403/401, 429, 502, 504 and the confirm step each bite; the legend narrates every one as status · confirm · fix.
Real-world scenario
PetalCourier, a mid-size logistics startup on ap-south-1, ran a REST API behind API Gateway fronting three Lambda proxy integrations: a synchronous rate-quote endpoint, a label-generation endpoint that called a slow third-party carrier API, and a partner webhook metered by usage plan. Over one peak-season Monday all three broke in ways that, on the surface, looked like “API Gateway is flaky.” The on-call engineer’s runbook note afterwards read: read the status and the responseType first — the same “it’s 5xx’ing” meant three different services.
The rate-quote endpoint started returning 502 to a slice of users right after a deploy. The Lambda Errors metric was flat and Duration was healthy, so the team spent forty minutes convinced it was a networking blip. The access log told the truth in one line: status=502 while integrationStatus=200. A refactor had changed the handler’s happy path to return quote (a bare dict) instead of the proxy envelope return {"statusCode": 200, "body": json.dumps(quote)}. Lambda ran perfectly and returned 200 to API Gateway, which rejected the shape and synthesized the 502 — the execution log’s Malformed Lambda proxy response confirmed it. The fix was three lines restoring the envelope; the lesson was to trust integrationStatus over the Lambda metrics.
The label-generation endpoint threw 504 under load. IntegrationLatency was pinned at 29,000 ms and the execution log said Execution failed due to a timeout error, while the Lambda’s own CloudWatch log showed the carrier call still running at 45 seconds — Lambda kept working (and billing) long after API Gateway had 504’d the client. Raising the Lambda timeout did nothing, because the ceiling was API Gateway’s 29 seconds, not Lambda’s. The real fix was architectural: they switched label generation to an asynchronous 202 pattern — the endpoint now drops the job on SQS and returns 202 Accepted with a job ID in well under a second, a worker Lambda calls the carrier without a 29-second gun to its head, and the client polls a status endpoint. p99 on the front door fell from 29 s (timing out) to ~120 ms.
The partner webhook was the subtle one. A partner reported “random failures,” but the API dashboards looked fine — 5XXError was zero and 4XXError only mildly elevated. Because API Gateway has no throttle metric, the 429s were invisible, buried inside 4XXError alongside ordinary 400s. The engineer filtered the access log for status=429 and found responseType=QUOTA_EXCEEDED: the partner’s usage plan had a limit=10000, period=DAY quota, and their new nightly reconciliation batch blew through it by 09:00. Compounding it, the partner’s frontend showed a generic “network error” because the 429 Gateway Response carried no CORS header — the browser reported a CORS failure, masking the real cause. The fix was two-fold: raise the quota to match the partner’s real volume and add Retry-After plus CORS headers to the THROTTLED/QUOTA_EXCEEDED Gateway Responses so the partner’s client could back off intelligently instead of seeing a phantom CORS error.
Advantages and disadvantages
Understanding API Gateway’s error model is the difference between it being a robust, observable front door and being an opaque source of misleading 4xx/5xx. The same richness that gives you fine-grained control also creates more layers that can each fail.
| Advantages (when you operate it right) | Disadvantages (the traps to manage) |
|---|---|
Every error has a precise responseType you can confirm |
Six different failures all surface as 403 |
Access-log $context pinpoints the exact layer |
Two logging systems, one off by default (account role) |
integrationStatus vs status cleanly isolates the 502 |
Malformed proxy shape 502s look like a backend problem |
| Gateway Responses customize bodies + CORS on errors | Missing CORS on errors masks the real 401/429 as a “CORS bug” |
| Four throttle layers give precise rate control | No ThrottleCount metric — 429s hide in 4XXError |
| Managed TLS, WAF, auth, caching at the edge | The 29 s integration timeout is a hard ceiling on sync work |
| REST + HTTP APIs cover rich and cheap/fast needs | REST and HTTP APIs behave differently on the same failure |
The advantages dominate for public and partner-facing APIs that need auth, metering, request validation and a managed edge — exactly where you want a precise, confirmable error surface. The disadvantages dominate when teams treat API Gateway as a dumb passthrough: they never set the account CloudWatch role (so they’re blind), never customize Gateway Responses (so errors are terse and CORS-broken), and never learn the integrationStatus/status split (so every 502 is a witch-hunt). The skill is configuring the observability and the error rendering before the incident, so that when the page fires you can name the layer in seconds.
Hands-on lab
You will reproduce and fix three classic failures on a free-tier-friendly account in ap-south-1: a 502 (a Lambda proxy that returns a malformed shape), a 504 (a backend that sleeps past the 29 s integration timeout), and a 429 (a deliberately tiny usage-plan quota). You will confirm each from access logs and metrics, then fix it. Everything here is within the API Gateway, Lambda and CloudWatch free tiers (a few pennies of logs at most); teardown is at the end. Run in CloudShell (Bash) where aws is pre-authenticated.
Step 0 — Variables, the account CloudWatch role, and an execution role.
export AWS_DEFAULT_REGION=ap-south-1
ACCT=$(aws sts get-caller-identity --query Account --output text)

# The account-level role so access/execution logs actually get written (once per region)
aws iam create-role --role-name apigw-cw-lab \
  --assume-role-policy-document '{"Version":"2012-10-17","Statement":[{"Effect":"Allow","Principal":{"Service":"apigateway.amazonaws.com"},"Action":"sts:AssumeRole"}]}' >/dev/null
aws iam attach-role-policy --role-name apigw-cw-lab \
  --policy-arn arn:aws:iam::aws:policy/service-role/AmazonAPIGatewayPushToCloudWatchLogs
aws apigateway update-account \
  --patch-operations op=replace,path=/cloudwatchRoleArn,value=arn:aws:iam::$ACCT:role/apigw-cw-lab >/dev/null

# A Lambda execution role
ROLE_ARN=$(aws iam create-role --role-name apigw-lab-fn \
  --assume-role-policy-document '{"Version":"2012-10-17","Statement":[{"Effect":"Allow","Principal":{"Service":"lambda.amazonaws.com"},"Action":"sts:AssumeRole"}]}' \
  --query Role.Arn --output text)
aws iam attach-role-policy --role-name apigw-lab-fn \
  --policy-arn arn:aws:iam::aws:policy/service-role/AWSLambdaBasicExecutionRole
sleep 10
Step 1 — Deploy a Lambda that can misbehave on demand. One handler that returns a good proxy shape normally, a bad (bare object) shape when asked, and sleeps when asked — so we can trigger all three failures.
mkdir -p fn && cat > fn/app.py <<'PY'
import json, time
def handler(event, context):
    qs = (event.get("queryStringParameters") or {})
    if qs.get("mode") == "bad":
        return {"ok": True}                       # BARE object -> malformed proxy shape -> 502
    if qs.get("mode") == "slow":
        time.sleep(35)                            # > 29 s -> API Gateway 504
        return {"statusCode": 200, "body": "late"}
    return {"statusCode": 200, "body": json.dumps({"ok": True})}   # correct envelope
PY
( cd fn && zip -q ../fn.zip app.py )
FN_ARN=$(aws lambda create-function --function-name apigw-lab \
  --runtime python3.12 --handler app.handler --role "$ROLE_ARN" \
  --zip-file fileb://fn.zip --timeout 40 --query FunctionArn --output text)
Step 2 — Build a REST API with a Lambda proxy integration and access logging.
API=$(aws apigateway create-rest-api --name apigw-lab --query id --output text)
ROOT=$(aws apigateway get-resources --rest-api-id $API --query 'items[0].id' --output text)
RES=$(aws apigateway create-resource --rest-api-id $API --parent-id $ROOT --path-part quote --query id --output text)
aws apigateway put-method --rest-api-id $API --resource-id $RES --http-method GET --authorization-type NONE
aws apigateway put-integration --rest-api-id $API --resource-id $RES --http-method GET \
  --type AWS_PROXY --integration-http-method POST \
  --uri arn:aws:apigateway:$AWS_DEFAULT_REGION:lambda:path/2015-03-31/functions/$FN_ARN/invocations
aws lambda add-permission --function-name apigw-lab --statement-id apigw \
  --action lambda:InvokeFunction --principal apigateway.amazonaws.com \
  --source-arn "arn:aws:execute-api:$AWS_DEFAULT_REGION:$ACCT:$API/*/GET/quote"

# Access-log group + deploy the prod stage WITH access logging
LG=$(aws logs create-log-group --log-group-name /apigw/access/apigw-lab 2>/dev/null; \
     aws logs describe-log-groups --log-group-name-prefix /apigw/access/apigw-lab \
       --query 'logGroups[0].arn' --output text)
aws apigateway create-deployment --rest-api-id $API --stage-name prod >/dev/null
aws apigateway update-stage --rest-api-id $API --stage-name prod --patch-operations \
  op=replace,path=/accessLogSettings/destinationArn,value=${LG%:*} \
  op=replace,path=/accessLogSettings/format,value='{"status":"$context.status","responseType":"$context.error.responseType","integrationStatus":"$context.integrationStatus","integrationLat":"$context.integrationLatency","message":"$context.error.message"}'
URL="https://$API.execute-api.$AWS_DEFAULT_REGION.amazonaws.com/prod/quote"
curl -s "$URL"     # -> {"ok": true}  (the correct envelope works)
Step 3 — Reproduce the 502 (malformed proxy shape).
curl -s -o /dev/null -w "%{http_code}\n" "$URL?mode=bad"    # -> 502
sleep 8
aws logs filter-log-events --log-group-name /apigw/access/apigw-lab \
  --filter-pattern '{ $.status = "502" }' --query 'events[-1].message' --output text
Expected: the client gets 502, and the access-log line shows "status":"502" while "integrationStatus":"200" — the fingerprint: Lambda returned 200, API Gateway rejected the shape. Confirm the reason string in the execution log:
aws logs filter-log-events \
  --log-group-name API-Gateway-Execution-Logs_$API/prod \
  --filter-pattern "Malformed" --query 'events[-1].message' --output text
# -> "...Execution failed due to configuration error: Malformed Lambda proxy response"
Step 4 — Fix the 502. Restore the proxy envelope (already the default path — mode=bad is the bug). Prove the fix:
curl -s -o /dev/null -w "%{http_code}\n" "$URL" # -> 200
The real-world fix is exactly this: ensure every return path is {"statusCode": <int>, "body": "<string>"} — body a JSON string, not an object.
Step 5 — Reproduce the 504 (29-second integration timeout).
time curl -s -o /dev/null -w "%{http_code}\n" "$URL?mode=slow"   # -> 504 at ~29s
sleep 8
aws logs filter-log-events --log-group-name /apigw/access/apigw-lab \
  --filter-pattern '{ $.status = "504" }' --query 'events[-1].message' --output text
Expected: 504 returned at ~29 s (not 35 s — API Gateway gave up first), and the access log shows "responseType":"INTEGRATION_TIMEOUT" with "integrationLat" near 29000. Note the Lambda kept running to 35 s — check its own log group /aws/lambda/apigw-lab; the invocation completed after the client already got a 504.
Step 6 — Fix the 504. The correct fix is to make the call fast or go asynchronous (return 202 and poll). For the lab, demonstrate the diagnosis and confirm the fast path is fine:
curl -s -o /dev/null -w "%{http_code}\n" "$URL" # -> 200 (well under 29s)
Step 7 — Reproduce a 429 (tiny usage-plan quota). Require an API key on the method, create a plan with a quota of 2/day, and exceed it.
aws apigateway update-method --rest-api-id $API --resource-id $RES --http-method GET \
  --patch-operations op=replace,path=/apiKeyRequired,value=true
aws apigateway create-deployment --rest-api-id $API --stage-name prod >/dev/null
KEY=$(aws apigateway create-api-key --name lab-key --enabled --query id --output text)
KEYVAL=$(aws apigateway get-api-key --api-key $KEY --include-value --query value --output text)
PLAN=$(aws apigateway create-usage-plan --name lab-plan \
  --throttle rateLimit=10,burstLimit=5 --quota limit=2,period=DAY \
  --api-stages apiId=$API,stage=prod --query id --output text)
aws apigateway create-usage-plan-key --usage-plan-id $PLAN --key-id $KEY --key-type API_KEY >/dev/null
sleep 5
for i in 1 2 3 4; do
  curl -s -o /dev/null -w "req $i -> %{http_code}\n" -H "x-api-key: $KEYVAL" "$URL"
done
Expected: requests 1–2 return 200, requests 3–4 return 429. Confirm the sub-cause from the access log — it is QUOTA_EXCEEDED, not THROTTLED:
aws logs filter-log-events --log-group-name /apigw/access/apigw-lab \
  --filter-pattern '{ $.status = "429" }' --query 'events[*].message' --output text
# -> "responseType":"QUOTA_EXCEEDED"
Note that 4XXError in CloudWatch ticked up but there is no throttle metric — the access log is the only place the 429 is visible with its cause.
Step 8 — Fix the 429. Raise the quota (or issue the partner a higher tier), and add CORS + Retry-After so browser clients back off instead of seeing a CORS error:
aws apigateway update-usage-plan --usage-plan-id $PLAN \
  --patch-operations op=replace,path=/quota/limit,value=100000
aws apigateway put-gateway-response --rest-api-id $API --response-type THROTTLED --status-code 429 \
  --response-parameters '{"gatewayresponse.header.Access-Control-Allow-Origin":"'"'"'*'"'"'","gatewayresponse.header.Retry-After":"'"'"'1'"'"'"}'
aws apigateway create-deployment --rest-api-id $API --stage-name prod >/dev/null
Validation checklist. You reproduced three distinct classes and confirmed each from its own fingerprint:
| Step | Failure reproduced | The fingerprint | The fix you applied |
|---|---|---|---|
| 3–4 | 502 malformed proxy shape | status=502 while integrationStatus=200; log Malformed Lambda proxy response |
Return {statusCode, body:"<string>"} |
| 5–6 | 504 integration timeout | responseType=INTEGRATION_TIMEOUT, integrationLat≈29000, 504 at ~29 s |
Speed up / async 202 pattern |
| 7–8 | 429 usage-plan quota | status=429, responseType=QUOTA_EXCEEDED, no throttle metric |
Raise quota; add Retry-After + CORS |
Teardown (⚠️ do this — the API, Lambda and log groups are tiny but real).
aws apigateway delete-usage-plan-key --usage-plan-id $PLAN --key-id $KEY 2>/dev/null || true
aws apigateway delete-usage-plan --usage-plan-id $PLAN
aws apigateway delete-api-key --api-key $KEY
aws apigateway delete-rest-api --rest-api-id $API
aws lambda delete-function --function-name apigw-lab
aws logs delete-log-group --log-group-name /apigw/access/apigw-lab 2>/dev/null || true
aws logs delete-log-group --log-group-name API-Gateway-Execution-Logs_$API/prod 2>/dev/null || true
aws iam detach-role-policy --role-name apigw-lab-fn --policy-arn arn:aws:iam::aws:policy/service-role/AWSLambdaBasicExecutionRole
aws iam delete-role --role-name apigw-lab-fn
aws iam detach-role-policy --role-name apigw-cw-lab --policy-arn arn:aws:iam::aws:policy/service-role/AmazonAPIGatewayPushToCloudWatchLogs
aws iam delete-role --role-name apigw-cw-lab
Cost note. Everything here is within the API Gateway (1M free calls for 12 months), Lambda (1M requests) and CloudWatch free tiers. The only spend is a fraction of a rupee for log ingestion; deleting the log groups above stops it. There is no NAT gateway or provisioned resource left running.
Common mistakes & troubleshooting
This is the playbook — the part you bookmark. First the scannable master table you can read at 03:20, then the three nastiest failures in full. Every row is a real failure with the exact status, the responseType, the layer it belongs to, the precise field or metric to confirm it, and the fix.
| # | Status + responseType |
Layer | Root cause | Confirm (access-log field / metric) | Fix |
|---|---|---|---|---|---|
| 1 | 403 MISSING_AUTHENTICATION_TOKEN |
Routing | Path/method has no route, or stage not deployed | No matching get-resources; no recent deployment |
Add resource+method; create-deployment to the stage |
| 2 | 403 MISSING_AUTHENTICATION_TOKEN |
Custom domain | Base-path mapping missing/wrong | Works on execute-api URL, 403 on domain |
Create/repair the base-path mapping |
| 3 | 403 ACCESS_DENIED |
Auth (IAM) | Identity/resource policy denies execute-api:Invoke |
Body names the ARN; $context.identity.userArn |
Grant execute-api:Invoke on the method ARN; fix resource policy |
| 4 | 403 INVALID_SIGNATURE |
Auth (IAM) | SigV4 wrong (clock skew, wrong region/service/secret) | $context.error.responseType; check clock/creds |
Re-sign; sync clock; correct signer region/service |
| 5 | 403 Forbidden (INVALID_API_KEY) |
Keys | Key missing/invalid, or not in a plan on this stage | responseType=INVALID_API_KEY; plan↔stage link |
Send x-api-key; attach key to a usage plan on the stage |
| 6 | 403 WAF_FILTERED |
Security | A WAF Web ACL rule blocked it | $context.wafResponseCode; WAF sampled requests |
Tune/allowlist the rule; fix the false positive |
| 7 | 403 ACCESS_DENIED (private API) |
Private API | Resource/VPC-endpoint policy denies the SourceVpce |
403 only from inside the VPC | Allow aws:SourceVpce/aws:SourceVpc in the resource policy |
| 8 | 401 UNAUTHORIZED |
Auth | Missing/expired/invalid token; TOKEN identity source failed | $context.authorizer.status=401; body Unauthorized |
Fix the token / identity-source regex / Cognito app client |
| 9 | 403 ACCESS_DENIED (authorizer) |
Auth | Lambda authorizer returned a Deny policy |
Body: not authorized to access this resource |
Fix the authorizer’s policy logic |
| 10 | 500 AUTHORIZER_FAILURE |
Auth | Authorizer Lambda threw or timed out | $context.authorizer.error populated |
Fix authorizer code/perms/timeout; add error handling |
| 11 | 429 THROTTLED |
Throttle | Token bucket empty (account/stage/method/plan) | Access log status=429 responseType=THROTTLED |
Raise the tightest applicable rate + burst |
| 12 | 429 QUOTA_EXCEEDED |
Usage plan | Daily/weekly/monthly quota spent | responseType=QUOTA_EXCEEDED; $context.identity.apiKeyId |
Raise the quota; issue a higher tier / new key |
| 13 | 502 (integrationStatus=200) |
Integration | Malformed Lambda proxy response shape | status=502 + integrationStatus=200; log Malformed Lambda proxy response |
Return {statusCode, headers, body:"<string>"} |
| 14 | 502 (integrationStatus=-) |
Integration | Backend closed/garbled the connection; oversized headers | $context.integration.error; backend logs |
Fix backend response; keep-alive/header size |
| 15 | 503 |
Integration | Backend down; VPC-link NLB has no healthy target | integrationStatus=503/-; VPC-link target health |
Restore backend; fix VPC-link/NLB health checks |
| 16 | 504 INTEGRATION_TIMEOUT |
Integration | Backend slower than the 29 s ceiling | integrationLatency≈29000; log timeout error |
Speed up backend; async 202; raise the 29 s quota (REST) |
| 17 | 500 API_CONFIGURATION_ERROR |
Config | Broken VTL mapping template / bad stage variable | Execution log names the template; $context.error.message |
Fix the mapping template / stage variable |
| 18 | 400 BAD_REQUEST_BODY |
Validation | Body fails the JSON-schema model | $context.error.message; request validator on |
Fix the payload or the model |
| 19 | 413 REQUEST_TOO_LARGE |
Payload | Request body over the 10 MB limit | responseType=REQUEST_TOO_LARGE |
Upload via S3 presigned URL; chunk the payload |
| 20 | Browser “CORS blocked” on any error | Gateway response | CORS headers absent on Gateway Responses | Real status is 401/403/429 with no Allow-Origin |
Add CORS to DEFAULT_4XX/DEFAULT_5XX |
| 21 | Logging enabled but empty | Observability | Account CloudWatch role never set | apigateway get-account has no cloudwatchRoleArn |
Set the account-level role once per region |
The three that cause the most damage, expanded:
A. The 502 that is really a 200 — the malformed Lambda proxy response. A Lambda proxy endpoint starts returning 502 on its happy path, usually right after a code change, and the team debugs the wrong service because the Lambda Errors metric is flat and Duration is healthy. The cause is that the handler returned the wrong shape: a bare object (return quote) instead of the required proxy envelope {"statusCode": 200, "headers": {...}, "body": "<JSON string>"}. Lambda executed perfectly and returned 200 to API Gateway, which then rejected the shape it got and synthesized a 502 to the client. Confirm: the access log shows $context.status = 502 while $context.integrationStatus = 200 — that split is the unambiguous fingerprint — and the execution log reads Execution failed due to configuration error: Malformed Lambda proxy response. Fix: make every return path (including error and early-return paths) emit the full envelope with body as a JSON string, not an object; a shared response helper (respond(status, obj)) prevents the class entirely. This is also why non-proxy (custom) integrations exist — they map the response for you via a template — but proxy is the common default, so the contract is yours to honour.
B. The 504 at exactly 29 seconds — the integration timeout you can’t raise your way out of. A synchronous endpoint that calls a slow backend (a third-party API, a heavy query) starts returning 504 under load. The instinctive fix — raise the Lambda/backend timeout — does nothing, because the ceiling is API Gateway’s 29-second integration timeout, not the backend’s. The tell is $context.integrationLatency pinned near 29000 ms, the execution log line Execution failed due to a timeout error, and — the proof it’s the gateway giving up, not the backend — the backend’s own log shows the work continuing past the 504 (Lambda keeps running and billing after the client is gone). Confirm: IntegrationLatency p99 at ~29 s in CloudWatch, responseType=INTEGRATION_TIMEOUT in the access log. Fix: the durable answer is almost never “wait longer.” Make the call fast (cache, index, parallelize), or switch to an asynchronous pattern — return 202 Accepted with a job ID immediately, do the slow work in a worker (SQS + Lambda, Step Functions), and have the client poll a status endpoint or receive a webhook. Only if the work is genuinely, irreducibly long and synchronous should you request the REST-API quota increase above 29 s — and HTTP APIs cannot do even that (hard 30 s cap).
C. The 403 that’s really a missing deployment — Missing Authentication Token. The dashboard lights up with 4XXError and clients report a wall of 403 {"message":"Missing Authentication Token"} on an endpoint that “worked yesterday” — and the instinct is to debug authorizers and API keys, which is exactly backwards. This 403 is what API Gateway returns when it cannot match the request’s path+method to a route, phrased (for historical, don’t-confirm-what-exists reasons) as an auth error. In a running system the overwhelmingly common trigger is a change that was never deployed: someone edited a method, an integration, or a mapping template — in the console, via CLI, or in Terraform — and never created a deployment to the stage the URL points at, so the mutation lives on the API but not on prod. Confirm (fast): first, is there an authorizer attached at all? If not, it is routing/deploy 100% of the time — stop looking at auth. Then aws apigateway get-resources to prove the path+method actually exists, and check for a recent create-deployment on the stage; if the raw execute-api URL works but a custom domain 403s, it is a base-path mapping, not auth. Fix: aws apigateway create-deployment --stage-name prod (or, in IaC, an aws_api_gateway_deployment with a redeploy trigger), correct the client path/verb, or repair the base-path mapping. The senior habit that eliminates the whole class: treat “deploy the stage” as the last step of every API change, and wire a redeploy trigger into your IaC so a method change can never silently fail to ship. (The parallel invisible-failure trap to keep in your peripheral vision: a 429 has no metric — it hides inside 4XXError — so when 4xx climbs but nothing in the console explains it, filter the access log for status=429 before assuming it’s a 403.)
Best practices
- Read the status and the
responseTypebefore touching anything. The status alone is ambiguous (six failures are403); theresponseTypenames the layer. - Set the account-level CloudWatch Logs role once per region, before you need it. Without it, every logging setting is a silent no-op and you debug blind.
- Turn on structured access logging with the full
$contextset — at minimumstatus,error.responseType,integrationStatus,integrationLatency,error.message,authorizer.error,identity.apiKeyId,wafResponseCode. This is your primary instrument. - Trust
integrationStatusvsstatusto isolate the 502.integrationStatus=200withstatus=502is always a malformed proxy shape — never a backend outage. - Use a shared response helper for proxy integrations so every return path emits
{statusCode, headers, body:"<string>"}; it eliminates the malformed-shape 502 class outright. - Design for the 29-second ceiling. Any synchronous call that can exceed a few seconds should be an async
202-and-poll pattern, not a prayer that the backend finishes in time. - Customize Gateway Responses — always add CORS to
DEFAULT_4XX/DEFAULT_5XX. Otherwise browser clients see a phantom “CORS error” instead of the real 401/403/429. - Build a metric filter for 429s (
status=429in the access log), because there is noThrottleCountmetric and throttles otherwise hide inside4XXError. - Deploy the stage after every change. API Gateway mutations are inert until deployed; the mysterious “it 403s after I edited it” is an undeployed change.
- Cache authorizer results (TTL) and keep mapping templates simple to shrink the
Latency − IntegrationLatencyoverhead; a slow authorizer inflates total latency invisibly. - Know which API type you’re on. REST vs HTTP differ on unmatched-route status, integration timeout, Gateway Responses, usage plans and WAF — half the “why is it different” incidents are one table row.
- Alarm on
5XXErrorrate andLatency/IntegrationLatencyp99, plus the 429 metric filter — not just raw4XXError, which mixes client mistakes, auth failures and throttles together.
Security notes
- Least-privilege resource policies for private and IAM-auth APIs. Scope
execute-api:Invoketo specific method ARNs and, for private APIs, to specificaws:SourceVpcevalues — a wildcard resource policy turns a private API public inside your network. A403 ACCESS_DENIEDfrom a private API is the policy doing its job; read it, don’t broaden it blindly. - Keep WAF in front of REST APIs (and CloudFront+WAF in front of HTTP APIs). A
WAF_FILTERED403 is a block working as intended; investigate the sampled request before allowlisting, and prefer tightening the rule over disabling it. - Never log secrets.
dataTraceEnabledexecution logging captures full request/response payloads includingAuthorizationheaders and bodies — use it only transiently in non-prod, and mask sensitive fields in access-log formats. Set log retention so payloads don’t accumulate forever. - Treat the authorizer as a security boundary, not a formality. An authorizer that returns
500 AUTHORIZER_FAILUREon error is fail-closed (the request is rejected), which is correct — but make sure a bug can’t accidentally returnAllow. Test withtest-invoke-authorizerand cache results with a short TTL to limit blast radius. - Guard usage-plan keys like credentials. An API key is a bearer secret; rotate it, scope it to one plan, and remember that API keys are for identification and metering, not authentication — pair them with an authorizer or IAM for real access control.
- Use edge/regional endpoint types deliberately and enforce TLS 1.2+; expose only the stages you intend, and delete unused stages and API keys so there is less surface to misconfigure into a 403-that-should-be-a-block.
Cost & sizing
API Gateway bills primarily on requests (REST is pricier than HTTP APIs), plus data transfer, optional caching (REST, per GB-hour of cache), and the CloudWatch Logs you generate. The error classes above have direct cost consequences: a 504 still bills the backend for its full run (Lambda keeps executing past the 29 s cut-off), verbose dataTraceEnabled execution logs can dwarf request costs, and a retry storm from unhandled 429s multiplies request charges.
| Cost driver | How it’s billed | Right-size by | Rough figure |
|---|---|---|---|
| REST API requests | Per million calls | Move suitable APIs to HTTP APIs | ~$3.50 per million (varies by region) |
| HTTP API requests | Per million calls | Default for simple proxy/JWT APIs | ~$1.00–1.17 per million (~70% cheaper) |
| Caching (REST) | Per GB-hour of cache size | Cache only cacheable GETs; right TTL | Sized 0.5–237 GB; pay while enabled |
| CloudWatch Logs | Per GB ingested + stored | Access log only; avoid dataTrace in prod; set retention |
Verbose execution logs add up fast |
| Data transfer out | Per GB | Compress; cache; keep payloads small | Standard AWS egress rates |
| Backend (Lambda/EC2) | Its own billing | Async pattern so 504s don’t bill full runs | A 35 s Lambda bills 35 s even after a 29 s 504 |
Sizing rules of thumb: prefer HTTP APIs unless you need REST-only features (usage plans, mapping templates, request validation, Gateway Responses, WAF) — the per-million saving is large at scale. Enable REST caching only for genuinely cacheable read endpoints and watch the hit rate (CacheHitCount/CacheMissCount); a cache with a bad key or TTL costs money and returns stale data. Set log retention on both the access and execution log groups (they default to never-expire) and keep dataTraceEnabled off in production — unbounded verbose logs are the sneaky line item, not the requests. In INR terms, a modest partner-facing REST API (a few million calls/month, small payloads, access logging on) typically runs in the low hundreds to low thousands of rupees per month before free tier; the expensive mistakes are always-on caching, dataTrace logging left on, and backends that keep billing behind 504s.
Interview & exam questions
Q1. A client gets 403 {"message":"Missing Authentication Token"} on a brand-new endpoint. Walk the diagnosis.
Despite the wording, this is almost never an auth problem — it means API Gateway couldn’t match the path+method to a route, or the stage was never deployed. Confirm with get-resources (does the route exist?) and check for a recent deployment. If no authorizer is attached, it’s a routing/deploy miss 100% of the time; the fix is create-deployment or correcting the URL/method. (DVA-C02, SOA-C02)
Q2. Distinguish a 401, a 403 authorizer Deny, and a 500 from the same Lambda authorizer.
401 UNAUTHORIZED = the authorizer returned “Unauthorized” or the token failed the identity source (unauthenticated). 403 ACCESS_DENIED = the authorizer returned an IAM policy with Effect: Deny (authenticated but not allowed). 500 AUTHORIZER_FAILURE = the authorizer Lambda threw or timed out. Confirm via $context.authorizer.status/$context.authorizer.error. (DVA-C02)
Q3. Your Lambda proxy endpoint returns 502 but the Lambda Errors metric is flat. What happened?
The handler returned a malformed proxy shape — a bare object instead of {statusCode, body:"<string>"}. Lambda succeeded and returned 200 to API Gateway, which rejected the shape and synthesized a 502. The fingerprint is $context.integrationStatus=200 with $context.status=502, plus Malformed Lambda proxy response in the execution log. Fix the envelope. (DVA-C02, SAA-C03)
Q4. An endpoint 504s at ~29 seconds even after you raised the Lambda timeout to 60 s. Why?
The 29-second limit is API Gateway’s integration timeout, independent of the Lambda timeout; API Gateway gives up at 29 s while Lambda keeps running (and billing). responseType=INTEGRATION_TIMEOUT, integrationLatency≈29000. Fix by making the call fast or switching to an async 202-and-poll pattern; REST APIs can request a quota increase above 29 s, HTTP APIs cannot. (DVA-C02, SOA-C02)
Q5. How do you see how many requests are being throttled?
You can’t from a metric — API Gateway has no ThrottleCount, and 429s are counted inside 4XXError. You confirm throttling from the access log: filter $context.status=429 and split on $context.error.responseType (THROTTLED = rate/burst bucket; QUOTA_EXCEEDED = usage-plan quota). Build a CloudWatch Logs metric filter to graph and alarm on it. (SOA-C02)
Q6. Explain the token-bucket throttle and its four layers.
Burst is the bucket capacity, rate is the refill/second, each request removes a token, an empty bucket returns 429 THROTTLED. Limits apply at four layers — account (10,000 rps/5,000 burst default, per region), stage default, per-method, and usage-plan (per key) — and the tightest applicable limit wins. Usage plans add a separate quota counter (QUOTA_EXCEEDED). (DVA-C02, SAA-C03)
Q7. A valid API key still returns 403 Forbidden. Cause?
The key exists and is enabled but isn’t associated with a usage plan bound to the stage being called (or apiKeyRequired is set and the key header is absent/misnamed). responseType=INVALID_API_KEY. Fix by attaching the key to a usage plan on that stage and sending it as x-api-key. (DVA-C02)
Q8. Users report the site is broken with “CORS errors,” but the API is up. What’s likely happening?
An early-pipeline error (401/403/429) is being returned as a Gateway Response, which does not inherit the CORS headers you set on method/integration responses — so the browser sees a missing Access-Control-Allow-Origin and reports a CORS failure that masks the real status. Fix by adding CORS headers to DEFAULT_4XX/DEFAULT_5XX Gateway Responses. (DVA-C02, SOA-C02)
Q9. Latency is high but IntegrationLatency is low. Where’s the problem?
The delay is in API Gateway’s own overhead, not the backend — typically a slow Lambda authorizer or heavy VTL mapping templates. Cache the authorizer result (TTL) and simplify the templates. If instead both are high and close, the backend is the bottleneck (and a 504 is coming at 29 s). (SOA-C02)
Q10. How do REST and HTTP APIs differ on an unmatched route and on the integration timeout?
An unmatched route returns 403 Missing Authentication Token on REST APIs but 404 Not Found on HTTP APIs. The integration timeout is 29 s (raisable via quota) on REST and a hard 30 s (not raisable) on HTTP APIs. HTTP APIs also lack Gateway Responses, usage plans and native WAF. (DVA-C02, SAA-C03)
Q11. Logging is enabled on the stage but no logs appear. Why?
The account-level CloudWatch Logs role (cloudwatchRoleArn) hasn’t been set for the region, so API Gateway can’t write to CloudWatch — silently. Set it once per region with update-account; then both execution and access logging work. (SOA-C02)
Q12. A 5xx shows integrationStatus=503 (a real code, not -). Where do you debug?
The backend returned the 503 and API Gateway forwarded it — this is not an API Gateway problem. Debug the integration (the app, the VPC-link NLB target health), not the gateway. Chasing API Gateway settings here wastes the incident. (DVA-C02, SAA-C03)
Quick check
- A new endpoint returns
403 Missing Authentication Tokenwith no authorizer attached. What are the two most likely causes, and the confirming step for each? - Your Lambda proxy endpoint 502s but Lambda
Errorsis flat. What single pair of$contextfields confirms the cause, and what’s the fix? - Why can’t you find a throttle metric in CloudWatch, and where do you confirm a 429 instead?
- An endpoint 504s at ~29 s and raising the Lambda timeout doesn’t help. What’s the ceiling, and what’s the durable fix?
- The frontend reports “CORS errors” but the API is healthy. What’s really happening, and what do you change?
Answers
- A wrong path/method, or a stage that was never deployed. Confirm the route with
aws apigateway get-resources; confirm the deploy by checking for a recentcreate-deploymenton that stage. With no authorizer in play, it’s always routing/deploy, never auth. $context.integrationStatus = 200while$context.status = 502— Lambda returned 200 but with a malformed proxy shape (a bare object). Fix: return the full envelope{statusCode, headers, body:"<JSON string>"}on every path.- API Gateway emits no
ThrottleCountmetric; 429s are folded into4XXError. Confirm from the access log: filterstatus=429and split onresponseType(THROTTLEDvsQUOTA_EXCEEDED); build a metric filter to graph it. - API Gateway’s 29-second integration timeout (independent of the Lambda timeout; Lambda keeps running and billing). Fix by making the call fast or moving to an async
202-and-poll pattern; only request the REST quota increase above 29 s if the work is irreducibly long and synchronous. - An early-pipeline error (401/403/429) is returned as a Gateway Response with no CORS headers, so the browser reports a CORS failure that hides the real status. Add
Access-Control-Allow-Origin(and friends) to theDEFAULT_4XX/DEFAULT_5XXGateway Responses.
Glossary
| Term | Definition |
|---|---|
responseType |
The Gateway Response category (e.g. MISSING_AUTHENTICATION_TOKEN, THROTTLED, INTEGRATION_TIMEOUT) that names the exact sub-cause of a 4xx/5xx; read via $context.error.responseType. |
| Gateway Response | The final pipeline stage that renders an error’s status, body and headers; customizable per responseType on REST APIs. |
Missing Authentication Token |
The 403 body API Gateway returns when it can’t match the path+method to a route — usually a wrong path/method or an undeployed stage, not an auth problem. |
| Lambda proxy integration | An integration where API Gateway passes the whole request to Lambda and expects a {statusCode, headers, body} envelope back; a wrong shape yields a 502. |
| Malformed proxy response | A Lambda proxy return that isn’t the required envelope (e.g. a bare object); Lambda returns 200 but API Gateway synthesizes a 502. |
| Integration timeout | The maximum time API Gateway waits for the backend — 29 s (REST, raisable) / 30 s (HTTP, fixed); exceeding it yields 504 INTEGRATION_TIMEOUT. |
integrationStatus |
The status the integration returned to API Gateway ($context.integrationStatus); 200 here with status=502 is the malformed-shape fingerprint. |
| Token bucket | The throttle algorithm: burst = bucket capacity, rate = refill/second; an empty bucket returns 429 THROTTLED. |
| Usage plan | A REST-API construct binding API keys to rate, burst and quota limits per stage; quota exhaustion yields 429 QUOTA_EXCEEDED. |
| Account throttle | The per-region default limit across all APIs — 10,000 rps steady, 5,000 burst (soft, raisable). |
| Execution logging | Verbose per-request internal trace written to an API-Gateway-named log group; best for single-request forensics like the 502 reason string. |
| Access logging | One structured line per request built from $context variables into a log group you choose; your primary dashboard/metric-filter source. |
$context |
The variable namespace available in access-log formats and mapping templates ($context.status, $context.error.responseType, $context.integrationLatency, etc.). |
| Base-path mapping | The mapping on a custom domain from a base path to an API+stage; a missing/wrong one 403s while the raw execute-api URL works. |
| REST API vs HTTP API | v1 (feature-rich: Gateway Responses, usage plans, VTL, WAF; 29 s) vs v2 (cheaper/faster, fewer features; 404 on unmatched route; 30 s fixed). |
Next steps
- Build the API this playbook debugs — resources, methods, integrations, authorizers, usage plans and CORS — in Amazon API Gateway Hands-On: REST vs HTTP APIs, Authorizers & Throttling.
- Chase a 502/504 down into the compute behind it with AWS Lambda Errors, Timeouts & Cold Starts: The Troubleshooting Playbook — many API Gateway 5xx are really Lambda problems.
- Compare the same failure classes on a different front door in ALB 5xx Errors Decoded: A 502 / 503 / 504 Troubleshooting Playbook.
- Revisit whether API Gateway is even the right front door for a given workload in AWS Load Balancers and API Gateway: ALB, NLB and API Gateway Compared.