At 02:14 the page says Lambda Errors > 0 and the customer says “the upload just disappeared.” You have three questions to answer before you can touch anything: which invocation model was this, which phase did it die in, and where did the event go. Get those wrong and you will “fix” a timeout that was really a throttle, add memory to a function that was starved of a NAT route, or redeploy a handler whose event was silently discarded twenty minutes ago because nobody attached a dead-letter queue. AWS Lambda fails in a small number of very specific ways, each with an exact error string, an exact metric, and an exact fix — and the entire skill of operating serverless at 3 a.m. is naming the class fast.
This is the reference you keep open during the incident. It treats Lambda as what it actually is — a lifecycle (Init → Invoke → Shutdown) wrapped in three invocation models (synchronous, asynchronous, poll-based), each with its own retry, ordering and failure-destination rules — and it walks every failure class that pages you: cold starts (what is really inside Init Duration, why a VPC function used to cost you ten seconds, and what provisioned concurrency and SnapStart do and don’t fix), timeouts (Task timed out after N seconds and its five root causes), and errors (unhandled exceptions vs Runtime.ImportModuleError, permission denials, 429 TooManyRequestsException, out-of-memory kills, and a full /tmp). Then the part that separates senior from junior: what happens after the failure — the two silent-data-loss traps (an async event that retried into the void with no DLQ, and a poison record that blocks an entire Kinesis shard while IteratorAge climbs into hours).
By the end you will read a REPORT log line like an instrument panel, know from a single metric whether you are looking at an Errors, Throttles or DeadLetterErrors problem, and carry a symptom → category → root cause → confirm → fix table you can run under pressure. Everything is shown in both aws CLI and Terraform, with real limits and error strings — never a hand-waved number. It maps directly to the Lambda troubleshooting and observability domains of DVA-C02, SOA-C02 and SAA-C03.
What problem this solves
Lambda hides the server, and with it every familiar diagnostic surface. There is no host to SSH into, no top to watch, no process list, no /var/log you can tail at will. When a function is slow, dropping events, or costing double, you diagnose it entirely from CloudWatch metrics, CloudWatch Logs, and X-Ray traces — and if you do not know which number means what, you are flying blind. The failure is rarely a clean crash with a stack trace at the top of your inbox; it is a p99 that quietly tripled after a deploy, a queue that stopped draining, a customer whose event never produced a side effect and left no obvious trace.
What breaks without this knowledge is trust and money, silently. A team ships a function behind API Gateway, never touches cold starts, and watches p99 latency spike to multiple seconds on every traffic lull — users blame “the app.” Another triggers a function directly off a high-volume source with no idempotency and no dead-letter queue; under load it throttles, async retries pile up, and events vanish after the second retry with nothing to show for it. A third puts a consumer on a Kinesis stream, hits one malformed record, and discovers six hours later that the record has been blocking the shard the whole time while IteratorAge climbed and every event behind it waited. None of these are exotic. They are the default behaviour of the platform when you do not configure against it.
Who hits this: anyone running serverless past “hello world.” It bites hardest on teams new to Lambda’s at-least-once delivery and Lambda-owned retries for async invokes, on high-throughput stream and queue consumers where batching and partial-batch responses are load-bearing, on latency-sensitive synchronous APIs where cold starts land in the user’s p99, and on anyone who assumed a failed invocation would “obviously” show up somewhere. The fix is almost never “add more memory and hope.” It is: name the invocation model, name the lifecycle phase, read the one metric that confirms the class, and apply the one setting that addresses it.
Here is the whole failure field on one screen — the class, the model where it bites hardest, the exact signal, and the one-line fix — so you can orient before the deep dive:
| Failure class | Bites hardest on | The signal you’ll see | The one-line fix |
|---|---|---|---|
| Cold start latency | Sync (API GW) | High Init Duration, p99 spike after idle |
Provisioned concurrency / SnapStart, smaller package, lazy init |
| VPC cold start | Any VPC function | Slow init only inside a VPC; ENILimitReached |
Spare subnet IPs, reuse SG/subnet, VPC endpoints |
| Timeout | Sync + async | Task timed out after N seconds |
Match timeout to work; fix downstream/NAT/DNS |
| Import / init error | All | Runtime.ImportModuleError, Runtime.HandlerNotFound |
Fix packaging + handler string |
| Permission error | All | AccessDeniedException, KMSAccessDeniedException |
Execution-role policy + trigger resource policy |
| Throttle | Sync + poll | 429 TooManyRequestsException, Throttles > 0 |
Raise/allocate concurrency; back-pressure |
| Out of memory | Memory-heavy | Runtime exited ... signal: killed, Max Memory Used ≈ limit |
Raise memory (also raises CPU); fix leak |
| /tmp full | Big-file jobs | No space left on device (ENOSPC) |
Raise ephemeral storage; stream, don’t buffer |
| Async silent drop | Async | Errors > 0, no downstream effect |
Attach DLQ / on-failure destination; idempotency |
| Poison-record shard block | Kinesis / DDB Streams | IteratorAge climbing for hours |
ReportBatchItemFailures, bisect, max-age cap |
Learning objectives
By the end of this article you can:
- Read a Lambda
REPORTline and X-Ray trace and state exactly which lifecycle phase (Init vs Invoke) and which invocation model (sync / async / poll) a failure belongs to. - Diagnose cold starts: decompose
Init Durationinto download + runtime + your init code, name the drivers, and choose between provisioned concurrency, SnapStart, packaging and lazy-init — and know why “keep-warm” pings are mostly a myth. - Root-cause a
Task timed out after N secondsto one of its five causes (downstream slowness, missingawait/callback, no NAT/DNS route, oversized batch, or a genuinely too-short timeout) and fix each. - Decode the full Lambda error-type reference —
Runtime.ImportModuleError,Runtime.HandlerNotFound, unhandled exception,429, OOM,/tmpfull, KMS and access-denied — from the exact string alone. - Predict and configure retry and failure destinations per model: async 2-retry + DLQ / on-failure destination with
maxEventAge/maxRetryAttempts; poll-based partial batch response,bisectBatchOnFunctionError, and record-age caps. - Read the metrics that matter —
Errors,Throttles,Duration,ConcurrentExecutions,IteratorAge,DeadLetterErrors,ProvisionedConcurrencyUtilization— and know which one confirms which class. - Run a symptom → category → root cause → confirm → fix playbook end to end, and reproduce and fix a timeout, an import error and a poison-message shard block in a hands-on lab.
Prerequisites & where this fits
You should already be comfortable with the Lambda basics: a function has an execution role (the IAM role Lambda assumes for its own AWS calls), it logs to a CloudWatch Logs group named /aws/lambda/<function>, and it is invoked by a trigger — API Gateway, S3, SNS, EventBridge, SQS, Kinesis or a direct SDK Invoke. You should be able to run aws from a shell, read JSON output with --query, and read a Terraform aws provider resource block. HTTP status codes and the ideas of “retry” and “idempotency” should be familiar.
This sits in the Serverless & Event-Driven track and is the operational companion to the design-side references. The compute decision that puts you on Lambda in the first place lives in Compute on AWS: EC2 vs Lambda vs ECS vs EKS; the invocation-model and trigger contracts are covered in depth in AWS Lambda Patterns: Event-Driven Functions That Scale to Zero and the queue/bus wiring in Event-Driven Architecture with EventBridge, SQS & Lambda. The sizing levers this article treats as fixes — memory, timeout and concurrency — are tuned methodically in Lambda Memory, Timeout & Concurrency Tuning, and if you have never deployed a function, start with Your First Lambda Function, Hands-On. API Gateway as the most common synchronous trigger is compared in ALB vs NLB vs API Gateway, Compared.
Before the deep dive, fix the mental model of where each failure lives, so you look in the right place first:
| Layer | What lives here | Failure classes it causes | First place to look |
|---|---|---|---|
| Trigger / event source | The producer + delivery contract | Event never arrived; too-broad routing; wrong permission | Source metrics; trigger resource policy |
| Concurrency gate | Account + reserved limits, burst rate | 429 TooManyRequestsException, Throttles |
Throttles, ConcurrentExecutions metrics |
| Init phase | Package download, runtime, module code | Cold-start latency, Runtime.ImportModuleError, VPC ENI |
Init Duration; X-Ray Initialization subsegment |
| Handler (your code + role) | Business logic, permissions, downstream calls | Timeout, OOM, unhandled exception, AccessDenied |
CloudWatch Logs + X-Ray subsegments |
| Outcome / destination | Retry, DLQ, on-failure destination | Silent async drop; poison-record shard block | DeadLetterErrors, IteratorAge, DLQ depth |
| Observability | Metrics, Logs, traces | You can’t confirm anything | CloudWatch Metrics + Logs Insights + X-Ray |
Core concepts
The execution lifecycle — where cold starts and import errors live
Every Lambda invocation runs inside an execution environment: a micro-VM (Firecracker) that Lambda creates, reuses, freezes and eventually destroys. The environment moves through three phases, and knowing which phase you are in is half of every diagnosis, because cold-start latency and import errors happen in Init, not Invoke.
| Phase | What happens | Billed? | Failures that live here | How you see it |
|---|---|---|---|---|
| Init | Download package/image, bootstrap the runtime, run module-level (global) code — SDK clients, DB pools, imports | Billed as Init Duration (on-demand it’s now billed; historically “free”) | Cold-start latency, Runtime.ImportModuleError, Runtime.HandlerNotFound, VPC ENI attach, init timeout (10 s cap on-demand) |
Init Duration in the REPORT line; X-Ray Initialization subsegment |
| Invoke | Your handler(event, context) runs, once per event, in a reused environment |
Billed as Duration (rounded to 1 ms) | Timeout, OOM, unhandled exception, throttle, AccessDenied, /tmp full |
Duration, Errors, Throttles metrics; handler logs |
| Shutdown | Environment is frozen after invoke; later destroyed; extensions get a shutdown event | Not billed | Lost background work started after the response, dropped buffered logs | Extension logs; “work after response” bugs |
The single most useful artifact in all of Lambda is the REPORT line every invocation writes to CloudWatch Logs. Learn to read it cold:
| Field | Meaning | What a bad value tells you |
|---|---|---|
Duration |
Handler wall-clock, ms | Near your timeout → about to time out |
Billed Duration |
Rounded-up billed ms | What you actually pay per call |
Memory Size |
Configured memory (MB) | The ceiling for OOM and the CPU allocation |
Max Memory Used |
Peak memory this invoke | ≈ Memory Size → OOM risk; investigate |
Init Duration |
Cold-start init time (present only on cold invokes) | Its presence means this was a cold start |
XRAY TraceId / SegmentId |
Trace correlation | Jump straight to the trace |
Status (newer runtimes) |
timeout / error on failure |
The class, spelled out |
The three invocation models and their retry rules
“Lambda” behaves like three different services depending on how it was invoked. This table is the one you memorize — nearly every “where did my event go?” question is answered by reading the correct row.
| Model | Triggers | Delivery | On error, Lambda… | Ordering | Payload cap | Concurrency signal |
|---|---|---|---|---|---|---|
| Synchronous | API Gateway, ALB, SDK Invoke (RequestResponse), Function URL |
Caller waits for the response | Returns the error to the caller; caller decides to retry | Caller-defined | 6 MB request/response | 429 returned to caller |
| Asynchronous | S3, SNS, EventBridge, SES, CloudWatch Events, SDK Invoke --invocation-type Event |
Fire-and-forget; Lambda queues it internally | Retries twice (1 min then 2 min backoff), then drops unless a DLQ / on-failure destination is set | Not guaranteed | 256 KB | Internal queue absorbs bursts; still throttles |
| Poll-based (ESM), queue | SQS (standard / FIFO) | Lambda polls and invokes with a batch | Returns the failed messages to the queue (whole batch, or just the failures with partial-batch response) after visibility timeout | FIFO per message group only | 6 MB per batch payload | maximumConcurrency on the ESM |
| Poll-based (ESM), stream | Kinesis, DynamoDB Streams | Lambda polls shards, invokes with a batch, checkpoints on success | Retries the whole batch in order until success or record age-out — blocks the shard meanwhile | Strict per shard | 6 MB per batch | parallelizationFactor per shard |
Three consequences fall straight out of this table and cause most incidents: (1) an async failure with no destination is gone after two retries — the caller never knew; (2) a stream failure blocks everything behind it on that shard; (3) a synchronous 429 is the caller’s problem to retry, so throttling shows up as client-side errors, not in your function’s Errors.
Cold starts: what’s really inside Init Duration
A cold start is the latency of creating and initializing a new execution environment before your handler can run. It is not a bug; it is the price of scaling from zero. It matters intensely for a synchronous, user-facing API (it lands in the user’s p99) and barely at all for an async batch job (nobody is waiting). The first diagnostic skill is decomposing where the time goes.
| Init sub-phase | What it is | Typical driver | Lever that shrinks it |
|---|---|---|---|
| Package download / image pull | Fetch your zip or container image into the environment | Package size, container image size, layers | Smaller package, fewer/lighter layers, optimized image, RUN_FROM_PACKAGE hygiene |
| Runtime bootstrap | Start the language runtime (JVM, Python, Node, .NET CLR) | JVM/.NET are heaviest; Node/Python lighter; Go/Rust lightest | Choose a lighter runtime; SnapStart (Java/Python/.NET) |
| Your init code (module top level) | Everything outside the handler: SDK clients, DB pools, config fetch, big imports | Heavy SDK init, sync network calls at import, large dependency graph | Lazy init (create on first use), trim imports, cache in /tmp or globals |
| VPC ENI attach | Attach a network interface for a VPC function | VPC config; historically ~10 s, now sub-second via Hyperplane | Keep it — Hyperplane fixed it; watch subnet IP exhaustion |
The drivers, ranked by how much they hurt
| Driver | Effect on cold start | Confirm | Fix |
|---|---|---|---|
| Large deployment package | More to download + parse | Package size in console / aws lambda get-function |
Trim deps, tree-shake, use layers judiciously, prune dev deps |
| Heavy runtime (JVM/.NET) | Slow bootstrap | Compare Init Duration across runtimes |
SnapStart; or Node/Python/Go for latency-critical paths |
| Sync work at module top level | Blocks Init | Long Init Duration, X-Ray Initialization subsegment |
Move to lazy init inside the handler |
| VPC (new subnet/SG combo) | ENI creation on first cold start | Slow only for VPC functions | Reuse SG/subnet sets; keep subnets with free IPs |
| Provisioned concurrency = 0 | Every scale-out invoke is cold | ProvisionedConcurrencyUtilization absent |
Allocate PC for the steady baseline |
| Large container image | Longer pull; more layers to cache | Image size in ECR | Multi-stage build, slim base, --platform match |
| Many dependencies imported eagerly | Parse/compile cost | Init Duration dominated by import |
Import lazily; drop unused libraries |
| Cold after idle | Environments reaped after ~5–15 min idle | Init Duration reappears after a lull |
Provisioned concurrency for latency SLAs |
Runtimes differ by an order of magnitude, and knowing the ballpark tells you whether a cold start is normal for your stack or a signal that your init code is the problem. These are typical, un-tuned Init Duration ranges for a small function — your mileage varies with package size and module-level work:
| Runtime | Typical cold Init Duration |
Warm invoke overhead | SnapStart? | Note |
|---|---|---|---|---|
| Node.js / Python | ~100–400 ms | negligible | Python: yes | The latency-critical default; keep the package small |
Go / Rust (custom provided.al2023) |
~50–150 ms | negligible | n/a | Lightest cold starts; compiled single binary |
| Java (JVM) | ~1–6 s | negligible once warm | yes | SnapStart cuts it to ~200–400 ms; the single biggest lever |
| .NET | ~600 ms–3 s | negligible | yes | SnapStart + ReadyToRun trims it substantially |
| Container image (any) | +100 ms–1 s pull | negligible | matches base runtime | First pull is slowest; optimize layers + base image |
The fixes, and the honest trade-offs
There are four real levers and one myth. Provisioned concurrency pre-initializes a set number of environments and keeps them warm — cold starts on that baseline go to zero, but you pay an hourly rate whether or not they are used. SnapStart takes a snapshot of the initialized environment and restores it on invoke, cutting init dramatically for Java (Corretto 11+), and now Python and .NET — at no extra charge, but with caveats (uniqueness of snapshot state, e.g. seeded randomness, and a restore hook for anything that must not be snapshotted). Smaller package + lazy init is free and always worth doing. The myth is keep-warm pings: a CloudWatch scheduled event that invokes the function every few minutes keeps one environment warm and does nothing for concurrent scale-out — the moment two requests arrive at once, the second is cold anyway. Use provisioned concurrency, not ping hacks.
| Lever | What it fixes | Cost | Caveat / when to use |
|---|---|---|---|
| Provisioned concurrency | Cold starts on a known baseline of concurrent envs | Hourly per PC unit (billed even when idle) + tiny per-invoke | Predictable latency SLAs; combine with Application Auto Scaling schedules |
| SnapStart | Init cost for Java/Python/.NET | No extra charge (small restore/cache cost) | Snapshot uniqueness (randomness, connections); use beforeCheckpoint/afterRestore hooks |
| Smaller package / lighter runtime | Download + bootstrap | Free | Always do it; biggest wins on Java/.NET |
| Lazy init | Your module-level work | Free | Move SDK clients/DB pools to first-use; cache in globals |
| Keep-warm ping (myth) | One env only — not scale-out | Wasted invokes | Don’t rely on it; use PC instead |
# Allocate provisioned concurrency on an alias (must publish a version first)
aws lambda put-provisioned-concurrency-config \
  --function-name orders-api --qualifier live \
  --provisioned-concurrent-executions 20

# Enable SnapStart (Java/Python/.NET) — applies to published versions
aws lambda update-function-configuration \
  --function-name invoice-render \
  --snap-start ApplyOn=PublishedVersions
# Terraform: provisioned concurrency + SnapStart
resource "aws_lambda_provisioned_concurrency_config" "live" {
  function_name                     = aws_lambda_function.orders_api.function_name
  qualifier                         = aws_lambda_alias.live.name
  provisioned_concurrent_executions = 20
}

resource "aws_lambda_function" "invoice_render" {
  function_name = "invoice-render"
  # ...
  snap_start { apply_on = "PublishedVersions" }
}
Timeouts: Task timed out after N seconds
The most misread failure in Lambda. The string is unambiguous — Task timed out after 30.00 seconds — but the cause is one of five, and only one of them is “the timeout is too short.” Your configured timeout is a hard ceiling from 1 second to 900 seconds (15 minutes); the platform kills the invocation the instant it is hit and bills you for the full duration.
| Root cause | What’s actually happening | Confirm | Fix |
|---|---|---|---|
| Downstream slowness | A DB/API call is slow or hanging | X-Ray subsegment sits near the full duration on one call | Add a per-call client timeout below the Lambda timeout; fix/scale the downstream |
Missing await / callback |
Node handler returns before async work finishes, or never calls the callback; event loop kept alive | Handler “succeeds” but side effect missing, or times out with idle CPU | async/await correctly; context.callbackWaitsForEmptyEventLoop; return a promise |
| No route to the internet/AWS (VPC) | VPC function with no NAT gateway / no VPC endpoint; the call just hangs | Works outside a VPC, times out inside; no error, just the timeout | Add a NAT gateway (internet) or VPC endpoints (AWS services); fix route table |
| DNS resolution stall | enableDnsSupport off, or resolving a private zone with no resolver route |
Timeout on the first network call; getaddrinfo in logs |
Enable DNS support/hostnames; Route 53 Resolver rules |
| Genuinely too short | The work legitimately needs more time than configured | Duration ≈ Timeout consistently, no single slow subsegment |
Raise the timeout to match the work (up to 900 s); or split the job |
The nastiest of these is the VPC-with-no-NAT timeout, because there is no error — the socket simply never connects and the function dies at the timeout with a clean-looking log. The tell is that the same code works when the function is not in a VPC. A Lambda in private subnets can reach S3 and DynamoDB via gateway VPC endpoints and other AWS services via interface endpoints, but the public internet (and public AWS service endpoints without a private route) requires a NAT gateway — Lambda ENIs never get a public IP.
Match the timeout to the caller’s patience, not just the work. Several integrations impose their own ceiling in front of Lambda’s 900 s:
| Front-end integration | Its timeout ceiling | Consequence if exceeded |
|---|---|---|
| API Gateway (REST/HTTP) | 29 s integration timeout by default (raisable above 29 s on REST APIs via a service-quota change; HTTP APIs cap at 30 s) | Client gets 504/503 even though Lambda keeps running (and billing) |
| Application Load Balancer | Target-group timeout (default 60 s, tunable) | ALB returns 504; Lambda may still complete |
| SQS event source | Queue visibility timeout should be ≥ 6 × function timeout | Too-low visibility → message reappears and is processed twice |
| Step Functions (sync task) | State machine TimeoutSeconds |
State fails; may retry per the Retry block |
| CloudFront (Lambda@Edge) | 5 s (viewer) / 30 s (origin) — separate service | Edge function is far stricter than regular Lambda |
# Set a 30 s timeout and confirm the visibility-timeout rule for an SQS trigger
aws lambda update-function-configuration --function-name resize --timeout 30
aws sqs set-queue-attributes --queue-url "$Q_URL" \
  --attributes VisibilityTimeout=180   # >= 6 x 30 s
Errors: the exact string tells you the class
An error in Lambda is anything that makes the invocation fail: your code threw, the runtime couldn’t load your code, a permission was denied, the process ran out of memory, or you were throttled before you ever ran. The category is written in the error errorType / message — learn to read it. This is the reference table you scan first.
| Error string / type | Phase | Meaning | Root cause | Fix |
|---|---|---|---|---|
Runtime.ImportModuleError |
Init | The runtime couldn’t import your handler’s module | Missing dependency in the package, wrong file name, native binary built for the wrong arch | Bundle the dep; match arm64/x86_64; verify the module path |
Runtime.HandlerNotFound |
Init | The handler string doesn’t point at a real function |
Typo in file.function; wrong export |
Fix the handler setting (app.handler), export the symbol |
Runtime.UserCodeSyntaxError |
Init | Your code doesn’t parse | Syntax error shipped | Lint/build before deploy |
Unhandled exception (errorType = your type) |
Invoke | Your handler threw and didn’t catch | Logic bug, bad input, downstream error | Catch, validate input, handle downstream failures |
Runtime.UnhandledPromiseRejection |
Invoke | A rejected promise wasn’t awaited/caught (Node) | Missing await/.catch |
Await all promises; global rejection handler |
[ERROR] Runtime exited ... signal: killed |
Invoke | Process killed — almost always OOM | Max Memory Used ≈ Memory Size |
Raise memory; fix leak; stream large data |
Task timed out after N seconds |
Invoke | Hit the configured timeout | See the timeout table above | Fix downstream/route; raise timeout |
AccessDeniedException / AccessDenied |
Invoke | An AWS call was denied | Execution-role policy missing a permission | Add the action/resource to the role |
KMSAccessDeniedException |
Init/Invoke | Can’t decrypt env vars or a KMS-encrypted resource | Role lacks kms:Decrypt on the CMK; key policy |
Grant kms:Decrypt; fix key policy |
429 TooManyRequestsException (Rate Exceeded) |
Gate | Throttled before/while invoking | Concurrency cap hit, or reserved concurrency too low | Raise account/reserved concurrency; back-pressure |
EC2ThrottledException / ENILimitReached |
Init | VPC networking couldn’t provision | Subnet IP exhaustion, ENI limits | Free subnet IPs; spread subnets; reduce churn |
ResourceConflictException |
Control | Concurrent update / state conflict | Two deploys/configs racing | Serialize updates; retry with backoff |
ProvisionedConcurrencyConfigNotFoundException |
Control | Invoked a qualifier with no PC configured | Alias/version mismatch | Point at the right alias; configure PC |
No space left on device (ENOSPC) |
Invoke | /tmp is full |
Buffering large files in ephemeral storage | Raise ephemeral storage (up to 10 GB); stream instead |
Permission errors — two policies, not one
A denial almost always means you fixed the wrong policy. There are two independent controls, and they fail differently:
| Permission control | Governs | Symptom when wrong | Where to fix |
|---|---|---|---|
| Execution role (IAM role on the function) | What the function’s code may call (S3, DynamoDB, KMS…) | AccessDeniedException in the handler logs at runtime |
The role’s IAM policy |
| Resource-based policy (on the function) | Who may invoke the function (S3, SNS, EventBridge, API GW) | The trigger never fires; no invoke at all | aws lambda add-permission / trigger config |
| KMS key policy / grant | Decrypt env vars and encrypted resources | KMSAccessDeniedException (often at Init) |
CMK key policy + role kms:Decrypt |
| VPC endpoint / SG | Whether the network call is even allowed | Timeout (no error) or connection refused | Security group + endpoint policy |
# Let S3 invoke the function (resource-based policy) — the invoke path
aws lambda add-permission --function-name thumbnailer \
  --statement-id s3invoke --action lambda:InvokeFunction \
  --principal s3.amazonaws.com --source-arn arn:aws:s3:::uploads-bucket

# Give the function's role permission to write to a table (execution role) — the runtime path
aws iam put-role-policy --role-name thumbnailer-role --policy-name ddb \
  --policy-document '{"Version":"2012-10-17","Statement":[{"Effect":"Allow","Action":["dynamodb:PutItem"],"Resource":"arn:aws:dynamodb:ap-south-1:111122223333:table/thumbs"}]}'
Throttling — the 429 family
Throttling is not an error in your code; it is the concurrency gate saying “not now.” Every function draws from your account concurrency limit (1,000 by default, raisable via a quota request). Each function can add 1,000 concurrent executions every 10 seconds until it reaches the account ceiling. Two levers shape this per function:
| Concurrency control | Range | Effect | Gotcha |
|---|---|---|---|
| Account concurrency | 1,000 default (raisable) | Ceiling for all functions combined | One runaway function can starve the rest |
| Reserved concurrency | 0 – (account − 100) | Carves a guaranteed slice for one function and caps it | Sets both floor and ceiling; 0 = kill switch (throttles all invokes) |
| Provisioned concurrency | ≤ reserved (if set) | Pre-warmed envs; no cold start | Billed hourly; spillover beyond PC is on-demand (cold) |
| Unreserved pool | ≥ 100 must remain | What’s left for functions without a reservation | Reserving too much starves everything else |
Throttles show up differently per model: synchronous callers get 429 TooManyRequestsException and must retry; asynchronous invokes are retried internally (and eventually dropped without a destination); poll-based sources slow their poll and the backlog grows (IteratorAge for streams, queue depth for SQS). Confirm with the Throttles metric — if it is > 0, no amount of code fixing helps.
Out-of-memory and a full /tmp
Memory is configurable from 128 MB to 10,240 MB, and CPU scales with it (roughly one full vCPU at ~1,769 MB, up to ~6 vCPUs at 10 GB) — so “add memory” is often really “add CPU” and can make a function both faster and cheaper. An OOM kill looks like Runtime exited with error: signal: killed, and the confirming tell is Max Memory Used in the REPORT line sitting flush against Memory Size. Separately, ephemeral storage (/tmp) defaults to 512 MB and is configurable to 10,240 MB; filling it (buffering a large upload, extracting an archive) throws No space left on device.
| Symptom | Metric / log tell | Root cause | Fix |
|---|---|---|---|
signal: killed, no stack trace |
Max Memory Used ≈ Memory Size |
Memory ceiling hit (leak or genuine need) | Raise memory; fix leak; stream large payloads |
| Slow and OOM-adjacent | High Duration + high memory |
CPU-starved at low memory | Raise memory to raise CPU (test the sweet spot) |
No space left on device |
Handler log, ENOSPC |
/tmp (512 MB default) full |
--ephemeral-storage 4096; stream to S3, don’t buffer |
| Rising memory across invokes | Max Memory Used creeps over time |
Leak in reused environment (globals grow) | Don’t accumulate in globals; recreate per invoke |
Many “errors” are really a hard limit you crossed without realizing there was one. Keep this reference close — the moment a symptom matches a ceiling, you have your root cause:
| Hard limit | Value | Error when exceeded | Where it bites |
|---|---|---|---|
| Sync request + response payload | 6 MB each | Body size is too large / truncation |
API GW / Invoke returning big bodies |
| Async invoke payload | 256 KB | RequestEntityTooLargeException |
S3/SNS/EventBridge events; put large data in S3 |
| Function timeout | 900 s (15 min) max | Task timed out |
Long jobs → Step Functions / Fargate |
| Memory | 128 MB – 10,240 MB | signal: killed (OOM) |
CPU scales with it (~1 vCPU @ 1,769 MB) |
Ephemeral /tmp |
512 MB – 10,240 MB | No space left on device (ENOSPC) |
Buffering/extracting large files |
| Deployment package | 50 MB zipped / 250 MB unzipped (zip); 10 GB (image) | RequestEntityTooLargeException |
Big deps → container image |
| Environment variables | 4 KB total | InvalidParameterValueException |
Move bulk config to SSM/Secrets Manager |
| Account concurrency | 1,000 default (raisable) | 429 TooManyRequestsException |
Shared across all functions |
/tmp + layers + code |
250 MB unzipped combined | Runtime.ImportModuleError (space) |
≤5 layers; prune |
Retry & failure destinations: where events go to die
This is the section that separates people who run Lambda from people who have merely deployed it. What happens after a failure depends entirely on the invocation model, and getting it wrong means silent data loss.
| Model | Automatic retries | Where a permanent failure goes | Config knobs |
|---|---|---|---|
| Synchronous | None by Lambda | Returned to caller; caller owns retry | Caller-side (SDK retry, API GW) |
| Asynchronous | 2 (≈1 min, then ≈2 min backoff) | On-failure destination (SQS/SNS/EventBridge/Lambda) or legacy DLQ; else dropped | MaximumRetryAttempts (0–2), MaximumEventAgeInSeconds (60–21,600) |
| SQS (poll) | Message returns after visibility timeout; retried until maxReceiveCount |
The queue’s redrive DLQ | ReportBatchItemFailures, maximumConcurrency, batchSize |
| Kinesis / DDB Streams (poll) | Whole batch, in order, until success or age-out | On-failure destination (discarded records’ metadata) | bisectBatchOnFunctionError, maximumRetryAttempts, maximumRecordAgeInSeconds, ReportBatchItemFailures |
Async: the silent-drop trap
An async invoke (S3 upload, SNS message, EventBridge rule) is owned by Lambda once accepted. If your handler errors, Lambda retries twice with backoff, then — if you configured nothing — discards the event with no record anywhere. The caller got a 202 Accepted long ago and moved on. This is the “the upload just disappeared” incident. The fix is to attach an on-failure destination (preferred; richer metadata than the legacy DLQ) so exhausted events land somewhere you can inspect and redrive.
| Async setting | Range / values | Default | When to change |
|---|---|---|---|
MaximumRetryAttempts |
0–2 | 2 | Set 0 for non-retryable work; keep 2 for transient faults |
MaximumEventAgeInSeconds |
60–21,600 (6 h) | 21,600 | Lower it so stale events don’t fire hours late |
| On-failure destination | SQS / SNS / EventBridge / Lambda | none | Always set one — this is your only record of a drop |
| On-success destination | SQS / SNS / EventBridge / Lambda | none | Fan-out on success without coupling the handler |
Legacy DLQ (DeadLetterConfig) |
SQS / SNS | none | Older accounts; prefer destinations (more context) |
If you take one thing from this section: prefer an on-failure destination over the legacy DLQ. Here is exactly why:
| Aspect | On-failure destination | Legacy DLQ (DeadLetterConfig) |
|---|---|---|
| Targets | SQS, SNS, EventBridge, Lambda | SQS, SNS only |
| Payload captured | Original event + response/error context + invocation metadata | Original event only |
| Success path too | Yes — separate on-success destination | No (failure only) |
| Applies to | Async and stream/poll (discarded records) | Async only |
| AWS guidance | Preferred (richer, more flexible) | Supported for backward compatibility |
# Async: 1 retry max, 1-hour age cap, on-failure destination to an SQS DLQ
aws lambda put-function-event-invoke-config --function-name ingest \
  --maximum-retry-attempts 1 --maximum-event-age-in-seconds 3600 \
  --destination-config '{"OnFailure":{"Destination":"arn:aws:sqs:ap-south-1:111122223333:ingest-dlq"}}'
resource "aws_lambda_function_event_invoke_config" "ingest" {
  function_name                = aws_lambda_function.ingest.function_name
  maximum_retry_attempts       = 1
  maximum_event_age_in_seconds = 3600
  destination_config {
    on_failure { destination = aws_sqs_queue.ingest_dlq.arn }
  }
}
Poll-based: the poison-record shard block
For Kinesis and DynamoDB Streams, ordering is sacred, so the poller retries the entire failing batch in order until it succeeds or the records age out. One record that always throws — a malformed payload, a bug on a specific shape — will therefore block its shard forever (up to the stream retention), and every record behind it waits. The telltale metric is IteratorAge climbing into minutes and then hours while throughput flatlines. The fix is a set of ESM knobs that let you drop or isolate the bad record:
| ESM setting | What it does | Default | Set it to… |
|---|---|---|---|
FunctionResponseTypes = ReportBatchItemFailures |
Return only the failed records’ sequence numbers; the rest checkpoint | off | on — the single most important stream setting |
BisectBatchOnFunctionError |
On batch error, split in half and retry — isolates the poison record | false | true for streams |
MaximumRetryAttempts |
Cap retries per record (streams) | −1 (infinite) | a finite number (e.g. 5–10) |
MaximumRecordAgeInSeconds |
Discard records older than this | −1 (infinite) | e.g. 3600–86400 so bad records expire |
| On-failure destination | Where discarded records’ metadata goes | none | an SQS/SNS target you monitor |
BatchSize |
Records per invoke | 100 (stream) / 10 (SQS) | tune for throughput vs blast radius |
MaximumBatchingWindowInSeconds |
Wait to fill a batch | 0 | 1–5 to batch small streams efficiently |
ParallelizationFactor |
Concurrent batches per shard | 1 | up to 10 to parallelize a hot shard |
TumblingWindowInSeconds |
Aggregation window state | 0 | for windowed aggregation |
For SQS, the model is friendlier: a message that keeps failing is retried until maxReceiveCount and then moved to the queue’s redrive DLQ — it does not block the queue. But partial batch response still matters: without ReportBatchItemFailures, a single failure in a batch of 10 makes the whole batch reappear and reprocess, duplicating the 9 that succeeded.
// Report only the failed records so the rest checkpoint (Node handler return shape)
{ "batchItemFailures": [ { "itemIdentifier": "49590338..." } ] }
# Kinesis ESM hardened against poison records
resource "aws_lambda_event_source_mapping" "kinesis" {
  event_source_arn                   = aws_kinesis_stream.events.arn
  function_name                      = aws_lambda_function.consumer.arn
  starting_position                  = "LATEST"
  batch_size                         = 100
  maximum_batching_window_in_seconds = 2
  bisect_batch_on_function_error     = true
  maximum_retry_attempts             = 5
  maximum_record_age_in_seconds      = 3600
  parallelization_factor             = 2
  function_response_types            = ["ReportBatchItemFailures"]
  destination_config {
    on_failure { destination_arn = aws_sqs_queue.stream_dlq.arn }
  }
}
The metrics that confirm each class
You never fix a Lambda problem you haven’t confirmed on a metric first. These are the ones that matter, and — crucially — which class each one confirms:
| Metric | Namespace/where | Confirms | Read it as |
|---|---|---|---|
Invocations |
Lambda | Baseline traffic | Denominator for error rate |
Errors |
Lambda | Handler/init failures | Errors/Invocations = error rate; excludes throttles |
Throttles |
Lambda | Concurrency-gate rejections | > 0 → raise/allocate concurrency, not code |
Duration |
Lambda | Slow handlers / near-timeout | p99 near timeout → timeout risk |
ConcurrentExecutions |
Lambda | How close to the cap | Near account/reserved limit → throttles imminent |
UnreservedConcurrentExecutions |
Lambda | Shared-pool pressure | Low → reservations starving others |
IteratorAge |
Lambda (stream ESM) | Stuck/lagging shard | Climbing → poison record or under-provisioned consumer |
DeadLetterErrors |
Lambda (async) | The safety net itself failing | > 0 → DLQ misconfigured; you’re losing events and the record of them |
DestinationDeliveryFailures |
Lambda (async) | On-failure/success destination failing | > 0 → destination permission/target broken |
AsyncEventsReceived / AsyncEventAge / AsyncEventsDropped |
Lambda (async) | Async queue health + drops | AsyncEventsDropped > 0 → events lost (no/failed destination) |
ProvisionedConcurrencyUtilization |
Lambda (PC) | Are you using what you pay for | ≈1 → too little PC (spillover cold); ≪1 → over-provisioned |
ProvisionedConcurrencySpilloverInvocations |
Lambda (PC) | Cold invokes past your PC | > 0 → raise PC or accept cold spillover |
ClaimedAccountConcurrency |
Lambda (account) | Account-level headroom | Near the limit → request a raise |
# Is it errors or throttles? Pull both for the last hour.
aws cloudwatch get-metric-statistics --namespace AWS/Lambda --metric-name Throttles \
  --dimensions Name=FunctionName,Value=orders-api \
  --start-time "$(date -u -v-1H +%FT%TZ)" --end-time "$(date -u +%FT%TZ)" \
  --period 300 --statistics Sum

# Is a shard stuck? Watch IteratorAge.
aws cloudwatch get-metric-statistics --namespace AWS/Lambda --metric-name IteratorAge \
  --dimensions Name=FunctionName,Value=stream-consumer \
  --start-time "$(date -u -v-3H +%FT%TZ)" --end-time "$(date -u +%FT%TZ)" \
  --period 300 --statistics Maximum
Metrics tell you which class; X-Ray and structured logs tell you where. Turn on active tracing and every invocation gets a trace with an Initialization subsegment (your cold-start cost, visible), plus a subsegment per downstream AWS call and any custom subsegments you add — so a “timeout” resolves instantly into “the DynamoDB Query subsegment consumed 29 of the 30 seconds.” Emit structured JSON logs (the newer runtimes and Lambda’s JSON log format make level, requestId and timestamp first-class) so CloudWatch Logs Insights queries are filters, not regex archaeology.
| Tool | Turn on with | Answers |
|---|---|---|
| X-Ray active tracing | --tracing-config Mode=Active + role perms |
Where the time went (Init vs each downstream call) |
| X-Ray subsegments | SDK instrumentation in code | Which specific dependency call stalled |
| CloudWatch Logs Insights | Query the log group | Init Duration distribution, error-string frequency, Max Memory Used p99 |
| Structured JSON logs | JSON log format / logger | filter level="ERROR", correlate by requestId |
| Lambda Insights | Enable the extension | Per-invoke CPU/mem/network beyond the REPORT line |
aws lambda update-function-configuration --function-name orders-api \
  --tracing-config Mode=Active   # role needs xray:PutTraceSegments, PutTelemetryRecords
Keep this CloudWatch Logs Insights cookbook — each query turns a vague “it’s slow / it’s failing” into a confirmed class in one paste:
| Goal | Logs Insights query (paste into the function’s log group) |
|---|---|
| Cold-start frequency + cost | filter @type="REPORT" | stats count(@initDuration) as coldStarts, avg(@initDuration), pct(@initDuration,99) by bin(5m) |
| Memory pressure (near OOM) | filter @type="REPORT" | stats max(@maxMemoryUsed/1000000) as maxMB, avg(@memorySize/1000000) as limitMB by bin(5m) |
| Timeout hunting | filter @message like /Task timed out/ | stats count() by bin(5m) |
| Top error types | filter @message like /ERROR/ | parse @message "errorType\":\"*\"" as et | stats count() by et |
| Slowest invocations | filter @type="REPORT" | sort @duration desc | limit 20 | display @requestId, @duration, @billedDuration |
| Import/init failures | filter @message like /Runtime.ImportModuleError/ or @message like /HandlerNotFound/ | stats count() by bin(5m) |
A fast triage decision table for the first 60 seconds of an incident:
| If you see… | It’s probably… | Do this first |
|---|---|---|
Throttles > 0, Errors flat |
Concurrency cap | Check reserved/account concurrency; raise or reallocate |
Duration ≈ timeout, one slow subsegment |
Downstream stall | Add client-side timeout; fix/scale the dependency |
Init Duration present + p99 spike |
Cold starts | Provisioned concurrency / SnapStart / lazy init |
IteratorAge climbing |
Poison record / slow consumer | ReportBatchItemFailures + bisect + age cap |
Errors > 0, no downstream effect, async |
Silent drop | Attach on-failure destination; check AsyncEventsDropped |
Max Memory Used ≈ Memory Size |
OOM | Raise memory; fix leak |
AccessDeniedException in logs |
Execution-role gap | Add the action/resource to the role |
| Trigger never fires | Resource-policy gap | aws lambda add-permission for the principal |
Architecture at a glance
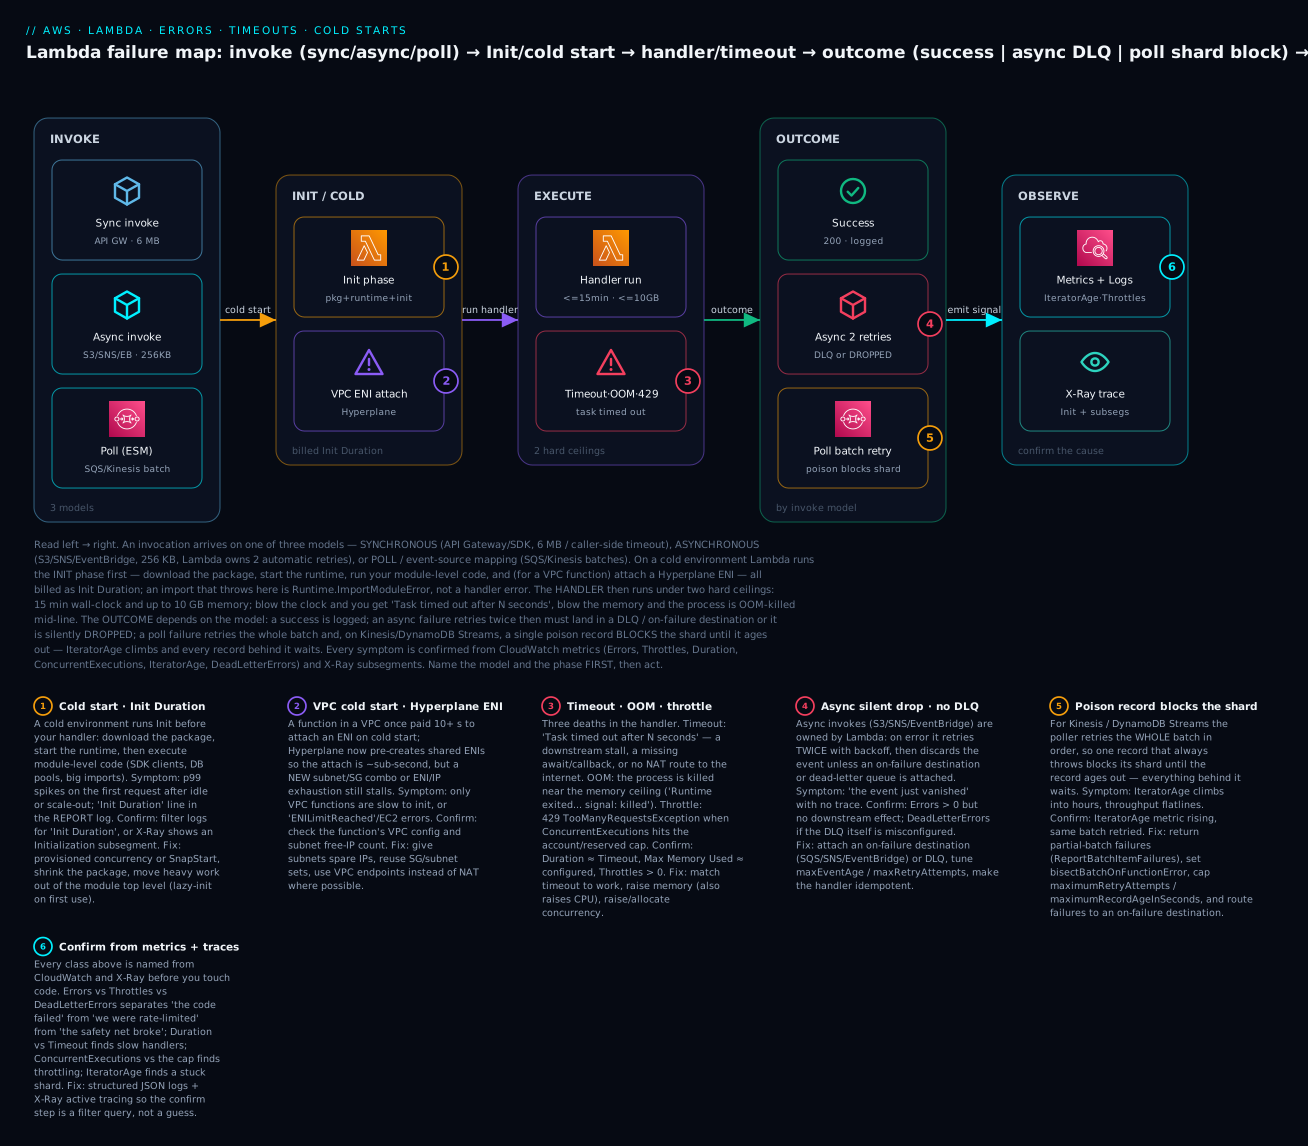
The diagram traces the real path an invocation takes and pins each failure class to the exact hop where it bites. Read left to right: an invocation arrives on one of three models (synchronous, asynchronous, or a poll-based event-source mapping), runs the Init phase on a cold environment (package download, runtime bootstrap, your module code, and — for a VPC function — an ENI attach), then the handler runs under two hard ceilings (15 minutes, 10 GB). The outcome depends on the model: a success is logged; an async failure retries twice and then must land in a DLQ / on-failure destination or it is dropped; a poll failure retries the batch and, on a stream, a poison record blocks the shard. Every class is confirmed from CloudWatch and X-Ray — the sixth badge — before you change a line of code.
Real-world scenario
FreshCart, a mid-size grocery-delivery startup on ap-south-1, ran three Lambda workloads: a synchronous checkout API behind API Gateway, an asynchronous order-confirmation function triggered by an EventBridge “OrderPlaced” event, and a Kinesis consumer projecting order events into an analytics table. Over one Diwali weekend all three broke in ways that, on the surface, looked like “Lambda is flaky.”
The checkout API started returning 504 to a slice of users during traffic surges. The team’s first instinct was “raise the timeout,” but Duration was healthy — the REPORT lines showed Init Duration of 4.2 seconds on a cold Java function, and the 504s correlated exactly with scale-out events where API Gateway’s 29-second ceiling was never the issue; the users were simply waiting on cold starts stacked behind a slow JVM init that fetched config synchronously at module load. They moved the config fetch to lazy init, enabled SnapStart on the Java function, and allocated provisioned concurrency of 30 on the live alias sized to the weekend baseline. Cold-start p99 fell from 4.2 s to under 400 ms.
The order-confirmation function was worse because it was silent. Customers reported missing confirmation emails, but the function showed only a modest Errors bump. The tell was AsyncEventsDropped > 0: under load the function occasionally threw on a downstream SES rate limit, Lambda retried twice, and — with no on-failure destination configured — dropped the event. Thousands of confirmations evaporated with no record. The fix was three lines of Terraform: an aws_lambda_function_event_invoke_config with maximum_retry_attempts = 2, maximum_event_age_in_seconds = 3600, and an on-failure destination to an SQS DLQ they could redrive once SES calmed down. They also made the handler idempotent on order ID so a redrive couldn’t double-send.
The Kinesis consumer flatlined for six hours on Saturday night. IteratorAge had climbed to over five hours; throughput was zero. A single order event with a null total field threw on every retry, and because the stream poller retries the whole batch in order, that one record had blocked its shard since 9 p.m. — every order behind it stuck. The permanent fix was ReportBatchItemFailures (so good records checkpoint), bisectBatchOnFunctionError = true (to isolate the poison record), maximum_retry_attempts = 5 and maximum_record_age_in_seconds = 3600 (so a bad record expires instead of blocking forever), and an on-failure destination capturing the dropped record for later inspection. IteratorAge drained to seconds within minutes of deploy. The lesson the team wrote in their runbook: name the invocation model first — the same “it broke” means three completely different fixes.
Advantages and disadvantages
Understanding Lambda’s failure model is not optional overhead; it is the difference between serverless being a superpower and being a liability. But the same properties that make it powerful create the specific traps above.
| Advantages (when you operate it right) | Disadvantages (the traps to manage) |
|---|---|
| Scales from zero to thousands with no capacity planning | Cold starts land in the user’s p99 on sync paths |
| Pay only for execution (GB-second) | Timeouts bill for the full duration even on failure |
| Built-in retries + DLQ/destinations for async | Silent drop if you don’t configure a destination |
| Ordered, at-least-once stream processing | One poison record blocks a whole shard |
| CPU scales with memory — one knob for speed | OOM kills with no stack trace; /tmp is only 512 MB by default |
| Fine-grained IAM per function | Two separate permission surfaces (role + resource policy) confuse denials |
| Rich metrics, X-Ray, structured logs | Blind without them — no host to inspect |
The advantages dominate for spiky, event-shaped, stateless work — image processing, webhooks, ETL steps, stream consumers, glue code. The disadvantages dominate when you treat Lambda like a long-running server: heavy synchronous request/response with strict latency SLAs (cold starts hurt), very long jobs (15-minute wall), or large in-memory datasets (memory and /tmp ceilings). The skill is knowing which regime you’re in and configuring the guardrails — destinations, partial-batch responses, provisioned concurrency — before the incident, not during it.
Hands-on lab
You will reproduce and fix three classic failures on a free-tier-friendly account in ap-south-1: a timeout (no route to the internet), an import error, and an SQS poison-message batch reprocess (partial-batch response). Everything here is free-tier eligible except a few pennies of CloudWatch/SQS; teardown is at the end. Run in CloudShell (Bash) where aws is pre-authenticated.
Step 0 — Variables and an execution role.
export AWS_DEFAULT_REGION=ap-south-1
ACCT=$(aws sts get-caller-identity --query Account --output text)
ROLE_ARN=$(aws iam create-role --role-name lambda-lab-role \
  --assume-role-policy-document '{"Version":"2012-10-17","Statement":[{"Effect":"Allow","Principal":{"Service":"lambda.amazonaws.com"},"Action":"sts:AssumeRole"}]}' \
  --query Role.Arn --output text)
aws iam attach-role-policy --role-name lambda-lab-role \
  --policy-arn arn:aws:iam::aws:policy/service-role/AWSLambdaBasicExecutionRole
sleep 10   # let the role propagate
Step 1 — Reproduce an import error. Ship a handler that imports a module that isn’t in the package.
mkdir -p fn && cat > fn/app.py <<'PY'
import requests            # NOT bundled -> ImportModuleError
def handler(event, context):
    return {"ok": True}
PY
( cd fn && zip -q ../fn.zip app.py )
aws lambda create-function --function-name lab-import \
  --runtime python3.12 --handler app.handler --role "$ROLE_ARN" \
  --zip-file fileb://fn.zip --timeout 10
aws lambda invoke --function-name lab-import /dev/stdout
Expected: an error payload whose errorType is Runtime.ImportModuleError and message Unable to import module 'app': No module named 'requests'. This is a cold-start / Init failure, not a handler bug.
Step 2 — Fix the import error. Remove the unused import (the honest fix) and redeploy.
cat > fn/app.py <<'PY'
def handler(event, context):
    return {"ok": True}
PY
( cd fn && zip -q ../fn.zip app.py )
aws lambda update-function-code --function-name lab-import --zip-file fileb://fn.zip
aws lambda invoke --function-name lab-import /dev/stdout   # -> {"ok": true}
Expected: {"ok": true} with no FunctionError. (Had you genuinely needed requests, the fix would be to bundle it — pip install -t fn requests before zipping, or a layer.)
Step 3 — Reproduce a timeout with no route to the internet. Deploy a function that calls a public URL, then put it in a VPC without a NAT route so the call hangs until the timeout.
cat > fn/app.py <<'PY'
import urllib.request
def handler(event, context):
    with urllib.request.urlopen("https://checkip.amazonaws.com", timeout=8) as r:
        return r.read().decode()
PY
( cd fn && zip -q ../fn.zip app.py )
aws lambda create-function --function-name lab-timeout \
  --runtime python3.12 --handler app.handler --role "$ROLE_ARN" \
  --zip-file fileb://fn.zip --timeout 10
aws lambda invoke --function-name lab-timeout /dev/stdout     # works: prints your egress IP
Now attach it to private subnets with no NAT (create two subnets in your default VPC’s route table that has no 0.0.0.0/0 -> nat), which forces the outbound call to hang:
VPC=$(aws ec2 describe-vpcs --filters Name=isDefault,Values=true --query 'Vpcs[0].VpcId' --output text)
SG=$(aws ec2 create-security-group --group-name lab-sg --description lab --vpc-id "$VPC" --query GroupId --output text)
SUBNETS=$(aws ec2 describe-subnets --filters Name=vpc-id,Values=$VPC --query 'Subnets[0:2].SubnetId' --output text | tr '\t' ',')
aws lambda update-function-configuration --function-name lab-timeout \
  --vpc-config SubnetIds=$SUBNETS,SecurityGroupIds=$SG --timeout 10
aws iam attach-role-policy --role-name lambda-lab-role \
  --policy-arn arn:aws:iam::aws:policy/service-role/AWSLambdaVPCAccessExecutionRole
sleep 20
aws lambda invoke --function-name lab-timeout /dev/stdout
Expected: the invoke hangs ~10 s and returns Task timed out after 10.00 seconds. Note there is no error — just the timeout. That is the fingerprint of a missing route.
Step 4 — Fix the timeout. The correct fix depends on the target: for a public URL you need a NAT gateway (not free); for AWS services you’d add VPC endpoints. For the lab, demonstrate the diagnosis and revert the function out of the VPC (the “it works outside a VPC” proof):
aws lambda update-function-configuration --function-name lab-timeout \
  --vpc-config SubnetIds=,SecurityGroupIds=
sleep 20
aws lambda invoke --function-name lab-timeout /dev/stdout     # egress IP again -> fixed
Step 5 — Reproduce an SQS poison-message batch reprocess, then fix it with partial-batch response. Create a queue + DLQ, wire an event-source mapping, and a handler that fails on one specific message.
DLQ=$(aws sqs create-queue --queue-name lab-dlq --query QueueUrl --output text)
DLQ_ARN=$(aws sqs get-queue-attributes --queue-url "$DLQ" --attribute-names QueueArn --query Attributes.QueueArn --output text)
Q=$(aws sqs create-queue --queue-name lab-q \
  --attributes "{\"VisibilityTimeout\":\"90\",\"RedrivePolicy\":\"{\\\"deadLetterTargetArn\\\":\\\"$DLQ_ARN\\\",\\\"maxReceiveCount\\\":\\\"3\\\"}\"}" \
  --query QueueUrl --output text)
Q_ARN=$(aws sqs get-queue-attributes --queue-url "$Q" --attribute-names QueueArn --query Attributes.QueueArn --output text)
aws iam attach-role-policy --role-name lambda-lab-role \
  --policy-arn arn:aws:iam::aws:policy/service-role/AWSLambdaSQSQueueExecutionRole

cat > fn/app.py <<'PY'
def handler(event, context):
    failures = []
    for r in event["Records"]:
        if "POISON" in r["body"]:
            failures.append({"itemIdentifier": r["messageId"]})   # report ONLY this one
    return {"batchItemFailures": failures}
PY
( cd fn && zip -q ../fn.zip app.py )
aws lambda create-function --function-name lab-sqs \
  --runtime python3.12 --handler app.handler --role "$ROLE_ARN" \
  --zip-file fileb://fn.zip --timeout 15
aws lambda create-event-source-mapping --function-name lab-sqs \
  --event-source-arn "$Q_ARN" --batch-size 10 \
  --function-response-types ReportBatchItemFailures
Send a batch: nine good, one poison.
for i in $(seq 1 9); do aws sqs send-message --queue-url "$Q" --message-body "good-$i" >/dev/null; done
aws sqs send-message --queue-url "$Q" --message-body "POISON" >/dev/null
sleep 30
aws sqs get-queue-attributes --queue-url "$DLQ" --attribute-names ApproximateNumberOfMessages
Expected: only the POISON message eventually lands in lab-dlq (after maxReceiveCount retries) — the nine good messages were checkpointed and not reprocessed, because batchItemFailures reported only the poison one. Had you returned nothing (or thrown), all ten would have reappeared and the nine good ones would have been processed repeatedly. Verify the DLQ shows ApproximateNumberOfMessages = 1.
Validation checklist. You reproduced three distinct classes and confirmed each from its own fingerprint:
| Step | Failure reproduced | The fingerprint | The fix you applied |
|---|---|---|---|
| 1–2 | Import error (Init) | Runtime.ImportModuleError: No module named 'requests' |
Bundle the dep / remove the import |
| 3–4 | Timeout, no NAT route | Task timed out after 10.00 seconds, no error, works outside VPC |
NAT gateway / VPC endpoints; fix route table |
| 5 | SQS poison batch reprocess | 9 good messages reprocessed without partial-batch response | ReportBatchItemFailures → only the poison message to the DLQ |
Teardown (⚠️ do this — the SQS queues and Lambda are tiny but real).
aws lambda delete-function --function-name lab-import
aws lambda delete-function --function-name lab-timeout
ESM=$(aws lambda list-event-source-mappings --function-name lab-sqs --query 'EventSourceMappings[0].UUID' --output text)
aws lambda delete-event-source-mapping --uuid "$ESM"
aws lambda delete-function --function-name lab-sqs
aws sqs delete-queue --queue-url "$Q"; aws sqs delete-queue --queue-url "$DLQ"
aws ec2 delete-security-group --group-id "$SG" 2>/dev/null || true
for p in AWSLambdaBasicExecutionRole AWSLambdaVPCAccessExecutionRole AWSLambdaSQSQueueExecutionRole; do
  aws iam detach-role-policy --role-name lambda-lab-role --policy-arn arn:aws:iam::aws:policy/service-role/$p; done
aws iam delete-role --role-name lambda-lab-role
Cost note. Everything here is within the Lambda and SQS free tiers; the only real charge would be a NAT gateway if you created one in Step 4 (~₹3–4/hour + data) — the lab deliberately avoids it and demonstrates the diagnosis instead. Deleting the resources above stops any lingering cost.
Common mistakes & troubleshooting
This is the playbook — the part you bookmark. First the scannable table you can read at 02:14, then the three nastiest failures in full. Every row is a real failure with the exact symptom, the class it belongs to, the root cause, the precise command or metric to confirm, and the fix.
| # | Symptom | Category | Root cause | Confirm (exact cmd / metric) | Fix |
|---|---|---|---|---|---|
| 1 | p99 latency spikes after traffic lulls or scale-out | Cold start | New environments initialized on demand | REPORT shows Init Duration; Logs Insights stats avg(@initDuration) |
Provisioned concurrency / SnapStart; lazy init; smaller package |
| 2 | Only VPC functions are slow to init; ENILimitReached |
VPC cold start | ENI creation / subnet IP exhaustion | Function has VpcConfig; check subnet free IPs |
Spare IPs, reuse SG/subnet sets, VPC endpoints |
| 3 | Task timed out after N seconds, no other error |
Timeout | Downstream stall or no route (NAT/DNS) | X-Ray subsegment near full duration; works outside VPC | Client-side timeout; NAT/VPC endpoints; fix DNS/route |
| 4 | Runtime.ImportModuleError on every invoke |
Import error | Missing dep / wrong arch / bad module path | Invoke returns the error; aws lambda invoke /dev/stdout |
Bundle the dep; match arm64/x86_64; fix handler path |
| 5 | Runtime.HandlerNotFound |
Handler config | handler string doesn’t point at the function |
aws lambda get-function-configuration --query Handler |
Set file.function; export the symbol |
| 6 | Trigger never fires; zero Invocations |
Permission (invoke) | Missing resource-based policy for the principal | aws lambda get-policy lacks the source |
aws lambda add-permission for S3/SNS/EventBridge |
| 7 | AccessDeniedException inside the handler |
Permission (role) | Execution role missing the action/resource | The denied action is in the log line | Add action+resource to the execution role policy |
| 8 | KMSAccessDeniedException, often at Init |
KMS | Role can’t kms:Decrypt env vars/resource |
Error names the key ARN | Grant kms:Decrypt; fix CMK key policy |
| 9 | 429 TooManyRequestsException to callers |
Throttle | Concurrency cap hit / reserved too low | Throttles > 0; ConcurrentExecutions near cap |
Raise account/reserved concurrency; back-pressure |
| 10 | Function invoked but silently does nothing (reserved=0) | Throttle (kill switch) | Reserved concurrency set to 0 | get-function-concurrency = 0 |
Remove/raise the reservation |
| 11 | Runtime exited ... signal: killed |
OOM | Memory ceiling hit | Max Memory Used ≈ Memory Size in REPORT |
Raise memory (also CPU); fix leak; stream data |
| 12 | No space left on device |
/tmp full | Ephemeral storage (512 MB) exhausted | Handler log ENOSPC |
--ephemeral-storage 4096; stream to S3 |
| 13 | Async event “disappeared”, no downstream effect | Async silent drop | Retries exhausted, no destination | AsyncEventsDropped > 0; Errors > 0 |
Attach on-failure destination/DLQ; idempotency |
| 14 | DeadLetterErrors > 0 |
Safety-net failure | DLQ misconfigured / no permission | Metric > 0; DLQ target/perm | Fix DLQ ARN + role sqs:SendMessage/sns:Publish |
| 15 | Stream throughput flatlines; IteratorAge climbs for hours |
Poison-record shard block | One record always fails; whole batch retried in order | IteratorAge Maximum rising; same batch retried |
ReportBatchItemFailures + bisect + age/retry cap + destination |
| 16 | SQS messages processed multiple times | Duplicate / partial-batch | No ReportBatchItemFailures; or visibility < 6× timeout |
Duplicate side effects; maxReceiveCount climbing |
Partial-batch response; visibility ≥ 6× function timeout; idempotency |
| 17 | Downstream DB connection errors under load | Scale-out stampede | Thousands of concurrent envs each open a connection | DB max-connections hit; ConcurrentExecutions high |
Reserved concurrency cap; RDS Proxy; connection reuse |
| 18 | Env vars empty; function behaves as if unconfigured | KMS / config | KMS decrypt failed at Init, or setting missing | KMSAccessDeniedException; get-function-configuration |
Fix kms:Decrypt; set the variable |
| 19 | Background work never completes (Node) | Lifecycle | Work started after response; env frozen | Side effect missing though handler “succeeded” | await before returning; don’t fire-and-forget post-response |
| 20 | ResourceConflictException on deploy |
Control-plane race | Two updates racing / update in progress | The API error | Serialize updates; retry with backoff |
The three that cause the most damage, expanded:
A. The VPC cold-start / no-route timeout (the “it works on my machine, times out in prod” ghost). A function tests fine, then in production every call that touches the internet or a public AWS endpoint times out — Task timed out after N seconds with no error and no useful log. The cause is a VPC configuration with no NAT gateway (for internet) or no VPC endpoint (for AWS services): a Lambda ENI never gets a public IP, so the socket to a public address simply never connects and the invocation dies at the timeout. Confirm: the exact same code works when the function is not in a VPC, or when you target an AWS service that has a gateway endpoint (S3/DynamoDB) versus one that doesn’t. Check the route table associated with the function’s subnets for a 0.0.0.0/0 → nat-... route, and check for interface endpoints for the specific service. Fix: add a NAT gateway for internet egress, or — cheaper and more secure for AWS-only traffic — interface/gateway VPC endpoints for exactly the services you call; ensure enableDnsSupport/enableDnsHostnames are on. Historically this class also meant a slow ENI attach on cold start (~10 s), but Hyperplane pre-creates shared ENIs, so today the residual VPC init cost is sub-second — the timeout is now almost always the route, not the ENI.
B. The poison-record shard block (silent for hours). A Kinesis or DynamoDB Streams consumer stops making progress and nobody notices until IteratorAge is measured in hours. One record — a null field, an unexpected shape — throws on every retry, and because streams preserve order, Lambda retries the entire batch in order until it succeeds or the records age out, so that one record blocks its whole shard and every record behind it waits. Confirm: the IteratorAge metric (Maximum) climbs steadily; the logs show the same batch/sequence number retried repeatedly. Fix (the full set, not just one): enable ReportBatchItemFailures so good records checkpoint; set bisectBatchOnFunctionError = true to split the batch and isolate the offender; cap maximumRetryAttempts and maximumRecordAgeInSeconds so a bad record eventually expires instead of blocking forever; and attach an on-failure destination so the discarded record’s metadata is captured for inspection. Then make the handler defensive on the shapes you actually see. The parallelizationFactor can raise per-shard concurrency, but it does not cure a poison record — only the failure-isolation knobs do.
C. The async silent drop (data loss with a 202). An S3/SNS/EventBridge-triggered function throws intermittently under load; the producer got its 202 Accepted and moved on; Lambda retries twice and then discards the event because nothing was configured to catch it. Customers report missing side effects (no confirmation email, no thumbnail) while your dashboards look almost fine — a small Errors bump and, if you know to look, AsyncEventsDropped > 0. Confirm: AsyncEventsDropped and AsyncEventAge on the function; correlate the Errors bump with the missing side effects. Fix: attach an on-failure destination (SQS/SNS/EventBridge — richer than the legacy DLQ) so exhausted events are captured and redrivable; tune MaximumRetryAttempts and MaximumEventAgeInSeconds to your semantics; and make the handler idempotent so a redrive can’t double-apply. Watch DeadLetterErrors/DestinationDeliveryFailures too — a DLQ your role can’t write to is worse than none, because it hides the loss.
Best practices
- Name the invocation model first. Sync, async, and poll fail and recover completely differently; every diagnosis starts there.
- Always attach a failure destination. An async function without an on-failure destination (or a stream ESM without one) is a silent-data-loss machine.
- Make every handler idempotent. At-least-once delivery plus retries plus redrives means the same event will arrive twice; key side effects on an idempotency token.
- Turn on
ReportBatchItemFailuresfor every stream/queue ESM. Without it, one bad record reprocesses the whole batch (SQS) or blocks the shard (streams). - Set the SQS visibility timeout to ≥ 6× the function timeout. Too low and messages reappear mid-processing and duplicate.
- Match the timeout to the work, and add a client-side timeout below it. Every downstream SDK call should fail before Lambda’s timeout so you get an error, not a mystery kill.
- Right-size memory by testing, not guessing. CPU scales with memory; the fastest setting is often also the cheapest. Use Lambda Power Tuning.
- Move heavy work out of module top level. Lazy-init SDK clients and pools on first use; cache in globals across warm invocations.
- Use provisioned concurrency for latency SLAs, SnapStart for JVM/Python/.NET init — never keep-warm pings. Pings warm one environment; they do nothing for concurrent scale-out.
- Cap concurrency to protect downstreams. A Lambda scale-out will happily exhaust an RDS connection pool; use reserved concurrency and RDS Proxy.
- Turn on X-Ray active tracing and structured JSON logs before you need them. Mid-incident is the wrong time to discover you can’t see the Init subsegment.
- Alarm on the right metric per class:
Throttles,DeadLetterErrors/AsyncEventsDropped,IteratorAge, andDurationp99 — not justErrors.
Security notes
- Least-privilege execution role. Grant only the specific actions and resource ARNs the handler calls; a wildcard
s3:*on*turns a code bug into a blast radius. Denials (AccessDeniedException) are a feature — read them, don’t broaden to*to make them go away. - Separate the two permission surfaces deliberately. The execution role controls what the code can do; the resource-based policy controls who can invoke. Keep invoke permissions scoped by
--source-arnso only the intended bucket/topic/rule can trigger the function. - Encrypt environment variables with a customer-managed KMS key for anything sensitive, and grant the role
kms:Decrypton exactly that key — aKMSAccessDeniedExceptionat Init is the sign this is missing. Better still, pull secrets at runtime from Secrets Manager/Parameter Store rather than baking them into env vars. - Run in a VPC only when you must reach private resources, and prefer VPC endpoints over a NAT gateway so traffic to AWS services never leaves the AWS network — this also removes the most common “silent timeout” cause.
- Guard the DLQ and destinations. They often contain full failed payloads; encrypt them and restrict who can read them, or a dead-letter queue becomes a data-exfiltration target.
- Pin dependencies and scan the package.
Runtime.ImportModuleErrorfrom a mismatched arch is benign; a compromised transitive dependency running in your execution role is not. Matcharm64/x86_64and scan images/layers.
Cost & sizing
Lambda bills on GB-seconds (memory × duration) plus per-request plus extras (provisioned concurrency by the hour, ephemeral storage above 512 MB, and data transfer). The free tier is generous — 1M requests and 400,000 GB-seconds per month — but the failure classes above have direct cost consequences: a timeout bills for the full duration, an OOM-retry loop bills for every attempt, and provisioned concurrency bills whether used or not.
| Cost driver | How it’s billed | Right-size by | Rough figure |
|---|---|---|---|
| Compute | GB-second (memory × billed ms) | Power-tune memory; faster often = cheaper | ~$0.0000166667 per GB-s (varies by region) |
| Requests | Per invoke | Batch where possible (SQS/Kinesis) | ~$0.20 per 1M requests |
| Provisioned concurrency | Per PC unit-hour + tiny per-invoke | Size to the baseline, autoscale schedules for peaks | Paid even when idle — don’t over-allocate |
| Ephemeral storage | Above 512 MB, per GB-s | Keep /tmp small; stream to S3 |
Only pay for what’s above the free 512 MB |
| Timeouts / retries | Full duration, every attempt | Client-side timeouts; cap retries | A hung 15-min invoke bills 15 min |
| X-Ray / Logs | Per trace / per GB ingested | Sample traces; set log retention | Logs with no retention grow forever |
Sizing rules of thumb: for a sync API, prioritize latency — enough memory for CPU headroom plus provisioned concurrency for the baseline; the extra GB-second cost is usually dwarfed by the p99 win. For async/batch, prioritize throughput and cost — larger batches, right-sized memory, and no provisioned concurrency (nobody’s waiting). Set log retention on every function’s log group (default is never-expire) or CloudWatch Logs quietly becomes a bigger line item than the compute. In INR terms, a modest event-driven workload (a few million invocations, sub-second, 256–512 MB) typically runs in the low hundreds of rupees per month before free tier — the expensive mistakes are idle provisioned concurrency and unbounded log retention, not the invocations.
Interview & exam questions
Q1. What exactly is inside “Init Duration,” and why does it matter for a synchronous API? Init Duration is the cold-start work: downloading the package/image, bootstrapping the runtime, and running your module-level code (SDK clients, imports, pools) — plus a VPC ENI attach for VPC functions. It matters for sync APIs because it lands in the user’s p99 on every cold environment; async jobs don’t care. (DVA-C02)
Q2. An async-invoked function’s events are “disappearing.” Walk the diagnosis.
Async invokes are Lambda-owned: on error it retries twice then drops the event unless a destination/DLQ is set. Confirm with AsyncEventsDropped > 0 and correlate the Errors bump with missing side effects. Fix: attach an on-failure destination, tune MaximumRetryAttempts/MaximumEventAgeInSeconds, and make the handler idempotent. (DVA-C02, SOA-C02)
Q3. A Kinesis consumer’s IteratorAge is climbing for hours with zero throughput. Cause and fix?
A poison record that always throws; streams retry the whole batch in order, so it blocks the shard until age-out. Fix: ReportBatchItemFailures (checkpoint good records), bisectBatchOnFunctionError, cap maximumRetryAttempts/maximumRecordAgeInSeconds, and an on-failure destination. (DVA-C02, SAA-C03)
Q4. Distinguish Errors from Throttles.
Errors counts invocations that failed in Init or handler (code/permission/timeout/OOM); it excludes throttles. Throttles counts invocations rejected by the concurrency gate (429). A throttle problem is fixed with concurrency, not code — reading the wrong metric wastes the incident. (SOA-C02)
Q5. You get Task timed out after 30 seconds but Duration looks fine on similar calls. What are you checking?
Whether one downstream call stalls (X-Ray subsegment near full duration), whether a VPC function lacks a NAT/endpoint route (works outside the VPC), a missing await/callback, or DNS. Only after ruling those out do you raise the timeout. (DVA-C02)
Q6. How does throttling manifest differently across the three invocation models?
Sync: caller gets 429 and must retry. Async: Lambda retries internally and eventually drops without a destination. Poll: the poller slows and backlog grows (IteratorAge for streams, depth for SQS). (DVA-C02)
Q7. What does setting reserved concurrency to 0 do, and when would you? It throttles all invocations — a kill switch to instantly stop a misbehaving or compromised function without deleting it. Non-zero reserved concurrency both guarantees and caps that function’s slice of the account pool. (SOA-C02)
Q8. Provisioned concurrency vs SnapStart — when each? Provisioned concurrency pre-warms N environments (kills cold starts on a baseline, billed hourly) — use for predictable latency SLAs. SnapStart snapshots the initialized env and restores it (Java/Python/.NET, no extra charge) — use to cut heavy-runtime init, minding snapshot uniqueness (randomness, connections). (DVA-C02)
Q9. Why can an SQS-triggered function process the same message multiple times, and how do you prevent duplicates?
Visibility timeout too low (< 6× function timeout) makes a message reappear mid-processing; and without ReportBatchItemFailures, one failure reprocesses the whole batch. Fix both, and make handlers idempotent — SQS standard is at-least-once by design. (DVA-C02, SAA-C03)
Q10. Runtime.ImportModuleError vs an unhandled exception — which phase, and what does each imply?
ImportModuleError is an Init failure (the runtime couldn’t load your module — missing dep, wrong arch, bad handler path) and fails every invoke identically. An unhandled exception is an Invoke failure in your handler logic. The phase tells you where to look. (DVA-C02)
Q11. A function scaled out and took down its RDS database. What happened and how do you prevent it?
Each concurrent environment opened its own connection; hundreds of concurrent invokes exhausted the DB’s max_connections. Prevent with reserved concurrency to cap the fan-out, RDS Proxy to pool connections, and connection reuse across warm invokes. (SAA-C03, DVA-C02)
Q12. Which metrics would you alarm on for a production event-driven function, beyond Errors?
Throttles (concurrency), DeadLetterErrors/AsyncEventsDropped (silent loss), IteratorAge (stuck shard), Duration p99 (timeout risk), and ProvisionedConcurrencySpilloverInvocations (cold spillover). Each maps to a distinct failure class. (SOA-C02)
Quick check
- Which lifecycle phase does
Runtime.ImportModuleErroroccur in, and why does that mean it fails every invoke? - Your async function shows
Errors > 0and customers report missing side effects, but nothing is in any queue. What single metric confirms the cause, and what’s the fix? - What is the one ESM setting that stops a single bad SQS message from causing the other nine in its batch to reprocess?
- A VPC Lambda times out on an internet call with no error string beyond the timeout. What’s the root cause and the two possible fixes?
Throttles > 0butErrorsis flat. Is this a code problem? What do you change?
Answers
- Init. The runtime can’t load your module (missing dependency, wrong architecture, wrong handler path), so it fails identically on every cold environment before your handler ever runs.
AsyncEventsDropped > 0confirms Lambda retried twice and dropped the event because no on-failure destination/DLQ was attached. Fix: attach an on-failure destination and make the handler idempotent for redrive.ReportBatchItemFailures(partial batch response) — return only the failed message IDs inbatchItemFailuresso the successful ones checkpoint and aren’t reprocessed.- No route to the internet — a VPC function with no NAT gateway (Lambda ENIs get no public IP). Fix: add a NAT gateway for internet egress, or VPC endpoints for AWS-service targets. Confirm by running the same code outside the VPC.
- No — it’s a concurrency problem, not code.
Throttlesare rejections at the concurrency gate. Raise account or reserved concurrency (or reduce demand / add back-pressure); changing handler code does nothing.
Glossary
| Term | Definition |
|---|---|
| Execution environment | The Firecracker micro-VM Lambda creates, reuses, freezes and destroys to run your function. |
| Init Duration | The cold-start time to download the package, bootstrap the runtime, and run module-level code; shown in the REPORT line. |
| Cold start | The latency of initializing a new execution environment before the handler runs. |
| Provisioned concurrency | Pre-initialized environments kept warm to eliminate cold starts on a known baseline; billed hourly. |
| SnapStart | A snapshot/restore of the initialized environment that slashes init time for Java, Python and .NET at no extra charge. |
| Invocation model | Synchronous, asynchronous, or poll-based (event-source mapping) — each with distinct retry, ordering and failure behaviour. |
| Event-source mapping (ESM) | The Lambda-managed poller that reads batches from SQS/Kinesis/DynamoDB Streams and invokes the function. |
| Partial batch response | Returning only failed record IDs (ReportBatchItemFailures) so successful records in a batch are checkpointed. |
| Poison record | A record that fails on every retry; on streams it blocks the shard until it ages out. |
| IteratorAge | The age of the oldest unprocessed record on a stream shard; rising = a stuck or lagging consumer. |
| On-failure destination | An SQS/SNS/EventBridge/Lambda target that captures async or stream records after retries are exhausted. |
| DLQ (dead-letter queue) | The older mechanism for capturing failed async events; destinations are the richer successor. |
| Reserved concurrency | A per-function guarantee and cap on concurrent executions; 0 acts as a kill switch. |
| Throttle (429) | A TooManyRequestsException from the concurrency gate; counted in Throttles, not Errors. |
Ephemeral storage (/tmp) |
Per-environment scratch disk, 512 MB by default, configurable to 10,240 MB. |
Next steps
- Tune the levers this article treats as fixes — memory, timeout and concurrency — methodically in Lambda Memory, Timeout & Concurrency Tuning.
- If you’re newer to the service, build and deploy from scratch in Your First Lambda Function, Hands-On.
- Design the triggers and delivery contracts correctly up front in AWS Lambda Patterns: Event-Driven Functions That Scale to Zero.
- Wire the queues and buses that feed these functions in Event-Driven Architecture with EventBridge, SQS & Lambda.
- Revisit whether a function is even the right compute in Compute on AWS: EC2 vs Lambda vs ECS vs EKS, and compare front doors in ALB vs NLB vs API Gateway, Compared.