A team ran an image-processing Lambda at 128 MB because “128 is the cheapest, right?” Each invoke took 9 seconds, they processed two million images a month, and the bill was uncomfortable. An architect changed one number — memory from 128 MB to 1,536 MB — and the function finished in 1.1 seconds. The bill went down by roughly a third, the p99 fell off a cliff, and nothing else changed. That is the single most counter-intuitive fact about AWS Lambda: because CPU is allocated in proportion to memory, buying more memory often makes a function both faster and cheaper. Most Lambda bills are too high and most Lambda latencies are too high for the same reason — the memory slider is parked on the wrong number.
This is the reference for turning the three tuning knobs that decide Lambda’s cost and speed: memory (which secretly controls CPU and network), timeout (the wall-clock ceiling on a single invocation), and concurrency (how many copies run at once, and whether they are pre-warmed, capped, guaranteed, or throttled). Get memory right and you ride the bottom of a cost/latency curve instead of the wrong side of it. Get timeout right and a stuck downstream fails fast instead of burning fifteen minutes of billed time. Get concurrency right and you neither throttle your own users with a 429 nor let one function stampede an RDS instance into the ground.
By the end you will stop guessing. You will know that 1,769 MB buys exactly one vCPU, that the account default is 1,000 concurrent executions and how to raise it, why provisioned concurrency kills cold starts but shows up on the bill whether it runs or not, and how to run the Lambda Power Tuning state machine to find the sweet spot instead of arguing about it. Every lever comes with the exact aws CLI command, the matching Terraform, the real limit, the metric that proves it, and the failure it prevents. Read the prose once; keep the tables open the next time a function is slow, throttled, or too expensive.
What problem this solves
Lambda hides its performance model behind a single slider labelled “Memory,” and that hiding is where the money leaks. New users reason “smaller memory = cheaper,” park the function at 128 MB, and unknowingly starve it of CPU — so it runs many times longer, and since you pay for memory × time, the “cheap” setting is frequently the expensive one while also being the slowest. Others do the opposite: crank memory to 3 GB for a function that spends 95% of its time waiting on a network call, and pay triple for zero speed-up because the work was never CPU-bound. Neither camp measured; both are on the wrong side of the curve.
The concurrency side breaks differently and more dramatically. A function with no concurrency controls will scale out to the account limit and open a thousand simultaneous connections to a database that allows a hundred — taking the database, and every other service that shares it, down with it. Meanwhile a function that genuinely needs to burst gets throttled with TooManyRequestsException the moment it crosses a limit nobody knew existed, and the errors look like the function’s fault when they are really a quota. And latency-sensitive APIs get intermittently slow cold starts that no amount of memory fixes, because the fix is a different lever entirely — provisioned concurrency or SnapStart.
Who hits this: everyone past “hello world.” It bites hardest on cost-optimisation reviews (memory is the highest-leverage line item and almost always mis-set), on latency-sensitive synchronous APIs behind API Gateway (cold starts and the 29-second ceiling), on high-throughput event pipelines (concurrency, burst, throttling), and on any function fronting a fragile downstream (reserved concurrency is the seatbelt). The fix is never vibes — it is: measure the memory curve, match the timeout to the p99, and set concurrency deliberately per function. This article is how.
Learning objectives
By the end of this article you can:
- Explain the memory → CPU → network coupling precisely (1,769 MB ≈ 1 vCPU, ~6 vCPUs at 10 GB) and predict when raising memory makes a function cheaper, not just faster.
- Run the Lambda Power Tuning state machine across memory sizes, read the cost/latency curve, and pick the sweet spot with the
cost,speed, orbalancedstrategy. - Set a timeout that matches your p99 plus downstream budget, and know why a synchronous API-Gateway path is really capped at 29 seconds regardless of the function’s timeout.
- Distinguish concurrent executions, the account limit, reserved concurrency (guarantee and cap), provisioned concurrency (pre-warmed), the burst/scaling rate, and unreserved pool — and configure each in
awsCLI and Terraform. - Diagnose and clear throttling (
TooManyRequestsException/ 429, theThrottlesmetric) by raising the right quota or reservation. - Kill cold starts with provisioned concurrency + Application Auto Scaling or with SnapStart, and measure the drop.
- Size ephemeral
/tmp(512 MB–10 GB) and the cost model (GB-seconds + requests) with worked INR/USD math, and cut ~20% with Graviton/arm64. - Run a symptom → root cause → confirm → fix playbook for the dozen ways Lambda tuning goes wrong in production.
Prerequisites & where this fits
You should be able to deploy a basic Lambda function and read its CloudWatch logs. If you have never shipped one, start with Your First AWS Lambda Function, Hands-On and come back. You should know what an IAM execution role is, be comfortable running aws from a shell and reading JSON, and be able to read a Terraform resource block. Knowing HTTP status codes and the words p50/p99, cold start, and idempotent helps.
This sits in the Serverless track as the optimisation layer. It assumes the design fundamentals from AWS Lambda Patterns: Event-Driven Functions That Scale to Zero — the four invocation models, DLQs, idempotency — because how a function is invoked changes how throttling and timeouts behave. It pairs with Lambda Errors, Timeouts & Cold Starts: A Troubleshooting Playbook (the failure-first companion to this cost-and-speed-first article), with Packaging Lambda: Layers & Dependencies (package size drives cold-start init time, one of the levers here), and with AWS Service Quotas & Requesting a Limit Increase (the concurrency limit is the quota you will most often raise).
When a Lambda is slow, expensive, or throttled, the answer lives in one of four places. Know which before you touch a knob:
| Symptom surfaces as… | The lever that owns it | Where you confirm it | Where you change it |
|---|---|---|---|
| Function is slow, CPU-pegged | Memory (→ vCPU) | Duration metric, Power Tuning curve |
--memory-size |
| Bill is higher than expected | Memory × duration, architecture | Cost Explorer, GB-seconds | --memory-size, --architectures |
| Invocation killed mid-run | Timeout | Task timed out after N.NN seconds in logs |
--timeout |
| Clients get 429 / errors under load | Concurrency (account/reserved) | Throttles, ConcurrentExecutions |
quota, put-function-concurrency |
| First request after idle is slow | Cold start | Init Duration in REPORT log line |
provisioned concurrency / SnapStart |
| Downstream DB falls over under Lambda load | Reserved concurrency | downstream connection count | put-function-concurrency |
No space left on device |
Ephemeral /tmp |
error string in logs | --ephemeral-storage |
Core concepts
Lambda’s cost and performance are governed by a small number of independent knobs that interact in ways that surprise people. The mental model you need is: one memory slider silently sets CPU, network, and cost; one timeout sets the wall-clock ceiling; and a small family of concurrency controls decides how many environments run, how fast they appear, and when they get rejected. Everything else is detail on top of those three.
Here is the full set of knobs, what each one really controls, its default, and the one thing people get wrong about it:
| Knob | What it actually controls | Range | Default | The trap |
|---|---|---|---|---|
| Memory | RAM and vCPU and network bandwidth, proportionally | 128 MB – 10,240 MB | 128 MB | “Small = cheap” — often false for CPU-bound work |
| Timeout | Max wall-clock per invocation | 1 s – 900 s (15 min) | 3 s | Too high hides hangs; sync API is really capped at 29 s |
Ephemeral /tmp |
Scratch disk in the environment | 512 MB – 10,240 MB | 512 MB | Reused across warm invokes; fills up if you don’t clean it |
| Reserved concurrency | Guarantees and caps a function’s max in-flight | 0 – account limit | unset (uses shared pool) | It also caps — set too low and you throttle yourself |
| Provisioned concurrency | Count of pre-initialised, warm environments | 0 – reserved/account cap | 0 | You pay for it while allocated, running or not |
| Account concurrency limit | Ceiling on all in-flight invokes in the Region | 1,000 default (raiseable) | 1,000 | Soft limit; raise via Service Quotas, not a ticket-less magic |
| Architecture | x86_64 vs arm64 (Graviton2) | one of two | x86_64 | arm64 is ~20% cheaper and often faster — but rebuild native deps |
| SnapStart | Restore from a snapshot to skip init | On/Off per version | Off | Java-first; connections & randomness need runtime hooks |
Concurrency deserves its own definition because the word is overloaded. A concurrent execution is a single invocation that is currently in flight — has started but not yet returned. It is not requests per second; it is requests-in-flight at one instant. By Little’s Law, concurrency ≈ invocation_rate × average_duration. A function called 100 times per second where each call takes 200 ms needs 100 × 0.2 = 20 concurrent executions. Halve the duration (by tuning memory!) and you halve the concurrency you consume — which is a second, hidden way that memory tuning saves money and dodges throttling.
The execution environment is the micro-VM (Firecracker) that runs your handler. Creating one from cold is the cold start: download/unpack the code, start the runtime, run your init code (imports, SDK clients, DB connections) — the Init Duration you see in the REPORT log line. A warm environment skips all of that. Lambda reuses warm environments for subsequent invokes and only cold-starts a new one when it needs more concurrency than it currently has warm. That single sentence explains why cold starts cluster at scale-up and why pre-warming (provisioned concurrency) is the fix.
Memory is the master dial (it sets your CPU)
The most important sentence in this article: on Lambda, you do not set CPU directly — you set memory, and CPU is allocated in proportion to it. At 1,769 MB you get the equivalent of one full vCPU. Below that you get a fraction of a vCPU; above it you get more than one, scaling linearly up to roughly 6 vCPUs at 10,240 MB. Network bandwidth and the share of disk I/O scale on the same curve. This is why a “128 MB” function feels glacial: it has about 7% of a single core.
The memory → vCPU map
Approximate vCPU allocation at representative memory sizes (Lambda interpolates continuously; these are anchor points):
| Memory (MB) | Approx. vCPUs | What that means | Good for |
|---|---|---|---|
| 128 | ~0.07 | A sliver of one core | Trivial glue, cost-floor demos |
| 256 | ~0.14 | Still sub-core | Tiny event handlers |
| 512 | ~0.29 | ~¼ core | Light JSON transforms |
| 1,024 | ~0.58 | Just over ½ core | Typical I/O-bound API |
| 1,536 | ~0.87 | Nearly a full core | Moderate CPU + I/O |
| 1,769 | 1.00 | Exactly one vCPU | The single-thread inflection point |
| 3,008 | ~1.70 | Almost two cores | Multi-thread starts to pay |
| 3,538 | ~2.00 | Two full vCPUs | Parallel CPU work |
| 5,308 | ~3.00 | Three vCPUs | Heavy transcode/compress |
| 7,076 | ~4.00 | Four vCPUs | Batch numeric work |
| 8,846 | ~5.00 | Five vCPUs | Large parallel jobs |
| 10,240 | ~5.79 (≈6) | The ceiling | Max single-invoke horsepower |
Two consequences follow immediately. First, single-threaded code cannot use more than one vCPU, so past ~1,769 MB a single-threaded function gets no faster — you are paying for cores it cannot touch. Second, multi-threaded / multi-process code (a Go binary, sharp/ffmpeg, a thread pool, multiprocessing) keeps speeding up past 1,769 MB because it can spread across the extra cores. Knowing which camp your function is in tells you whether the curve keeps dropping or flattens at 1,769 MB.
What scales with memory (and what doesn’t)
| Resource | Scales with memory? | Notes |
|---|---|---|
| vCPU | Yes, linearly | 1,769 MB = 1 vCPU; ~6 vCPU at 10 GB |
| Network bandwidth | Yes | More memory = more throughput to S3/DynamoDB/etc. |
Disk (/tmp) throughput |
Yes | Higher memory tiers get faster scratch I/O |
| RAM available to code | Yes (it is the setting) | OOM kill if you exceed it |
Ephemeral /tmp size |
No — separate knob | 512 MB default, set independently |
| Timeout | No — separate knob | Wall-clock ceiling, unrelated to memory |
| Concurrency | No — separate knob | But faster duration lowers concurrency used |
Memory setting matrix
| Setting | Values | Default | When to change | Trade-off | Limit / gotcha |
|---|---|---|---|---|---|
MemorySize |
128–10,240 MB, 1-MB steps | 128 MB | Almost always — 128 is rarely optimal | More memory = more $/ms but often less total $ | Single-thread flat past 1,769 MB |
| Below 1,769 MB | fractional vCPU | — | Only for truly idle/glue work | CPU-starved, high latency | Multi-thread code can’t use threads at all |
| At 1,769 MB | exactly 1 vCPU | — | Default target for single-threaded CPU work | Best latency at flat cost for that class | Going higher wastes money if single-threaded |
| Above 1,769 MB | >1 vCPU | — | Multi-threaded / parallel workloads | Keeps getting faster; watch cost | Needs code that actually parallelises |
| At 10,240 MB | ~6 vCPU | — | Max horsepower single invoke | Highest $/ms | Diminishing returns; consider splitting work |
Set it in either tool:
# Set memory to the one-vCPU inflection point
aws lambda update-function-configuration \
  --function-name img-thumbnailer \
  --memory-size 1769
resource "aws_lambda_function" "thumb" {
  function_name = "img-thumbnailer"
  role          = aws_iam_role.lambda.arn
  handler       = "app.handler"
  runtime       = "python3.12"
  filename      = "build/thumb.zip"
  memory_size   = 1769          # → ~1 vCPU
  timeout       = 30
  architectures = ["arm64"]     # Graviton2, ~20% cheaper
}
Why more memory can be cheaper: the power curve
Lambda bills you for GB-seconds = memory_in_GB × billed_duration_seconds. The trick is that duration is not independent of memory — for CPU-bound work, duration falls as memory rises. Whether the bill goes up or down depends on which falls faster.
Consider an illustrative single-threaded, CPU-bound function whose one-vCPU runtime is 1,000 ms. Because CPU is proportional to memory below 1,769 MB, doubling memory roughly halves duration — so GB-seconds stay flat while latency plummets. Past 1,769 MB a single thread can’t use the extra cores, so duration flattens and cost rises:
| Memory (MB) | ~vCPU | Duration (ms) | GB-seconds | $ / 1M invokes (x86) | ≈ ₹ / 1M (@₹86) |
|---|---|---|---|---|---|
| 128 | 0.07 | 13,820 | 1.728 | $28.99 | ₹2,493 |
| 256 | 0.14 | 6,910 | 1.728 | $28.99 | ₹2,493 |
| 512 | 0.29 | 3,455 | 1.728 | $28.99 | ₹2,493 |
| 1,024 | 0.58 | 1,727 | 1.727 | $28.98 | ₹2,492 |
| 1,536 | 0.87 | 1,152 | 1.728 | $28.99 | ₹2,493 |
| 1,769 | 1.00 | 1,000 | 1.728 | $28.99 | ₹2,493 |
| 3,008 | 1.70 | 980 | 2.879 | $48.19 | ₹4,144 |
| 10,240 | 5.79 | 950 | 9.500 | $158.53 | ₹13,634 |
Read that table twice. From 128 MB to 1,769 MB the cost is essentially identical — but the function went from 13.8 seconds to 1 second. Staying at 128 MB bought you nothing except a 14× slower function at the same price. And blindly cranking to 10 GB made it 5× more expensive for a 5% speed-up. The sweet spot for this workload is 1,769 MB. (Figures use the x86 rate of $0.0000166667/GB-s and exclude the flat $0.20/1M request charge; your real curve comes from measurement, below.)
Now the opposite lesson — the case where more memory is strictly cheaper, because the work is memory-bound / GC-heavy / lightly parallel and speeds up more than linearly early on:
| Config | Duration | GB-seconds | Verdict |
|---|---|---|---|
| 512 MB | 4,000 ms | 2.000 | Slow and costs more |
| 1,024 MB | 1,600 ms | 1.600 | Faster and 20% cheaper |
The shape of your curve depends entirely on what the function does:
| Workload type | Curve shape as memory rises | Right-sizing rule |
|---|---|---|
| Single-threaded CPU-bound | Latency falls to 1,769 MB, then flat; cost flat then rises | Target ~1,769 MB |
| Multi-threaded CPU-bound | Latency keeps falling past 1,769 MB; find the knee | Power-tune up to 3–10 GB |
| I/O-bound (waiting on network) | Latency barely moves; cost rises with memory | Keep memory low (512–1,024 MB) |
| Memory/GC-heavy | Latency drops sharply until GC pressure eases | Tune to the point GC stops thrashing |
| Mixed | A genuine U-shaped cost curve with a clear low point | Let Power Tuning find the minimum |
Finding the sweet spot with Lambda Power Tuning
You do not eyeball this. AWS Lambda Power Tuning (Alex Casalboni’s open-source tool, deployed from the AWS Serverless Application Repository) is a Step Functions state machine that invokes your function at each memory size you list, in parallel, measures real duration and cost, and returns the optimum plus a visualisation URL. It is the correct, repeatable way to right-size.
Deploy it once (Console → Serverless Application Repository → search “lambda-power-tuning” → Deploy), or with SAM/CLI, then start an execution with an input document:
# Kick off a tuning run across seven memory sizes, 50 invokes each, balanced strategy
aws stepfunctions start-execution \
  --state-machine-arn arn:aws:states:ap-south-1:111122223333:stateMachine:powerTuningStateMachine-abc123 \
  --input '{
    "lambdaARN": "arn:aws:lambda:ap-south-1:111122223333:function:img-thumbnailer",
    "powerValues": [128, 256, 512, 1024, 1536, 1769, 3008],
    "num": 50,
    "payload": { "key": "sample/input.jpg" },
    "parallelInvocation": true,
    "strategy": "balanced",
    "balancedWeight": 0.5
  }'
When the execution finishes, read its output — it contains power (the winning memory), cost, duration, and a stateMachine.visualization URL that renders the cost-and-latency-vs-memory chart:
aws stepfunctions describe-execution \
  --execution-arn <execution-arn> \
  --query 'output' --output text | python3 -m json.tool
# → { "power": 1769, "cost": 2.9e-08, "duration": 1002, "stateMachine": { "visualization": "https://..." } }
Power Tuning input parameters
| Parameter | Meaning | Typical value | Notes |
|---|---|---|---|
lambdaARN |
Function (or alias/version) to tune | your ARN | Tune the version you’ll ship |
powerValues |
Memory sizes to test | [128,512,1024,1769,3008] |
Or "ALL" for every 64-MB step |
num |
Invocations per power value | 50–100 | Higher = steadier averages, more cost |
payload |
Event passed to each invoke | realistic sample | Use payloadS3 for large payloads |
parallelInvocation |
Run the num invokes in parallel |
true |
Faster; false for rate-limited downstreams |
strategy |
Optimise for cost, speed, or balanced |
balanced |
See table below |
balancedWeight |
0 = speed, 1 = cost | 0.5 |
Only for balanced |
autoOptimize |
Apply the winning memory automatically | false |
true sets it for you |
dryRun |
Invoke once per power, don’t average | false |
Quick sanity check |
discardTopBottom |
Trim outlier timings | 0.2 |
Drops slowest/fastest 20% |
Power Tuning strategies
| Strategy | Optimises for | Picks the memory with… | Use when |
|---|---|---|---|
cost |
Cheapest GB-seconds | Lowest cost per invoke | Batch/async, latency doesn’t matter |
speed |
Lowest latency | Fastest average duration | User-facing, cost secondary |
balanced |
Weighted blend | Best balancedWeight trade-off |
Most real functions |
The visualization typically shows a latency curve that falls then flattens and a cost curve that is flat then rises — the memory where they cross (or where balanced score minimises) is your answer. Re-run it whenever the code, dependencies, or payload profile changes materially; the sweet spot moves.
Timeout: match the p99, respect the 29-second ceiling
Timeout is the wall-clock limit on a single invocation, from 1 second to 900 seconds (15 minutes), defaulting to a stingy 3 seconds. When it fires, Lambda kills the invocation and logs Task timed out after N.NN seconds. Two rules govern it: set it above your p99 (plus a margin) so healthy requests never trip it, but not so high that a hung downstream burns fifteen minutes of billed time and holds a concurrency slot hostage.
Timeout setting matrix
| Setting | Values | Default | When to change | Trade-off | Gotcha |
|---|---|---|---|---|---|
Timeout |
1–900 s | 3 s | Whenever p99 + downstream > 3 s | Higher masks hangs & costs more on stuck runs | Sync API path capped at 29 s regardless |
| Rule of thumb | ~p99 × 1.5 + downstream budget | — | Per function | Too tight → false timeouts on healthy tail | Watch retries: async re-invokes on timeout |
| Max (900 s) | 15 min | — | Long batch/ETL | One stuck run = 15 min billed | Not for anything user-facing |
Set it in both tools:
aws lambda update-function-configuration \
  --function-name order-processor \
  --timeout 30
resource "aws_lambda_function" "order" {
  # ...
  timeout = 30   # seconds; must exceed your p99 + downstream latency
}
The synchronous ceiling everyone forgets
If clients reach your function synchronously through API Gateway, the function’s timeout is not the real limit — the integration timeout is. A function set to 900 s behind a REST API still gets its response cut off at the integration timeout, historically a hard 29 seconds (now raiseable for REST APIs via a Service Quota request, but 29 s by default; HTTP APIs cap at 30 s and are not raiseable). If your synchronous work can exceed ~29 s, the architecture is wrong: switch to an asynchronous pattern (return 202 Accepted + a job id, do the work in the background, deliver via webhook/poll/WebSocket).
Match the timeout to the caller and downstream
| Invocation path | Effective ceiling | Set function timeout to… |
|---|---|---|
| API Gateway (REST) sync | 29 s (raiseable) | ≤ 29 s; go async beyond |
| API Gateway (HTTP API) sync | 30 s (fixed) | ≤ 30 s; go async beyond |
| Application Load Balancer target | ALB idle timeout (default 60 s) | ≤ ALB idle timeout |
| Function URL (buffered) | 15 min | up to 900 s |
| SQS event source | function timeout ≤ queue visibility timeout | visibility ≥ 6× function timeout |
| Step Functions task | state/TimeoutSeconds |
≤ state timeout |
| Async invoke (S3/SNS/EventBridge) | 15 min | up to 900 s; expect retries on timeout |
| Kinesis/DynamoDB Streams poll | 15 min | up to 900 s; a poison record blocks the shard |
The concurrency model, end to end
Concurrency is where most production Lambda incidents live. There are five distinct concepts, and confusing them is the root of most 429s and stampedes.
| Term | What it is | Who sets it | Costs extra? |
|---|---|---|---|
| Concurrent executions | Invocations in flight right now | Emergent (rate × duration) |
No (you pay per invoke) |
| Account concurrency limit | Ceiling on all in-flight invokes in a Region | AWS default 1,000; you raise it | No |
| Unreserved concurrency | The shared pool for functions with no reservation | account limit − Σ reserved |
No |
| Reserved concurrency | A carve-out that guarantees and caps one function | You, per function | No |
| Provisioned concurrency | Pre-initialised warm environments | You, per version/alias | Yes — paid while allocated |
Concurrent executions and Little’s Law
Because concurrency is rate × duration, you can compute it — and see immediately how memory tuning reduces it:
| Invocation rate | Avg duration | Concurrency needed | If you halve duration (tune memory) |
|---|---|---|---|
| 10 /s | 100 ms | 1 | 0.5 → rounds to 1 |
| 100 /s | 200 ms | 20 | 10 |
| 500 /s | 1 s | 500 | 250 |
| 1,000 /s | 2 s | 2,000 | 1,000 |
| 2,000 /s | 500 ms | 1,000 | 500 |
| 5,000 /s | 1 s | 5,000 | 2,500 |
Note how the 1,000/s × 2 s row needs 2,000 concurrent executions — double the account default — so it will throttle until you either raise the quota or cut the duration. Tuning memory to halve the duration brings it back under 1,000. Concurrency and cost tuning are the same lever viewed twice.
The account limit and unreserved pool
Every Region starts with an account concurrency limit of 1,000 (a soft limit — raise it via Service Quotas). AWS also forces you to keep at least 100 unreserved concurrency available, so you can never reserve away the entire pool. Inspect it:
aws lambda get-account-settings \
  --query 'AccountLimit.{Concurrent:ConcurrentExecutions,Unreserved:UnreservedConcurrentExecutions}'
# → { "Concurrent": 1000, "Unreserved": 900 }
Raise it through Service Quotas (the quota code for “Concurrent executions” is L-B99A9384):
# Check current, then request an increase
aws service-quotas get-service-quota \
  --service-code lambda --quota-code L-B99A9384 \
  --query 'Quota.Value'

aws service-quotas request-service-quota-increase \
  --service-code lambda --quota-code L-B99A9384 \
  --desired-value 5000
resource "aws_servicequotas_service_quota" "lambda_concurrency" {
  service_code = "lambda"
  quota_code   = "L-B99A9384"   # Concurrent executions
  value        = 5000
}
For the full mechanics of quota increases — auto-approval vs a Support case, tracking the request — see AWS Service Quotas & Requesting a Limit Increase.
Reserved concurrency — the seatbelt that also brakes
Reserved concurrency carves a slice of the account pool for one function. It does two things at once, and forgetting the second is a classic outage:
- It guarantees the function can always reach that many concurrent executions (nobody else can eat its slice).
- It caps the function at exactly that many — invokes beyond it are throttled.
| Reserved value | Behaviour | Use it to… |
|---|---|---|
| Unset (default) | Draws from the shared unreserved pool | Let a function scale with everyone else |
| N > 0 | Guaranteed up to N; throttled past N | Protect a fragile downstream (cap) or a critical function (guarantee) |
| 0 | Function fully disabled — every invoke throttled | Emergency stop / feature-flag off a function |
The canonical use: a function writes to an RDS instance that tolerates 100 connections. Left uncapped, Lambda will open a thousand and topple the database. Cap it:
# Protect the database: never more than 40 concurrent writers
aws lambda put-function-concurrency \
  --function-name db-writer \
  --reserved-concurrent-executions 40

aws lambda get-function-concurrency --function-name db-writer
# → { "ReservedConcurrentExecutions": 40 }
resource "aws_lambda_function" "db_writer" {
  # ...
  reserved_concurrent_executions = 40   # guarantee AND cap
}
The warning label: reserving 40 for db-writer removes 40 from the unreserved pool that every other function shares. Over-reserve across many functions and you starve the rest into 429s while the account still shows spare capacity. Reserved is a zero-sum budget — allocate it deliberately.
Provisioned concurrency — pre-warmed, and it shows on the bill
Provisioned concurrency (PC) keeps a set number of execution environments fully initialised and warm — code downloaded, runtime started, init code run — so matching invokes have no cold start. You configure it on a published version or alias, not $LATEST. The catch: you pay for the provisioned amount the entire time it is allocated, whether it runs or not, at a separate PC price plus a reduced duration rate.
| Concept | Detail |
|---|---|
| Target | A version or alias (never $LATEST) |
| State | IN_PROGRESS → READY (or FAILED) while environments warm up |
| Cold starts | Eliminated up to the provisioned count; excess “spills over” to on-demand (cold) |
| Cost | Paid per GB-second allocated + lower duration rate for PC invokes |
| Scaling | Static number, or Application Auto Scaling (target-tracking / scheduled) |
| Metric | ProvisionedConcurrencyUtilization, ...SpilloverInvocations, ...Invocations |
# Publish a version, alias it, and pre-warm 5 environments on the alias
aws lambda publish-version --function-name checkout-api
aws lambda create-alias --function-name checkout-api \
  --name prod --function-version 7
aws lambda put-provisioned-concurrency-config \
  --function-name checkout-api --qualifier prod \
  --provisioned-concurrent-executions 5

aws lambda get-provisioned-concurrency-config \
  --function-name checkout-api --qualifier prod \
  --query '{Status:Status,Requested:RequestedProvisionedConcurrentExecutions,Available:AvailableProvisionedConcurrentExecutions}'
# → { "Status": "READY", "Requested": 5, "Available": 5 }
resource "aws_lambda_alias" "prod" {
  name             = "prod"
  function_name    = aws_lambda_function.checkout.function_name
  function_version = aws_lambda_function.checkout.version
}

resource "aws_lambda_provisioned_concurrency_config" "prod" {
  function_name                     = aws_lambda_function.checkout.function_name
  qualifier                         = aws_lambda_alias.prod.name
  provisioned_concurrent_executions = 5
}
Auto-scaling provisioned concurrency
Static PC either wastes money off-peak or spills over at peak. Application Auto Scaling fixes both: track LambdaProvisionedConcurrencyUtilization and let it grow/shrink, and/or schedule capacity around known peaks.
| Mode | Mechanism | Best for |
|---|---|---|
| Target tracking | Keep utilization at a target (e.g. 0.7) | Variable but continuous traffic |
| Scheduled | Set min/max on a cron | Predictable diurnal peaks (business hours) |
| Static | Fixed number | Steady load, or a known concurrency floor |
# Register the alias as a scalable target, then target-track utilization at 70%
aws application-autoscaling register-scalable-target \
  --service-namespace lambda \
  --resource-id function:checkout-api:prod \
  --scalable-dimension lambda:function:ProvisionedConcurrency \
  --min-capacity 2 --max-capacity 20

aws application-autoscaling put-scaling-policy \
  --service-namespace lambda \
  --resource-id function:checkout-api:prod \
  --scalable-dimension lambda:function:ProvisionedConcurrency \
  --policy-name pc-target-70 \
  --policy-type TargetTrackingScaling \
  --target-tracking-scaling-policy-configuration '{
    "TargetValue": 0.7,
    "PredefinedMetricSpecification": {
      "PredefinedMetricType": "LambdaProvisionedConcurrencyUtilization"
    }
  }'
resource "aws_appautoscaling_target" "pc" {
  service_namespace  = "lambda"
  resource_id        = "function:checkout-api:prod"
  scalable_dimension = "lambda:function:ProvisionedConcurrency"
  min_capacity       = 2
  max_capacity       = 20
}

resource "aws_appautoscaling_policy" "pc" {
  name               = "pc-target-70"
  service_namespace  = aws_appautoscaling_target.pc.service_namespace
  resource_id        = aws_appautoscaling_target.pc.resource_id
  scalable_dimension = aws_appautoscaling_target.pc.scalable_dimension
  policy_type        = "TargetTrackingScaling"

  target_tracking_scaling_policy_configuration {
    target_value = 0.7
    predefined_metric_specification {
      predefined_metric_type = "LambdaProvisionedConcurrencyUtilization"
    }
  }
}
Burst and the scaling rate
Warm environments don’t appear instantly. When demand exceeds current warm capacity, Lambda scales each function by up to 1,000 concurrent executions every 10 seconds (the modern per-function model that replaced the older account-wide burst pool), until it reaches the function’s cap or the account limit. So a sudden spike to 5,000 concurrency from cold ramps over ~40–50 seconds, cold-starting along the way — which is exactly when p99 spikes and why provisioned concurrency exists for latency-critical paths.
| Aspect | Value | Implication |
|---|---|---|
| Per-function scale rate | +1,000 concurrency / 10 s | A 5,000 spike from cold takes ~40–50 s to fully warm |
| Ceiling | Function cap or account limit | Whichever is lower stops the ramp |
| During ramp | New environments cold-start | p99 spikes on scale-up |
| Fix for latency | Provisioned concurrency | Pre-warm so the ramp is invisible |
Throttling behaviour by invocation type
When you hit a cap (account or reserved), what happens depends on how the function was invoked:
| Invocation type | On throttle | Retries? | You’ll see |
|---|---|---|---|
| Synchronous (API GW, SDK, ALB) | Rejected immediately | No (caller must retry) | HTTP 429 TooManyRequestsException |
| Asynchronous (S3, SNS, EventBridge) | Internally queued & retried | Yes, up to ~6 h with backoff | Delayed processing; Throttles > 0 |
| Stream poll (Kinesis/DDB Streams) | Poller backs off & retries | Yes, until record expires | Iterator age climbs |
| Queue poll (SQS) | Message returns after visibility timeout | Yes (at-least-once) | Growing ApproximateAgeOfOldestMessage |
The metric to alarm on is Throttles. Any sustained non-zero value on a synchronous function means users are getting 429s.
# Alarm when the function is throttled at all over 5 minutes
aws cloudwatch put-metric-alarm \
  --alarm-name checkout-throttles \
  --namespace AWS/Lambda --metric-name Throttles \
  --dimensions Name=FunctionName,Value=checkout-api \
  --statistic Sum --period 300 --evaluation-periods 1 \
  --threshold 1 --comparison-operator GreaterThanOrEqualToThreshold
resource "aws_cloudwatch_metric_alarm" "throttles" {
  alarm_name          = "checkout-throttles"
  namespace           = "AWS/Lambda"
  metric_name         = "Throttles"
  dimensions          = { FunctionName = "checkout-api" }
  statistic           = "Sum"
  period              = 300
  evaluation_periods  = 1
  threshold           = 1
  comparison_operator = "GreaterThanOrEqualToThreshold"
}
Limits, quotas, and the metrics that prove them
You cannot tune what you cannot see. These are the hard numbers and the CloudWatch metrics that expose them.
Lambda limits & quotas
| Limit | Value | Adjustable? | Notes |
|---|---|---|---|
| Memory | 128 MB – 10,240 MB | No (hard range) | 1-MB increments |
| Timeout | 1 s – 900 s | No (hard range) | Default 3 s |
Ephemeral /tmp |
512 MB – 10,240 MB | No (hard range) | Default 512 MB |
| Account concurrency | 1,000 default | Yes (Service Quotas) | Quota L-B99A9384 |
| Minimum unreserved | 100 | No | Always kept available |
| Per-function scale rate | +1,000 / 10 s | No | Modern per-function model |
| Deployment package (zipped, direct) | 50 MB | No | 250 MB unzipped |
| Deployment package (via S3) | 250 MB unzipped | No | Layers count toward 250 MB |
| Container image | 10 GB | No | Larger cold-start surface |
| Sync payload (request + response) | 6 MB | No | Buffered invoke |
| Async payload | 256 KB | No | S3/SNS/EventBridge events |
| Function/version storage | 75 GB (default) | Yes | Sum of all code + layers |
| Environment variables | 4 KB total | No | Per function |
| Layers per function | 5 | No | Also within 250 MB unzip |
/tmp billed above |
512 MB | — | Extra GB-s charge past the free 512 MB |
CloudWatch metrics for tuning
| Metric | Namespace AWS/Lambda |
Tells you | Alarm when |
|---|---|---|---|
Duration |
per function | Execution time (p50/p99) | p99 near timeout |
Errors |
per function | Failed invokes | > 0 sustained |
Throttles |
per function | Invokes rejected by a cap | ≥ 1 (sync) |
ConcurrentExecutions |
per function/account | In-flight now | Approaching limit |
UnreservedConcurrentExecutions |
account | Shared pool in use | Near account limit |
ProvisionedConcurrencyUtilization |
per version/alias | Fraction of PC in use | > 0.9 (scale up) or ~0 (waste) |
ProvisionedConcurrencyInvocations |
per version/alias | Invokes served warm by PC | context for cost |
ProvisionedConcurrencySpilloverInvocations |
per version/alias | Invokes that spilled to cold | > 0 (raise PC) |
Init Duration (in REPORT log) |
per cold start | Cold-start init cost | high → SnapStart/PC |
IteratorAge (streams) |
per source | Lag behind the stream head | climbing = throttled/slow |
Read the REPORT line at the end of every invoke’s log — it prints Duration, Billed Duration, Memory Size, Max Memory Used, and (on cold starts) Init Duration. If Max Memory Used hugs Memory Size, you’re near OOM; if it’s a fraction, you may be over-provisioned on RAM (but check CPU first).
Ephemeral storage (/tmp) sizing
Every environment gets a scratch disk at /tmp, 512 MB by default, configurable up to 10,240 MB. It’s the place to download an S3 object, unzip a model, or buffer a large file — but it is reused across warm invocations, so files you leave behind accumulate until an invoke fails with No space left on device. Storage above the free 512 MB is billed per GB-second.
| Setting | Values | Default | When to raise | Gotcha |
|---|---|---|---|---|
EphemeralStorage.Size |
512 – 10,240 MB | 512 MB | Large temp files, ML models, media buffers | Reused warm — clean up or it fills |
| Billing | free ≤ 512 MB, then per GB-s | — | — | Big /tmp on a hot function adds up |
aws lambda update-function-configuration \
  --function-name media-transcode \
  --ephemeral-storage '{"Size": 4096}'
resource "aws_lambda_function" "media" {
  # ...
  ephemeral_storage { size = 4096 }   # MB
}
The cost model, with worked INR/USD math
Lambda bills three things: requests, duration (GB-seconds), and — if you use it — provisioned concurrency. Everything else (logs, ephemeral storage above 512 MB) is secondary.
| Component | Price (x86, ap-south-1 ≈ us rates) | Unit | Free tier (always) |
|---|---|---|---|
| Requests | $0.20 | per 1M requests | 1M / month |
| Duration (x86) | $0.0000166667 | per GB-second | 400,000 GB-s / month |
| Duration (arm64) | $0.0000133334 | per GB-second | shared with above |
| Provisioned concurrency (x86) | ~$0.0000041667 | per GB-s allocated | — |
| PC invocation duration | ~$0.0000097222 | per GB-s (lower rate) | — |
Ephemeral /tmp > 512 MB |
~$0.0000000309 | per GB-s of extra | — |
Billed duration is rounded up to the nearest 1 ms. GB-seconds = (memory ÷ 1024) × billed_seconds.
Worked scenarios
| Scenario | Memory | Duration | Invokes/mo | GB-seconds | Duration $ | Requests $ | Total $/mo | ≈ ₹/mo (@₹86) |
|---|---|---|---|---|---|---|---|---|
| Light API | 512 MB | 120 ms | 5M | 300,000 | $0 (free tier) | $0.80 | ~$0.80 | ₹69 |
| Busy API | 1,024 MB | 90 ms | 50M | 4.39M | $73.20 | $9.80 | ~$83 | ₹7,138 |
| CPU worker (128 MB) | 128 MB | 13,820 ms | 2M | 3.46M | $57.60 | $0.20 | ~$57.80 | ₹4,971 |
| Same worker (1,769 MB) | 1,769 MB | 1,000 ms | 2M | 3.46M | $57.60 | $0.20 | ~$57.80 | ₹4,971 |
| Same worker on arm64 | 1,769 MB | 1,000 ms | 2M | 3.46M | $46.08 | $0.20 | ~$46.28 | ₹3,980 |
| + Provisioned conc. (5, 24×7) | 1,769 MB | — | — | ~22,900 PC GB-s | ~$0.10/day PC | — | +~$3/mo | ₹258 |
Two lessons jump out. The 128-MB and 1,769-MB workers cost the same — but one is 14× faster. And switching that worker to arm64 saves 20% (₹4,971 → ₹3,980) for a one-line change. Provisioned concurrency for 5 environments around the clock adds only a few dollars — cheap insurance for a latency-critical path, if you don’t over-provision.
SnapStart: cutting cold starts without paying for warm capacity
SnapStart attacks cold starts from a different angle than provisioned concurrency. Instead of keeping environments warm (and paying for them), Lambda runs your init code once, takes a Firecracker microVM snapshot of the initialised environment, and restores future cold starts from that snapshot — skipping the expensive init. For heavy runtimes (JVM) this cuts cold-start latency dramatically.
| Aspect | Detail |
|---|---|
| Runtimes | Java (Corretto 11/17/21), Python 3.12+, .NET 8+ |
| Mechanism | Snapshot after Init, restore on cold start |
| Latency cut | Up to ~10× for JVM cold starts |
| Cost | Free for Java; Python/.NET add a small caching + restore charge |
| Config | SnapStart.ApplyOn = PublishedVersions (per published version) |
| Big caveat | Snapshot freezes state: connections, random seeds, unique IDs are shared across restores |
| Fix for state | Runtime hooks (beforeCheckpoint/afterRestore, or CRaC for Java) to re-open connections / re-seed |
| Incompatibility | Cannot combine with provisioned concurrency on the same version |
aws lambda update-function-configuration \
  --function-name java-api \
  --snap-start ApplyOn=PublishedVersions
aws lambda publish-version --function-name java-api   # snapshot is taken here
resource "aws_lambda_function" "java_api" {
  # ...
  runtime = "java21"
  snap_start { apply_on = "PublishedVersions" }
}
Graviton / arm64 for price-performance
Switching a function to arm64 (AWS Graviton2) is often the highest-return single change: ~20% cheaper duration and frequently faster, for a net price-performance gain of up to ~34%. The only cost is compatibility — any native dependency (compiled .so, a wheel with C extensions, a Go/Rust binary) must be built for arm64, or you’ll get exec format error at runtime.
| Dimension | x86_64 | arm64 (Graviton2) |
|---|---|---|
| Duration price | $0.0000166667 /GB-s | $0.0000133334 /GB-s (~20% less) |
| Typical performance | baseline | equal or better on many workloads |
| Native deps | widest compatibility | must be arm64-built |
| Interpreted code (pure Python/JS) | works | works — just flip the flag |
| When to keep x86 | x86-only binaries, some legacy libs | — |
aws lambda update-function-configuration \
  --function-name pure-python-fn \
  --architectures arm64
Architecture at a glance
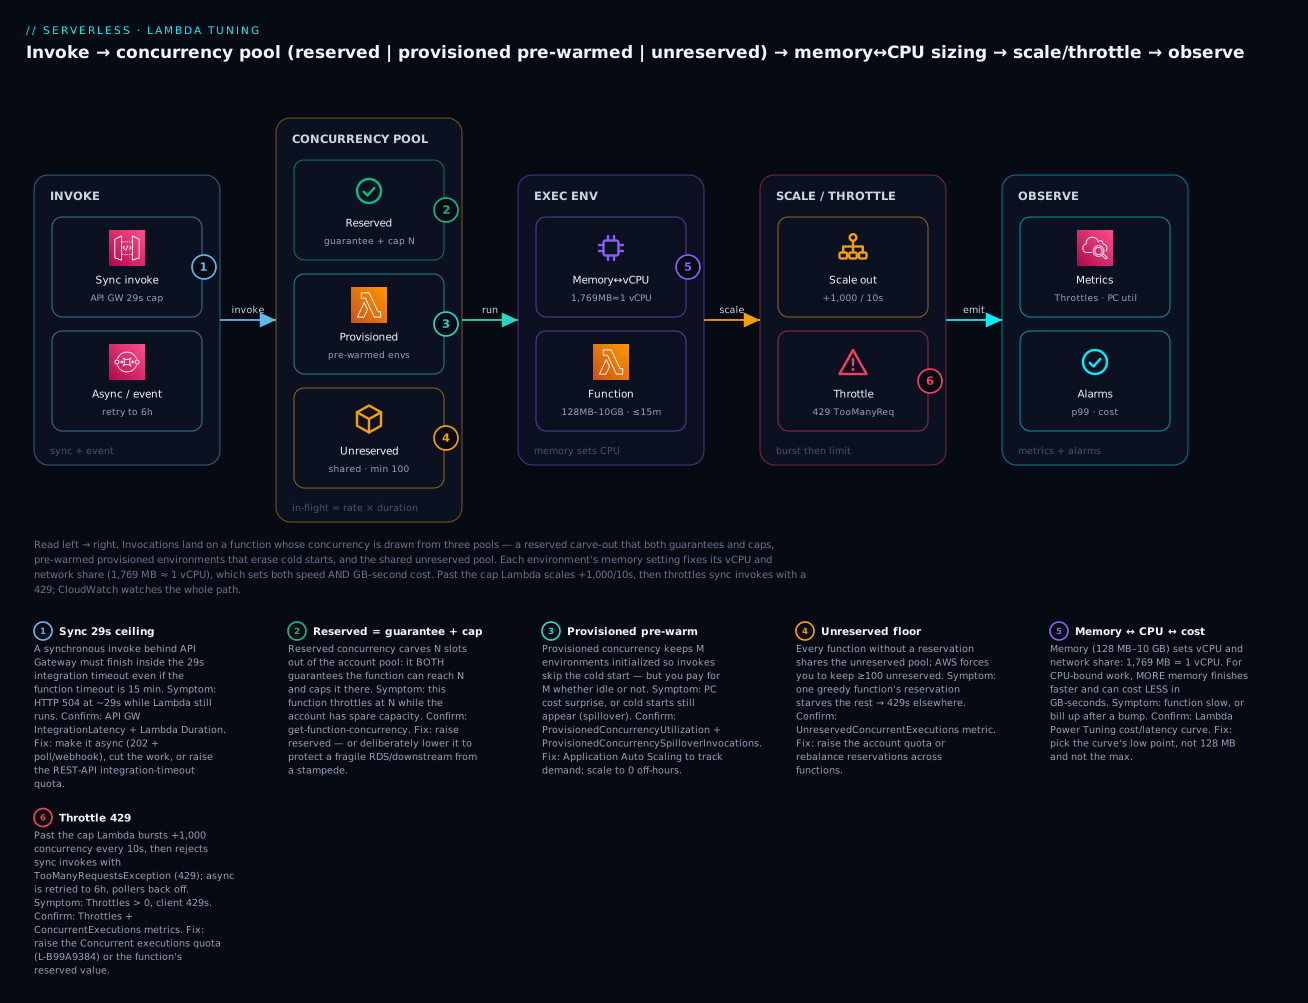
Read the diagram left → right as the life of an invocation. On the left, requests arrive synchronously (through API Gateway, bound by the 29-second integration ceiling) or as asynchronous/event invokes (retried internally for up to six hours). They land on the concurrency pool, which is three things at once: a reserved carve-out that both guarantees and caps, a set of provisioned pre-warmed environments that skip the cold start, and the shared unreserved pool (which AWS keeps ≥100 deep). Each running environment’s memory setting fixes its vCPU and network share — the 1,769 MB ≈ 1 vCPU note is the hinge of the whole cost story. When demand outruns warm capacity, Lambda scales +1,000 every 10 seconds until it hits a cap and then throttles synchronous invokes with a 429. CloudWatch watches every hop: Throttles, ConcurrentExecutions, provisioned-concurrency utilisation and spillover. The six numbered badges mark the exact points where cost and latency are won or lost — the sync ceiling, the reserved cap, the provisioned trade-off, the unreserved floor, the memory↔CPU↔cost curve, and the throttle.
Real-world scenario
FreshCart, a grocery-delivery startup in Bengaluru, ran its checkout on a single Lambda behind an API Gateway REST endpoint. It worked fine in testing and fell over on its first flash sale. Three things went wrong at once, and each maps to a lever in this article.
First, latency. The checkout function was parked at the default 128 MB because an early engineer “kept costs down.” Under the CPU work of tax and discount calculation it took 2.4 seconds per call at p50 and over 9 seconds at p99 — right at the edge of the API Gateway 29-second ceiling once a slow downstream was added. Their first instinct was to lower memory further to save money. An architect ran Lambda Power Tuning across [128, 512, 1024, 1536, 1769, 3008] with the balanced strategy; the visualisation showed cost essentially flat from 128 to 1,769 MB while latency collapsed. They set memory to 1,536 MB. p50 dropped to 210 ms, p99 to 480 ms, and the monthly duration bill didn’t move — same GB-seconds, 11× faster.
Second, cold starts. Even tuned, the first request in each scale-up wave took ~900 ms of init (a fat dependency tree). During the sale, traffic went from near-zero to ~600 requests/second in seconds, and Lambda’s +1,000/10s ramp meant a wall of cold starts hit exactly when customers were most impatient. They added provisioned concurrency on a prod alias with Application Auto Scaling target-tracking at 0.7 utilisation, min_capacity = 10, max_capacity = 200, plus a scheduled bump to 50 fifteen minutes before each advertised sale. Spillover cold starts (ProvisionedConcurrencySpilloverInvocations) fell to near zero during the ramp.
Third, the stampede. Checkout wrote to an Aurora instance sized for ~150 connections. When Lambda scaled to 600 concurrent executions, it opened 600 connections and Aurora started refusing them — turning a latency problem into an outage. The fix was a reserved concurrency cap of 120 on the writer function (leaving headroom under Aurora’s limit) plus RDS Proxy for pooling. Checkout could no longer stampede the database; excess load queued or shed cleanly with a retry-able 429 instead of taking Aurora down.
The bill after all three changes was lower than before (arm64 shaved a further 20%), the p99 was an order of magnitude better, and the next sale was a non-event. Total config change: four settings and one alias. That is the leverage in Lambda tuning — the knobs are tiny, the outcomes are not.
Advantages and disadvantages
| Advantages of active tuning | Disadvantages / costs |
|---|---|
| Right-sized memory often cuts both latency and bill | Requires measurement (Power Tuning), not a guess |
| Reserved concurrency protects fragile downstreams | Reserved is zero-sum — over-allocating starves others |
| Provisioned concurrency erases cold-start p99 spikes | PC is billed while allocated — waste if over-provisioned |
| SnapStart cuts JVM cold starts for free | Snapshot state pitfalls (connections, randomness) |
| arm64 is ~20% cheaper for a one-line change | Native deps must be rebuilt for arm64 |
| Metrics make every decision provable | More knobs = more to get wrong without discipline |
| Per-function control = per-workload optimisation | Tuning drifts as code/deps/payloads change |
The through-line: tuning is high-leverage but not free. Each control you add (reserved, provisioned, SnapStart, arm64) buys a specific improvement at a specific cost or risk, and the wins evaporate if you set-and-forget. Re-measure after material changes.
Hands-on lab
You’ll deploy a deliberately CPU-bound function at 128 MB, use Power Tuning to find its sweet spot, protect a downstream with reserved concurrency and watch throttling, then add provisioned concurrency with auto-scaling and measure the cold-start drop. Everything here is free-tier-friendly except provisioned concurrency, which costs a few cents while allocated — the teardown removes it. Region: ap-south-1 (Mumbai). Prereqs: aws CLI v2 configured, permission to manage Lambda/IAM/Step Functions/Application Auto Scaling.
Step 1 — Create an execution role
cat > trust.json <<'JSON'
{ "Version": "2012-10-17", "Statement": [
  { "Effect": "Allow", "Principal": { "Service": "lambda.amazonaws.com" },
    "Action": "sts:AssumeRole" } ] }
JSON

aws iam create-role --role-name lambda-tuning-lab \
  --assume-role-policy-document file://trust.json

aws iam attach-role-policy --role-name lambda-tuning-lab \
  --policy-arn arn:aws:iam::aws:policy/service-role/AWSLambdaBasicExecutionRole
Expected: a role ARN like arn:aws:iam::111122223333:role/lambda-tuning-lab.
Step 2 — Deploy a CPU-bound function at 128 MB
cat > app.py <<'PY'
def handler(event, context):
    # deliberately CPU-bound: sum of sqrt over a big range
    import math
    total = 0.0
    for i in range(1, 3_000_000):
        total += math.sqrt(i)
    return {"total": total}
PY
zip fn.zip app.py

aws lambda create-function --function-name tuning-lab \
  --runtime python3.12 --handler app.handler \
  --role arn:aws:iam::111122223333:role/lambda-tuning-lab \
  --zip-file fileb://fn.zip \
  --memory-size 128 --timeout 30
Invoke once and read the REPORT line for the baseline:
aws lambda invoke --function-name tuning-lab --payload '{}' out.json \
  --log-type Tail --query 'LogResult' --output text | base64 --decode | grep REPORT
# → REPORT ... Duration: 11840.21 ms  Billed Duration: 11841 ms  Memory Size: 128 MB  Max Memory Used: 42 MB
Observe: multi-second duration, but only ~42 MB of RAM used — this function is CPU-starved, not RAM-starved. The fix is more memory for CPU, not for RAM.
Step 3 — Find the sweet spot with Power Tuning
Deploy the tool from the Serverless Application Repository (Console is easiest: search lambda-power-tuning, Deploy), grab its state-machine ARN, then:
aws stepfunctions start-execution \
  --state-machine-arn arn:aws:states:ap-south-1:111122223333:stateMachine:powerTuningStateMachine-XXXX \
  --input '{"lambdaARN":"arn:aws:lambda:ap-south-1:111122223333:function:tuning-lab","powerValues":[128,512,1024,1536,1769,3008],"num":30,"payload":{},"parallelInvocation":true,"strategy":"balanced"}'

# after it finishes:
aws stepfunctions describe-execution --execution-arn <arn> \
  --query 'output' --output text | python3 -m json.tool
Expected: output naming a power around 1,769 with a visualization URL. Open it — latency falls steeply then flattens; cost is flat then climbs.
Step 4 — Apply the winning memory and re-measure
aws lambda update-function-configuration \
  --function-name tuning-lab --memory-size 1769
aws lambda wait function-updated --function-name tuning-lab

aws lambda invoke --function-name tuning-lab --payload '{}' out.json \
  --log-type Tail --query 'LogResult' --output text | base64 --decode | grep REPORT
# → REPORT ... Duration: 995.44 ms  Billed Duration: 996 ms  Memory Size: 1769 MB ...
Observe: ~12× faster, at essentially the same GB-seconds as 128 MB. That is the whole point.
Step 5 — Reserve concurrency to protect a downstream
aws lambda put-function-concurrency \
  --function-name tuning-lab --reserved-concurrent-executions 5
aws lambda get-function-concurrency --function-name tuning-lab
# → { "ReservedConcurrentExecutions": 5 }
Fire 20 concurrent invokes and watch throttling appear (the function is now capped at 5):
for i in $(seq 1 20); do
  aws lambda invoke --function-name tuning-lab --invocation-type Event \
    --payload '{}' /dev/null >/dev/null &
done; wait

aws cloudwatch get-metric-statistics --namespace AWS/Lambda \
  --metric-name Throttles --dimensions Name=FunctionName,Value=tuning-lab \
  --start-time $(date -u -v-5M +%Y-%m-%dT%H:%M:%SZ) \
  --end-time $(date -u +%Y-%m-%dT%H:%M:%SZ) \
  --period 300 --statistics Sum
# → Sum > 0  (invokes beyond 5 were throttled)
Observe: async invokes over the cap are throttled (and internally retried); a synchronous caller would get a 429.
Step 6 — Add provisioned concurrency + auto-scaling, measure the cold-start drop
⚠️ This step costs money while allocated. Publish a version, alias it, pre-warm it, and register auto-scaling:
VER=$(aws lambda publish-version --function-name tuning-lab --query Version --output text)
aws lambda create-alias --function-name tuning-lab --name prod --function-version "$VER"
aws lambda put-provisioned-concurrency-config \
  --function-name tuning-lab --qualifier prod --provisioned-concurrent-executions 2
aws lambda wait function-active --function-name tuning-lab

aws application-autoscaling register-scalable-target \
  --service-namespace lambda --resource-id function:tuning-lab:prod \
  --scalable-dimension lambda:function:ProvisionedConcurrency \
  --min-capacity 2 --max-capacity 10

aws lambda invoke --function-name tuning-lab:prod --payload '{}' out.json \
  --log-type Tail --query 'LogResult' --output text | base64 --decode | grep REPORT
# → REPORT line has NO "Init Duration" → served by a pre-warmed environment (no cold start)
Observe: invokes to the prod alias omit Init Duration — the cold start is gone.
Step 7 — Teardown (do this to stop charges)
# Remove provisioned concurrency + auto-scaling FIRST (these cost money)
aws application-autoscaling deregister-scalable-target \
  --service-namespace lambda --resource-id function:tuning-lab:prod \
  --scalable-dimension lambda:function:ProvisionedConcurrency
aws lambda delete-provisioned-concurrency-config \
  --function-name tuning-lab --qualifier prod
aws lambda delete-alias --function-name tuning-lab --name prod

# Then the function and role
aws lambda delete-function --function-name tuning-lab
aws iam detach-role-policy --role-name lambda-tuning-lab \
  --policy-arn arn:aws:iam::aws:policy/service-role/AWSLambdaBasicExecutionRole
aws iam delete-role --role-name lambda-tuning-lab
# Finally delete the Power Tuning app's CloudFormation stack in the Console.
Verify: aws lambda get-function --function-name tuning-lab returns ResourceNotFoundException.
Common mistakes & troubleshooting
The playbook. Each row is a real failure with the exact way to confirm and fix it.
| # | Symptom | Root cause | Confirm (command / console) | Fix |
|---|---|---|---|---|
| 1 | Function slow, high Duration, low Max Memory Used |
CPU-starved at low memory (fractional vCPU) | REPORT log: Max Memory Used ≪ Memory Size |
Raise --memory-size (Power Tune); target ≥1,769 MB for single-thread CPU work |
| 2 | Clients get HTTP 429 TooManyRequestsException |
Hit account or reserved concurrency cap | Throttles > 0; get-function-concurrency; get-account-settings |
Raise account quota L-B99A9384 or the reserved value |
| 3 | First request after idle is slow; p99 spikes on traffic waves | Cold starts on scale-up (+1,000/10s ramp) |
Init Duration in REPORT; ProvisionedConcurrencySpilloverInvocations |
Provisioned concurrency (+ auto-scaling) or SnapStart (JVM/Py/.NET) |
| 4 | PC bill higher than expected | Paying for provisioned envs that sit idle | ProvisionedConcurrencyUtilization ≈ 0 much of the day |
Auto-scale PC to demand; schedule to min/0 off-hours |
| 5 | Other functions suddenly throttle | One function’s reserved carve-out shrank the unreserved pool | UnreservedConcurrentExecutions near 0; sum of reservations |
Lower over-large reservations; raise account quota |
| 6 | No space left on device mid-invoke |
/tmp full (512 MB default, reused warm) |
Error string in logs; large temp files not deleted | Raise --ephemeral-storage; delete temp files each invoke |
| 7 | Task timed out after N.NN seconds |
Timeout below real p99 + downstream latency | Duration p99 near/over Timeout |
Raise --timeout to ~p99×1.5 + downstream; or fix the downstream |
| 8 | Bill went up after a memory bump | Memory-bound/IO-bound work doesn’t speed up; you pay for unused cores | Compare GB-seconds before/after; Power Tune curve | Revert to the curve’s low point; low memory for I/O-bound |
| 9 | PC set but cold starts still appear | Demand exceeds provisioned count → spillover | ProvisionedConcurrencySpilloverInvocations > 0 |
Raise PC / max_capacity; add scheduled pre-scale |
| 10 | Multi-threaded code no faster after raising memory | Below 1,769 MB there’s <1 vCPU; 2 vCPU needs ~3,538 MB | Duration flat despite more memory |
Raise memory past 1,769 MB (needs real parallelism) |
| 11 | Invoke killed, Runtime exited, Max Memory Used = Memory Size |
Out of memory (true RAM exhaustion) | REPORT: Max Memory Used == Memory Size |
Raise --memory-size; reduce in-memory data / stream it |
| 12 | API returns 504 at ~29 s though function keeps running | API Gateway 29 s integration ceiling, not the function timeout | API GW IntegrationLatency ~29,000 ms; Lambda still running |
Go async (202 + poll/webhook); or raise REST integration-timeout quota |
| 13 | PC stuck IN_PROGRESS / FAILED |
Can’t allocate — account concurrency limit reached | get-provisioned-concurrency-config Status; get-account-settings |
Raise account quota; lower requested PC |
| 14 | arm64 function crashes: exec format error |
x86 native dependency on an arm64 function | Error in logs after switching --architectures arm64 |
Rebuild native deps for arm64 (or a Lambda layer built for arm) |
| 15 | SnapStart function: stale connections / duplicate “unique” IDs | Snapshot froze connections & random seeds; shared across restores | Errors right after cold start only; on warm it’s fine | Re-open connections / re-seed in afterRestore (CRaC) or beforeCheckpoint |
| 16 | Async events silently “lost” during a spike | Throttled async invokes exhausted retries with no DLQ | Throttles spike; no DLQ configured |
Add a DLQ / on-failure destination; raise concurrency |
Error & status-code reference
| Code / message | Where | Meaning | Fix |
|---|---|---|---|
TooManyRequestsException (429) |
sync invoke | Concurrency cap hit | Raise quota/reserved; caller retries with backoff |
Rate Exceeded / ThrottlingException |
control-plane | Too many API calls | Back off; batch config changes |
Task timed out after N.NN seconds |
logs | Hit the function Timeout |
Raise timeout or fix slow code/downstream |
Runtime exited ... signal: killed |
logs | Out of memory | Raise memory; stream large data |
No space left on device |
logs | /tmp full |
Raise ephemeral storage; clean up |
ProvisionedConcurrencyConfigNotFoundException |
API | PC not set on that qualifier | Configure PC on the alias/version |
ResourceConflictException |
API | Concurrent config update / update in progress | wait function-updated, retry |
EC2ThrottledException |
VPC functions | ENI creation throttled | Raise Hyperplane/ENI quota; fewer subnets |
InvalidParameterValueException: memory |
API | Memory outside 128–10,240 | Use a valid MB value |
| HTTP 504 (Gateway Timeout) | API Gateway | Integration exceeded 29/30 s | Go async or raise REST quota |
Decision table
| If you see… | It’s probably… | Do this |
|---|---|---|
| Slow + low RAM used | CPU-starved | Raise memory (Power Tune) |
| Slow + RAM near limit | OOM pressure | Raise memory or stream data |
| 429 to users | Concurrency cap | Raise quota / reserved |
| p99 spikes on scale-up | Cold starts | Provisioned concurrency / SnapStart |
| PC bill high, low utilisation | Over-provisioned PC | Auto-scale / schedule down |
| Downstream DB overwhelmed | No concurrency cap | Reserved concurrency + pooling |
| Cost up after memory bump | Wrong side of curve | Revert to curve low point |
| 504 at ~29 s | API GW ceiling | Async pattern |
Best practices
- Never ship at the default 128 MB without measuring. Run Power Tuning; the sweet spot is almost never 128, and often 1,024–1,769 MB.
- Right-size by workload class: ~1,769 MB for single-threaded CPU work, higher for multi-threaded, low for I/O-bound. Match the curve, not a habit.
- Set timeout to ~p99 × 1.5 + downstream budget — tight enough to fail fast, loose enough to not clip the healthy tail. Never leave a user-facing function at 15 minutes.
- Treat reserved concurrency as a zero-sum budget. Reserve to protect fragile downstreams and guarantee critical functions; track the sum so you never starve the unreserved pool.
- Auto-scale provisioned concurrency; never leave a fixed high number running 24×7 unless traffic is genuinely flat. Schedule around known peaks.
- Alarm on
Throttles ≥ 1for every synchronous function, and onProvisionedConcurrencySpilloverInvocations > 0where PC matters. - Default new functions to arm64. It’s ~20% cheaper and usually faster; only stay on x86 for x86-only native deps.
- Use SnapStart for JVM/Python/.NET cold-start pain when you don’t want to pay for provisioned capacity — but implement the restore hooks for connections and randomness.
- Clean
/tmpevery invocation. Warm reuse means yesterday’s files are still there; size ephemeral storage to the real need, not “just in case.” - Re-measure after material changes to code, dependencies, payload size, or runtime — the optimal memory and the cold-start profile both move.
- Cap concurrency before any non-serverless downstream (RDS, third-party API, on-prem) and pair with connection pooling (RDS Proxy).
- Put GB-seconds and provisioned-concurrency cost on a dashboard. Memory is the highest-leverage line item on most Lambda bills.
Security notes
Tuning touches configuration that can be abused, so scope it carefully:
| Concern | Control |
|---|---|
| Who can change memory/timeout/concurrency | Scope lambda:UpdateFunctionConfiguration, lambda:PutFunctionConcurrency, lambda:PutProvisionedConcurrencyConfig to specific function ARNs, not * |
| Reserved-concurrency as a DoS lever | PutFunctionConcurrency to 0 disables a function — treat it as a privileged, audited action |
| Quota changes | servicequotas:RequestServiceQuotaIncrease is org-sensitive; restrict and log via CloudTrail |
| Least-privilege execution role | The function’s own role stays minimal — tuning doesn’t change what the code may do; don’t widen it |
| Environment variables | The 4 KB env holds config, not secrets — use Secrets Manager/SSM; encrypt env with a customer-managed KMS key |
/tmp data hygiene |
Ephemeral disk can hold sensitive scratch data; clean it each invoke so warm reuse doesn’t leak between requests/tenants |
| Auto-scaling role | Application Auto Scaling uses a service-linked role — don’t over-grant it |
| Provisioned-concurrency spend | PC is a cost-DoS vector if mis-set high; alarm on unexpected ProvisionedConcurrentExecutions |
Cost & sizing
The bill is driven by memory × duration (GB-seconds) plus requests, with provisioned concurrency as an optional always-on line. Right-sizing memory usually cuts the biggest line without hurting (often helping) latency. Rough figures (x86, ~ap-south-1, ₹86/USD):
| Driver | Rule of thumb | Save by… |
|---|---|---|
| Duration (GB-s) | memory × time; the dominant cost |
Power-tune memory; arm64 (−20%); cut work |
| Requests | $0.20 / 1M | Batch (SQS/Kinesis batch size); dedupe |
| Provisioned concurrency | ~$0.0000041667/GB-s allocated | Auto-scale; schedule to 0 off-hours |
Ephemeral /tmp > 512 MB |
per GB-s of extra | Size to real need; free ≤ 512 MB |
| Architecture | arm64 ≈ 80% of x86 duration cost | Default to arm64 |
| Cold-start init time | longer init = more billed ms | Smaller packages, fewer deps, SnapStart |
Free tier (always, not just 12 months): 1M requests + 400,000 GB-seconds per month. A light API (512 MB, 120 ms, 5M/mo) can sit almost entirely inside it. Sizing checklist: (1) Power-tune memory to the curve’s low point; (2) set timeout to ~p99×1.5 + downstream; (3) default to arm64; (4) add PC only for latency-critical paths and auto-scale it; (5) alarm on Throttles and PC utilisation; (6) re-measure quarterly.
Interview & exam questions
Q1. Why can increasing a Lambda’s memory make it cheaper? (DVA-C02)
Cost is memory × duration. Lambda scales CPU with memory (1,769 MB ≈ 1 vCPU), so for CPU-bound work more memory finishes proportionally faster; GB-seconds stay flat or fall while latency drops sharply. Below one vCPU, doubling memory ≈ halves duration at the same cost.
Q2. What is the memory-to-vCPU relationship? (DVA-C02/SAA-C03) CPU is allocated in proportion to memory. At 1,769 MB you get one full vCPU; below that a fraction; above it more, up to ~6 vCPUs at 10,240 MB. Single-threaded code can’t exceed one vCPU, so it stops speeding up past ~1,769 MB.
Q3. Difference between reserved and provisioned concurrency? (DVA-C02) Reserved concurrency guarantees and caps how many concurrent executions a function may have (carved from the account pool; no extra cost). Provisioned concurrency pre-initialises N warm environments to eliminate cold starts (billed while allocated). They solve different problems and are often used together.
Q4. Your synchronous API behind API Gateway times out at ~29 s even though the Lambda timeout is 60 s. Why? (SAA-C03) API Gateway’s integration timeout (29 s for REST by default, 30 s fixed for HTTP APIs) caps the synchronous path regardless of the function’s own timeout. Fix by going asynchronous (202 + poll/webhook) or raising the REST integration-timeout quota.
Q5. How do you stop a Lambda from overwhelming an RDS database? (SAA-C03/DVA-C02) Set reserved concurrency on the function to a value below the database’s connection budget so it can’t open more connections than the DB allows, and add RDS Proxy for pooling. This caps in-flight invocations deterministically.
Q6. What does TooManyRequestsException / a rising Throttles metric indicate, and how do you resolve it? (DVA-C02)
The function hit a concurrency cap — the account limit (default 1,000) or its reserved value. Confirm with Throttles and get-account-settings; resolve by raising the account quota (L-B99A9384) or the reserved value, and have sync callers retry with backoff.
Q7. How is Lambda concurrency calculated, and why does it matter for tuning? (SAA-C03) Concurrency ≈ invocation rate × average duration (Little’s Law). It’s requests in flight, not per second. Cutting duration (via memory tuning) cuts the concurrency consumed — reducing both cost and throttling risk simultaneously.
Q8. What is SnapStart and when would you choose it over provisioned concurrency? (DVA-C02) SnapStart snapshots the initialised environment and restores cold starts from it, cutting init time (up to ~10× for the JVM) — free for Java. Choose it over provisioned concurrency when you want cold-start relief without paying for always-warm capacity; mind the connection/randomness caveats via restore hooks.
Q9. A function needs 4 GB of scratch space for media files. Which setting, and what’s the risk? (SOA-C02)
Raise ephemeral storage (/tmp) up to 10,240 MB. The risk: /tmp is reused across warm invocations, so failing to delete files leads to No space left on device, and storage above 512 MB is billed per GB-second.
Q10. How does Lambda scale during a sudden traffic spike, and how do you avoid cold-start latency? (SAA-C03) Each function scales by up to 1,000 concurrent executions every 10 seconds until it hits a cap. During the ramp, new environments cold-start, spiking p99. Pre-warm with provisioned concurrency (plus auto-scaling / scheduled scaling before known peaks) to hide the ramp.
Q11. When is arm64 (Graviton2) the right choice, and when not? (DVA-C02)
Almost always for interpreted code (Python/Node) — ~20% cheaper and often faster. Not when you depend on x86-only native binaries that you can’t rebuild for arm64 (you’d hit exec format error).
Q12. What’s the correct timeout for a function that calls a downstream with a 5 s p99? (DVA-C02) Above the combined p99 with margin — e.g. the function’s own work plus ~5 s downstream, times ~1.5 — but never so high that a hung downstream burns 15 minutes of billed time and holds a concurrency slot. Tight enough to fail fast, loose enough to pass the healthy tail.
Quick check
- At what memory size does a Lambda get exactly one vCPU?
- You raise memory on an I/O-bound function and the bill goes up with no latency change. Why?
- What are the two things reserved concurrency does at once?
- What is the default account concurrency limit, and what’s the minimum unreserved you must keep?
- Your synchronous API times out at ~29 seconds regardless of the function timeout. What’s the cause?
Answers
- 1,769 MB. Below it you get a fraction of a vCPU; above it, more (up to ~6 at 10 GB).
- I/O-bound work spends its time waiting, not computing, so extra CPU/memory doesn’t speed it up — you just pay more per millisecond for the same duration. Keep such functions on low memory.
- It guarantees the function can reach that concurrency and caps it there (throttling beyond it). Setting it to 0 disables the function.
- 1,000 concurrent executions per Region (soft, raiseable via quota
L-B99A9384); AWS keeps a minimum of 100 unreserved. - The API Gateway integration timeout (29 s for REST by default, 30 s for HTTP APIs) caps the synchronous path — not the Lambda timeout. Go async or raise the REST quota.
Glossary
| Term | Definition |
|---|---|
| Memory (MemorySize) | The one setting that provisions RAM and proportional vCPU/network; 128 MB–10,240 MB. |
| vCPU coupling | CPU allocated in proportion to memory; 1,769 MB ≈ 1 vCPU, ~6 vCPU at 10 GB. |
| GB-second | Billing unit: memory_in_GB × billed_seconds; the main cost driver. |
| Power Tuning | Open-source Step Functions state machine that measures cost/latency across memory sizes to find the optimum. |
| Timeout | Wall-clock ceiling per invocation, 1 s–900 s (default 3 s). |
| Concurrent execution | A single invocation in flight; concurrency ≈ rate × duration. |
| Account concurrency limit | Regional ceiling on in-flight invokes; default 1,000, raiseable. |
| Unreserved concurrency | The shared pool for functions without a reservation; min 100. |
| Reserved concurrency | A per-function carve-out that guarantees and caps its concurrency. |
| Provisioned concurrency (PC) | Pre-initialised warm environments that remove cold starts; billed while allocated. |
| Burst / scaling rate | Lambda adds up to 1,000 concurrency per function every 10 s until a cap. |
| Throttling | Rejection at a concurrency cap; sync → 429 TooManyRequestsException; the Throttles metric. |
| Cold start | The init cost of a new environment (Init Duration); hidden by PC/SnapStart. |
Ephemeral storage (/tmp) |
Scratch disk, 512 MB–10,240 MB; reused across warm invokes. |
| SnapStart | Restore-from-snapshot cold-start reduction (Java/Python/.NET). |
| Graviton / arm64 | ARM architecture; ~20% cheaper duration, often faster. |
Next steps
- Foundations: Your First AWS Lambda Function, Hands-On — deploy, invoke, and read the logs this article tunes.
- Design: AWS Lambda Patterns: Event-Driven Functions That Scale to Zero — how invocation model changes throttling, retries, and timeout behaviour.
- Failure-first companion: Lambda Errors, Timeouts & Cold Starts: A Troubleshooting Playbook — the diagnostic deep-dive that pairs with this cost-and-speed guide.
- Packaging: Packaging Lambda: Layers & Dependencies — package size drives init time, the cold-start lever here.
- Quotas: AWS Service Quotas & Requesting a Limit Increase — raise the concurrency limit the right way and track the request.