Most teams don’t fail at microservices because they can’t write services — they fail because they can’t run twelve of them: twelve pipelines, twelve scaling policies, twelve things that page you at 2 a.m. Amazon ECS (Elastic Container Service) with the Fargate launch type is AWS’s answer for teams who want orchestration without operating a control plane or patching a node fleet: hand ECS an image and a task size, and AWS finds the compute, wires the networking, and replaces anything that dies.
This is a production reference architecture, not a hello-world: an Application Load Balancer splitting /orders and /catalog traffic to independent Fargate services, ECS Service Connect for east-west calls, a database per service (Aurora PostgreSQL and DynamoDB), an SQS-driven worker scaling on queue depth, images flowing through ECR with immutable tags, secrets injected from Secrets Manager, rolling and blue/green deployments, and Container Insights plus X-Ray watching all of it.
Everything is backed by real aws CLI commands, a complete task-definition JSON, and Terraform — including the two decisions that dominate design reviews: Fargate vs EC2, and ECS vs EKS.
What problem this solves
A monolith on EC2 works — until the payments module needs to scale independently of search, until one team’s deploy takes down another team’s feature, until a memory leak anywhere restarts everything. Microservices fix the coupling but multiply the operational surface. ECS on Fargate is the managed middle path: real orchestration (placement, health-driven replacement, discovery, deployment strategies) with zero servers to patch.
| Pain in production | What breaks without this architecture | How the ECS Fargate design answers it |
|---|---|---|
| One deploy risks the whole app | A bad release of any module restarts the monolith | Independent services; deployment circuit breaker rolls back only the broken one |
| Can’t scale hot paths independently | You scale the whole VM fleet for one hot endpoint | Per-service target tracking (CPU or ALB requests/target) |
| Node patching, AMI baking, capacity planning | Ops time sunk into ECS-optimized AMI upgrades, ASG tuning | Fargate: no nodes; AWS patches the underlying platform |
| Shared database becomes the coupling point | Schema change in one team blocks three others | Database per service (Aurora for orders, DynamoDB for catalog) |
| Synchronous chains amplify failures | Checkout fails because email service is slow | SQS/SNS/EventBridge decouple; worker retries with DLQ |
| Hard-coded IPs / config drift between services | Redeploys break east-west calls | Cloud Map namespace + Service Connect stable names (http://catalog:8080) |
| Secrets in env files and AMIs | Credential leaks, no rotation story | Secrets Manager/SSM injected at task start via the execution role |
| No per-service blast-radius control | One compromised process reaches everything | One security group per service, one IAM task role per service |
If you run more than two or three services with different scaling profiles and different teams shipping them, you are the target audience. One service, one team? Start simpler — your first container deployment on ECS Fargate — and grow into this reference.
Learning objectives
By the end of this article you can:
- Explain the ECS object model — cluster → service → task → task definition — and what each layer owns, including the task lifecycle states you’ll see during incidents.
- Choose between Fargate and EC2 launch types (and between ECS and EKS) with concrete cost, limit, and operational arguments.
- Design ALB path-based routing to multiple target groups with health checks that don’t lie, and wire one security group per service in awsvpc mode.
- Wire service discovery with Cloud Map and ECS Service Connect, and know exactly when each fails.
- Attach per-service data stores (Aurora + RDS Proxy, DynamoDB) and an async backbone (SQS with DLQs, SNS fan-out, EventBridge routing).
- Ship images through ECR with immutable tags and scan-on-push, and run rolling and blue/green (CodeDeploy) deployments with automatic rollback.
- Configure target-tracking autoscaling on CPU, ALB requests per target, and queue backlog per task.
- Instrument the platform with Container Insights, structured logs, and X-Ray, and troubleshoot the ten most common ECS failure modes from
stoppedReasonup.
Prerequisites & where this fits
You should already know Docker basics (build/tag/push), VPC fundamentals (subnets, route tables, security groups — refresher: AWS VPC, subnets and security groups explained), and IAM roles versus policies. If ECS itself is new, do the basics lesson first (ECS & Fargate basics); if you’re deciding whether ECS is even the right runtime, read ECS vs EKS vs Fargate: choosing your container path alongside this.
Where this sits: this article owns the middle of the stack — orchestration, Fargate compute, service wiring, deployments, scaling, observability. The edge tier has its own deep-dive in ALB vs NLB vs API Gateway, data-store selection in RDS vs DynamoDB vs Aurora compared, and the async tier connects onward to Lambda event-driven patterns when consumers get bursty enough that an always-on worker stops making sense.
Core concepts
The ECS mental model is four nouns. A cluster is a logical namespace for running tasks — with Fargate, little more than a name, an IAM boundary, and a Container Insights setting. A task definition is the versioned blueprint: image(s), CPU/memory, ports, secrets, log config, IAM roles. A task is a running instantiation of that blueprint — one or more co-scheduled containers sharing an ENI. A service is the supervisor that keeps N copies running, registers them with a load balancer, and orchestrates deployments when you point it at a new revision.
| Concept | One-line definition | Scope/lives in | Why it matters in production |
|---|---|---|---|
| Cluster | Namespace + capacity settings for tasks | Region/account | IAM and Container Insights boundary; quota unit |
| Task definition | Versioned JSON blueprint (image, size, roles, ports) | Account (family:revision) | Every deploy = new revision; rollback = old revision |
| Task | Running copy of a task definition (1+ containers, 1 ENI) | Cluster | The unit that starts, fails, and gets replaced |
| Service | Keeps desiredCount tasks healthy behind a TG |
Cluster | Owns deployments, autoscaling hooks, circuit breaker |
| Container definition | Per-container config inside a task def | Task definition | Port names here enable Service Connect |
| Launch type / capacity provider | Where tasks run: FARGATE, FARGATE_SPOT, EC2 ASG |
Service/task | Cost and interruption profile |
| Task execution role | IAM role the ECS agent uses (pull image, fetch secrets, write logs) | Task definition | Wrong role = ResourceInitializationError |
| Task role | IAM role your code assumes (S3, SQS, DynamoDB access) | Task definition | Least-privilege per service |
| Target group | ALB’s set of task IPs + health checks | ELB | Health here decides task replacement |
| Cloud Map namespace | DNS/HTTP registry of service names | Region | Backbone for Service Connect |
| Service Connect | ECS-managed sidecar proxy + names (catalog:8080) |
Cluster/namespace | East-west traffic with retries + telemetry |
| Platform version | Fargate runtime version (LINUX 1.4.0 = LATEST) |
Task | Controls ephemeral storage, ENI behaviour |
Task lifecycle — what you’ll see during an incident
Knowing the fixed task states turns “it’s not starting” into a precise diagnosis.
| State | What’s happening | If tasks are stuck here, suspect… |
|---|---|---|
PROVISIONING |
Fargate is attaching the ENI in your subnet | Subnet out of free IPs; ENI quota |
PENDING |
Pulling image, fetching secrets, starting containers | No route to ECR/Secrets Manager (NAT/endpoints); slow 2 GB images |
ACTIVATING |
Registering with target group / Service Connect | Wrong container port; TG in a different VPC |
RUNNING |
Serving traffic; health checks apply | App-level failures from here on |
DEACTIVATING → STOPPING |
Deregistering from TG, sending SIGTERM, waiting stopTimeout (default 30 s) |
502s during deploys if app ignores SIGTERM |
DEPROVISIONING → STOPPED |
ENI detached; stoppedReason populated |
Always read stoppedReason first |
The task definition, end to end
A production-shaped task definition for the orders service — awsvpc, ARM64 (cheaper), a named port for Service Connect, secrets from Secrets Manager and SSM, a container health check, and logs:
{
  "family": "orders",
  "networkMode": "awsvpc",
  "requiresCompatibilities": ["FARGATE"],
  "cpu": "512",
  "memory": "1024",
  "runtimePlatform": { "cpuArchitecture": "ARM64", "operatingSystemFamily": "LINUX" },
  "executionRoleArn": "arn:aws:iam::111122223333:role/ordersTaskExecutionRole",
  "taskRoleArn": "arn:aws:iam::111122223333:role/ordersTaskRole",
  "containerDefinitions": [
    {
      "name": "orders",
      "image": "111122223333.dkr.ecr.ap-south-1.amazonaws.com/orders:2026-07-07.4f9c1e2",
      "essential": true,
      "portMappings": [
        { "name": "orders-http", "containerPort": 8080, "protocol": "tcp", "appProtocol": "http" }
      ],
      "environment": [
        { "name": "SPRING_PROFILES_ACTIVE", "value": "prod" }
      ],
      "secrets": [
        { "name": "DB_PASSWORD", "valueFrom": "arn:aws:secretsmanager:ap-south-1:111122223333:secret:prod/orders/db-AbCdEf:password::" },
        { "name": "PAYMENT_API_KEY", "valueFrom": "arn:aws:ssm:ap-south-1:111122223333:parameter/prod/orders/payment-api-key" }
      ],
      "healthCheck": {
        "command": ["CMD-SHELL", "curl -sf http://localhost:8080/healthz || exit 1"],
        "interval": 15, "timeout": 5, "retries": 3, "startPeriod": 30
      },
      "stopTimeout": 30,
      "logConfiguration": {
        "logDriver": "awslogs",
        "options": {
          "awslogs-group": "/ecs/orders",
          "awslogs-region": "ap-south-1",
          "awslogs-stream-prefix": "orders"
        }
      }
    }
  ]
}
The fields that decide whether your 2 a.m. is quiet:
| Field | Values | Default | Production guidance |
|---|---|---|---|
cpu / memory (task level) |
Fixed Fargate combos (matrix below) | none — required | Size from Container Insights p95, not guesses |
runtimePlatform.cpuArchitecture |
X86_64, ARM64 |
X86_64 |
ARM64 ≈ 20% cheaper; needs multi-arch or ARM images |
portMappings[].name |
free text | unset | Required for Service Connect — name every port |
secrets[].valueFrom |
Secrets Manager/SSM ARN | — | Resolved once at task start; rotation needs redeploy |
healthCheck |
container-level command | none | Set it AND the ALB check; startPeriod ≥ boot time |
stopTimeout |
2–120 s (Fargate) | 30 s | Must exceed your graceful-shutdown drain time |
essential |
true/false | true (first) | Non-essential sidecars (X-Ray) shouldn’t kill the task |
ephemeralStorage.sizeInGiB |
21–200 | 20 GiB free | Only pay beyond 20 GiB; watch image + tmp usage |
executionRoleArn vs taskRoleArn |
IAM roles | — | Never merge them; execution = platform, task = your code |
Register it, and the cluster around it:
# Cluster with Container Insights and Fargate + Spot capacity providers
aws ecs create-cluster \
  --cluster-name shopfast-prod \
  --capacity-providers FARGATE FARGATE_SPOT \
  --default-capacity-provider-strategy \
      capacityProvider=FARGATE,weight=1,base=2 \
      capacityProvider=FARGATE_SPOT,weight=3 \
  --settings name=containerInsights,value=enhanced

# Register the task definition from the JSON above
aws ecs register-task-definition --cli-input-json file://orders-taskdef.json

# See what revision you got
aws ecs describe-task-definition --task-definition orders \
  --query 'taskDefinition.{family:family,rev:revision,cpu:cpu,mem:memory}'
Fargate or EC2 launch type — and where EKS fits
The launch-type decision is the first fork in every ECS design review. Both run the same task definitions; what changes is who owns the compute.
| Dimension | Fargate | EC2 launch type |
|---|---|---|
| Servers to manage | None — AWS owns host patching | You: AMI updates, ASG, capacity providers |
| Billing unit | Per task: vCPU-seconds + GB-seconds (1-min minimum) | Per instance-hour, regardless of utilization |
| Bin-packing efficiency | Perfect (you pay task size only) | Yours to engineer; idle headroom is waste |
| Task density / cost at scale | Premium per vCPU (~40% over comparable EC2 on-demand) | Cheaper if you keep fleets >70% utilized |
| Daemons (log agents, security agents) | No DAEMON scheduling — must be sidecars |
DAEMON strategy supported |
| GPU / Windows / special instance types | No GPUs; Windows supported (min 1 vCPU) | Full instance-type catalogue incl. GPU |
| Ephemeral storage | 20 GiB free, up to 200 GiB | Instance/EBS — anything |
| Privileged containers, custom kernels | Not allowed | Allowed |
| Per-task isolation | VM-level (Firecracker-style micro-VM isolation) | Shared kernel per instance |
| Spot | FARGATE_SPOT (~70% off, 2-min warning) |
EC2 Spot via capacity providers |
| Scaling granularity | Per task — no instance warm-up | Task + instance scaling (two layers to tune) |
| Quotas | vCPU-based account quota (commonly 4,000 on-demand vCPUs; adjustable) | EC2 instance quotas |
Rule of thumb: below roughly 50–100 sustained vCPUs, Fargate’s premium is smaller than the salary-time of running node fleets. Above that, measure — a well-packed EC2/Graviton fleet with Savings Plans wins on raw compute, but only if someone owns AMI hygiene, drain logic, and utilization. Mixed estates are normal: Fargate for spiky/low-baseline services, EC2 capacity providers for the big steady ones.
Fargate task size matrix (valid CPU/memory combinations)
Fargate only accepts fixed shapes — this matrix is the sizing vocabulary for the whole platform:
| Task vCPU | Valid memory range | Increment | Typical use |
|---|---|---|---|
| 0.25 vCPU | 0.5, 1, 2 GB | fixed steps | Sidecars-light APIs, cron tasks |
| 0.5 vCPU | 1–4 GB | 1 GB | Small REST services (our orders svc) |
| 1 vCPU | 2–8 GB | 1 GB | JVM/Node services with headroom |
| 2 vCPU | 4–16 GB | 1 GB | Bigger APIs, queue workers |
| 4 vCPU | 8–30 GB | 1 GB | Heavy batch, in-memory caches |
| 8 vCPU | 16–60 GB | 4 GB | Rare — consider EC2 economics here |
| 16 vCPU | 32–120 GB | 8 GB | Largest shape; almost always EC2 territory |
ECS vs EKS — the honest decision table
| If… | Pick | Because |
|---|---|---|
| Team < ~10 engineers, no k8s skills in-house | ECS Fargate | Zero control-plane ops; IAM/ALB/CloudWatch native |
| You need Helm charts, operators, CRDs, Istio/Argo ecosystem | EKS | ECS has no CRD equivalent; ecosystem lives on k8s |
| Multi-cloud/on-prem portability is a hard requirement | EKS | Kubernetes API is the portability layer |
| You want AWS-native primitives, fewest moving parts | ECS | Service Connect, CodeDeploy, Cloud Map are built in |
| Platform team exists and wants to own upgrades | EKS | Someone must own the 3–4 k8s upgrades/yr + $0.10/hr/cluster |
| Compliance needs VM-isolated multi-tenant tasks fast | ECS Fargate | Per-task micro-VM isolation by default |
| Batch/GPU/ML scheduling with custom logic | EKS (or Batch) | Scheduler extensibility |
The trap: choosing EKS “for the hiring signal”, then running it like ECS — no operators, no CRDs, one namespace — while paying the upgrade tax anyway. If the k8s API isn’t a requirement, ECS removes an entire failure domain. Deeper treatment: choose your container path.
Networking: one ENI, one security group per service
Fargate mandates awsvpc network mode: every task gets its own elastic network interface (ENI) with a private IP in your subnet — no port juggling, no bridge-mode NAT. This is the platform’s biggest security win: you write security-group rules between services exactly as you would between EC2 instances.
The reference layout: tasks in private subnets across two AZs with assignPublicIp=DISABLED, ALB in public subnets, and either a NAT gateway or VPC interface endpoints for the AWS APIs Fargate needs at task start (required for zero-egress designs).
| Security group | Inbound rule | From | Purpose |
|---|---|---|---|
sg-alb |
TCP 443 | 0.0.0.0/0 (or CloudFront prefix list) |
Public HTTPS entry |
sg-orders |
TCP 8080 | sg-alb |
ALB → orders tasks only |
sg-catalog |
TCP 8080 | sg-alb, sg-orders |
ALB north-south + orders→catalog east-west |
sg-worker |
(none inbound) | — | Pull-based (SQS); egress only |
sg-aurora |
TCP 5432 | sg-orders |
Only orders reaches the orders DB |
sg-vpce |
TCP 443 | VPC CIDR (e.g. 10.20.0.0/16) |
Interface endpoints for ECR/logs/secrets |
Chaining SGs by reference (source = another SG, never a CIDR) means scale-out needs zero rule changes — every new task ENI inherits its service’s SG. What Fargate must reach at task start — miss one in a private subnet and tasks die in PENDING with pull/init errors:
| Endpoint | Type | Needed for |
|---|---|---|
com.amazonaws.<region>.ecr.api |
Interface | ECR auth (GetAuthorizationToken) |
com.amazonaws.<region>.ecr.dkr |
Interface | Image manifest/layer API |
com.amazonaws.<region>.s3 |
Gateway (free) | ECR image layers live in S3 |
com.amazonaws.<region>.logs |
Interface | awslogs driver delivery |
com.amazonaws.<region>.secretsmanager |
Interface | secrets[] from Secrets Manager |
com.amazonaws.<region>.ssm |
Interface | secrets[] from Parameter Store |
Cost math: interface endpoints run ~$0.01/hr per AZ (two AZs × 5 endpoints ≈ $73/month) vs one NAT gateway at ~$0.045/hr + $0.045/GB processed (≈ $33/month + data). Endpoints win on security (no internet path) and data-heavy pulls; NAT wins on simplicity when you need general egress anyway.
Traffic in: ALB path-based routing to services
One ALB fronts the platform. The HTTPS :443 listener evaluates rules by ascending priority; each rule matches conditions (path, host, header, query, source IP) and forwards to a target group (TG) holding task IPs (target-type: ip — mandatory for awsvpc).
| Priority | Condition | Action → target group | Notes |
|---|---|---|---|
| 10 | path-pattern: /orders, /orders/* |
orders-tg |
Both patterns — /orders alone doesn’t match /orders/ |
| 20 | path-pattern: /catalog/* |
catalog-tg |
Case-sensitive matching |
| 30 | host-header: admin.shopfast.in |
admin-tg |
Host + path conditions can combine (AND) |
| 40 | path-pattern: /internal/* + source-ip: 10.20.0.0/16 |
internal-tg |
Defense in depth for private paths |
| default | (no match) | fixed-response 404 | Never default to a real service — fail closed |
Key ALB numbers to design against: 100 rules per listener (default, adjustable), 5 condition values per rule, 1,000 targets per ALB, idle timeout 60 s default (raise for long polls/SSE) — and WAF associates at the ALB, so one Web ACL protects every service behind it.
Target-group health checks drive ECS task replacement, so tune them deliberately:
| TG setting | Default | Reference value | Why |
|---|---|---|---|
| Health path | / |
/healthz (cheap, no DB call) |
A DB-touching health check turns a DB blip into mass task kills |
| Interval / timeout | 30 s / 5 s | 15 s / 5 s | Faster detection without flapping |
| Healthy / unhealthy threshold | 5 / 2 | 2–3 / 2 | Default 5×30 s = 2.5 min to come into service |
| Matcher | 200 | 200 (never 200-499) |
Wide matchers hide broken apps |
| Deregistration delay | 300 s | 30–60 s | 300 s makes every deploy drag; match your longest request |
healthCheckGracePeriodSeconds (on the ECS service) |
0 | ≥ app boot time (e.g. 60 s) | Stops ECS killing slow-booting tasks before first health pass |
# Target group for the orders service (IP targets for awsvpc)
aws elbv2 create-target-group \
  --name orders-tg --protocol HTTP --port 8080 --vpc-id vpc-0ab12cd34ef56gh78 \
  --target-type ip --health-check-path /healthz \
  --health-check-interval-seconds 15 --healthy-threshold-count 2

# Path rule on the HTTPS listener
aws elbv2 create-rule \
  --listener-arn arn:aws:elasticloadbalancing:ap-south-1:111122223333:listener/app/shopfast/50dc6c495c0c9188/f2f7dc8efc522ab2 \
  --priority 10 \
  --conditions '[{"Field":"path-pattern","PathPatternConfig":{"Values":["/orders","/orders/*"]}}]' \
  --actions '[{"Type":"forward","TargetGroupArn":"arn:aws:elasticloadbalancing:ap-south-1:111122223333:targetgroup/orders-tg/943f017f100becff"}]'
Outgrowing path rules (per-team throttling, API keys, edge JWT authorizers) is an API Gateway conversation — see ALB vs NLB vs API Gateway.
East-west traffic: Cloud Map and ECS Service Connect
North-south is the ALB’s job; the harder question is how orders calls catalog. Four options, ascending in capability:
| Option | How it works | Gives you | Fails when / limits |
|---|---|---|---|
| Internal ALB per tier | Second ALB, private subnets | Familiar; L7 features | ~$16+/mo per ALB; another hop; no per-service identity |
| Cloud Map service discovery (DNS) | ECS registers task IPs as A/SRV records in a private hosted zone | Simple catalog.shopfast.local names |
DNS TTL caching → stale IPs during deploys; no retries/metrics |
| ECS Service Connect | ECS injects a managed sidecar proxy; names resolve via namespace; proxy load-balances, retries, emits metrics | Stable names (http://catalog:8080), outlier ejection, per-route CloudWatch metrics, connection draining |
Only ECS↔ECS in namespaces; small CPU/mem overhead for the proxy; tasks must be (re)launched after enablement |
| Full mesh (App Mesh / Istio on EKS) | Envoy everywhere, mTLS, traffic shifting | Maximum control | App Mesh is discontinued (EOL Sep 30, 2026) — don’t start new builds on it; Istio means EKS |
Service Connect is the default answer for ECS microservices in 2026. It piggybacks on a Cloud Map HTTP namespace (no hosted zone needed) and is transparent to the client: your code calls http://catalog:8080, the sidecar resolves and load-balances across healthy catalog tasks, retries transient failures, and publishes RequestCount and per-target latency to CloudWatch with zero code change.
The wiring is three requirements — miss any and names won’t resolve: the port mapping must be named in the task definition ("name": "orders-http" above); both services join the same namespace, the server side declaring an alias (catalog:8080); and the config applies only to tasks launched after it’s set — force a new deployment when enabling it on an existing service.
aws ecs create-service \
  --cluster shopfast-prod \
  --service-name orders \
  --task-definition orders:12 \
  --desired-count 3 \
  --network-configuration 'awsvpcConfiguration={subnets=[subnet-0a1b2c3d,subnet-0e4f5a6b],securityGroups=[sg-0aa11bb22cc33dd44],assignPublicIp=DISABLED}' \
  --load-balancers 'targetGroupArn=arn:aws:elasticloadbalancing:ap-south-1:111122223333:targetgroup/orders-tg/943f017f100becff,containerName=orders,containerPort=8080' \
  --health-check-grace-period-seconds 60 \
  --deployment-configuration 'deploymentCircuitBreaker={enable=true,rollback=true},maximumPercent=200,minimumHealthyPercent=100' \
  --service-connect-configuration 'enabled=true,namespace=shopfast,services=[{portName=orders-http,discoveryName=orders,clientAliases=[{port=8080,dnsName=orders}]}]'
Per-service data: RDS and DynamoDB
The architectural rule that keeps microservices micro: each service owns its data store; no other service connects to it directly. Cross-service data access goes through the owning service’s API or through events — never through a shared schema. In the reference: orders owns Aurora PostgreSQL (Multi-AZ, 5432, reachable only from sg-orders via RDS Proxy) because order state wants transactions and joins; catalog owns a DynamoDB on-demand table because key-based reads at any scale with zero connection pools is exactly DynamoDB’s shape; the billing worker consumes the queue and writes invoices to its own Aurora schema.
The selection heuristic in one pass (full comparison: RDS vs DynamoDB vs Aurora): multi-row transactions and ad-hoc/reporting queries → Aurora, and plan for connection limits under scale-out; known key-based access with spiky, unbounded scale → DynamoDB, and respect the 400 KB item cap and hot-partition-key modelling up front. A service that genuinely needs both patterns is usually two services wearing one name.
The connection-pool trap is the #1 scale-out failure with containers + RDS. Thirty tasks × 20-connection pools = 600 connections marching toward max_connections. Fix it structurally: cap pools per task (5–10 is plenty at 0.5 vCPU) and put RDS Proxy between services and Aurora — it multiplexes thousands of client connections onto a small pinned pool, cuts app-visible failover time sharply, and supports IAM auth so tasks never hold a DB password. Cost ≈ $0.015/hr per vCPU of the target DB — cheap insurance against a 2 a.m. FATAL: too many connections.
DynamoDB pairs beautifully with Fargate — no connections at all; the task role IAM policy is the access control:
{
  "Version": "2012-10-17",
  "Statement": [{
    "Effect": "Allow",
    "Action": ["dynamodb:GetItem", "dynamodb:Query", "dynamodb:PutItem"],
    "Resource": "arn:aws:dynamodb:ap-south-1:111122223333:table/catalog"
  }]
}
The async backbone: SQS, SNS, EventBridge
Synchronous chains are how microservices reinvent the distributed monolith: checkout → inventory → email, and suddenly checkout’s p99 includes the mail provider’s bad day. The reference keeps the synchronous graph shallow (client → service, at most one east-west hop) and pushes everything else through messages.
| SQS | SNS | EventBridge | |
|---|---|---|---|
| Model | Queue (pull, 1 consumer group) | Pub/sub fan-out (push) | Event bus with content-based routing |
| Primary use here | Work buffering for the billing worker | One event → many subscribers (SQS, Lambda, email) | Cross-service/cross-account event routing, SaaS + AWS events |
| Ordering | Standard: best-effort; FIFO: strict per group | FIFO topics → FIFO queues | Not guaranteed |
| Delivery | At-least-once (FIFO: exactly-once processing) | At-least-once per subscriber | At-least-once |
| Retry story | Visibility timeout + redrive to DLQ | Per-subscriber retry policy + DLQ | 24-h retry with backoff + DLQ per target |
| Filtering | Consumer-side | Subscription filter policies | Rule patterns on any event field |
| Throughput | Standard: ~unlimited; FIFO: 300 msg/s (3,000 batched) per queue | Very high | Default bus: soft-limited (thousands/s, raisable) |
| Payload cap | 256 KB (1 MB support arrived late 2025 — verify in your region) | 256 KB | 256 KB per entry |
| Targets/consumers | 1 logical consumer | Up to 12.5M subs/topic | 5 targets per rule |
| Latency | ms (long-poll up to 20 s wait) | ms | typically sub-second, not guaranteed |
The pattern that covers 90% of platforms: orders publishes OrderPlaced to EventBridge; rules route it to the billing queue, the notifications queue, and an archive; each consumer owns its SQS queue (buffer + retry isolation). Queue settings that must not stay on defaults:
| Setting | Default | Set to | Or else |
|---|---|---|---|
| Visibility timeout | 30 s | ≥ 6× worker processing time | Duplicate processing mid-work |
Redrive policy / maxReceiveCount |
none | DLQ after 3 receives | Poison message loops forever, blocks nothing but burns cost |
WaitTimeSeconds (long polling) |
0 | 20 s | Empty-receive API spam (real money at scale) |
| Retention | 4 days | 14 days on the DLQ | Losing evidence before Monday’s investigation |
| Alarm | none | ApproximateAgeOfOldestMessage > SLA; DLQ depth > 0 |
Silent backlog until customers notice |
The worker service runs no load balancer — just desiredCount pollers scaling on backlog per task (ApproximateNumberOfMessagesVisible ÷ RunningTaskCount as a custom metric): near zero at night, dozens during a sale. For when a Lambda consumer beats a Fargate worker (bursty, short, sub-15-min work), see Lambda event-driven patterns.
Shipping images: ECR and the pipeline
Every running task traces back to an image in Amazon ECR; the difference between a calm platform and incident archaeology is image discipline.
| ECR setting | Value in this reference | Why |
|---|---|---|
| Tag mutability | IMMUTABLE | :latest overwritten twice a day = you can’t say what’s running |
| Tag scheme | <date>.<git-sha> (e.g. 2026-07-07.4f9c1e2) |
Human-sortable + traceable to a commit |
| Scan on push | Enhanced (Amazon Inspector) | CVE gate before deploy, continuous rescan after |
| Lifecycle policy | Keep last 30 per repo; expire untagged in 7 days | Storage is $0.10/GB-month — old layers add up |
| Repo per service | orders, catalog, billing-worker |
Per-repo IAM + lifecycle + scan policy |
| Pull-through cache | For public.ecr.aws + Docker Hub bases |
Kills Docker Hub 429 rate-limit failures at 6 a.m. scale-out |
aws ecr create-repository --repository-name orders \
  --image-tag-mutability IMMUTABLE \
  --image-scanning-configuration scanOnPush=true

# Build (multi-arch for our ARM64 tasks), push, and roll the service
aws ecr get-login-password --region ap-south-1 | \
  docker login --username AWS --password-stdin 111122223333.dkr.ecr.ap-south-1.amazonaws.com

docker buildx build --platform linux/arm64 \
  -t 111122223333.dkr.ecr.ap-south-1.amazonaws.com/orders:2026-07-07.4f9c1e2 --push .
The pipeline is boring on purpose: build → scan gate → register-task-definition with the new tag → update-service. Because a revision is immutable, deploy = new revision, rollback = point back at the old one. Never deploy by re-pushing a mutable tag — you lose the audit trail and the rollback lever.
Deployments: rolling by default, blue/green when it hurts
ECS gives you two first-class strategies (a built-in BLUE_GREEN option also landed in deploymentConfiguration mid-2025 — verify regional availability; CodeDeploy remains the battle-tested path).
| Rolling (ECS-native) | Blue/green (CodeDeploy) | |
|---|---|---|
| Mechanics | Replace tasks in place under one TG, honouring min/max % | Full green task set on a second TG; listener flips traffic |
| Extra infra | None | 2 target groups, CodeDeploy app + deployment group, optional test listener |
| Traffic shifting | None (task-by-task) | AllAtOnce, linear, canary configs |
| Instant rollback | Circuit breaker redeploys old revision (minutes) | Listener flips back to blue (seconds) |
| Test-before-traffic | No | Yes — green reachable on a test listener (e.g. :9001) first |
| Cost during deploy | Up to maximumPercent extra tasks |
~2× task count during the window |
| Choose when | Most services, most days | Payments-grade services, schema-coupled releases, canary needs |
Rolling behaviour is governed by two percentages: minimumHealthyPercent (default 100) and maximumPercent (default 200) — with 3 tasks: “start up to 3 new ones, never dip below 3 healthy.” Always pair it with the deployment circuit breaker (enable=true,rollback=true): after repeated task-start failures (threshold = half the desired count, min 3, max 200) it marks the deployment failed and auto-rolls back to the last good revision — a bad image costs 4 minutes instead of an evening.
CodeDeploy blue/green shifts traffic with named configs — the real ones you’ll reference: CodeDeployDefault.ECSAllAtOnce (flip 100% at once, still with instant rollback), ECSCanary10Percent5Minutes / ECSCanary10Percent15Minutes (10% first, the rest after the bake), and ECSLinear10PercentEvery1Minutes / ECSLinear10PercentEvery3Minutes (+10% per interval). Attach CloudWatch alarms (5xx rate, p99 latency) to the deployment group and CodeDeploy rolls back automatically when the canary trips them. The deploy artifact is an appspec.yaml:
version: 0.0
Resources:
  - TargetService:
      Type: AWS::ECS::Service
      Properties:
        TaskDefinition: "arn:aws:ecs:ap-south-1:111122223333:task-definition/orders:13"
        LoadBalancerInfo:
          ContainerName: "orders"
          ContainerPort: 8080
One more deploy-time 502 source: graceful shutdown. On replacement, ECS deregisters the task (ALB stops new sends; in-flight continue up to the deregistration delay), sends SIGTERM, waits stopTimeout (default 30 s), then SIGKILL. Your app must catch SIGTERM and drain — PID-1 shell wrappers that swallow signals are the classic culprit; use exec in entrypoints.
Configuration and secrets
Plain config rides in environment; anything sensitive rides in secrets[] — fetched by the execution role at task start, injected as env vars, never visible in the task definition, console, or describe-tasks.
| Secrets Manager | SSM Parameter Store | |
|---|---|---|
| Cost | $0.40/secret/month + $0.05/10k calls | Standard: free (4 KB); Advanced: $0.05/param/month (8 KB) |
| Rotation | Built-in Lambda rotation (RDS/Aurora templates) | None built-in |
| Cross-region replication | Yes | No (copy yourself) |
Random generation, JSON keys (:password::) |
Yes | No key extraction — one value per param |
| Use for | DB creds, API keys that rotate | Feature flags, non-secret config, low-churn tokens |
Two production gotchas: (1) secrets resolve once, at task start — rotation does nothing to running tasks until an update-service --force-new-deployment (bake it into the rotation Lambda); (2) the execution role needs secretsmanager:GetSecretValue plus kms:Decrypt — putting those on the task role is the most common ResourceInitializationError on first deploy.
Autoscaling: track a target, don’t chase alarms
ECS service scaling is Application Auto Scaling on DesiredCount. Target tracking is the default tool: pick a metric and a target value; AWS manages the alarms both directions.
| Service | Metric | Target | Scale-out / scale-in cooldown | Why this metric |
|---|---|---|---|---|
| orders (CPU-bound API) | ECSServiceAverageCPUUtilization |
60% | 60 s / 300 s | Headroom for spikes while scaling |
| catalog (I/O-bound API) | ALBRequestCountPerTarget |
~800 req/target/min | 60 s / 300 s | CPU barely moves on I/O waits; requests do |
| billing worker | Custom: backlog per task | 10 msgs/task | 60 s / 300 s | Queue depth is the real demand signal |
| all | + scheduled scaling for known peaks (9 a.m., sale start) | — | — | Pre-warm before the wave, don’t react to it |
resource "aws_appautoscaling_target" "orders" {
  service_namespace  = "ecs"
  resource_id        = "service/shopfast-prod/orders"
  scalable_dimension = "ecs:service:DesiredCount"
  min_capacity       = 3
  max_capacity       = 30
}

resource "aws_appautoscaling_policy" "orders_cpu" {
  name               = "orders-cpu-60"
  policy_type        = "TargetTrackingScaling"
  service_namespace  = aws_appautoscaling_target.orders.service_namespace
  resource_id        = aws_appautoscaling_target.orders.resource_id
  scalable_dimension = aws_appautoscaling_target.orders.scalable_dimension

  target_tracking_scaling_policy_configuration {
    predefined_metric_specification {
      predefined_metric_type = "ECSServiceAverageCPUUtilization"
    }
    target_value       = 60
    scale_out_cooldown = 60
    scale_in_cooldown  = 300
  }
}
Rules that keep scaling boring: min_capacity ≥ 2 (one per AZ) for anything user-facing; scale in slower than out (the asymmetric cooldowns above); protect long-running jobs with ECS task scale-in protection ($ECS_AGENT_URI/task-protection/v1/state from inside the task); and remember target tracking never acts on missing data — a worker that crashes and stops emitting backlog metrics won’t scale itself back up.
Observability: Container Insights, logs, X-Ray
Three signals, all native:
Metrics — CloudWatch Container Insights (containerInsights=enhanced on the cluster) publishes task- and service-level CPU, memory, network, and storage plus deployment state. Logs — the awslogs driver ships stdout/stderr to a log group per service (/ecs/orders); log JSON and CloudWatch Logs Insights becomes your grep. Traces — X-Ray stitches the request path (ALB → orders → catalog → Aurora) via an ADOT or amazon/aws-xray-daemon sidecar (UDP 2000); default sampling (1 req/s + 5%) shows structure without paying for every request.
The alarm set that catches 95% of pages before customers do, per service: ALB HTTPCode_Target_5XX_Count above ~1% of requests for two 1-minute periods; TargetResponseTime p99 above 2× its normal level; HealthyHostCount < 2; Container Insights RunningTaskCount short of DesiredTaskCount for 5 minutes (task churn); memory utilization > 85% sustained (OOM kills arrive at 100%); SQS ApproximateAgeOfOldestMessage above the processing SLA plus any message visible on a DLQ; and an EventBridge rule on SERVICE_DEPLOYMENT_FAILED deployment state changes that pages the owning team directly.
Architecture at a glance
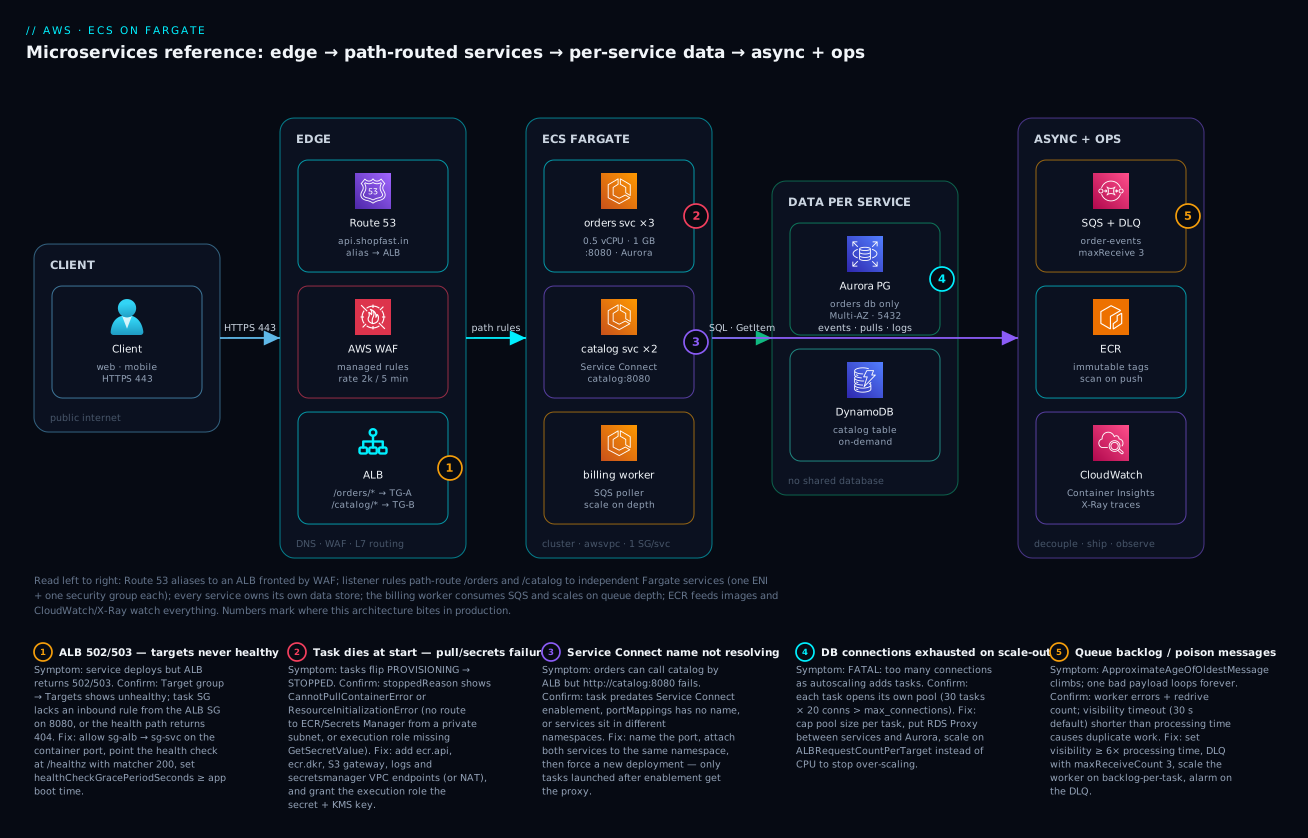
Read the diagram left to right, the direction a request travels. A client resolves api.shopfast.in through Route 53 (alias to the ALB) and lands on the ALB behind AWS WAF (managed rule groups plus a 2k/5-min rate limit). Listener rules path-route /orders/* and /catalog/* to separate target groups, each backed by an independent Fargate service — every task with its own ENI and security group, so sg-aurora literally cannot accept a connection that didn’t come from an orders task. East-west, orders calls catalog by its Service Connect name (catalog:8080) through the managed proxy rather than back out through the ALB.
Each service owns its data: orders writes to Aurora PostgreSQL (Multi-AZ, 5432, via RDS Proxy); catalog reads a DynamoDB on-demand table. Order events flow to SQS (maxReceiveCount 3 DLQ) where the billing worker — no load balancer, scaled on backlog-per-task — consumes them. On the ops rail, ECR feeds immutable scan-on-push images to all three services and CloudWatch (Container Insights + X-Ray) watches the whole path. The numbered badges mark the five places this architecture most often breaks; the legend beneath the diagram narrates symptom, confirmation, and fix for each.
Real-world scenario
ShopFast, a Bengaluru D2C electronics retailer, ran a Django monolith on four EC2 m5.large instances behind a classic ELB. Two problems forced the move: flash-sale traffic (baseline ~40 req/s, peaks ~1,100 req/s) meant permanently paying for peak, and the checkout and catalog teams blocked each other’s releases — eleven deploys a month, four rollbacks, every rollback all-or-nothing.
Over eight weeks they carved three services onto a shopfast-prod cluster: orders (0.5 vCPU/1 GB, min 3 tasks, Aurora PG), catalog (0.5 vCPU/1 GB, min 2, DynamoDB on-demand), and a billing worker (0.25 vCPU/512 MB on FARGATE_SPOT) consuming an order-events queue fed by EventBridge. The ALB path-routed /orders and /catalog; everything else still hit the monolith — a strangler pattern, not a big bang.
The first flash sale after cutover exposed two design debts nine minutes apart. At 12:00, catalog autoscaling (CPU target 60%) hadn’t reacted — catalog is I/O-bound, CPU sat at 31% while requests-per-target tripled; p95 went from 210 ms to 2.4 s. At 12:09, orders tasks began failing health checks: Aurora threw FATAL: remaining connection slots are reserved — 24 scaled-out tasks × 25-connection Django pools had blown past max_connections. The on-call switched catalog’s scaling metric to ALBRequestCountPerTarget=700 (five-minute change, immediate relief) and capped the orders pool at 8; RDS Proxy went in the next week and the error class disappeared.
After one quarter: deploys up from 11 to 41/month (three circuit-breaker rollbacks, all automatic, none customer-visible); sale-day capacity scales 5→28 orders tasks and back in under 20 minutes; compute spend down from ₹31,000/month (4× m5.large 24×7 + headroom) to ~₹19,500/month — and zero AMI-patching weekends. Their retro one-liner is this article’s thesis: “The migration was 20% containers and 80% health checks, pools, and metrics.”
Advantages and disadvantages
| Advantages | Disadvantages |
|---|---|
| No node fleet: no AMIs, no patching, no capacity planning per host | Per-vCPU premium (~40%+ over well-utilized EC2/Graviton on-demand) |
| VM-grade task isolation by default (safer multi-team clusters) | No GPUs; no privileged containers; no DAEMON scheduling |
| Per-service everything: SG, IAM role, scaling policy, deploy cadence | More moving parts than a monolith — you now run a platform |
| Deployment safety nets built in (circuit breaker, CodeDeploy canaries) | Cold task starts (image pull + ENI attach) are 30–90 s, not instant |
| Service Connect gives retries/telemetry without a mesh to operate | ECS-only: no CRDs/operators/Helm ecosystem; AWS lock-in is real |
| Scales to zero-ish for workers; Spot cuts async compute ~70% | Fargate ephemeral storage caps at 200 GiB; awkward for stateful loads |
| Native wiring to ALB, IAM, CloudWatch, ECR — few third-party parts | Per-task ENIs consume subnet IPs — /24s fill up fast at scale |
The disadvantages cluster into two honest costs: money at high sustained scale (revisit EC2 capacity providers past ~100 steady vCPUs) and organizational surface — twelve services means twelve owners; if you don’t have the teams, don’t manufacture the services.
Hands-on lab
Deploys a real path-routed Fargate service behind an ALB in ~30 minutes. Cost: a few rupees if torn down within the hour (ALB + two 0.25 vCPU tasks ≈ $0.05/hr; new accounts get 750 free ALB-hours/month for 12 months). Uses the default VPC’s public subnets with public IPs to avoid NAT/endpoint costs — a lab-only shortcut, never production.
# 0. Variables (adjust region/account)
export AWS_REGION=ap-south-1
ACCOUNT=$(aws sts get-caller-identity --query Account --output text)
VPC=$(aws ec2 describe-vpcs --filters Name=is-default,Values=true --query 'Vpcs[0].VpcId' --output text)
SUBNETS=$(aws ec2 describe-subnets --filters Name=vpc-id,Values=$VPC --query 'Subnets[0:2].SubnetId' --output text | tr '\t' ',')

# 1. ECR repo + a public demo image pushed into it
aws ecr create-repository --repository-name lab-web --image-tag-mutability IMMUTABLE
aws ecr get-login-password | docker login --username AWS --password-stdin $ACCOUNT.dkr.ecr.$AWS_REGION.amazonaws.com
docker pull public.ecr.aws/nginx/nginx:stable
docker tag public.ecr.aws/nginx/nginx:stable $ACCOUNT.dkr.ecr.$AWS_REGION.amazonaws.com/lab-web:v1
docker push $ACCOUNT.dkr.ecr.$AWS_REGION.amazonaws.com/lab-web:v1

# 2. Cluster + log group + execution role (AmazonECSTaskExecutionRolePolicy)
aws ecs create-cluster --cluster-name lab --settings name=containerInsights,value=enabled
aws logs create-log-group --log-group-name /ecs/lab-web
aws iam create-role --role-name labEcsExecRole --assume-role-policy-document '{"Version":"2012-10-17","Statement":[{"Effect":"Allow","Principal":{"Service":"ecs-tasks.amazonaws.com"},"Action":"sts:AssumeRole"}]}'
aws iam attach-role-policy --role-name labEcsExecRole --policy-arn arn:aws:iam::aws:policy/service-role/AmazonECSTaskExecutionRolePolicy
# 3. Register the task definition (80 = nginx's port)
cat > taskdef.json <<EOF
{
  "family": "lab-web", "networkMode": "awsvpc",
  "requiresCompatibilities": ["FARGATE"], "cpu": "256", "memory": "512",
  "executionRoleArn": "arn:aws:iam::$ACCOUNT:role/labEcsExecRole",
  "containerDefinitions": [{
    "name": "web", "image": "$ACCOUNT.dkr.ecr.$AWS_REGION.amazonaws.com/lab-web:v1",
    "essential": true,
    "portMappings": [{ "name": "web-http", "containerPort": 80, "protocol": "tcp" }],
    "logConfiguration": { "logDriver": "awslogs", "options": {
      "awslogs-group": "/ecs/lab-web", "awslogs-region": "$AWS_REGION", "awslogs-stream-prefix": "web" } }
  }]
}
EOF
aws ecs register-task-definition --cli-input-json file://taskdef.json

# 4. Security groups: ALB open on 80; tasks only from the ALB SG
ALB_SG=$(aws ec2 create-security-group --group-name lab-alb-sg --description "lab alb" --vpc-id $VPC --query GroupId --output text)
aws ec2 authorize-security-group-ingress --group-id $ALB_SG --protocol tcp --port 80 --cidr 0.0.0.0/0
TASK_SG=$(aws ec2 create-security-group --group-name lab-task-sg --description "lab tasks" --vpc-id $VPC --query GroupId --output text)
aws ec2 authorize-security-group-ingress --group-id $TASK_SG --protocol tcp --port 80 --source-group $ALB_SG

# 5. ALB + target group (ip targets) + listener with a path rule
ALB=$(aws elbv2 create-load-balancer --name lab-alb --subnets ${SUBNETS//,/ } --security-groups $ALB_SG --query 'LoadBalancers[0].LoadBalancerArn' --output text)
TG=$(aws elbv2 create-target-group --name lab-web-tg --protocol HTTP --port 80 --vpc-id $VPC --target-type ip --health-check-path / --query 'TargetGroups[0].TargetGroupArn' --output text)
LISTENER=$(aws elbv2 create-listener --load-balancer-arn $ALB --protocol HTTP --port 80 \
  --default-actions '[{"Type":"fixed-response","FixedResponseConfig":{"StatusCode":"404","ContentType":"text/plain","MessageBody":"no route"}}]' \
  --query 'Listeners[0].ListenerArn' --output text)
aws elbv2 create-rule --listener-arn $LISTENER --priority 10 \
  --conditions '[{"Field":"path-pattern","PathPatternConfig":{"Values":["/","/index.html","/web/*"]}}]' \
  --actions "[{\"Type\":\"forward\",\"TargetGroupArn\":\"$TG\"}]"

# 6. The service: 2 tasks, circuit breaker on
aws ecs create-service --cluster lab --service-name web --task-definition lab-web \
  --desired-count 2 --launch-type FARGATE \
  --network-configuration "awsvpcConfiguration={subnets=[${SUBNETS}],securityGroups=[$TASK_SG],assignPublicIp=ENABLED}" \
  --load-balancers "targetGroupArn=$TG,containerName=web,containerPort=80" \
  --health-check-grace-period-seconds 30 \
  --deployment-configuration 'deploymentCircuitBreaker={enable=true,rollback=true},maximumPercent=200,minimumHealthyPercent=100'

# 7. Watch it come up, then hit it
aws ecs describe-services --cluster lab --services web --query 'services[0].{running:runningCount,desired:desiredCount,events:events[0].message}'
DNS=$(aws elbv2 describe-load-balancers --load-balancer-arns $ALB --query 'LoadBalancers[0].DNSName' --output text)
curl -s http://$DNS/ | head -4        # expect the nginx welcome HTML
curl -s -o /dev/null -w "%{http_code}\n" http://$DNS/nope   # expect 404 (fail-closed default)
Try the platform behaviours: scale with update-service --desired-count 4 (watch two new ENIs register), then a rolling deploy — push :v2, register a new revision, update-service --task-definition lab-web:2, and watch deployments go PRIMARY/ACTIVE and back to one.
# 8. Teardown — order matters
aws ecs update-service --cluster lab --service web --desired-count 0
aws ecs delete-service --cluster lab --service web --force
aws elbv2 delete-load-balancer --load-balancer-arn $ALB && sleep 30
aws elbv2 delete-target-group --target-group-arn $TG
aws ec2 delete-security-group --group-id $TASK_SG && aws ec2 delete-security-group --group-id $ALB_SG
aws ecs delete-cluster --cluster lab
aws ecr delete-repository --repository-name lab-web --force
aws logs delete-log-group --log-group-name /ecs/lab-web
aws iam detach-role-policy --role-name labEcsExecRole --policy-arn arn:aws:iam::aws:policy/service-role/AmazonECSTaskExecutionRolePolicy
aws iam delete-role --role-name labEcsExecRole
Common mistakes & troubleshooting
First move in any ECS incident: read the stopped task, not the service page.
aws ecs list-tasks --cluster shopfast-prod --service-name orders --desired-status STOPPED
aws ecs describe-tasks --cluster shopfast-prod --tasks <task-arn> \
  --query 'tasks[0].{reason:stoppedReason,code:stopCode,containers:containers[].{name:name,exit:exitCode,reason:reason}}'
The playbook — symptom to fix:
| # | Symptom | Root cause | Confirm | Fix |
|---|---|---|---|---|
| 1 | Tasks flip PENDING→STOPPED, CannotPullContainerError: … i/o timeout |
Private subnet with no NAT/VPC endpoints to ECR | describe-tasks stoppedReason; route table has no 0.0.0.0/0 or endpoints |
Add ecr.api, ecr.dkr, S3 gateway, logs endpoints (or NAT) |
| 2 | ResourceInitializationError: unable to pull secrets or registry auth |
Execution role missing secretsmanager:GetSecretValue/kms:Decrypt, or no path to the endpoint |
Same query; IAM policy simulator on the execution role | Grant on execution role (not task role); add secretsmanager endpoint |
| 3 | Service creates tasks, ALB kills them ~2 min in; loop forever | Task SG doesn’t allow ALB SG on container port, or health path wrong | TG → Targets: Health status: unhealthy, reason Request timed out (SG) vs 404 (path) |
Ingress sg-alb → sg-svc:8080; point check at /healthz, matcher 200 |
| 4 | Slow-booting app killed before first health pass | healthCheckGracePeriodSeconds = 0 |
Task stops with Task failed ELB health checks; app logs show mid-boot |
Grace period ≥ boot time; container healthCheck.startPeriod too |
| 5 | 502/504 spikes exactly during deploys | App ignores SIGTERM (shell PID 1), or deregistration delay ≫ drain | kubectl-style check: docker inspect entrypoint uses sh -c; ALB 502 timing matches task stop |
exec your process as PID 1; handle SIGTERM; deregistration delay 30–60 s; stopTimeout ≥ drain |
| 6 | Task killed, exit code 137, OutOfMemoryError: container killed due to memory usage |
Task memory hard limit hit (JVM/Node heap not container-aware) | describe-tasks container reason; Container Insights MemoryUtilized at 100% |
Right-size task memory; set -XX:MaxRAMPercentage=75 / --max-old-space-size |
| 7 | orders can’t reach http://catalog:8080 though both run |
Port mapping unnamed, different namespaces, or tasks pre-date Service Connect enablement | aws ecs describe-services … --query 'services[0].serviceConnectConfiguration'; task launch time vs SC enable time |
Name ports, same namespace, --force-new-deployment both services |
| 8 | Random task kills at off-peak; stopCode: SpotInterruption |
Whole service on FARGATE_SPOT | describe-tasks stopCode; capacity provider strategy shows no base |
base=N on FARGATE for the floor; Spot only for interrupt-tolerant workers |
| 9 | Scale-out bursts then RunTask throttles: “reached the limit on … vCPUs” |
Fargate account vCPU quota | Service Quotas console → “Fargate On-Demand vCPU” usage graph | Request quota increase; stagger max_capacity across services |
| 10 | FATAL: too many connections on Aurora as tasks scale |
Per-task pools × task count > max_connections |
Aurora DatabaseConnections metric vs task count |
Cap pools (5–10/task); insert RDS Proxy; scale on requests not CPU |
| 11 | Deploy “succeeds” but old code still serving | Pushed over a mutable tag; task def still pins old digest/tag | describe-task-definition image tag vs ECR image pushed-at |
Immutable tags; new revision per deploy; never redeploy-by-repush |
| 12 | Worker scales to max but queue age still climbs | Visibility timeout < processing time → redelivery storm | ApproximateAgeOfOldestMessage up while NumberOfMessagesReceived ≫ deletes |
Visibility ≥ 6× processing; DLQ maxReceiveCount 3; idempotent handlers |
Error strings you’ll meet in stoppedReason, decoded:
| stoppedReason / stopCode | Meaning | First place to look |
|---|---|---|
CannotPullContainerError … not found |
Image/tag doesn’t exist (typo, race with pipeline) | ECR repo tags |
CannotPullContainerError … 429 Too Many Requests |
Docker Hub rate limit on base image at scale-out | ECR pull-through cache |
ResourceInitializationError … failed to validate logger args |
Log group missing and no create permission | aws logs create-log-group / exec role perms |
Essential container in task exited |
Your app crashed (this is your bug, not ECS) | Container exit code + CloudWatch logs |
Task failed ELB health checks in target-group … |
ALB declared it unhealthy | TG health reason column |
ServiceSchedulerInitiated (stopCode) |
Normal: deploy/scale-in replacement | Nothing — expected |
SpotInterruption (stopCode) |
Fargate Spot reclaim (2-min warning was sent) | Capacity provider mix |
Best practices
- One service = one repo, one task family, one SG, one task role, one dashboard. Uniformity is what makes twelve services operable by three people.
- Pin images by immutable tag and treat task-definition revisions as the deploy ledger — rollback is
update-service --task-definition orders:12, never a rebuild. - Always enable the deployment circuit breaker with rollback — one flag that converts bad deploys from incidents into log lines.
- Health checks must be cheap and honest:
/healthzwithout downstream calls for the ALB; deep dependency checks belong in alarms, not in the thing that kills tasks. - Scale asymmetrically (fast out, slow in), keep
min_capacity≥ 2 across AZs, pre-schedule known peaks. - Run ARM64 (Graviton) by default — ~20% cheaper for a one-line
runtimePlatformchange and a multi-arch build. - FARGATE_SPOT for workers, with a FARGATE
basefor the floor — never 100% Spot for anything user-facing. - Secrets via
secrets[]only, execution role scoped per service, rotation wired to force a new deployment. - Every service gets its own log group with retention set (30–90 days) — unbounded log groups are the silent ₹ leak of container platforms.
- Keep the synchronous call graph ≤ 2 hops; everything else through EventBridge/SQS with DLQs and queue-age alarms.
- Standardize a golden dashboard per service (RunningVsDesired, CPU/mem p95, TG 5xx, p99, deployment events) and stamp it out via IaC.
- Load-test the scaling policy, not just the app — the first flash sale is the wrong time to learn your cooldowns.
Security notes
The security model hangs on separating the two IAM roles and treating every service as its own trust boundary:
| Control | Implementation | Common failure |
|---|---|---|
| Execution role (platform) | ECR pull + logs + specific secret ARNs + KMS decrypt | Wildcard secretsmanager:* shared by all services |
| Task role (app) | Per-service, least privilege (dynamodb:GetItem on one table, sqs:SendMessage on one queue) |
One fat “app role” reused everywhere |
| Network | Private subnets, assignPublicIp=DISABLED, SG-to-SG references, VPC endpoints |
Tasks in public subnets “temporarily”, forever |
| Edge | WAF managed rules + rate limiting on the ALB; TLS 1.2+ policy on the listener | WAF in count mode since launch day |
| Images | ECR scan-on-push (Inspector), immutable tags, minimal distroless/alpine bases, non-root USER |
Root containers with a full OS + shells |
| Data | KMS CMKs on Aurora/DynamoDB/SQS/secrets; RDS Proxy IAM auth removes DB passwords | Default keys everywhere, passwords in env vars |
| Exec access | aws ecs execute-command (SSM-based) with CloudTrail + logging on the cluster |
SSH-ish sidecars, or ECS Exec enabled with no audit |
| Runtime threat detection | GuardDuty Runtime Monitoring for ECS/Fargate | No visibility into what runs inside tasks |
Fargate itself removes a whole class of concerns — no shared kernel between tenants (per-task micro-VM), no host agents to patch, task roles served from a task-scoped endpoint. The residual risk is almost entirely your image, your IAM scoping, and your egress rules.
Cost & sizing
Fargate bills per second (1-minute minimum) on task-level vCPU and memory. On-demand Linux in us-east-1 (Mumbai runs a few percent higher):
| Pricing lever | Rate (us-east-1, indicative) | Note |
|---|---|---|
| vCPU-hour (x86) | $0.04048 | The dominant term |
| GB-hour (x86) | $0.004445 | Memory is ~9× cheaper than vCPU |
| vCPU-hour (ARM64/Graviton) | $0.03238 | ~20% saving for a config line |
| GB-hour (ARM64) | $0.00356 | — |
| Fargate Spot | ~70% below on-demand | 2-min interruption warning; workers only |
| Ephemeral storage | First 20 GiB free; ~$0.000111/GiB-hr beyond | Rarely material |
| Compute Savings Plans | Apply to Fargate (rates vary by term) | Commit only to your measured baseline |
| ALB | ~$0.0225/hr + LCUs | Shared across all services — a platform win |
| NAT vs endpoints | NAT $0.045/hr + $0.045/GB; endpoint $0.01/hr/AZ | Image pulls through NAT add up |
The reference stack priced (on-demand x86, 730 hrs/month):
| Component | Shape | Monthly (USD) | Monthly (≈INR @ ₹88) |
|---|---|---|---|
| orders ×3 | 0.5 vCPU / 1 GB each | 1.5×$29.55 + 3×$3.24 = $54.05 | ₹4,760 |
| catalog ×2 | 0.5 vCPU / 1 GB | $36.03 | ₹3,170 |
| billing worker ×1 (Spot) | 0.25 vCPU / 0.5 GB | ≈ $2.40 | ₹210 |
| ALB | base + modest LCU | ≈ $22 | ₹1,940 |
| Compute + LB total | (before autoscaling headroom) | ≈ $115 | ≈ ₹10,100 |
Switch the APIs to ARM64 and the compute line drops ~20% (≈ $92/₹8,100). Always-on EC2 sized for peak (say 6 × m5.large) would run ~$420/month — Fargate wins not on unit price but because baseline is small and peak is rented by the minute.
Right-sizing rules: read Container Insights p95 CPU/memory after two weeks — CPU p95 < 25% means halve the vCPU tier (tune JVM MaxRAMPercentage before trusting memory graphs). The costs that sneak up: CloudWatch log ingestion ($0.50–0.67/GB dwarfs task cost for chatty debug logging), NAT data processing on image-heavy deploy days, and enhanced Container Insights on high-cardinality clusters.
Interview & exam questions
Mapped to AWS SAA-C03, DVA-C02, and DOP-C02:
-
Q: Task definition vs task vs service — what does each own? A: The task definition is the immutable versioned blueprint (image, CPU/mem, ports, roles, secrets). A task is one running copy with its own ENI. A service is the controller keeping
desiredCounttasks healthy, registering them with target groups, and orchestrating deployments between task-definition revisions. -
Q: Why does Fargate require awsvpc mode, and what’s the practical consequence? A: There’s no host to bridge through — each task gets its own ENI and private IP. Consequences: security groups apply per task (per service), target groups use
iptargets, and each task consumes a subnet IP, so subnets must be sized for peak task count. -
Q: Execution role vs task role — a task fails with
ResourceInitializationError: unable to pull secrets. Which role and why? A: The execution role — it’s what the ECS agent uses before your code runs: ECR pull, CloudWatch log delivery, and resolvingsecrets[]. The task role is assumed by your application code for its AWS calls (S3, SQS, DynamoDB). Secrets-at-start failures are always execution-role (or endpoint/network) issues. -
Q: When would you pick the EC2 launch type over Fargate? A: GPUs or special instance types, daemon-set-style agents, privileged containers, very large steady-state fleets where high utilization plus Savings Plans beats Fargate’s premium, or >200 GiB local storage. Otherwise Fargate’s zero node-ops usually wins.
-
Q: How does ALB path-based routing decide which microservice gets a request? A: The listener evaluates rules in ascending priority; the first rule whose conditions (path/host/header/query/source-IP, up to 5 values each) all match forwards to its target group. No match hits the default action — which should be a fixed 404, not a real service.
-
Q: What is ECS Service Connect and how does it differ from plain Cloud Map service discovery? A: Cloud Map DNS just publishes task IPs as A/SRV records — clients cache TTLs and get no retries or metrics. Service Connect injects an ECS-managed sidecar proxy that resolves namespace aliases (
catalog:8080), load-balances across healthy tasks, retries, drains connections during deploys, and emits per-route CloudWatch metrics. -
Q: Explain the ECS deployment circuit breaker. A: During a rolling deploy, if newly launched tasks repeatedly fail to reach steady state (threshold = 50% of desired count, min 3 max 200 failures), ECS marks the deployment FAILED and, with
rollback=true, automatically redeploys the last steady-state task definition — no human in the loop. -
Q: How do blue/green ECS deployments with CodeDeploy achieve near-instant rollback? A: CodeDeploy provisions the full green task set on a second target group, optionally exposes it on a test listener, shifts production listener traffic per the deployment config (canary/linear/all-at-once), and keeps blue running through the bake window — rollback is re-pointing the listener at blue, seconds not minutes.
-
Q: Your API is I/O-bound and CPU-based autoscaling never triggers. What do you scale on? A:
ALBRequestCountPerTargettarget tracking — it measures demand directly. For queue workers, scale on backlog per task (visible messages ÷ running tasks) as a custom metric; for known peaks add scheduled scaling. -
Q: A secret was rotated in Secrets Manager but tasks still use the old password. Why? A: ECS resolves
secrets[]once at task start and injects env vars; running tasks never re-read. You must force a new deployment (or have the app fetch from the API at runtime). Production rotation flows triggerupdate-service --force-new-deploymentfrom the rotation Lambda. -
Q: What breaks first when you scale a Fargate service from 3 to 50 tasks? A: In practice: subnet IP capacity (50 ENIs), the Fargate account vCPU quota, downstream DB connections (pools × tasks), and any Docker Hub-based image pulls hitting rate limits — which is why endpoints, RDS Proxy, quota monitoring, and ECR pull-through caches are part of the reference design.
Quick check
- Which two AWS-managed touchpoints must the execution role reach for a task using Secrets Manager secrets and
awslogs? - Default
minimumHealthyPercent/maximumPercentfor a rolling deployment — and what do they mean for a 4-task service? - Name the three requirements for
http://catalog:8080to resolve via Service Connect. - A task stops with exit code 137. What happened and what are the two standard fixes?
- Which metric would you use to autoscale (a) an I/O-bound API and (b) an SQS worker?
Answers
- Secrets Manager (
GetSecretValue, plus KMS decrypt) and CloudWatch Logs (CreateLogStream/PutLogEvents) — reachable via NAT or thesecretsmanagerandlogsVPC endpoints. - 100% / 200%: ECS may launch up to 4 extra tasks (8 total) during the deploy but never lets healthy count drop below 4.
- A named
portMappingin the task definition, both services attached to the same Cloud Map namespace with the server declaring thecatalog:8080client alias, and tasks (re)launched after Service Connect was enabled. - OOM kill — the container hit the task memory hard limit. Fix by right-sizing task memory and making the runtime container-aware (
-XX:MaxRAMPercentage,--max-old-space-size). - (a)
ALBRequestCountPerTargettarget tracking; (b) backlog per task —ApproximateNumberOfMessagesVisibledivided by running task count, published as a custom metric.
Glossary
- Task definition: Versioned JSON blueprint for a task — images, CPU/memory, ports, roles, secrets, logging.
- Task: A running instantiation of a task definition; one ENI; the unit of failure and billing.
- Service: ECS controller maintaining
desiredCounttasks, wiring load balancers, running deployments. - Fargate: Serverless compute engine for containers — per-task micro-VM, billed vCPU/GB-seconds.
- Capacity provider: Strategy target for where tasks land (
FARGATE,FARGATE_SPOT, EC2 ASGs) withbase/weight. - awsvpc mode: Network mode giving each task its own ENI, private IP, and security groups.
- Target group: ALB construct holding registered task IPs and the health checks that gate traffic.
- Cloud Map: AWS service-discovery registry (DNS/HTTP namespaces) underpinning Service Connect.
- Service Connect: ECS-managed sidecar proxy providing stable service names, retries, draining, and traffic metrics.
- Execution role: IAM role the ECS agent uses to pull images, fetch secrets, and write logs before app start.
- Task role: IAM role the application code assumes for its own AWS API calls.
- Deployment circuit breaker: Rolling-deploy guard that fails and optionally auto-rolls-back bad revisions.
- Deregistration delay: Grace window (default 300 s) in which the ALB lets in-flight requests finish before a target fully leaves.
- DLQ (dead-letter queue): SQS queue receiving messages after
maxReceiveCountfailed processing attempts.
Next steps
- Wire up the hands-on foundation first if you haven’t: Your first container deployment — ECS & Fargate basics, then the production drill-down in ECS Fargate task networking, autoscaling and deployments.
- Still weighing runtimes? Work through ECS vs EKS vs Fargate: choose your container path with this article’s cost tables beside it.
- Go deeper on the edge tier — listener rules, TLS policies, and when API Gateway replaces path routing — in ALB vs NLB vs API Gateway compared.
- Solidify the network substrate (subnet sizing for ENI-per-task, SG referencing) with AWS VPC, subnets and security groups explained.
- Extend the async backbone with Lambda event-driven patterns and pick per-service stores confidently with RDS vs DynamoDB vs Aurora compared.