You open the Logs blade, type the table name you expect — AzureDiagnostics, AppServiceHTTPLogs, Syslog, Heartbeat — hit Run, and Azure replies with the four words every engineer dreads mid-incident: “No results found.” The deployment was fine. The resource is clearly running and serving traffic. Yet Log Analytics — the workspace that is supposed to be the single place your logs land so you can query them with KQL (Kusto Query Language) — shows an empty table, or a table that simply does not exist. This is the single most common Azure Monitor support question, and it is maddening precisely because nothing errored: there is no red banner, no failed deployment, just silence where your data should be.
Here is the mental model that unlocks every fix. Logs do not magically appear in a workspace. They travel a pipeline: a source (an Azure resource, a VM, a custom app) emits signal, something is told to collect it (a diagnostic setting on the resource, or a Data Collection Rule for agent-based logs), it is routed to a destination (your specific workspace), it is ingested (which takes a few minutes), and only then does it become a row in a table you can query. An empty table means the chain broke at exactly one hop — and 90% of the time it is the most boring one: nobody ever turned collection on, or it was pointed at a different workspace than the one you are querying.
By the end you will stop refreshing the query and hoping. You will know how to walk that pipeline hop by hop, confirm with one exact command which link is broken, and fix it — whether the cause is a missing diagnostic setting, a Data Collection Rule that does not target your machine, an agent that never reported in, a query aimed at the wrong workspace or the wrong time range, normal ingestion latency, or a daily cap that quietly stopped ingestion at 2 p.m. This is a foundational skill: every alert, dashboard and investigation you build sits on top of data actually arriving in the workspace.
What problem this solves
Azure Monitor hides a real pipeline behind a friendly Logs blade. That abstraction is a gift — you write KQL and get answers — right up until the table is empty, at which point the friendliness becomes a wall. The blade does not tell you why there is no data. It cannot, because “no data” is not an error; it is the correct response to a query against a table that has nothing in it. The information you need is real and discoverable, but it lives in five or six different blades, and if you do not know which blade maps to which break you will spend an hour clicking.
What goes wrong without this knowledge is predictable. An engineer assumes the resource is broken and restarts things that were fine. They open a support ticket and wait two days to be told diagnostic settings were never enabled. Worst of all, they build an alert on a table that has no data, the alert never fires, and a real incident sails through undetected — because a monitoring gap is invisible until the moment you needed it. Meanwhile the actual cause — a setting pointed at a decommissioned workspace, an agent that stopped reporting an hour ago, or a daily cap that capped at noon — sits there, perfectly diagnosable, ignored.
Who hits this? Almost everyone, early. It bites hardest on first-time setups (you enabled metrics but expected logs), on virtual-machine and AKS logging where the Azure Monitor Agent (AMA) plus a Data Collection Rule must both be correct, on multi-workspace tenants where it is easy to query the wrong one, and on cost-capped subscriptions where a daily cap stops ingestion to protect the bill. The fix is almost never “the platform is down.” It is “find the hop in the pipeline that is silent and make it speak.”
To frame the whole field before the deep dive, here is every way “no data” happens, the question it forces, and the first place to look:
| Symptom class | What it really means | First question to ask | First place to look |
|---|---|---|---|
| Table doesn’t exist at all | Nothing of that type has ever been ingested here | Was collection ever enabled to this workspace? | Diagnostic settings / DCR on the source |
| Table exists but empty for your range | Data arrived once, but not in the window you queried | Is my time range right, and is data recent? | The time picker + a take 10 with no filter |
| Logs missing, metrics present (or vice-versa) | You enabled one category, expected the other | Did I tick the log categories, not just metrics? | The diagnostic setting’s checked categories |
| VM/AKS logs absent | Agent not installed, or DCR doesn’t target the host | Is the agent reporting, and does a DCR include it? | Heartbeat table + DCR associations |
| Data was flowing, then stopped | Ingestion was cut — cap, deletion, or agent down | Did it stop at a clock time, or trail off? | Daily cap status + Usage / Heartbeat |
| Recent logs missing, old ones present | Normal ingestion latency, not a fault | Is the gap only the last few minutes? | Wait, then re-query; check _TimeReceived |
Learning objectives
By the end of this article you can:
- Explain the Log Analytics ingestion pipeline end to end — source → diagnostic setting / DCR → workspace → ingestion → table — and name what breaks at each hop.
- Confirm in under a minute whether a table is empty because collection was never enabled, because you queried the wrong workspace, or because of normal ingestion latency.
- Tell the difference between metrics and logs in Azure Monitor and stop expecting one when you enabled the other.
- Diagnose VM and AKS “no logs” cases using the
Heartbeattable and Data Collection Rule associations, and know when the Azure Monitor Agent is the problem. - Detect a daily cap or retention-driven data stop and read
_TimeReceivedto separate ingestion delay from a genuine gap. - Drive the core tools fluently: the Logs blade,
az monitor diagnostic-settings,az monitor data-collection rule, theUsage/Heartbeat/_LogOperationtables, and the workspace Insights view. - Work a symptom-to-cause-to-fix playbook during a real incident, and avoid the common traps (right table, wrong workspace; metrics not logs; cap hit at noon).
Prerequisites & where this fits
You should know what a Log Analytics workspace is — the regional Azure resource that stores log data in tables you query with KQL — and roughly what a resource group and a subscription are. You should be able to open Cloud Shell or run az locally, read JSON output, and open a blade in the portal. A first taste of KQL helps but is not required; every query here is short and explained. If you have never created a workspace, start with Create and Design a Log Analytics Workspace with RBAC and come back.
This sits at the very base of the Observability & Troubleshooting track — it is the thing that must work before anything else does. It assumes the data-platform mental model from Azure Monitor Data Platform: Metrics, Logs & Traces, and the metrics-versus-logs distinction from Azure Monitor Metrics vs Log Analytics: When to Use Which. Once data reliably lands, the natural next step is Azure Monitor & Application Insights for Observability, where you build alerts and dashboards on top of it. If your missing logs are application telemetry (App Insights) rather than platform logs, that article is the better starting point.
A quick map of who owns each hop, so you call the right person fast during an incident:
| Pipeline hop | What lives here | Who usually owns it | “No data” failure it causes |
|---|---|---|---|
| Source resource | The thing emitting logs (App Service, VM, NSG…) | App / platform team | Logs simply not produced (feature off) |
| Diagnostic setting | “Send these categories to that workspace” | Platform / IaC owner | Never enabled, or wrong workspace/category |
| Data Collection Rule | Agent-based collection (VM/AKS Syslog, perf) | Platform / SRE | DCR missing, wrong target, wrong stream |
| Azure Monitor Agent | The agent on the VM/host | VM owner / SRE | Agent not installed or not reporting |
| Workspace | Where data lands and is queried | Observability owner | Querying the wrong workspace |
| Ingestion + cap | The pipeline + cost guardrail | Platform / FinOps | Latency mistaken for loss; cap stopped it |
Core concepts
Five mental models make every later diagnosis obvious.
An empty table is the correct answer to “show me data that isn’t here.” A KQL query against a table with no matching rows is not an error — it succeeded and found nothing. So your job is never “why did the query fail” (it did not); it is “why is there nothing for it to find.” That reframing stops half the wasted effort: you stop debugging the query and start debugging the pipeline that should have filled the table.
Logs are pulled into the workspace by configuration, not by default. Creating a resource does not start sending its logs anywhere. For most Azure PaaS resources you add a diagnostic setting that says “send these log categories and/or metrics to this workspace.” For machines (VMs, Arc servers, AKS nodes) you install the Azure Monitor Agent and attach a Data Collection Rule (DCR) that says “collect Syslog/perf/events and send them to this workspace.” No setting, no DCR — no data, forever, with no error.
Metrics and logs are two different pipelines that look similar in the portal. Metrics are pre-aggregated numeric time-series (CPU %, request count) in a separate store, queried in the Metrics blade and retained ~93 days automatically — they exist for most resources without any diagnostic setting. Logs are richer, schema’d records stored as table rows in Log Analytics, and they require collection to be turned on. A huge fraction of “no data” tickets are someone looking for logs when they only enabled metrics (or expecting CPU as a log row when it is a metric).
The destination is a specific workspace, and tenants often have several. A diagnostic setting routes to one named workspace resource ID. With a law-prod, a law-shared and an old law-poc around, it is easy to send logs to one and query another — empty in the one you are looking at, full in the one you forgot. “Right table, wrong workspace” is one of the top two causes here.
Ingestion takes minutes, and a cap can stop it. Even when everything is wired correctly, data takes a few minutes to go from event to queryable row, sometimes longer under load — so a query for “the last 5 minutes” can legitimately return nothing. Separately, a daily cap (a deliberate cost guardrail) halts ingestion for the rest of the UTC day once a configured volume is hit, so data flows all morning then vanishes at a clock time. Both look like “loss” and neither is a fault.
The vocabulary in one table
Before the deep sections, pin down every moving part. The glossary repeats these for lookup; this is the model side by side:
| Concept | One-line definition | Where it lives | Why it matters to “no data” |
|---|---|---|---|
| Log Analytics workspace | The regional store you query with KQL | Subscription / resource group | Query the wrong one → empty table |
| Table | A typed collection of log rows (e.g. Syslog) |
Inside a workspace | Missing table = never ingested here |
| Diagnostic setting | “Send these categories to that workspace” | On the source resource | Off / wrong target → no platform logs |
| Log category | One stream a resource can emit (e.g. HTTPLogs) |
In the diagnostic setting | Unchecked category → that table stays empty |
| Data Collection Rule (DCR) | Agent-based “collect X, send to Y” | Standalone resource + associations | Missing/mis-targeted → no VM/AKS logs |
| Azure Monitor Agent (AMA) | The agent on a VM/Arc/AKS host | On the machine | Not installed/reporting → no agent logs |
Heartbeat |
A per-agent “I’m alive” row every minute | A workspace table | No rows → agent down or not connected |
| Metrics | Pre-aggregated numeric time-series | Separate metrics store | Looking here for logs (or vice-versa) |
| Ingestion latency | Delay from event to queryable row | The pipeline | Recent gap is delay, not loss |
_TimeReceived |
When the workspace received the row | Hidden column on rows | Reveals delay vs TimeGenerated |
| Daily cap | Volume limit that halts ingestion for the day | Workspace setting | Hit at noon → afternoon “loss” |
| Retention | How long rows are kept before purge | Per-table / workspace | Old data gone by design, not lost |
The ingestion pipeline, hop by hop
Everything in this article is “which hop broke.” So fix the picture first. A log row travels five hops to become queryable:
- Source emits — a resource (or app, or VM process) produces a log event. Some sources need a feature switched on first (a storage account does not log every read by default).
- Collection is configured — a diagnostic setting for resource logs, or a Data Collection Rule read by the agent for machine logs. This is the hop that is simply missing in most “no data” cases.
- Routed to a destination — the setting/DCR names exactly one workspace (you can also route to Storage or Event Hub, which does not make data queryable in Log Analytics).
- Ingested — the platform validates, batches and writes the row. This takes minutes and can be halted by a daily cap.
- Queryable as a table row — only now does
SomeTable | take 10return it, and only within the table’s retention window.
Map each hop to the failure it causes and the one command that confirms it — this single table is the backbone of the whole playbook:
| Hop | Break here looks like… | Confirm with (one move) | Typical fix |
|---|---|---|---|
| 1 Source emits | Table empty even with collection on; feature not producing logs | Check the resource’s logging feature (e.g. storage logging, NSG flow logs) | Enable the source feature, not just the sink |
| 2 Collection configured | Table never existed in this workspace | az monitor diagnostic-settings list (resource) / DCR list |
Add the diagnostic setting / DCR with the right categories |
| 3 Routed to destination | Logs land somewhere, just not here | Read workspaceId in the diagnostic setting JSON |
Point the setting at the workspace you query |
| 4 Ingested | Flow stops at a clock time, or nothing despite config | Daily-cap status; _LogOperation warnings |
Raise/relax cap; fix the broken rule |
| 5 Queryable (retention/latency) | Recent gap, or old data gone | _TimeReceived vs TimeGenerated; table retention |
Wait out latency; extend retention |
Two reading notes that save the most time, because they catch the traps that masquerade as “no data”:
| Trap | Why it fools you | How to tell instantly |
|---|---|---|
| Right table, wrong workspace | The table is full — elsewhere | Run print w = strcat(workspace_resource_id) is not a thing; instead check the workspace name in the Logs scope selector, then list diagnostic settings’ workspaceId and compare |
| Latency, not loss | The last few minutes are always thin | Re-run after 5–10 min; add ` |
Cause 1 — Collection was never enabled (the missing diagnostic setting)
This is the number-one cause and the most boring: nobody ever told the resource to send its logs. For Azure PaaS resources (App Service, Key Vault, SQL, NSGs, storage, and dozens more), platform/resource logs flow only if a diagnostic setting exists on that resource pointing at your workspace. With no setting, the corresponding table — AppServiceHTTPLogs, KeyVaultAuditEvent, AzureDiagnostics — never gets created, so a query against it returns “no results” or an unknown-table error.
Confirm. List the diagnostic settings on the exact resource. Empty output means none exist:
# Replace with your resource's full ID (any Azure resource works)
RES_ID=$(az webapp show -n app-shop-prod -g rg-shop-prod --query id -o tsv)
az monitor diagnostic-settings list --resource "$RES_ID" \
  --query "value[].{name:name, ws:workspaceId, logs:logs[?enabled].category, metrics:metrics[?enabled]}" -o jsonc
If value is [], collection was never configured — that is your answer. In the portal the same check is the resource → Monitoring → Diagnostic settings: an empty list, or a setting whose Destination details do not include “Send to Log Analytics workspace,” is the smoking gun.
Fix. Create a diagnostic setting that sends the log categories you want to your workspace. Note the distinction the next section labours: enabling metrics here does not populate log tables.
WS_ID=$(az monitor log-analytics workspace show -g rg-monitor -n law-prod --query id -o tsv)
az monitor diagnostic-settings create \
  --name to-law-prod \
  --resource "$RES_ID" \
  --workspace "$WS_ID" \
  --logs '[{"category":"AppServiceHTTPLogs","enabled":true},{"category":"AppServiceConsoleLogs","enabled":true}]' \
  --metrics '[{"category":"AllMetrics","enabled":true}]'
In Bicep, attach the setting to the resource so it is reproducible and never “accidentally off”:
resource diag 'Microsoft.Insights/diagnosticSettings@2021-05-01-preview' = {
  name: 'to-law-prod'
  scope: webApp                          // the resource emitting logs
  properties: {
    workspaceId: law.id                  // the workspace you actually query
    logs: [
      { category: 'AppServiceHTTPLogs', enabled: true }
      { category: 'AppServiceConsoleLogs', enabled: true }
    ]
    metrics: [ { category: 'AllMetrics', enabled: true } ]
  }
}
After saving, wait a few minutes (hop 4 — ingestion) before the table appears. A frequent follow-up confusion: many resources expose resource-specific tables (e.g. AppServiceHTTPLogs) and the legacy catch-all AzureDiagnostics table. If you queried one but the setting writes to the other, you see “no data” while data is arriving in the sibling table. The diagnostic setting’s collection mode (resource-specific vs Azure diagnostics) decides which.
The category-to-table mismatches that most often produce a phantom empty table:
| You queried | But the data may be in | Why |
|---|---|---|
AzureDiagnostics |
AppServiceHTTPLogs / resource-specific table |
Setting uses resource-specific mode |
AppServiceHTTPLogs |
AzureDiagnostics |
Setting uses legacy Azure-diagnostics mode |
| A log table | Metrics blade | You enabled AllMetrics, not log categories |
Syslog (Linux) |
Event (this is Windows only) |
Wrong OS stream queried |
ContainerLogV2 |
ContainerLog (legacy) |
AKS Container Insights schema version differs |
Cause 2 — You enabled metrics but expected logs (or vice-versa)
Azure Monitor has two data pipelines that look almost identical in the diagnostic-settings UI, so it is easy to tick the wrong checkbox. Metrics are numeric, pre-aggregated, live in a separate store, are visible in the Metrics blade, and exist for most resources automatically with ~93-day retention. Logs are events/records, live as rows in Log Analytics tables, are queried with KQL in the Logs blade, and only exist once a log category is collected. Expecting one in the other’s home is a guaranteed empty result.
Confirm. Look at which boxes are actually enabled in the setting — logs vs metrics — versus where you are querying:
az monitor diagnostic-settings list --resource "$RES_ID" \
  --query "value[].{name:name, enabledLogs:logs[?enabled].category, enabledMetrics:metrics[?enabled].category}" -o jsonc
If enabledLogs is empty but enabledMetrics has AllMetrics, you turned on metrics only — and any KQL query for log rows will be empty by design. Conversely, if you are hunting for CPU% as a table row in Logs, it lives in Metrics, not a log table (unless you deliberately route platform metrics into the workspace, where they appear in AzureMetrics).
Fix. Decide what you actually need and enable the matching side. For log analysis (audit events, request logs, traces), enable the relevant log categories. For numeric trends and alerts, use Metrics directly (no setting needed) or route AllMetrics to the workspace if you specifically want to KQL-join metrics with logs. The decision in one grid:
| You want to… | It’s a… | Enable / use | Query where |
|---|---|---|---|
| See HTTP request logs, audit events | Log | Log categories in the diagnostic setting | Logs blade (KQL), the resource-specific table |
| Chart CPU %, request count over time | Metric | Nothing — metrics exist by default | Metrics blade |
| Alert on a numeric threshold cheaply | Metric | Metric alert on the resource | (Alert rule) |
| KQL-join a metric against log events | Metric-in-logs | Route AllMetrics to the workspace |
Logs blade, AzureMetrics table |
| Long-term metric history beyond ~93 days | Metric-in-logs | Route AllMetrics to the workspace |
Logs blade, AzureMetrics |
For the field-level differences that explain why one place is empty when the other is full:
| Aspect | Metrics | Logs (Log Analytics) |
|---|---|---|
| Shape | Numeric time-series, pre-aggregated | Schema’d rows (text + numbers) |
| Default collection | Yes, for most resources | No — must enable a log category / DCR |
| Where queried | Metrics blade (chart) | Logs blade (KQL) |
| Default retention | ~93 days | Per-table (commonly 30 days free, extendable) |
| Latency | Near-real-time (seconds) | Minutes (ingestion pipeline) |
| Cost model | Included / cheap | Billed per GB ingested |
Cause 3 — Right table, wrong workspace (or wrong time range)
You are querying a real, populated table — just not in the place you are looking, or not in the window you picked. Two distinct traps live here and both are extremely common, so treat them as the first thing you rule out before assuming a deeper break.
Wrong workspace
A diagnostic setting routes to one specific workspace. In a tenant with several workspaces, the Logs blade scope might be set to law-shared while the setting sends to law-prod. The table is genuinely empty where you are standing and genuinely full one workspace over.
Confirm. Compare the workspace your setting targets against the workspace your query is scoped to. Read the target from the setting:
az monitor diagnostic-settings list --resource "$RES_ID" \
  --query "value[].{name:name, workspaceId:workspaceId}" -o jsonc
# Note the workspace resource ID, then confirm which workspace the Logs blade is scoped to
In the portal, the Logs blade shows the scope (workspace name) at the top-left; make sure it matches the workspaceId the setting writes to. A fast cross-check from inside any workspace — list what is arriving, so you immediately see whether you are in a live or a dead workspace:
// Which tables have received data here in the last day, and how recently
union withsource=Table *
| where TimeGenerated > ago(1d)
| summarize Rows = count(), Latest = max(TimeGenerated) by Table
| order by Latest desc
If your expected table is absent from that list but present when you switch workspaces, you have found it. (Run this sparingly on large workspaces — it scans every table.)
Wrong time range
The Logs blade has a time picker that defaults to a recent window (often 24 hours) and silently overrides any time filter unless you set the query to honour it. If your data is older than the picker’s window — or the picker is set to “last 30 minutes” while ingestion lags — you get nothing.
Confirm and fix. Strip the time filter and just look:
// Ignore the time picker mentally — is there ANY data, ever?
AppServiceHTTPLogs
| take 10
// What is the freshest and oldest row actually present?
AppServiceHTTPLogs
| summarize Oldest = min(TimeGenerated), Newest = max(TimeGenerated), Rows = count()
If take 10 returns rows but your filtered query did not, the time range (picker or where TimeGenerated > ...) was the culprit. Widen the picker to “Custom → last 7 days,” or align your where clause to where the data actually is. The pitfalls in one table:
| Time-range pitfall | Symptom | Fix |
|---|---|---|
| Picker set too narrow | Empty for “last 30 min”, full for “last 24 h” | Widen the time picker |
| Data older than picker | Historic data invisible | Custom range covering the data’s age |
Picker overrides where |
Query’s own filter ignored | Set picker to “Set in query” or widen it |
| Future/clock-skew rows | Rows with TimeGenerated ahead of now |
Check source clock; query by _TimeReceived |
| Latency on newest data | Last few minutes thin | Wait, or query ago(15m) not ago(2m) |
Cause 4 — VM and AKS logs: the agent and the Data Collection Rule
Machine logs (Linux Syslog, Windows Event, performance counters, AKS container logs) do not use diagnostic settings. They use the Azure Monitor Agent (AMA) plus a Data Collection Rule (DCR) the agent reads to know what to collect and where to send it. Three things must all be true: the agent is installed and reporting, a DCR exists with the right stream, and that DCR is associated with your machine. Miss any one and the table stays empty with no error.
Confirm — is the agent even alive? The Heartbeat table gets one row per agent per minute. No recent heartbeat from your host means the agent is down, not installed, or cannot reach the workspace — and nothing else will arrive either:
// Did this machine report in the last 15 minutes?
Heartbeat
| where TimeGenerated > ago(15m)
| summarize LastSeen = max(TimeGenerated) by Computer, Category, Version
| order by LastSeen desc
If your computer is absent, fix the agent first (everything downstream depends on it). Check the extension is provisioned:
# Is the Azure Monitor Agent extension installed and healthy on the VM?
az vm extension list -g rg-app -n vm-web01 \
  --query "[?contains(name,'AzureMonitor')].{name:name, state:provisioningState}" -o table
Confirm — does a DCR target this machine and collect this stream? Even a healthy agent collects nothing without an associated DCR. List the rules and their associations:
# DCRs in the resource group
az monitor data-collection rule list -g rg-monitor \
  --query "[].{name:name, streams:dataSources}" -o jsonc

# Which DCRs are associated with this specific VM?
az monitor data-collection rule association list \
  --resource "$(az vm show -g rg-app -n vm-web01 --query id -o tsv)" \
  --query "value[].{assoc:name, ruleId:dataCollectionRuleId}" -o jsonc
If the association list is empty, the agent has no instructions for this host — that is the break. If a DCR is associated but you collect, say, Linux Syslog facility auth only and your logs are on daemon, the stream filter is excluding them.
Fix. Install/repair the agent, create a DCR with the correct data source, and associate it with the machine. For AKS, Container Insights wires AMA and a DCR for you when you enable monitoring on the cluster — ContainerLogV2 is the modern table. The agent-path failure modes in one table:
| Symptom | Root cause | Confirm | Fix |
|---|---|---|---|
Heartbeat has no rows for the host |
AMA not installed / not running | az vm extension list (no AzureMonitorLinuxAgent/WindowsAgent) |
Install AMA extension; restart agent |
Heartbeat present, but Syslog/Perf empty |
No DCR associated, or wrong stream | DCR association list empty; check data sources | Create + associate a DCR with the right stream |
| Heartbeat stops at a clock time | Agent crashed, machine off, or network block | Heartbeat last TimeGenerated; VM power state |
Restart VM/agent; check outbound to the workspace |
| Some VMs report, others do not | DCR associated to a subset | Compare associations across hosts | Associate the DCR (or a DCR rule) with all hosts |
AKS: no ContainerLogV2 |
Container Insights not enabled | az aks show --query addonProfiles.omsagent |
Enable monitoring add-on on the cluster |
| Linux logs partial | Syslog facility/severity filtered out | DCR Syslog data-source filters | Widen the facility/severity in the DCR |
If your cluster work continues from here, Azure AKS Cluster Architecture: Control Plane vs Data Plane explains where the node agents and add-ons actually run.
Cause 5 — It was flowing, then stopped: caps, deletion and latency
A different shape of problem: data was arriving, then was not. The tell is timing — did it stop abruptly at a clock time (a cap), trail off (an agent going quiet), or is the “gap” only the most recent few minutes (latency)? Read the timing and the cause is usually obvious.
Daily cap reached
A daily cap is a deliberate cost guardrail: once the workspace ingests its configured daily volume, it stops ingesting most data for the rest of the UTC day and resumes at the next reset. So dashboards fill all morning and flatline at, say, 13:40 every day — working as designed to protect the bill, but silently creating a monitoring blind spot.
Confirm. Check whether a cap is set and whether it has been hit. The _LogOperation table records cap events; the workspace’s data-cap status shows the configured limit:
# Is a daily cap configured on the workspace? (dailyQuotaGb = -1 means no cap)
az monitor log-analytics workspace show -g rg-monitor -n law-prod \
  --query "{capGb:workspaceCapping.dailyQuotaGb, resetTime:workspaceCapping.quotaNextResetTime, state:workspaceCapping.dataIngestionStatus}" -o jsonc
// Operational events: look for daily-cap warnings/reached in the last 3 days
_LogOperation
| where TimeGenerated > ago(3d)
| where Category == "Ingestion" or Detail has "cap"
| project TimeGenerated, Operation, Level, Detail
| order by TimeGenerated desc
A dataIngestionStatus of OverQuota (or cap events in _LogOperation) at the time your data stopped is the confirmation. Note Heartbeat may keep arriving even when the cap is hit (security and a few operational data types can be exempt), which is why “metrics/heartbeat fine but my logs stopped at noon” points straight at the cap.
Fix. Raise or remove the cap if the data matters more than the saving, and — better — reduce what you ingest so you stay under a sane cap (drop noisy categories, use cheaper table plans). Always pair a cap with an alert so a hit is loud, not silent:
# Raise the daily cap to 10 GB/day (or set -1 to remove it)
az monitor log-analytics workspace update -g rg-monitor -n law-prod --quota 10
Retention expiry
If your recent data is present but old data is gone, that is retention doing its job, not loss. Each table has a retention period (commonly 30 days on the free tier, extendable up to two years); rows older than that are purged. Querying a 60-day-old incident on a 30-day table returns nothing — correctly.
# Per-table retention (interactive retention in days)
az monitor log-analytics workspace table show -g rg-monitor -n law-prod \
  --name AppServiceHTTPLogs --query "{table:name, retentionDays:retentionInDays, totalDays:totalRetentionInDays}" -o jsonc
Latency, not loss
The most over-reported “gap” is the trailing edge: the last few minutes are always sparse because that data is still ingesting. The fix is patience and reading the right column. TimeGenerated is when the event happened; the hidden _TimeReceived is when the workspace got it — the difference is the lag.
// How far behind is the newest data right now?
AppServiceHTTPLogs
| where TimeGenerated > ago(30m)
| extend lagSeconds = datetime_diff('second', _TimeReceived, TimeGenerated)
| summarize p50 = percentile(lagSeconds, 50), p95 = percentile(lagSeconds, 95), newest = max(TimeGenerated)
If newest is a few minutes behind “now” and the lag percentiles are small, there is no gap — just normal ingestion delay. The “it stopped” decision table:
| If the data stopped… | It’s probably… | Do this |
|---|---|---|
| Abruptly at the same clock time daily | Daily cap reached | Check cap status; raise cap or cut volume |
| Trailing off / one host went quiet | Agent or source stopped | Check Heartbeat / source health |
| Only the last few minutes are thin | Ingestion latency (normal) | Wait; query _TimeReceived; widen window |
| Old data gone, recent data fine | Retention expiry (by design) | Extend table retention if needed |
| Everything stopped right after a change | A setting/DCR was removed or repointed | Diff the diagnostic setting / DCR config |
Architecture at a glance
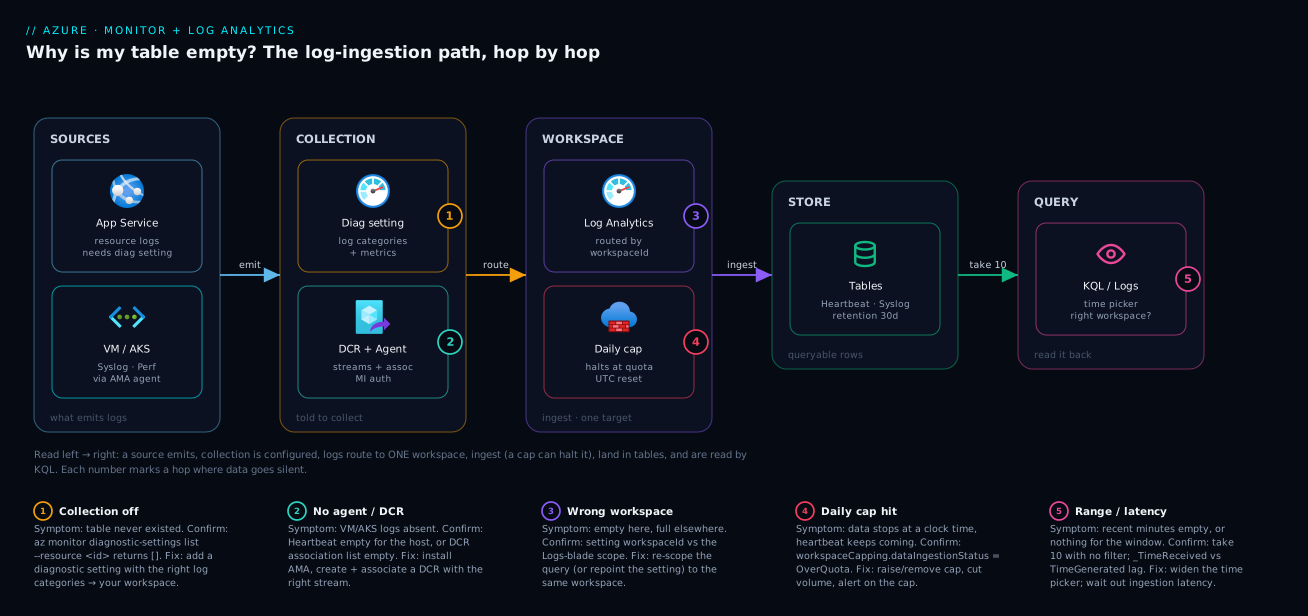
Read the diagram left to right as the journey one log row takes — and as the map of where it can go missing. On the far left, sources emit signal: an Azure PaaS resource (App Service, Key Vault, SQL) whose logs only flow once a diagnostic setting is attached, and a VM or AKS node whose logs flow only through the Azure Monitor Agent. The middle zone is collection: diagnostic settings for resource logs and Data Collection Rules for agent logs, each naming exactly one destination — and this is the hop that is simply absent in most “no data” cases. Traffic then reaches the workspace (the ingestion pipeline plus the daily cap guardrail), lands in tables, and is finally read by KQL in the Logs blade.
The numbered badges mark the exact hops where data goes silent, and the legend narrates each as symptom · how to confirm · fix. Badge 1 sits on the source/diagnostic-setting boundary — collection never enabled (the most common cause). Badge 2 sits on the agent/DCR — the machine has no rule or no heartbeat. Badge 3 sits on the routing arrow — logs are flowing, but to a different workspace than the one being queried. Badge 4 sits on the ingestion/cap node — a daily cap halted ingestion at a clock time. Badge 5 sits on the query side — the table has data, but the time range (or metrics-vs-logs confusion) hides it. Follow the arrows and you are literally tracing the troubleshooting order: confirm the source is configured, the agent is alive, the destination matches, the cap is clear, and the query is honest.
Real-world scenario
Lumira Retail, a mid-size online grocer, ran a regional sale and wanted to investigate a checkout slowdown the next morning. On-call engineer Asha opened the workspace law-shared, queried AppServiceHTTPLogs for the sale window, and got “No results found.” The site had clearly served tens of thousands of orders — so where were the logs? The instinct on the bridge call was “Azure Monitor lost our data,” and someone started drafting a support ticket.
Asha worked the pipeline instead of the panic. The cheap check first: AppServiceHTTPLogs | take 10 with no time filter — still empty in law-shared, which ruled in either “wrong workspace” or “never collected.” She listed the diagnostic settings on the checkout web app, and az monitor diagnostic-settings list --resource <app-id> returned a setting whose workspaceId pointed at law-prod, not the law-shared she was querying. Right table, wrong workspace — caught in ninety seconds. She re-scoped the query to law-prod and the sale-window logs were all there.
But the investigation surfaced a second, more dangerous issue: in law-prod the data simply stopped at 14:10. az monitor log-analytics workspace show --query workspaceCapping showed a 5 GB daily cap with dataIngestionStatus: OverQuota. The sale had tripled log volume and blown the cap at 14:10; everything after that — including the slow-checkout evidence she most wanted — was never ingested. Heartbeat kept arriving (it was exempt), which is exactly why nobody noticed: the dashboards looked “alive.”
The fix had two parts. Short term, Asha raised the cap to 15 GB/day for the sale period and added a cap-reached alert wired to the on-call action group, so a future hit would page instead of hide. Medium term, the team cut volume — dropping two chatty, low-value categories and moving verbose console logs to a cheaper table plan — and consolidated their three half-used workspaces onto law-prod as the canonical store, ending the wrong-workspace confusion for the next engineer. Two root causes, both routing and ingestion, diagnosed by walking the pipeline rather than guessing. Total time once the panic stopped: under fifteen minutes.
Advantages and disadvantages
The centralised Log Analytics ingestion model is powerful precisely because everything funnels into one queryable store — but that same centralisation is what creates the “no data” failure surface. The honest trade-off:
| Advantages | Disadvantages |
|---|---|
| One workspace, one query language (KQL) for many sources | Many separate hops can each silently break collection |
| Diagnostic settings / DCRs are declarative and IaC-friendly | Nothing is collected by default — easy to forget to enable |
| Powerful correlation across resources once data lands | “No data” is silent — no error tells you a hop is broken |
| Per-GB billing scales with what you actually use | Easy to over-ingest, hit a cap, and lose afternoon data |
| Retention is configurable per table | Default retention can purge data you needed |
| Metrics + logs both available in one place | The metrics-vs-logs split confuses where data lives |
When does each side matter? The advantages dominate once your pipeline is correct and stable — a single queryable source of truth that makes incident response fast. The disadvantages dominate during setup and change: the first time you wire a resource, the day someone edits a setting, or the moment traffic spikes into a cap — which is exactly when most engineers meet them. Treat “is data actually arriving?” as a thing you verify, not assume — a Heartbeat/Usage glance after any change — and the disadvantages mostly evaporate.
Hands-on lab
You will create a workspace, attach a diagnostic setting to a resource, prove the table is empty before and populated after, then deliberately query the wrong workspace to feel the most common trap. Free-tier-friendly: the workspace’s first 5 GB/month and 31-day retention are included, and you delete everything at the end. Run in Cloud Shell (Bash).
Step 1 — Variables and resource group.
RG=rg-law-lab
LOC=centralindia
WS=law-lab-$RANDOM
az group create -n $RG -l $LOC -o table
Step 2 — Create a Log Analytics workspace.
az monitor log-analytics workspace create -g $RG -n $WS -l $LOC -o table
WS_ID=$(az monitor log-analytics workspace show -g $RG -n $WS --query id -o tsv)
Expected: a workspace resource; WS_ID is its full ID.
Step 3 — Create a resource that emits logs (a Key Vault is quick and cheap).
KV=kvlab$RANDOM
az keyvault create -g $RG -n $KV -l $LOC -o table
KV_ID=$(az keyvault show -g $RG -n $KV --query id -o tsv)
Step 4 — Prove the table is empty (collection not yet enabled). Open the Logs blade scoped to your workspace and run:
AzureDiagnostics | where ResourceType == "VAULTS" | take 10
Expected: “No results found” — there is no diagnostic setting yet, so nothing flows. This is the empty-table baseline.
Step 5 — Enable the diagnostic setting (turn on collection).
az monitor diagnostic-settings create \
  --name kv-to-law \
  --resource "$KV_ID" \
  --workspace "$WS_ID" \
  --logs '[{"category":"AuditEvent","enabled":true}]' \
  --metrics '[{"category":"AllMetrics","enabled":true}]'
Step 6 — Generate an audit event and wait for ingestion. Read a (non-existent) secret to produce an AuditEvent, then give the pipeline a few minutes:
az keyvault secret list --vault-name $KV -o table # this access is audited
Step 7 — Confirm data now arrives (after ~5–10 minutes). Re-run the query from Step 4. Expected: rows appear in AzureDiagnostics (or AzureDiagnostics/KeyVaultAuditEvent depending on mode) for the vault. The table went from empty to populated purely because you enabled collection — the whole point.
Step 8 — Feel the wrong-workspace trap. In the Logs blade, change the scope to any other workspace in your tenant (or create a throwaway second one) and run the same query. Expected: “No results found” again — the data is real, just not here. Switch back and it returns. That is the number-one production confusion, reproduced on purpose.
Validation checklist. You created a workspace, confirmed an empty table with no collection, enabled a diagnostic setting, generated an audited action, watched the table populate after ingestion latency, and reproduced the wrong-workspace trap. Each step maps to a real diagnosis:
| Step | What you did | What it proves | Real-world analogue |
|---|---|---|---|
| 4 | Query before enabling collection | Empty table = collection off, not a fault | The 90% case (missing setting) |
| 5–7 | Enable setting, generate event, wait | Data flows only after collection + latency | The actual fix + ingestion delay |
| 8 | Query a different workspace | Same query, empty — wrong workspace | “Right table, wrong workspace” |
Cleanup (avoid lingering charges).
az group delete -n $RG --yes --no-wait
Cost note. A Log Analytics workspace has no fixed hourly charge — you pay per GB ingested, and this lab ingests a trivial amount well within the free 5 GB/month. Key Vault operations here are negligible. Deleting the resource group stops everything.
Common mistakes & troubleshooting
This is the playbook — the part to bookmark. First as a scannable table you read mid-incident, then the key entries expanded with the full confirm step.
| # | Symptom | Root cause | Confirm (exact cmd / portal path) | Fix |
|---|---|---|---|---|
| 1 | Table doesn’t exist / “no results” ever | No diagnostic setting on the resource | az monitor diagnostic-settings list --resource <id> returns [] |
Create a diagnostic setting → log categories → your workspace |
| 2 | Logs empty but metrics charts work | Enabled AllMetrics only, no log categories |
Setting JSON: logs[?enabled] empty, metrics set |
Enable the log categories you actually need |
| 3 | Table empty here, full “somewhere” | Querying the wrong workspace | Compare setting workspaceId vs Logs-blade scope |
Re-scope the query to the workspace the setting targets |
| 4 | Empty for “last 30 min”, fine for 24 h | Time picker too narrow / data older | `AppServiceHTTPLogs | take 10` (no filter) returns rows |
| 5 | VM logs absent (Syslog/Perf empty) |
No DCR associated to the host | az monitor data-collection rule association list --resource <vmId> empty |
Create + associate a DCR with the right stream |
| 6 | No data at all from a machine | Azure Monitor Agent not installed/reporting | `Heartbeat | where Computer == “x” |
| 7 | Data stopped at the same time daily | Daily cap reached (OverQuota) |
az monitor log-analytics workspace show --query workspaceCapping |
Raise/remove cap; cut ingestion; alert on cap |
| 8 | Old data gone, recent fine | Retention period expired | az monitor log-analytics workspace table show --query retentionInDays |
Extend table/workspace retention |
| 9 | Last few minutes always missing | Ingestion latency (normal) | extend lag = _TimeReceived - TimeGenerated small; newest ~min behind |
Wait; query ago(15m), not ago(2m) |
| 10 | Queried AzureDiagnostics, it’s empty |
Resource uses resource-specific table | Setting collection mode; query the specific table | Query the resource-specific table (or switch mode) |
| 11 | AKS: ContainerLogV2 empty |
Container Insights not enabled | az aks show --query addonProfiles.omsagent |
Enable the monitoring add-on on the cluster |
| 12 | NSG flow / storage logs empty despite setting | Source feature not turned on at the source | Check NSG flow logs / storage logging feature itself | Enable the source-side logging, not just the sink |
| 13 | Custom app logs (App Insights) missing | Wrong pipeline — it’s App Insights, not platform logs | APPLICATIONINSIGHTS_CONNECTION_STRING set? outbound 443? |
Set connection string; see the App Insights guide |
| 14 | Everything stopped right after a change | A setting/DCR was edited, removed or repointed | Activity log on the resource; diff setting/DCR JSON | Restore the correct setting/DCR target + categories |
The four that bite hardest, expanded:
Rows 1–2 — the table never existed, or only metrics arrive. Both are a misconfigured diagnostic setting. If az monitor diagnostic-settings list --resource "$RES_ID" returns value: [], no setting exists — create one with the right log categories and your workspace, then wait for ingestion to create the table. If a setting exists but logs[?enabled] is empty while metrics is populated, you enabled AllMetrics only: add the log categories. Metrics never become log rows unless you deliberately route AllMetrics into the workspace (AzureMetrics).
Row 3 — wrong workspace. The setting routes somewhere other than where your Logs blade is scoped. Read workspaceId from az monitor diagnostic-settings list and compare it to the scope shown at the top of the Logs blade; re-scope the query (or repoint the setting if it should be writing where you are looking).
Rows 5–6 — VM/AKS machine logs missing. Either the Azure Monitor Agent is not reporting, or no DCR is associated. Run Heartbeat | where Computer == "vm-web01" | take 1: empty means the agent is the problem (install/repair AMA, check outbound to the workspace). If heartbeat is present but Syslog/Perf is empty, az monitor data-collection rule association list --resource <vmId> returning empty means no DCR — create and associate one with the correct stream.
Row 7 — data flows all morning then stops at a clock time. The daily cap was reached. az monitor log-analytics workspace show --query "workspaceCapping" shows dataIngestionStatus: OverQuota (and _LogOperation has cap events). Raise or remove the cap (--quota), reduce volume, and add a cap-reached alert so the next hit pages instead of hiding.
Best practices
- Verify data is arriving, don’t assume it. After enabling any diagnostic setting or DCR, run a
take 10(allowing for ingestion latency) before you trust a dashboard or alert built on it. - Standardise on one canonical workspace per environment (e.g.
law-prod,law-nonprod) and document it — most wrong-workspace pain is sprawl. - Configure diagnostic settings as code, attached to the resource. A setting in Bicep/Terraform cannot be silently “off” and is reviewed in PRs. Use Azure Policy with
DeployIfNotExiststo auto-attach settings fleet-wide. - Always pair a daily cap with an alert on it. A cap without an alert is a silent blind spot; the alert turns a hit into a page, not a next-morning surprise.
- Know your metrics-vs-logs split before you query. Numeric trends → Metrics blade; events/records → Logs blade. Half of “no data” is the wrong home.
- Use
Heartbeatas your agent health pulse. For any VM/AKS estate, a workbook onHeartbeatper host catches a dead agent before someone needs its logs. - Right-size retention per table. Keep high-value audit tables long and verbose debug tables short, deliberately, so retention never deletes data you needed.
- Prefer resource-specific tables over the legacy
AzureDiagnosticswhere supported — clearer schema and fewer “wrong table” surprises. - Reduce noise at the source. Drop low-value categories and use cheaper table plans for chatty data, so you stay under a sane cap rather than constantly raising it.
- Watch
_LogOperation— it surfaces ingestion warnings, cap events and schema issues, explaining many “it just stopped” mysteries.
Security notes
- Least-privilege on the workspace. Reading logs needs only Log Analytics Reader; configuring collection needs Log Analytics Contributor or Monitoring Contributor — do not hand out broad Contributor just to run KQL. Use table-level RBAC to hide sensitive tables from broad readers.
- Logs can contain secrets and PII. Request bodies, headers and audit events may carry tokens, emails or personal data. Treat the workspace as sensitive, restrict access, and avoid logging secrets at the source rather than scrubbing later.
- Secure the collection path. For agent-based collection over private networks, use Azure Monitor Private Link Scope (AMPLS) so telemetry stays off the public internet; an agent that cannot reach the ingestion endpoint produces a silent “no data.”
- Don’t disable collection to “fix” cost. Turning off a diagnostic setting to dodge a bill creates an audit and security gap. Reduce volume (categories, table plans, cap) instead, so security-relevant logs keep flowing.
- Protect against tampering. Use resource locks and Azure Policy so a setting on a sensitive resource cannot be quietly removed — a deleted setting is both a monitoring gap and a way to hide activity.
- Connect identity correctly for agents. AMA uses the machine’s managed identity to authenticate to the workspace; a missing or wrong identity is a common cause of an agent that installs but never ingests. See Managed Identity: System-Assigned vs User-Assigned Patterns for getting that right.
Cost & sizing
Log Analytics billing is dominated by data ingested (per GB) and, secondarily, retention beyond the included period. There is no per-hour charge for the workspace itself, which is why “no data” is never a billing problem — but over-ingestion absolutely is, and the cap that protects your bill is the very thing that can cause the afternoon “no data.” The drivers:
- Ingestion volume (per GB) is the main bill. The first 5 GB per workspace per month is included on pay-as-you-go; beyond that you pay per GB. Chatty categories (verbose console logs, full request logs at high traffic) dominate — drop or sample them.
- Table plans change the per-GB rate. Analytics is the full-featured default; Basic and Auxiliary are much cheaper per GB for high-volume, low-query data (with query limits). Moving noisy debug tables to a cheaper plan cuts cost without losing the data.
- Retention beyond the included window is billed per GB-month. The included interactive retention (commonly 31 days) is free; extending high-value tables to a year costs more but is often worth it for audit/compliance.
- The daily cap is a guardrail, not a cost line — it prevents runaway cost by halting ingestion. Set it above normal peak, alert on it, and treat a hit as a signal to reduce volume, not just to raise the number.
- Commitment tiers discount ingestion above ~100 GB/day — irrelevant to a beginner workspace but worth knowing it exists.
Rough figures for a small environment: a workspace ingesting ~10 GB/month sits near or just over the free tier, costing on the order of ₹0–800/month; a busier app at ~50 GB/month lands roughly ₹8,000–12,000/month at Analytics rates, materially lower if the chatty tables move to Basic/Auxiliary. The cost-and-cap reference:
| Driver | What you pay for | Rough INR / month | What it affects | Watch-out |
|---|---|---|---|---|
| First 5 GB / workspace | Included free ingestion | ₹0 | Small dev workspaces | Per-workspace, not per-subscription |
| Analytics-plan ingestion | Full-featured per-GB | ~₹8,000–12,000 at 50 GB | Most log tables | Chatty categories dominate this |
| Basic / Auxiliary plan | Cheaper per-GB, limited query | Fraction of Analytics | High-volume, low-query tables | Query/KQL limitations apply |
| Extended retention | Per-GB-month beyond ~31 days | Scales with volume × months | Audit/compliance tables | Default purges old data silently |
| Daily cap | Nothing — it’s a limit | ₹0 | Prevents runaway cost | A hit = silent “no data” without an alert |
Interview & exam questions
1. You query a Log Analytics table and get “No results found.” What is the first thing you check, and why? Whether collection was ever enabled — i.e. does a diagnostic setting (or DCR) exist on the source pointing at this workspace. “No data” is the correct answer to a query against an empty table, so the first job is verifying the pipeline that should fill it, starting with the most common break (collection never turned on). Confirm with az monitor diagnostic-settings list --resource <id>.
2. What is the difference between metrics and logs in Azure Monitor, and how does it cause “no data” confusion? Metrics are pre-aggregated numeric time-series in a separate store, available for most resources by default and queried in the Metrics blade. Logs are schema’d rows in Log Analytics that require a log category to be collected and are queried with KQL. People enable metrics but expect log rows (or hunt for CPU% as a log), so the place they query is empty by design.
3. A resource’s logs are flowing but you see an empty table. Name two non-pipeline causes. Wrong workspace (the setting routes to a different workspace than the Logs blade is scoped to) and wrong time range (the time picker is narrower than where the data lives, or ingestion latency means the queried recent window is still thin). Both are “the data exists, just not where/when you looked.”
4. How do you tell whether a VM’s missing logs are an agent problem or a Data Collection Rule problem? Query Heartbeat for that computer: no recent rows means the Azure Monitor Agent is down/not installed/not connected (fix the agent first). If heartbeat is present but Syslog/Perf is empty, the agent is healthy but no DCR is associated (or the stream is filtered) — fix the rule and its association.
5. Data was arriving and stopped abruptly at 14:00 every day, while heartbeat keeps coming. What is the cause? A daily cap reached. Once the workspace ingests its configured daily volume it halts most ingestion until the UTC reset, but some data types (heartbeat, certain security logs) can be exempt — which is why heartbeat continues while your logs stop. Confirm via workspaceCapping.dataIngestionStatus: OverQuota and raise the cap or cut volume.
6. The newest few minutes of data are always missing. Is this a fault? No — it is normal ingestion latency. Events take a few minutes to traverse the pipeline and become queryable rows. Confirm by comparing _TimeReceived to TimeGenerated (small lag) and noting that max(TimeGenerated) is only a few minutes behind now. Query a slightly older window for live views.
7. What does the Heartbeat table tell you, and why is it the first stop for machine logs? It records one row per agent per minute, so its presence proves the agent is installed, running and able to reach the workspace. If a machine is absent from Heartbeat, nothing else from it will arrive, so checking heartbeat short-circuits the entire downstream investigation.
8. You enabled a diagnostic setting and queried AzureDiagnostics, but it is empty — yet you believe data is flowing. What might be wrong? The resource may write to a resource-specific table (e.g. AppServiceHTTPLogs) rather than the legacy AzureDiagnostics, depending on the setting’s collection mode. Query the resource-specific table, or check/switch the collection mode in the diagnostic setting.
9. How do diagnostic settings differ from Data Collection Rules? Diagnostic settings collect Azure resource (platform) logs and metrics from the resource itself — no agent involved. Data Collection Rules drive the Azure Monitor Agent to collect logs from inside machines (VM Syslog/Event/perf, AKS). Resource logs → diagnostic setting; machine logs → agent + DCR.
10. Why might disabling a diagnostic setting to save money be a bad idea, and what should you do instead? It creates a monitoring and audit gap (and can hide activity), and the savings are better achieved by reducing volume. Instead, drop low-value categories, move chatty tables to the Basic/Auxiliary plan, set a sensible daily cap with an alert, and right-size retention — keeping security-relevant logs flowing while cutting cost.
These map primarily to AZ-104 (Administrator) — monitor and maintain Azure resources, configuring Log Analytics, diagnostic settings, and the agent — and to AZ-204 (Developer Associate) — instrument and monitor solutions. The cost/cap and governance angle also touches AZ-305 design thinking. A compact cert map:
| Question theme | Primary cert | Objective area |
|---|---|---|
| Diagnostic settings, log vs metric | AZ-104 | Configure and manage Azure Monitor |
| Heartbeat, AMA, DCRs (VM/AKS) | AZ-104 | Monitor resources; configure the agent |
| KQL “no data” triage, latency | AZ-204 | Instrument and monitor solutions |
| Daily cap, retention, table plans | AZ-104 / AZ-305 | Cost-aware monitoring design |
Quick check
- You run
Syslog | take 10and get “No results found.” Name the two most common, most boring causes to rule out first. - True or false: if the Metrics blade shows CPU for a VM, then the
Perftable in Log Analytics must also have data. - Your data stopped at exactly 13:30 today and yesterday, but
Heartbeatkeeps arriving. What is the single most likely cause? - A teammate insists “Azure lost our logs” because the last 3 minutes are empty. What do you check before agreeing?
- For a VM that shows no logs at all, which table do you query first, and what does its emptiness tell you?
Answers
- No collection enabled (no diagnostic setting / no DCR on the source pointing at this workspace) and wrong workspace (the data is flowing to a different workspace than the one you are querying). Rule these out before assuming anything deeper.
- False. Metrics and logs are separate pipelines. Metrics (CPU) are collected by default and live in the Metrics blade; the
Perftable only has data if the Azure Monitor Agent plus a DCR are collecting performance counters into the workspace. - The workspace’s daily cap was reached — ingestion halts until the UTC reset. Heartbeat often continues because it can be exempt, which is why it looks “alive” while your logs stop. Confirm with
workspaceCapping.dataIngestionStatus: OverQuota. - Ingestion latency. Compare
_TimeReceivedtoTimeGeneratedon the newest rows — a small lag and amax(TimeGenerated)a few minutes behind “now” means the data is simply still ingesting, not lost. Re-query after a few minutes. Heartbeatfirst. If the machine has no recent heartbeat rows, the agent is down, not installed, or cannot reach the workspace — and nothing downstream will arrive, so you fix the agent before looking at DCRs or tables.
Glossary
- Log Analytics workspace — the regional Azure resource that stores log data in tables and is queried with KQL; the destination of diagnostic settings and DCRs.
- Table — a typed set of log rows in a workspace (e.g.
Syslog,Heartbeat,AppServiceHTTPLogs); a missing table means that data type was never ingested here. - KQL (Kusto Query Language) — the read-only query language for Log Analytics; an empty result is a successful query that found no matching rows.
- Diagnostic setting — configuration on an Azure resource that sends selected log categories and/or metrics to a named destination (workspace, Storage, or Event Hub).
- Log category — one stream a resource can emit (e.g.
AuditEvent,AppServiceHTTPLogs); only enabled categories populate their tables. - Data Collection Rule (DCR) — a resource that tells the Azure Monitor Agent what to collect (Syslog/Event/perf) and where to send it; must be associated with each machine.
- Azure Monitor Agent (AMA) — the agent installed on VMs, Arc servers and AKS nodes that reads DCRs and ships machine logs to the workspace.
Heartbeat— a table with one row per agent per minute; its presence proves an agent is alive and connected, its absence proves the opposite.- Metrics — pre-aggregated numeric time-series (CPU%, request count) in a separate store, available by default and queried in the Metrics blade — distinct from logs.
- Ingestion latency — the normal few-minute delay between an event occurring and its row becoming queryable; the cause of most “the last few minutes are missing” reports.
TimeGenerated/_TimeReceived— when the event happened versus when the workspace received it; their difference is the ingestion lag.- Daily cap — a workspace volume limit that halts most ingestion for the rest of the UTC day once reached, to control cost; a frequent cause of “data stopped at a clock time.”
- Retention — how long a table keeps rows before purging them; old data beyond retention is gone by design, not lost.
AzureDiagnostics— the legacy catch-all table many resources can write to; modern resources often use resource-specific tables instead, which is a common “queried the wrong table” trap.- Table plan (Analytics / Basic / Auxiliary) — the per-table tier that sets per-GB cost and query capability; cheaper plans suit high-volume, low-query data.
Next steps
You can now localise any “no data” case to a single hop and fix it. Build outward:
- Next: Azure Monitor & Application Insights for Observability — once data lands reliably, build the alerts, Failures view and dashboards on top of it.
- Foundation: Create and Design a Log Analytics Workspace with RBAC — the workspace design and access model that prevents wrong-workspace sprawl.
- Related: Azure Monitor Metrics vs Log Analytics: When to Use Which — settle the metrics-vs-logs question so you never query the wrong home again.
- Related: Azure Monitor Data Platform: Metrics, Logs & Traces Explained — the full data-platform model behind this pipeline.
- Related: Azure Policy Effects: Deny, Audit, Modify, DeployIfNotExists — use
DeployIfNotExiststo auto-attach diagnostic settings so “no collection” never happens fleet-wide.