The site is down. Your dashboards are red, the pager is screaming, and a Teams channel of forty people is asking the same question in eight different ways: is it us, or is it Azure? That single question governs everything that happens next. If it is Azure, your job is to communicate, wait, and maybe fail over — touching your own deployment would be actively harmful. If it is you, every minute spent waiting on Microsoft is a minute the outage continues. And the maddening truth of most incidents is that the data to answer it already exists in your subscription before you ever open a support ticket — it just lives in three different blades that most engineers never wire together until they are already on fire.
This article is about those three blades and the mental model that fuses them. Azure Service Health tells you what Microsoft is doing to the platform — active service issues (outages), planned maintenance, and health advisories — scoped to your subscriptions, regions and services rather than a generic global status page. Azure Resource Health drops one level down: is this specific resource — this VM, this SQL database, this App Service plan — healthy from the platform’s point of view, and why did it become unhealthy? Change Analysis answers the third question, the one that resolves most self-inflicted incidents: what changed? It mines the Activity Log, Azure Resource Manager (ARM) property diffs, and in-guest configuration to show every change in a time window, ranked by relevance to the resource that just broke. Wire those three to the Activity Log and an action group, and “is it us or Azure?” becomes a ninety-second lookup instead of a forty-person guessing game.
By the end you will stop opening a support ticket as your first move. You will know which blade answers each of the three questions an incident forces, how to read a Service Health tracking ID and a Resource Health transition, how to correlate a Change Analysis diff against an outage window, and how to stand it all up before the incident with alert rules that page you the moment Azure declares an issue in a region you live in. This is a concept-first article — mental models first, then comparison grids, an architecture walkthrough, and a short playbook you keep open during the call.
What problem this solves
Every incident forces three questions, in order: is it Azure?, is it me?, and what changed? Teams that cannot answer them quickly default to the worst behaviour. They restart things at random, which sometimes “fixes” the symptom and teaches the wrong lesson. They scale up, masking a real bug for a day. They open a Severity-A ticket and wait — for an outage a thirty-second look at Service Health would have confirmed is Microsoft’s, ETA already published. Or worse, they assume it is Azure when it is actually the config change someone shipped ninety minutes ago, and sit on their hands while their own bug burns.
The root cause is that the three answers live in three places that feel unrelated until enough incidents fuse them. The generic status.azure.com page is nearly useless mid-incident: broad, already-confirmed events, often lagging, knowing nothing about whether you run anything in the affected region. Service Health is the personalised version — same data, filtered to your tenant’s footprint — and the blade most teams forget exists. Resource Health is even more forgotten, yet it is the fastest way to learn the platform already knows your VM is unhealthy and why. And Change Analysis resolves the plurality of incidents, because something always changed — a deployment, an app setting, an NSG rule, an expired certificate, a scale-in that removed the last healthy instance — and correlating that change to the failure window is the whole game.
Who hits this: every team on Azure with a pager. It bites hardest on teams without a pre-wired Service Health alert (they learn about regional outages from their users, not Azure), on busy subscriptions where the Activity Log is an unread firehose, and on teams that conflate “my app returned an error” with “Azure is down” because they never separated platform health from application health. The fix is not a tool you buy — it is a model you internalise and three alert rules you deploy once.
To frame the whole field before the deep dive, here is each question an incident forces, the blade that answers it, and what a “yes” there means for your next move:
| The question | Primary blade | What a hit there tells you | Your next move if it hits |
|---|---|---|---|
| Is it Azure? | Service Health → Service issues | Microsoft declared an outage in your region/service | Communicate + wait for ETA; consider failover; do NOT touch your deploy |
| Is it the platform for this resource? | Resource Health | Platform marks this resource Unavailable/Degraded | Read the transition reason; if platform-initiated, escalate with the resource ID |
| What changed? | Change Analysis | A config/deployment/property change lines up with the failure | Roll back / inspect that change first |
| Is maintenance the cause? | Service Health → Planned maintenance | A maintenance window overlaps the symptom | Expect brief restarts; verify HA absorbed it |
| Did Azure advise me already? | Service Health → Health advisories | A deprecation/quota/config notice predates the symptom | Action the advisory; it may be the root cause |
Learning objectives
By the end of this article you can:
- State the three questions every incident forces and name the exact Azure blade that answers each, in order.
- Distinguish Service Health (your personalised platform status) from the public Azure Status page, and explain when each is trustworthy.
- Read a Service Health event end to end: event type, tracking ID, impacted services/regions, stage, and the difference between service issue, planned maintenance and health advisory.
- Use Resource Health to interpret an Available → Unavailable transition and its
reasonType(Platform-, Customer-, or Unknown-initiated). - Drive Change Analysis to rank changes in a time window and correlate a change diff against an outage to confirm or rule out a self-inflicted cause.
- Wire the Activity Log, a Service Health alert, a Resource Health alert and an action group so Azure pages you the moment it declares an issue — before your users do.
- Run a repeatable correlation playbook that resolves “is it us or Azure?” in well under two minutes.
Prerequisites & where this fits
You should understand the Azure resource hierarchy — management groups contain subscriptions, which contain resource groups, which contain resources — because Service Health and Activity Log alerts are scoped at the subscription level, and how you scope them decides what noise you get. You should know how to run az in Cloud Shell, read JSON output, and create a basic Azure Monitor action group (the thing that emails, SMSes or webhooks you). Familiarity with the Activity Log as the subscription-level record of control-plane operations is assumed; if you have ever filtered it for a failed deployment, you have the foundation.
This sits in the Observability & Incident Management track, deliberately upstream of application-level debugging. It pairs with Azure Monitor and Application Insights: Full-Stack Observability — once Service Health says the platform is fine, Application Insights is where you prove the fault is in your code. It complements The Azure Monitor Data Platform Explained: Metrics, Logs, Traces and Where Each Lives: Service Health and Resource Health are platform signals that flow through the Activity Log, not the metrics or logs pipeline. When the answer is application-level, articles like Troubleshooting Azure App Service: 502/503 Errors, Cold Starts & Restart Loops take over. The alerting muscle you build here is the same one from How to Create Your First Metric Alert and Action Group for Email, SMS and Push.
A quick map of which signal sits at which layer, so you reach for the right one without thinking:
| Layer | The signal | What it answers | Where it surfaces | Latency to you |
|---|---|---|---|---|
| Azure platform (global/regional) | Service Health | Is Microsoft having an outage / maintenance that touches me? | Service Health blade + Activity Log (ServiceHealth) |
Minutes (personalised); slower on public status page |
| Azure platform (per resource) | Resource Health | Is this resource healthy from the platform’s view? | Resource Health blade + Activity Log (ResourceHealth) |
Seconds to minutes |
| Your control-plane actions | Activity Log + Change Analysis | What did anyone change, and when? | Activity Log; Change Analysis blade | Near real-time (ARM); minutes for property diffs |
| Your application | Metrics / Logs / App Insights | Is my code/dependency failing? | Azure Monitor metrics, Log Analytics, App Insights | Seconds to a couple of minutes |
The rule of thumb that orders everything below: climb from the platform down to your code. Service Health (is Azure broken?), then Resource Health (is this resource broken by the platform?), then Change Analysis (did I break it?), and only then application telemetry. Most teams do it backwards — start in their own logs and waste the first hour — which is the habit this article exists to break.
Core concepts
Five mental models make every later step obvious.
Platform health is not application health, and different systems report them. Your Application Insights availability test going red means a request failed — not whose fault it is. Service Health and Resource Health report the platform’s opinion of its own health, independent of your code. An app can throw 500s while every Azure signal is green (your bug), and the platform can declare a regional storage outage while your app limps along on cached data (Azure’s problem, partially absorbed). Treating these as one signal is the original sin of slow response: read the platform signal first and let it tell you which world you are in.
Service Health is the personalised projection of Azure Status. The public, anonymous page at status.azure.com shows broad, confirmed, multi-customer events. Service Health is the same incident data filtered through your tenant’s footprint — only events touching the subscriptions, regions and service types you use, often earlier and at finer granularity than the public page. When they disagree, Service Health is the more trustworthy view for you, because the public page is intentionally conservative and lagging. Never let “the status page is all green” end your investigation.
Every Service Health event is one of three types, and the type dictates your response. A service issue is an active, unplanned outage on Microsoft’s side. Planned maintenance is scheduled platform work that may briefly affect your resources (a node reboot, a control-plane upgrade). A health advisory is a notice requiring your attention — a deprecation, a quota or configuration condition — and is frequently the root cause of an incident weeks later. Each carries a globally unique tracking ID (the string you quote to support) and moves from Active/Investigating to Resolved, with a final Post-Incident Review (PIR) for major events.
Resource Health is a state machine the platform drives per resource. A resource is Available, Unavailable, Degraded, or Unknown, and each transition carries a reason: Platform Initiated (a host failure, a planned reboot), Customer Initiated (you stopped/redeployed/recycled it), or Unknown. It is the fastest way to learn the platform already knows your VM is down and why — before you tail a log. The most valuable read is the transition: “Available 02:11, Unavailable 02:14, Platform Initiated” tells you in one line that this is Azure’s fault and when it started.
Change Analysis is differential, not just a log. The Activity Log lists operations — “someone called restart”, “a deployment ran”. Change Analysis computes the before/after diff of resource properties (an NSG rule flipped Allow→Deny, an app setting whose value changed, a SKU that scaled down), reaches into supported in-guest config, and ranks changes by likely relevance to the resource you are investigating. The shift is from “what operations happened” to “what is different now versus before it broke” — because in most self-inflicted incidents a specific property changed at a specific time, and lining that timestamp up against the failure window is the fastest confirmation you will get.
The vocabulary in one table
Before the deep sections, pin down every moving part. The glossary at the end repeats these for lookup; this table is the model side by side:
| Term | One-line definition | Where it lives | Why it matters in an incident |
|---|---|---|---|
| Service Health | Personalised Azure platform status for your tenant | Service Health blade; Activity Log ServiceHealth |
Answers “is it Azure?” scoped to what you run |
| Azure Status | Public, anonymous, global status page | status.azure.com | Conservative/lagging; not tenant-aware |
| Resource Health | The platform’s health verdict for one resource | Resource Health blade; Activity Log ResourceHealth |
Answers “is the platform breaking this resource?” |
| Change Analysis | Ranked differential view of what changed and when | Change Analysis blade; App Service & VM diagnostics | Answers “what changed?” — resolves most self-inflicted incidents |
| Activity Log | Subscription record of control-plane operations | Monitor → Activity Log | The substrate health + change records flow through |
| Tracking ID | Globally unique ID for a Service Health event | On every Service Health event | The string you quote to support |
| Service issue | An active, unplanned Microsoft-side outage | Service Health event type | Communicate + wait/failover; don’t touch your deploy |
| Planned maintenance | Scheduled platform work that may affect you | Service Health event type | Expect brief restarts; verify HA absorbed it |
| Health advisory | A notice requiring your attention/action | Service Health event type | Often the hidden root cause weeks later |
| PIR (Post-Incident Review) | Microsoft’s root-cause write-up for a major event | Service Health, after resolution | The authoritative “what happened” for your RCA |
| Action group | The notification target (email/SMS/webhook) | Azure Monitor | Turns an alert into a page that reaches a human |
| reasonType | Classifier on a Resource Health transition | Resource Health event | Platform- vs Customer- vs Unknown-initiated |
Service Health: your personalised platform status
Service Health is the blade you open first, every time, before you touch anything you own. It is organised into the three event types, plus a Resource Health entry point and a Health alerts management page. Treat it as the top of your funnel: if Service Health has an active issue covering your region and service, your job changes from “debug” to “communicate and decide on failover.”
Reading a Service Health event
Every event carries a consistent shape; reading it fast is the skill. The fields that matter, what they tell you, and the trap in each:
| Field | What it tells you | How to use it | The trap |
|---|---|---|---|
| Event type | Service issue / Planned maintenance / Health advisory | Decides your whole response posture | Assuming “issue” when it is an advisory you ignored |
| Tracking ID | Globally unique event identifier | Quote to support; paste in incident channel | Reusing a stale ID from a prior, resolved event |
| Impacted services | Which Azure services are affected | Confirm it matches the service you run | Adjacent service named, not yours — not your cause |
| Impacted regions | Which regions are affected | Confirm it overlaps where you deploy | Affected region is one you do not use |
| Status / stage | Investigating → Identified → Mitigating → Resolved | Sets expectations; do not wait silently | Treating “Investigating” as “nothing is wrong yet” |
| Issue summary / updates | Microsoft’s running commentary + ETA | Communicate the ETA to stakeholders | Acting on the first update before it is “Identified” |
| Last update / next update | When the next official update is due | Time your own comms to it | Refreshing the page instead of trusting the cadence |
Querying Service Health from the CLI during an incident
The portal is fine, but during a call you often want a one-liner you can paste. Service Health events flow through the Activity Log under the ServiceHealth category, so you can pull active platform events without leaving the terminal:
# Active platform service-health events in the last 6 hours for this subscription
az monitor activity-log list \
  --offset 6h \
  --query "[?category.value=='ServiceHealth'].{time:eventTimestamp, level:level, status:status.value, title:properties.title}" \
  -o table
To see only the unplanned outages (service issues) and grab their tracking IDs to quote:
# Service issues only, with the tracking ID and impacted services if present
az monitor activity-log list --offset 6h \
  --query "[?category.value=='ServiceHealth' && properties.incidentType=='Incident'].{time:eventTimestamp, tracking:properties.trackingId, title:properties.title, region:properties.region}" \
  -o table
A note on what incidentType values you will see and how they map to the three event types — this is the join between the CLI view and the portal labels:
incidentType (Activity Log) |
Portal event type | Meaning |
|---|---|---|
Incident |
Service issue | Active unplanned outage |
Maintenance |
Planned maintenance | Scheduled platform work |
Informational / ActionRequired |
Health advisory | Notice requiring your attention |
Security |
Security advisory | Security-relevant notice for your services |
Why the public status page is not enough
The single most expensive Service Health mistake is ending an investigation because status.azure.com is green. The public page is global, conservative, and cannot know whether you run anything in the affected region; Service Health, filtered to your tenant, frequently shows a relevant event earlier and at finer granularity (a single zone, a single service) that never rises to the public page’s threshold. The comparison that should settle which one you trust:
| Property | Public Azure Status | Service Health (your tenant) |
|---|---|---|
| Scope | Global, all customers | Your subscriptions / regions / services |
| Personalisation | None | Filtered to your footprint |
| Granularity | Broad, customer-wide events | Down to specific zones/services you use |
| Latency | Conservative, can lag | Often earlier for events that touch you |
| Alerting | Not actionable per-tenant | Drives Service Health alerts → action groups |
| Trust during your incident | Lower (may show nothing) | Higher (knows what you run) |
Resource Health: is this resource healthy?
When Service Health is green but one workload misbehaves, Resource Health is the next stop and it is criminally underused. It is the platform’s own verdict on a single resource — your VM, SQL database, App Service plan, load balancer — and it answers what your logs cannot: does Azure itself think this thing is healthy? The value is speed: instead of inferring “the VM might be down” from failed pings, you read the platform saying “Unavailable since 02:14, Platform Initiated” directly.
The health states and what each means
Resource Health reports one of four states — the meaning differs by resource type but follows a consistent pattern:
| State | What it means | Typical cause | What you should do |
|---|---|---|---|
| Available | Platform considers the resource healthy | Normal operation | If your app still fails, the fault is yours (app/config) |
| Unavailable | Platform cannot reach/serve the resource | Host failure, platform reboot, or you stopped it | Read reasonType; if Platform Initiated, it is Azure’s |
| Degraded | Working but impaired (reduced performance/redundancy) | Partial host issue, throttling, failover in progress | Expect reduced capacity; corroborate with metrics |
| Unknown | Platform has not received recent health signals | Networking to the host lost; resource just created/stopped | Wait briefly; persistent Unknown can itself be a symptom |
Reading a transition and its reason
The most valuable artifact is the transition — the moment a resource moved between states, with a timestamp and a classified reason. That reasonType is the fork that tells you whose problem it is:
reasonType |
Meaning | Whose fault | Example |
|---|---|---|---|
| Platform Initiated | Microsoft’s platform caused the change | Azure | Unplanned host failure; planned node reboot during maintenance |
| Customer Initiated | An action you took caused it | You | You stopped the VM; a redeploy; a config change recycled it |
| Unknown | Platform cannot classify the cause | Indeterminate | Health signal lost; treat as needs-investigation |
Pull Resource Health history for a resource from the CLI — these timestamps are what you line up against your failure window and Change Analysis diff:
# Resource Health events for one resource over the last 12 hours
RES_ID=$(az vm show -g rg-shop-prod -n vm-web-01 --query id -o tsv)
az monitor activity-log list --offset 12h \
  --query "[?category.value=='ResourceHealth' && resourceId=='$RES_ID'].{time:eventTimestamp, status:properties.currentHealthStatus, previous:properties.previousHealthStatus, reason:properties.cause}" \
  -o table
A worked read: previousHealthStatus=Available, currentHealthStatus=Unavailable, cause=PlatformInitiated at 02:14 tells you (a) the resource was fine three minutes before the page, (b) the platform broke it, and © the exact start time to correlate — three facts in one line, redirecting you away from your own logs and toward Service Health or a support escalation with the resource ID and timestamp in hand.
Where Resource Health helps and where it does not
Resource Health is precise about platform health and silent about everything else. It is great for confirming the platform stopped or rebooted your VM, spotting a Platform-Initiated reboot during maintenance, distinguishing “you stopped it” from “Azure stopped it”, and giving a fast verdict before you tail any logs. It will not tell you that your app threw an exception, that a downstream API is failing, that your code deadlocked while the host is fine, or that a config change degraded behaviour without breaking the host.
The key reading: Resource Health = Available does not mean your app is healthy. It means the platform is doing its job; the fault, if any, is above it — your code, config, a dependency. That distinction sends you to Change Analysis next instead of opening a support ticket.
Change Analysis: what changed?
If Service Health is green and Resource Health says Available, the incident is almost certainly self-inflicted — and Change Analysis finds the culprit fastest. Its premise: something changed right before this broke, and I can see exactly what and when. It draws on three sources and presents them as ranked, time-stamped diffs rather than a raw operation log.
The three layers Change Analysis sees
Change Analysis composes signals from three depths; which layer a change came from tells you how to undo it:
| Layer | What it captures | Source | Latency | Example change it surfaces |
|---|---|---|---|---|
| ARM operations | Control-plane create/update/delete on resources | Activity Log / Resource Graph | Near real-time | A deployment updated the App Service; a SKU scaled down |
| Resource property diffs | Before/after values of resource properties | ARM resource snapshots | Minutes | NSG rule flipped Allow→Deny; app setting value changed |
| In-guest configuration | File/setting changes inside supported compute | Change Analysis agent (where enabled) | Minutes | A config file edited inside a VM/App Service |
The reading discipline: an ARM operation tells you who did what action; a property diff tells you what value is now different; an in-guest change tells you what someone edited inside the box. Most “we changed nothing” incidents resolve at the property-diff layer, because the operation looked routine (“update site config”) but the diff reveals the one value that mattered.
Driving Change Analysis
The portal entry points are the Change Analysis blade (tenant-wide) and the Diagnose and solve problems → Changes view inside App Service and VM resources. To list changes programmatically, lean on the Activity Log for the operation layer mid-incident:
# State-changing operations on one resource in the failure window — the shortlist you scan
RES_ID=$(az webapp show -g rg-shop-prod -n app-shop-prod --query id -o tsv)
az monitor activity-log list --offset 2h \
  --query "[?resourceId=='$RES_ID' && operationName.value contains 'write'].{time:eventTimestamp, op:operationName.localizedValue, by:caller}" \
  -o table
For property-level diffs and ranked changes, the dedicated Change Analysis blade is authoritative — it shows the old value → new value per property, which the raw Activity Log does not. Treat the CLI as your fast “what operations happened” pass and the blade as the “what value is different” deep dive.
Correlating a change to an outage
The correlation itself is a discipline, not a tool — the procedure that turns three timestamps into a verdict:
| Step | What you do | What you are looking for |
|---|---|---|
| 1. Fix the failure window | From your alert/metrics, note when the symptom started | A precise “broke at HH:MM” anchor |
| 2. Pull Resource Health transitions | Note any Available→Unavailable/Degraded and its reason | A platform transition near the anchor (rules Azure in/out) |
| 3. List changes in a window straddling the anchor | Change Analysis / Activity Log for the 30–60 min before | A change whose timestamp precedes and is close to the anchor |
| 4. Inspect the top-ranked diff | Open the property diff for the closest relevant change | A value that plausibly causes this symptom |
| 5. Decide | Roll back that change, or rule it out and move on | A confirmed cause or a clean exclusion |
The trap: correlation in time is not proof of cause — a change an hour before the symptom, or on an unrelated resource, is coincidence. The ranking and the plausibility of the diff (does flipping this value actually produce this symptom?) elevate correlation to confirmation. A scale-in that removed your last healthy instance at 02:13 is a culprit for an 02:14 outage; a tag edit at 01:10 is noise.
Wiring it up before the incident: alerts and action groups
Everything above is reactive. The real win is proactive — Azure can page you the moment it declares an issue, so you learn about a regional outage from Microsoft, not your users. Two alert types, one action group, deployed once.
Service Health alerts
A Service Health alert is an Activity Log alert filtered to the ServiceHealth category, scoped to the event types, services and regions you care about, routed to an action group. The conditions you can filter on:
| Condition | Values | Why you filter on it |
|---|---|---|
| Event type | Service issue / Planned maintenance / Health advisory / Security | Page hard on service issues; digest advisories |
| Services | The Azure services you run (e.g. App Service, SQL DB) | Suppress noise from services you do not use |
| Regions | Regions you deploy in | Ignore outages in regions you have no footprint in |
| Action group | Email / SMS / webhook / ITSM / Logic App | Where the page actually lands |
Create one from the CLI by targeting the ServiceHealth Activity Log category:
# An action group that emails + SMSes the on-call
az monitor action-group create \
  --name ag-oncall --resource-group rg-monitoring \
  --short-name oncall \
  --action email primary h.vinod@example.com \
  --action sms primary 91 9000000000

# A Service Health alert for service issues in two regions, routed to that group
az monitor activity-log alert create \
  --name alert-service-health \
  --resource-group rg-monitoring \
  --scope "/subscriptions/$(az account show --query id -o tsv)" \
  --condition category=ServiceHealth and properties.incidentType=Incident \
  --action-group ag-oncall \
  --description "Page on-call on any Azure service issue in our regions"
The same as Bicep — how you should actually ship it, version-controlled and consistent across subscriptions:
resource ag 'Microsoft.Insights/actionGroups@2023-01-01' = {
  name: 'ag-oncall'
  location: 'global'
  properties: {
    groupShortName: 'oncall'
    enabled: true
    emailReceivers: [
      { name: 'primary', emailAddress: 'h.vinod@example.com', useCommonAlertSchema: true }
    ]
    smsReceivers: [
      { name: 'primary', countryCode: '91', phoneNumber: '9000000000' }
    ]
  }
}

resource serviceHealthAlert 'Microsoft.Insights/activityLogAlerts@2020-10-01' = {
  name: 'alert-service-health'
  location: 'global'
  properties: {
    enabled: true
    scopes: [ subscription().id ]
    condition: {
      allOf: [
        { field: 'category', equals: 'ServiceHealth' }
        { field: 'properties.incidentType', equals: 'Incident' } // service issues
      ]
    }
    actions: {
      actionGroups: [ { actionGroupId: ag.id } ]
    }
  }
}
Resource Health alerts
A Resource Health alert pages you when a resource transitions health state — a production VM going from Available to Unavailable. The conditions worth filtering on so you page on real problems, not your own deploys:
| Condition | Typical setting | Reason |
|---|---|---|
| Current status | Unavailable, Degraded | Page on bad states, not on recovery |
| Previous status | Available | Catch the transition into trouble |
| Reason type | Platform Initiated (or any) | Page hard on Azure-caused; optionally include all |
| Resource scope | Production subscription / RG | Avoid paging on dev churn |
az monitor activity-log alert create \
  --name alert-resource-health-prod \
  --resource-group rg-monitoring \
  --scope "/subscriptions/$(az account show --query id -o tsv)/resourceGroups/rg-shop-prod" \
  --condition category=ResourceHealth \
  --action-group ag-oncall \
  --description "Page when a prod resource changes health state"
A design note that saves you from alert fatigue: scope Resource Health alerts to production resource groups, filter on previous=Available so you catch the drop and not the noisy recovery, and decide deliberately about Customer Initiated transitions — including them pages you on every redeploy (usually wrong for on-call, useful in an audit channel). The two alert types compared:
| Aspect | Service Health alert | Resource Health alert |
|---|---|---|
| Fires on | Microsoft platform events for your tenant | A specific resource changing health state |
| Scope | Subscription (services/regions) | Resource / resource group / subscription |
| Best for | “Azure has an outage in my region” | “This VM/DB just went Unavailable” |
| Underlying category | Activity Log ServiceHealth |
Activity Log ResourceHealth |
| Tuning lever | Event type + service + region | Current/previous status + reason type + scope |
| Risk if untuned | Noise from services/regions you do not use | Paging on your own redeploys |
Architecture at a glance
Picture the signal flow left to right, the order you read it in during an incident. On the far left is the Azure platform — the regional control plane and the physical hosts your resources run on. An unplanned problem or scheduled maintenance becomes a Service Health event scoped to your tenant; an affected host or resource emits a Resource Health transition for that exact resource. Both, plus every control-plane operation anyone performs (the deployments, config changes and scale operations that Change Analysis mines), converge into one place: the subscription Activity Log. The Activity Log is the spine — Service Health, Resource Health and change records are all categories within it, which is why a single alerting mechanism watches all of them.
From the Activity Log, two paths fan out. The proactive path runs through Activity Log alert rules — one on ServiceHealth, one on ResourceHealth — into an action group that pages a human the instant Azure declares trouble, before any user notices. The reactive path is the human at 02:14 working the blades in order: Service Health to rule Azure in or out, Resource Health to check this resource, Change Analysis to find the diff that broke it, then Application Insights for application-level proof. The numbered badges mark where each question gets answered and where a misread sends you down the wrong path — trusting the public status page over Service Health, or paging on your own redeploys because a Resource Health alert was left untuned.
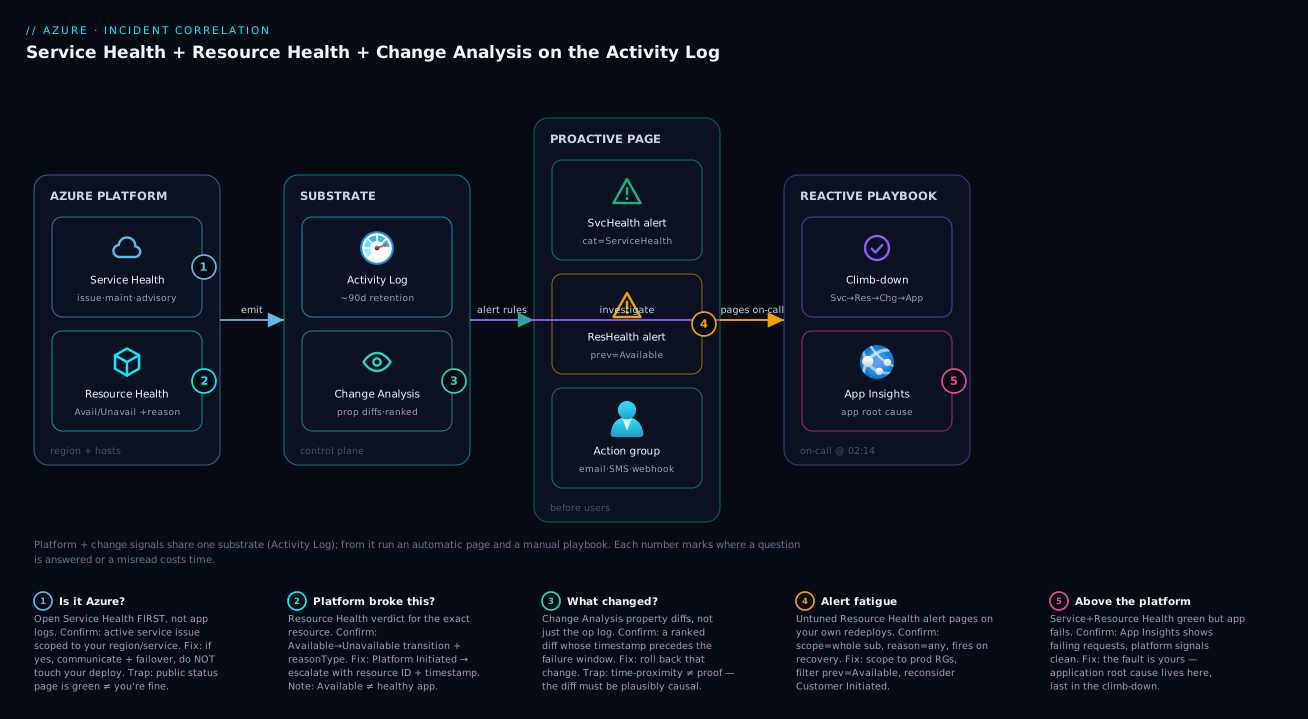
The shape to remember: platform signals and your own change records share one substrate (the Activity Log), and from it you build both the automatic page and the manual playbook. Get that picture; the rest is detail.
Real-world scenario
Northwind Retail runs its e-commerce platform on Azure across two regions — Central India (primary) and South India (DR) — with the storefront on App Service, the catalogue on Azure SQL Database, and Front Door in front. One Tuesday at 02:14 their synthetic monitor went red: intermittent 503s on the storefront in Central India. The on-call SRE, Priya, was paged — not by Azure (Northwind had no Service Health alert) but by their own Application Insights availability test. The Teams channel lit up with the inevitable question: is it us or Azure?
Priya’s first instinct, like most teams, was to dive into App Service logs. Twenty minutes evaporated reading 503s that said the front end had no healthy worker but not why. Then her manager asked the question that reset the investigation: “What does Service Health say?” Priya opened the blade. There was an active service issue on Azure SQL Database capacity, scoped in her view to a dependency her primary region leaned on — but it did not explain storefront 503s, which were App Service, not SQL. Service Health had ruled out a clean “Azure SQL is down in your region” story.
So she climbed the funnel properly. Resource Health on the App Service plan: Available. That single green verdict redirected her — if the platform says the plan is healthy, the 503 (“no healthy worker”) is caused by something above the platform. She opened Change Analysis on the App Service, set the window to 01:30–02:14, and there was the culprit, ranked at the top: at 02:11 an autoscale rule had executed a scale-in, with a property diff showing the instance count dropping from 3 to 1 — three minutes before the symptom. A second change a minute later showed a slot swap that had not warmed the remaining instance. The 503s were not Azure; they were a scale-in that removed capacity at the exact moment a swap left the lone survivor cold.
The fix took four minutes: bump the autoscale minimum instance count from 1 to 2 so a scale-in could never zero out healthy capacity, and re-enable slot warm-up. The 503s cleared. The second half of the incident — from “what does Service Health say?” to resolved — took eleven minutes; the wasted first half had taken twenty. The retro produced two permanent changes: a Service Health alert and a Resource Health alert wired to the on-call action group, and a standing rule that the playbook starts at Service Health, never in application logs. Three months later a genuine storage health advisory arrived days before it would have bitten — they actioned it in business hours, and it never became an incident. The lesson is the thesis of this article: climb from the platform down, and wire Azure to tell you first.
Advantages and disadvantages
Standing up Service Health, Resource Health and Change Analysis as a correlation discipline is high-leverage and nearly free, but not a silver bullet. The honest trade-off:
| Advantages | Disadvantages / limits |
|---|---|
| Answers “is it us or Azure?” in under two minutes, before a support ticket | Tells you whose layer broke, not the application root cause itself |
| Personalised Service Health beats the lagging public status page | Service Health depends on Microsoft declaring an event — there can be a detection lag |
| Resource Health gives a platform verdict before you read any logs | Resource Health is silent on app/config faults; Available ≠ healthy app |
| Change Analysis resolves the plurality of self-inflicted incidents | Property-diff/in-guest coverage varies by resource type and requires enablement |
| Alerts mean Azure pages you, not your users | Untuned alerts cause fatigue (region/service/redeploy noise) |
| All built on the Activity Log — no new pipeline to run | Activity Log retention is ~90 days; long-term needs a Log Analytics sink |
| Free to enable; no per-signal cost for the health blades | Correlation in time is not proof of cause — still needs judgement |
When each matters: Service Health earns its keep on the rare-but-brutal regional event, where “it’s Azure, ETA published” saves hours of self-debugging. Resource Health matters most for single-resource incidents — a VM that mysteriously rebooted — where the platform verdict instantly tells you if Microsoft did it. Change Analysis is the everyday workhorse, because most incidents are self-inflicted and the diff is right there. The discipline as a whole is the cheapest possible upgrade from “guess and restart” to “look and know.”
Hands-on lab
This lab stands up the proactive half — a Service Health alert and a Resource Health alert routed to an action group — then practises the reactive correlation flow against a change you make yourself. It is free-tier friendly: action groups and Activity Log alerts have no fixed cost, and the only resource you create is a cheap web app you delete at the end.
1. Set your subscription and a working resource group.
az account set --subscription "<your-subscription>"
az group create --name rg-shealth-lab --location centralindia
2. Create an action group that emails you. Replace the address with your own.
az monitor action-group create \
  --name ag-lab-oncall --resource-group rg-shealth-lab \
  --short-name laboncall \
  --action email me your.name@example.com
Expected: JSON describing the action group with one emailReceiver. You will get a confirmation email asking you to acknowledge being added.
3. Create a Service Health alert for service issues. Scoped to the whole subscription (Service Health is subscription-level).
SUB_ID=$(az account show --query id -o tsv)
az monitor activity-log alert create \
  --name lab-alert-servicehealth \
  --resource-group rg-shealth-lab \
  --scope "/subscriptions/$SUB_ID" \
  --condition category=ServiceHealth \
  --action-group ag-lab-oncall \
  --description "Lab: notify on any Service Health event"
Expected: a JSON object with enabled: true and your condition. (It fires only when Azure actually emits a Service Health event for your tenant — you may not see it trigger during the lab, which is the point: it is armed for the real thing.)
4. Create a small web app to generate a Resource Health-eligible resource.
az appservice plan create --name plan-lab --resource-group rg-shealth-lab --sku B1 --is-linux
az webapp create --name app-shealth-lab-$RANDOM --resource-group rg-shealth-lab \
  --plan plan-lab --runtime "NODE:20-lts"
5. Create a Resource Health alert scoped to the lab resource group.
az monitor activity-log alert create \
  --name lab-alert-resourcehealth \
  --resource-group rg-shealth-lab \
  --scope "/subscriptions/$SUB_ID/resourceGroups/rg-shealth-lab" \
  --condition category=ResourceHealth \
  --action-group ag-lab-oncall \
  --description "Lab: notify on resource health transitions in the lab RG"
6. Make a change, then correlate it. Restart the web app to generate a control-plane operation and a (Customer Initiated) health blip, then read both back exactly as you would mid-incident.
APP=$(az webapp list -g rg-shealth-lab --query "[0].name" -o tsv)
az webapp restart --name "$APP" --resource-group rg-shealth-lab

# The change you just made, from the Activity Log (operation layer)
az monitor activity-log list --resource-group rg-shealth-lab --offset 30m \
  --query "[?operationName.value contains 'restart' || operationName.value contains 'write'].{time:eventTimestamp, op:operationName.localizedValue, by:caller}" \
  -o table

# The resulting Resource Health transition (note the Customer Initiated reason)
RES_ID=$(az webapp show -g rg-shealth-lab -n "$APP" --query id -o tsv)
az monitor activity-log list --offset 30m \
  --query "[?category.value=='ResourceHealth' && resourceId=='$RES_ID'].{time:eventTimestamp, status:properties.currentHealthStatus, reason:properties.cause}" \
  -o table
Expected: the first query shows your restart operation with your account as caller; the second, after a short delay, shows a health transition whose reason is Customer Initiated — proving the platform correctly attributes the blip to you, not itself. That is the exact signal that, in a real incident, tells you “this was a change we made,” not an Azure fault.
7. Explore the portal views. Open Service Health (search it in the portal) and click through Service issues, Planned maintenance and Health advisories — note any real events scoped to your tenant. Then open the web app → Resource Health to see its current state and history, and Diagnose and solve problems → Changes to see Change Analysis surface your restart.
8. Teardown.
az group delete --name rg-shealth-lab --yes --no-wait
The takeaway: the alerts are armed for real platform events, and you have run the exact correlation flow — change → operation → health transition → reason — that resolves “is it us or Azure?” on a live call.
Common mistakes & troubleshooting
The failure modes here are mostly process failures — wrong place, wrong order, untuned alerts. The most common, with symptom, root cause, how to confirm, and fix:
| # | Symptom | Root cause | How to confirm | Fix |
|---|---|---|---|---|
| 1 | “We learned about the outage from our users” | No Service Health alert wired | No activityLogAlert with category ServiceHealth exists |
Deploy the Service Health alert → action group (above) |
| 2 | Investigation ended because status page was green | Trusting public Azure Status over Service Health | Public page green but Service Health shows a tenant event | Always open Service Health; it knows your footprint |
| 3 | Hour wasted in app logs for an Azure outage | Started in application telemetry, not at the platform | Service Health had an active issue the whole time | Adopt the climb-down order: Service → Resource → Change → App |
| 4 | “Nothing changed” but the app broke | Looked at operations, not property diffs | Activity Log shows a routine “write”; the diff shows the real value change | Use Change Analysis property diffs, not just the op log |
| 5 | Paged constantly, alerts ignored | Resource Health alert includes Customer Initiated + dev scope | Alert scope is whole subscription; reason filter is “any” | Scope to prod RGs; filter previous=Available; reconsider Customer Initiated |
| 6 | Service Health alert never fires | Filtered to a region/service you do not run in | Alert condition lists wrong regions/services | Match the alert’s services/regions to your real footprint |
| 7 | Resource Health says Available but app is down | Conflating platform health with app health | App Insights shows failing requests; platform is green | The fault is yours — go to Change Analysis / App Insights |
| 8 | Can’t find the change that broke it | Looked only at the failing resource | A dependency (NSG, Key Vault, DNS) changed, not the app | Widen Change Analysis to the resource group / dependencies |
| 9 | Correlated a change that was actually innocent | Treated time-proximity as proof | The “change” was a tag edit an hour earlier on another resource | Weigh ranking + diff plausibility, not just timestamp |
| 10 | Old incident’s tracking ID quoted to support | Reused a stale, resolved event ID | The tracking ID maps to a Resolved event | Pull the active event’s tracking ID from Service Health |
| 11 | Maintenance caused a blip nobody expected | Ignored Planned maintenance notices | A maintenance window overlapped the symptom time | Subscribe to Planned maintenance; verify HA absorbs reboots |
| 12 | Lost the evidence after 90 days for the RCA | Relied on Activity Log default retention | Activity Log only goes back ~90 days | Route Activity Log to Log Analytics for long-term retention |
Two distinctions that save the most time during a live call. First, when both a platform issue and your own change could explain a Resource Health transition near the symptom, the reasonType is the tie-breaker — Platform Initiated points at Azure, Customer Initiated at you — cross-checked against Service Health. Second, “Service Health shows nothing, so it’s not Azure” is a trap: detection lag is possible, so corroborate with Resource Health on the affected resource before fully ruling Azure out.
Best practices
- Wire a Service Health alert before you need it. One Activity Log alert on
ServiceHealth, scoped to your services and regions, into the on-call action group — the single highest-leverage action in this article. - Add a Resource Health alert for production, tuned. Scope to prod resource groups, fire on
previous=Available, and decide deliberately about Customer Initiated transitions so you do not page on your own deploys. - Adopt the climb-down order as the playbook’s first step. Service Health → Resource Health → Change Analysis → Application Insights. Forbid “start in app logs.”
- Treat the public status page as a last resort, not a first check. Service Health is your tenant-aware truth; the public page is conservative and lagging.
- Quote the tracking ID in every incident channel. It is the join key between your incident record, the support case, and the eventual PIR.
- Read the Resource Health transition, not just the current state. The previous state, timestamp and
reasonTypeare what let you correlate and assign blame. - Use Change Analysis property diffs, not just the operation log. “Update site config” is an operation; the diff shows the one value that actually changed.
- Correlate on ranking and diff plausibility, not raw time-proximity. A close timestamp is a lead; a plausible cause-and-effect diff is a confirmation.
- Action health advisories in business hours. The cheapest incident is the one you prevent by actioning the advisory before it bites.
- Route the Activity Log to Log Analytics for retention beyond 90 days. Post-incident reviews and audits need history the default retention does not keep.
- Verify HA absorbs planned maintenance. Run ≥2 instances / zone-redundant where it matters so a maintenance reboot never becomes a visible outage.
- Rehearse the correlation flow. A team that has run change→operation→health→reason once in a lab does it in ninety seconds at 02:14.
Security notes
Service Health, Resource Health and Change Analysis are read-mostly, but they touch sensitive surfaces — treat them with least-privilege discipline.
| Concern | Risk | Mitigation |
|---|---|---|
| Who can read Service/Resource Health | Health and change data reveals your topology and failure patterns | Grant Reader at the right scope; do not over-grant Contributor just for visibility |
| Who can manage alert rules | An untrusted actor could disable the Service Health alert, blinding you | Restrict write on Microsoft.Insights/activityLogAlerts to platform owners via RBAC |
| Action group targets leak channels | Emails/SMS/webhook URLs in action groups are a soft target | Store webhook secrets in Key Vault; review action group receivers periodically |
| Change Analysis exposes config | Property diffs can surface setting names (and sometimes values) | Keep secrets in Key Vault references, never as plaintext app settings, so diffs never reveal them |
| In-guest change agent footprint | The Change Analysis agent reads in-guest config on supported compute | Enable only where needed; it follows the resource’s existing identity/permissions |
| Audit trail integrity | The Activity Log is your forensic record | Export to an immutable Log Analytics / storage sink; restrict who can change diagnostic settings |
Two rules worth stating plainly. Least privilege for visibility: reading health and change data needs only Reader — never hand out Contributor or Owner so someone can watch a dashboard. Keep secrets out of properties: because Change Analysis shows property diffs, any secret placed directly into an app setting can appear in a change record; use Key Vault references so the diff shows @Microsoft.KeyVault(...), never the secret. The deep dive on getting that right is Azure Key Vault: Managing Secrets, Keys and Certificates Securely.
Cost & sizing
The good news dominates: the core of this article is effectively free. The health blades carry no per-view charge, and Activity Log alerts and action groups have no fixed monthly fee. What you pay for is downstream and small:
| Component | What drives the cost | Rough figure | Notes / free allowance |
|---|---|---|---|
| Service Health / Resource Health blades | Nothing — included | Free | No per-event or per-view charge |
| Activity Log (90-day retention) | Nothing — included | Free | Default retention; no charge to query |
| Activity Log alert rules | Nothing — included | Free | Activity Log alerts are not metered like metric alerts |
| Action group notifications | Email free; SMS/voice/push metered | Email: free; SMS: a few ₹/USD-cents each | Generous free email; SMS/voice priced per message/region |
| Webhook / Logic App / ITSM action | The downstream resource’s own cost | Varies | A Logic App run or webhook target bills separately |
| Change Analysis (operation/diff) | Included for ARM-level | Free | Built on Activity Log + Resource Graph |
| Activity Log → Log Analytics export | Ingestion + retention beyond 90 days | Per-GB ingested + retention | Only if you need long-term history; size by log volume |
Sizing guidance: the only meaningful spend is the Log Analytics sink if you route the Activity Log there for retention beyond ~90 days — modest versus application logs, sized by your control-plane change rate, not your request rate. For notifications, prefer email and push (free) for routine pages and reserve SMS/voice (metered) for true wake-someone-up severity. The health blades themselves scale with your footprint at no cost. Fold the Log Analytics sink into your monitoring budget as covered in Azure Cost Management Budgets: Setup with Email and Action Group Alerts.
Interview & exam questions
1. What is the difference between Azure Service Health and the public Azure Status page? Azure Status is a global, anonymous, conservative page of broad confirmed events. Service Health is the personalised projection of the same data, filtered to your tenant’s subscriptions, regions and services, often surfacing relevant events earlier and at finer granularity. During your own incident it is the more trustworthy view because it knows what you run. (AZ-104; AZ-305.)
2. What are the three Service Health event types and how does your response differ for each? Service issue (an active unplanned outage — communicate and wait/failover, do not touch your deploy), planned maintenance (scheduled platform work — verify HA absorbs it, expect brief restarts), and health advisory (a notice requiring your action — action it before it becomes an incident). Confusing them is the most common Service Health mistake.
3. What does Resource Health tell you that your application logs cannot?
Whether the platform itself considers a resource healthy, and why it transitioned. It reports Available/Unavailable/Degraded/Unknown with a reasonType of Platform-, Customer-, or Unknown-Initiated — so you learn in one line that Azure rebooted your VM, before reading any logs. (AZ-104.)
4. A VM is Unavailable in Resource Health with reason “Platform Initiated.” Whose problem is it and what do you do? It is Azure’s — the platform caused the transition (host failure or planned reboot). Escalate with the resource ID and transition timestamp, check Service Health for a correlated maintenance/issue, and rely on your HA (availability zones/sets) rather than touching the workload.
5. Resource Health says Available but your app is returning 503s. What does that tell you? The fault is above the platform — your code, config, or a dependency — because the platform considers the resource healthy. Next is Change Analysis for what changed, then Application Insights for the root cause. Available never means “the app is healthy.”
6. What does Change Analysis add over reading the Activity Log directly? The Activity Log lists operations; Change Analysis computes before/after property diffs (and in-guest config on supported compute) and ranks changes by relevance. A routine-looking “update site config” operation hides the one value that changed — the diff reveals it. (AZ-104.)
7. How do you make Azure page you when it declares an outage in your region?
Create an Activity Log alert on category ServiceHealth, filtered to your services/regions and (typically) incidentType=Incident, routed to an action group. Ship it as Bicep for consistency across subscriptions. This is the highest-leverage proactive step.
8. How do you avoid alert fatigue from Resource Health alerts?
Scope to production resource groups, fire on previous=Available to catch the drop not the recovery, match services/regions to your footprint, and decide deliberately about Customer Initiated transitions — including them pages you on every redeploy, usually wrong for on-call.
9. What is a tracking ID and why does it matter? A globally unique identifier on each Service Health event — the join key between your incident channel, support case, and the eventual Post-Incident Review (PIR). Quoting the active event’s tracking ID (not a stale resolved one) lets Microsoft and your team talk about the same event.
10. Walk me through the order you investigate “is it us or Azure?” Climb down from the platform: Service Health (is Azure broken in my region?), Resource Health (is the platform breaking this resource?), Change Analysis (did a change of mine line up?), then Application Insights (application root cause). Starting in application logs wastes the first hour.
11. How long does the Activity Log retain data, and what if you need more? About 90 days by default. For longer retention — required for many post-incident reviews and audits — route the Activity Log to a Log Analytics workspace (or storage) via a diagnostic setting, where you set your own retention. (AZ-305.)
12. Why is “correlation in time” not enough to assign cause to a change? A change with a nearby timestamp may be unrelated — a different resource, or too far before the symptom. Confirmation needs the change to be plausibly causal (the diff actually produces this symptom) and high-ranked for the affected resource. A scale-in that removed the last instance is a culprit; a tag edit an hour earlier is noise.
Quick check
- Your dashboards are red. What is the first blade you open, and why that one rather than your application logs?
- Service Health shows a “health advisory,” not a “service issue.” Is your site down because of Azure right now? What does the advisory actually mean?
- Resource Health reports your App Service plan as Available, but users get 503s. Whose problem is it, and where do you look next?
- You find a config change in Change Analysis two minutes before the outage. Is that proof it caused the incident? What else must be true?
- You want Azure to page you the moment it declares an outage in your region. Which alert do you create, on which Activity Log category, and what is the most important thing to tune?
Answers
- Service Health — it answers “is it Azure?” scoped to your tenant. Open it first because if Azure declared an issue in your region your response changes entirely (communicate/failover, not debug), and starting in app logs wastes the first hour on a problem you do not own.
- No — a health advisory is advance notice needing your attention (a deprecation, a quota/config condition), not an active outage. It may be the future root cause if ignored, but Azure is not breaking your site right now. Look for an active service issue to confirm a live platform outage.
- It is your problem (app/config/dependency), because the platform considers the plan healthy — Available never means the app is healthy. Go to Change Analysis for what changed, then Application Insights for the root cause; the 503 is caused above the platform.
- No, not by itself. Time-proximity is a lead, not proof. It must be plausibly causal — the diff has to actually produce this symptom — and ideally high-ranked for the resource. A scale-in to one instance is a culprit; an unrelated tag edit is coincidence.
- A Service Health alert — an Activity Log alert on category
ServiceHealth(typicallyincidentType=Incident), routed to an action group. The most important tuning is matching services and regions to your real footprint so you page on events that touch you and stay silent on the rest.
Glossary
- Service Health — The personalised projection of Azure platform status, filtered to your tenant’s subscriptions, regions and services; answers “is it Azure?”
- Azure Status — The public, anonymous, global status page (status.azure.com); conservative and lagging, not tenant-aware.
- Resource Health — The platform’s health verdict (Available/Unavailable/Degraded/Unknown) for a single resource, with a classified transition reason.
- Change Analysis — A differential view of what changed on your resources and when — ARM operations, resource property diffs, and in-guest config — ranked by relevance.
- Activity Log — The subscription-level record of control-plane operations; the substrate through which Service Health, Resource Health and change records flow.
- Service issue — A Service Health event type: an active, unplanned, Microsoft-side outage.
- Planned maintenance — A Service Health event type: scheduled platform work that may briefly affect your resources.
- Health advisory — A Service Health event type: a notice requiring your attention/action, often the hidden root cause of a later incident.
- Tracking ID — The globally unique identifier on a Service Health event; the join key to support cases and the PIR.
- PIR (Post-Incident Review) — Microsoft’s published root-cause analysis for a major service issue, available after resolution.
- reasonType — The classifier on a Resource Health transition: Platform Initiated, Customer Initiated, or Unknown.
- Action group — The Azure Monitor notification target (email, SMS, voice, push, webhook, Logic App, ITSM) that an alert routes to.
- Activity Log alert — An alert rule that fires on Activity Log events (e.g. category
ServiceHealthorResourceHealth); the mechanism behind Service Health and Resource Health alerts. - incidentType — The Activity Log field distinguishing Service Health event types (
Incident,Maintenance,Informational/ActionRequired,Security).
Next steps
- Prove application-layer faults once the platform is ruled out with Azure Monitor and Application Insights: Full-Stack Observability.
- Understand where each signal physically lives in The Azure Monitor Data Platform Explained: Metrics, Logs, Traces and Where Each Lives.
- Build the alerting muscle this article relies on in How to Create Your First Metric Alert and Action Group for Email, SMS and Push.
- Take an App Service 503 from “is it us or Azure?” all the way to root cause with Troubleshooting Azure App Service: 502/503 Errors, Cold Starts & Restart Loops.
- Query the Activity Log and resource inventory at scale with Azure Resource Graph Cookbook: KQL Queries for Inventory and Drift at Scale.