The dashboard that updates every five seconds is now eleven minutes behind, and nobody changed anything. The Azure Stream Analytics job — the managed, SQL-based engine that reads a never-ending stream of events, runs a continuous query over time windows, and writes results to a sink — is running, green, no errors. But the numbers it emits describe a world that existed eleven minutes ago, and the gap is growing. This is the most common ASA incident in production, and it’s maddening for the same reason an App Service 502 is: the symptom you see (a stale output, a growing lag) is reported far downstream of what actually broke, and half a dozen distinct root causes hide behind one number.
That number is the Watermark Delay metric, and learning to read it is the entire game. A streaming job processes events in event-time order, holding a window open until it’s confident no more events for it will arrive; the internal clock tracking “I’ve now seen everything up to time T” is the watermark, and Watermark Delay is the wall-clock gap between now and that watermark. When it climbs, three failures look identical from outside: the job is starved of compute (SU % Utilization pinned near 100%, the engine throttling itself), the input is lopsided so one partition drags the whole job, or events arrive so late and out of order the watermark can’t advance. Late events make it worse invisibly: an event arriving after the late-arrival tolerance produces no error — the job silently drops or adjusts it, and your aggregates are simply wrong with no log line to tell you.
This is the diagnostic playbook for that whole family. You will read the event-and-clock pipeline — producer → Event Hubs/IoT Hub partitions → ASA input adapter → watermark → windowed query across SUs → output adapter → sink — and localise a “falling behind” or “wrong results” symptom to exactly one hop, using the instruments that tell the truth: Watermark Delay, SU % Utilization, Backlogged Input Events, Input/Output Events, the job diagram, and resource-log KQL. Every diagnosis comes with the exact metric or portal path to confirm it and the fix (with az CLI and ARM). Because you’ll reach for this mid-incident, the playbook, metric reference, policies and sizing are all scannable tables — read the prose once, keep the tables open when the alarm fires.
What problem this solves
Stream Analytics hides a mountain of distributed-systems machinery so you can write a few lines of SQL and get a partitioned, fault-tolerant stream processor. That abstraction is a gift until the job falls behind, then an opaque wall: a “running,” “healthy” job emitting eleven-minute-old data tells you nothing about why, because the reasons live in metrics you have to know to look at, not an error you get paged for.
What breaks without this knowledge: an engineer restarts the job (which sometimes “fixes” it by accident), bumps the Streaming Units way up (masking skew for a day), or opens a ticket and waits. Meanwhile the actual cause — a query that lost its partition key and can’t parallelise, a TIMESTAMP BY column arriving wildly out of order, a hot Event Hubs partition, or a 5-second late tolerance when the device buffers for minutes — sits there, perfectly diagnosable, ignored.
Who hits this: anyone running real-time analytics on Azure — IoT telemetry, clickstream and fraud scoring, log pipelines, live dashboards. It bites hardest on IoT workloads (buffer-and-reconnect bursts), under-parallelised queries (a non-partition-aligned GROUP BY or reference JOIN collapsing to one node), and cost-trimmed jobs on too few SUs. The fix is almost never “add more SUs” — it’s “find the hop where the watermark stops advancing and make it advance again.”
To frame the field, here is every symptom class this article covers, the question it forces, and the first metric to look at:
| Symptom class | What the job is really telling you | First question to ask | First metric / place to look | Most common single cause |
|---|---|---|---|---|
| Output is stale / lagging | “My watermark is far behind now” | Is the job compute-bound or input-bound? | Watermark Delay + SU % Utilization | SU% pinned ~100% or one hot partition |
| SU% pinned near 100% | “I am out of compute/memory for my state” | Is the query parallel, or collapsed to one node? | SU % Utilization + job diagram | Non-partitioned query; large window state |
| Backlog growing | “Input arrives faster than I drain it” | Throughput ceiling or skew? | Backlogged Input Events per partition | Partition skew or under-provisioned SUs |
| Results look wrong / counts low | “Events arrived too late and I dropped them” | Are late events outside the tolerance? | Late Input Events / Dropped/Adjusted | Late-arrival policy too tight |
| Watermark stuck, not moving | “A partition went idle or a sink is blocking” | Idle input partition or output backpressure? | Watermark Delay flat-high + Output Events flat | Idle partition or a throttled sink |
Learning objectives
By the end of this article you can:
- Read the Watermark Delay metric and explain, mechanically, what the watermark is and why a growing delay means the job’s event-time clock has fallen behind wall-clock time.
- Distinguish event time (the
TIMESTAMP BYcolumn) from arrival time (when Event Hubs received it) and predict how each choice changes windowing, watermarks and late-event behaviour. - Diagnose a lagging job as SU% backpressure, partition skew, a non-parallel query, late/out-of-order events, or an idle partition / blocked output — and confirm which with the exact metric, portal path or KQL.
- Configure the late arrival, out-of-order and error policies deliberately, and explain what each does to dropped vs adjusted vs reordered events.
- Make a query embarrassingly parallel by aligning the partition key end to end (input → query → output) so SUs actually scale throughput.
- Right-size Streaming Units to the job’s windowed state and parallelism — and know when adding SUs helps and when it is just a band-aid over skew or a non-parallel query.
- Drive the core diagnostic surface fluently: Watermark Delay, SU % Utilization, Backlogged Input Events, Input/Output Events, the job diagram per-step metrics, and the resource-log KQL tables.
Prerequisites & where this fits
You should understand stream-processing basics: a query runs forever over time windows rather than a finished table, and results emit as windows close. You should know what Azure Event Hubs is — a partitioned, append-only ingestion log — and ideally have read Event Hubs Fundamentals: Partitions, Consumer Groups, Checkpoints and Offsets for Beginners, because partitions are where most of these problems start. You should run az in Cloud Shell and read a basic ASA query.
This sits in the Data / Observability & Troubleshooting track and pairs tightly with Azure Monitor and Application Insights: Full-Stack Observability — every metric here is an Azure Monitor metric you chart and alert on. The same lag can originate at the sink: if your output is Cosmos DB or Synapse, throughput limits there matter as much as the SUs, and a slow Azure Function output backpressures the whole job.
A quick map of who owns which hop, so you call the right person fast:
| Layer | What lives here | Who usually owns it | Failure classes it can cause |
|---|---|---|---|
| Producer / device | Event generation, buffering, reconnects | App / device team | Late + out-of-order bursts; clock skew |
| Event Hubs / IoT Hub | Partitions, throughput units, retention | Platform / messaging team | Partition skew; ingestion throttling |
| ASA input adapter | Deserialisation, TIMESTAMP BY, watermark |
Data / streaming team | Watermark stuck; deserialisation errors |
| ASA query (across SUs) | Windows, JOINs, GROUP BY, parallelism | Data / streaming team | SU% backpressure; non-parallel collapse |
| ASA output adapter | Batching, conversion, retries | Data / streaming team | Output backpressure; conversion errors |
| Sink (SQL/Cosmos/Blob/etc.) | Write throughput, throttling, schema | Sink owner | Backpressure → watermark stalls upstream |
Core concepts
Five mental models make every later diagnosis obvious.
The watermark is the job’s event-time clock; Watermark Delay is how far behind it is. ASA aggregates by event time — the timestamp inside each event, declared with TIMESTAMP BY — not arrival order. To close the 12:00–12:05 window it must be confident it has seen every event in that range, including a few late stragglers. The watermark is its running answer to “the latest event time I’m now certain I’ve fully seen,” advancing as events arrive. Watermark Delay (seconds) is now − watermark: 8 means the job emits as if eight seconds ago; 600 means ten minutes behind. A growing delay is the universal “falling behind” signal, whatever the cause.
Event time vs arrival time is the most consequential choice you make. TIMESTAMP BY eventTimestamp makes windows use your payload timestamp — correct for “what happened when,” but exposed to clock skew, late arrival and reordering. Omit it and ASA uses arrival time (when Event Hubs enqueued it), which never goes backwards or arrives “late,” so watermarks advance smoothly — but windows now describe ingestion time, wrong whenever the gap matters (a device offline for an hour gets bucketed into the hour it reconnected). Event time buys correctness and the entire late/out-of-order problem.
Late, early and out-of-order are three different things with three policies. A late event’s event time is older than the watermark by more than tolerated. An out-of-order event is earlier than one already processed but within tolerance (reordering, not a true straggler). An early event is ahead of wall-clock (a fast device clock). The knobs: the late arrival tolerance (default 5 s, up to 1,209,600 s = 20 days), the out-of-order tolerance (default 0 s), and the error policy (Drop/Retry). Too small a late window silently loses data; too large makes Watermark Delay intentionally huge.
Streaming Units are CPU+memory, and your window state lives in that memory. A Streaming Unit (SU) is a blended compute allocation; SU % Utilization is how much is in use. Near 100% the engine applies backpressure — slowing intake to avoid OOM, so the watermark stalls. The pressure comes from state: large or many open windows, big JOIN buffers, many distinct grouping keys, in-memory reference data. SUs only help if the query can use them — a job collapsed to one node ignores most of its SUs however high you set the slider.
Parallelism is end-to-end or it is nothing. A job is embarrassingly parallel (each partition processed independently, scaling with SUs) only when the partition key survives the whole pipeline: partitioned input, a query partitioning by that key (PARTITION BY PartitionId or a GROUP BY including it), and per-partition output. Break the chain anywhere — a GROUP BY on a different column, a non-partitioned reference JOIN, an output that can’t partition — and the job collapses to one node, where extra SUs do nothing. Most “I added SUs and nothing happened” stories are a non-parallel query.
These five — the watermark and its delay, event vs arrival time, the late/out-of-order/error policies, SUs and their utilization, and end-to-end parallelism — are the entire vocabulary. The deep sections that follow take each in turn; the glossary at the end repeats them for lookup.
Watermark Delay: reading the one metric that matters
Everything starts here. Watermark Delay is reported per job (and you can split it by partition) and answers one question: how far behind real time is the event-time clock? Charting it for a minute tells you which shape you’re in, and the shape narrows the cause before you touch anything else.
| Watermark Delay shape | What it means | Likely cause class | Next metric to confirm |
|---|---|---|---|
| Flat-low (seconds) | Healthy; keeping up | None | — |
| Slowly rising, never recovers | Intake > drain rate, steadily | SU% backpressure or under-provisioned SUs | SU % Utilization |
| Sawtooth (rises then drops) | Periodic load spikes it recovers from | Bursty input; borderline capacity | Input Events vs SU% correlation |
| Flat-high and stuck | A partition idle, or a sink blocking | Idle partition / output backpressure | Output Events flat? Partition split of delay |
| Huge but stable by design | You set a 20-minute late window | Intentional late tolerance | Check late arrival policy value |
The last row is the trap that wastes the most time: a Watermark Delay of, say, 305 s that never grows or shrinks, on an otherwise-fine job, is almost always a late arrival tolerance you set high — the job is waiting that long for stragglers. Not a bug; the cost of correctness you asked for. Check the policy value before chasing compute.
Always split Watermark Delay by partition: a single number is ambiguous, while per-partition tells you whether one partition is the problem (skew, idle) or all are (a global compute or sink ceiling).
# Chart Watermark Delay for an ASA job (per-job, then split by partition in the portal)
JOB_ID=$(az stream-analytics job show -n asa-telemetry -g rg-stream-prod --query id -o tsv)
az monitor metrics list --resource "$JOB_ID" \
  --metric "OutputWatermarkDelaySeconds" \
  --interval PT1M --aggregation Maximum -o table
Reading note: the metric historically appears as
OutputWatermarkDelaySeconds(the max across partitions). If you don’t see that exact name, look for the display name “Watermark Delay” — the display name is stable even when the internal name varies. Pick it from the list rather than assuming.
The full set of job-health metrics you correlate against Watermark Delay:
| Metric (display name) | What it measures | Healthy looks like | Use it to diagnose |
|---|---|---|---|
| Watermark Delay | Seconds the event-time clock is behind now | Low, flat | The master “falling behind” signal |
| SU % Utilization | % of allocated SU compute/memory in use | < ~80% | Compute/memory backpressure |
| Backlogged Input Events | Events received but not yet processed | ~0, flat | Throughput ceiling / skew |
| Input Events | Count of events read from input | Tracks your real volume | Sudden spikes that precede lag |
| Output Events | Count of events written to sink | Tracks expected output | Flat output = sink blocked / no windows closing |
| Late Input Events | Events later than the watermark beyond tolerance | ~0 (or known baseline) | Silent data loss from tight late window |
| Early Input Events | Events with event time ahead of wall-clock | ~0 | Device clock skew |
| Out-of-Order Events | Events reordered beyond the tolerance | ~0 | Reordering you’re dropping/adjusting |
| Data Conversion Errors | Serialization/schema failures | 0 | Bad payloads / schema drift |
| Runtime Errors | Query/output runtime failures | 0 | Output schema, sink rejects, expr errors |
SU% backpressure: when the engine throttles itself
The most common cause of a steadily rising Watermark Delay is SU % Utilization pinned near 100%. When the job needs more memory than its SU allocation provides — usually from accumulated state — it applies backpressure: it slows reading from the input to avoid OOM, the watermark stalls, and the delay climbs. The cruel part is the job stays green; backpressure is a designed-in safety behaviour, not an error.
Confirm. Chart SU % Utilization with Watermark Delay; both rising while SU% sits at 90–100% means you’re compute/memory-bound.
az monitor metrics list --resource "$JOB_ID" \
  --metric "SU (Memory) % Utilization" \
  --interval PT1M --aggregation Maximum -o table
# Rising toward 100% while Watermark Delay also rises = backpressure
What actually consumes SU memory — so you fix the cause, not just raise the number:
| State driver | Why it costs memory | Reduce it by | Trade-off |
|---|---|---|---|
| Large/long time windows | Every open window holds its accumulating state | Shorter windows; smaller hop overlap | Coarser results / less smoothing |
Many distinct GROUP BY keys |
One state bucket per active key | Reduce cardinality; pre-aggregate upstream | Less granular grouping |
Big JOIN buffers (DATEDIFF window) |
Both sides buffered for the join window | Narrow the join DATEDIFF; filter earlier |
Misses wider-spaced matches |
| Reference data held in memory | The whole reference set is resident | Smaller/narrower reference data; key it | Less context available in-query |
| Sliding/hopping window overlap | Overlapping windows multiply open state | Prefer tumbling where semantics allow | Different windowing semantics |
| Non-parallel collapse | All state on one node, one SU pool | Make the query partition-parallel | Requires aligned partition key |
Fix — in order of correctness. First check whether the query is even parallel (next section); a non-parallel job ignores most SUs. If it is parallel and genuinely needs more compute, raise the SUs:
# Scale a job's streaming units (must be stopped to change scale on older jobs;
# newer jobs allow some changes while running — check the portal Scale blade)
az stream-analytics job update -n asa-telemetry -g rg-stream-prod \
  --streaming-units 12
// ARM: streamingUnits on the job's sku/scale (deploy or update)
{
  "type": "Microsoft.StreamAnalytics/streamingjobs",
  "apiVersion": "2021-10-01-preview",
  "name": "asa-telemetry",
  "location": "centralindia",
  "properties": {
    "sku": { "name": "Standard" },
    "transformation": {
      "name": "Transformation",
      "properties": { "streamingUnits": 12 }
    }
  }
}
Reduce the state before you reduce lag with money: shorter windows, lower grouping cardinality, narrower JOIN windows, heavy aggregation moved upstream. SUs come in a fixed ladder (1/3/6/12/18/24+; SU v2 adds fractional ⅓/⅔), and the ceiling depends on parallelism — roughly one node per ~6 SU of work, so a parallel job spreads across many nodes while a non-parallel one caps at a single node.
The single most important sizing rule: a job uses only as many nodes as its query parallelism allows, and each node has finite SUs — which is why “add SUs” so often does nothing for a single-node query.
Partition skew and the hot partition
A growing Backlogged Input Events concentrated in one partition is partition skew — events unevenly distributed across Event Hubs partitions, so one carries far more load and the job runs only as fast as its busiest partition (overall SU% may look fine while one partition drowns). It’s upstream: Event Hubs hashes the partition key to a partition, so a skewed key (every event from a busy tenant/device/region sharing one key) means skewed load.
Confirm. Split Backlogged Input Events (and Watermark Delay) by PartitionId — one partition with a large, growing backlog while others sit near zero is the signature.
# Backlog per partition — split by PartitionId in the portal chart;
# the CLI gives the aggregate, the portal split shows the skew
az monitor metrics list --resource "$JOB_ID" \
  --metric "InputEventsSourcesBacklogged" \
  --interval PT1M --aggregation Maximum -o table
The ways partitioning goes wrong, and what each one looks like:
| Partitioning problem | What you observe | Root cause | Fix |
|---|---|---|---|
| Hot partition (skew) | One PartitionId backlog grows; others ~0 | Producer keys collapse to few partitions | Re-key producer for even spread; more keys |
| Too few partitions | All partitions backlog together under load | Event Hub created with too few partitions | Recreate hub with more partitions (can’t change in place on Standard) |
| Partition count > parallelism need | Wasted overhead, uneven node mapping | Over-partitioned for the volume | Match partitions to throughput, not vanity |
| Mismatched output partitions | Job can’t write per-partition | Output partition count ≠ input | Align output partitioning / let ASA manage |
| Idle partition stalls watermark | Watermark stuck though most partitions flow | A partition gets no events | Ensure traffic on all, or handle idle-source |
Fix. The durable fix is producer-side: a partition key with high cardinality and even distribution (a hash of device ID, not “region” with five values). You can sometimes increase the Event Hub’s partition count — but on the Standard tier it’s fixed at creation, so that’s a new hub and a migration, and more partitions help only if the key distributes across them.
The idle-partition case stalls the watermark without any backlog: it advances only as fast as the slowest partition, so one receiving no events freezes the global watermark while every other partition flows — the job looks stuck despite healthy throughput. Ensure every partition gets at least a trickle of traffic.
Late-arriving events: the silent wrong-results bug
This is the failure that does not page you. When an event’s event time is older than the watermark by more than the late arrival tolerance, ASA raises no error — it adjusts or drops the event per policy, the window has usually already emitted, and your aggregate is simply wrong, low by however many events you lost. The job is green, the dashboard “live,” and the 14:00–14:05 count silently misses the 9% that arrived at 14:11 when a device fleet reconnected.
Confirm. The Late Input Events metric is the smoking gun — any sustained non-zero value means events are arriving beyond tolerance and being handled by policy, not counted as you’d expect.
az monitor metrics list --resource "$JOB_ID" \
  --metric "LateInputEvents" \
  --interval PT5M --aggregation Total -o table
# Non-zero, sustained = real data is arriving too late and being dropped/adjusted
The two tolerance windows and the error policy interact to decide each event’s fate:
| Event’s situation | Within late window? | Within out-of-order window? | What ASA does |
|---|---|---|---|
| On time, in order | — | — | Processed normally into its window |
| Slightly out of order | yes | yes | Buffered and reordered (held up to the out-of-order window) |
| Out of order beyond tolerance | yes | no | Adjusted to the boundary (Adjust) or dropped (Drop) per out-of-order policy |
| Late beyond the late window | no | — | Handled by error policy: timestamp adjusted to watermark or dropped |
| Early (event time ahead of now) | — | — | Adjusted to the early-arrival boundary (clamped to ~now) |
The three policies you actually set, with their defaults, ranges and the behaviour each unlocks:
| Policy | What it controls | Default | Range / values | Set higher when… | Cost of higher |
|---|---|---|---|---|---|
| Late arrival tolerance | How long to wait for stragglers older than the watermark | 5 seconds |
0 to 1209600 s (20 days) |
Devices buffer offline; bursty reconnects | Watermark Delay grows by ~this much (you wait longer) |
| Out-of-order tolerance | How much reordering to absorb by buffer-and-sort | 0 seconds |
0 to 599 s |
Sources interleave / multiple producers | Adds latency equal to the window; more memory |
| Out-of-order action | What to do with events still out of order | Adjust |
Adjust | Drop |
You’d rather keep (clamp) than lose | Adjust skews timestamps; Drop loses data |
| Error policy (events) | What to do with events that can’t be processed (incl. too-late) | Retry |
Retry | Drop |
Output transiently failing | Retry can stall; Drop loses data |
Fix. Match the late arrival tolerance to the real worst-case lateness of your source. If devices buffer up to ten minutes offline then flush, a 5-second tolerance throws away every flushed event; set it to cover the realistic buffering window (e.g. 600 s), accepting that Watermark Delay will sit around that value because the job is deliberately waiting. Set the out-of-order window to a few seconds to absorb multi-producer interleaving rather than dropping reorderings. Configure both on the input policy:
# Set late-arrival and out-of-order tolerances + handling on the job's event-ordering policy
az stream-analytics job update -n asa-telemetry -g rg-stream-prod \
  --order-max-delay 600 \
  --out-of-order-max-delay 5 \
  --out-of-order-policy Adjust
// ARM: eventsLateArrivalMaxDelayInSeconds / eventsOutOfOrderMaxDelayInSeconds / policies
{
  "type": "Microsoft.StreamAnalytics/streamingjobs",
  "apiVersion": "2021-10-01-preview",
  "name": "asa-telemetry",
  "properties": {
    "eventsOutOfOrderPolicy": "Adjust",
    "eventsOutOfOrderMaxDelayInSeconds": 5,
    "eventsLateArrivalMaxDelayInSeconds": 600,
    "outputErrorPolicy": "Drop"
  }
}
The fundamental trade-off: lateness tolerance is latency you pay for completeness. A high late window means complete aggregates and a large (but stable) Watermark Delay; a low one means low latency and silently incomplete results. Choose on whether your consumer needs fresh or complete numbers, and document it so the next on-call engineer doesn’t “fix” a deliberately high delay.
Making the query embarrassingly parallel
Throughput scales with SUs only when the query is embarrassingly parallel — each partition processed independently on its own node. The rule is end-to-end: partitioned input, a query that keeps that partitioning, output that accepts per-partition writes. Break the chain anywhere and the job collapses to one node, where all the SUs buy nothing and one slow partition stalls the lot. Hop by hop:
| Stage | Keeps it parallel | Breaks it (collapses to one node) |
|---|---|---|
| Input | Event Hubs/IoT Hub with multiple partitions | Single-partition source; non-partitioned input |
| Read | PARTITION BY PartitionId or partition-aligned key |
Reading without preserving the partition key |
Query (GROUP BY) |
Group includes the partition key | GROUP BY on a non-partition column → repartition |
JOIN |
Both sides partitioned on the join key | Reference-data join that gathers all data |
| Aggregation across partitions | Per-partition first, then a second step to merge | A single global aggregate over all partitions |
| Output | Output partitioned by the same key | Output that can only write single-stream |
The cleanest pattern makes the partition explicit — when the aggregation is naturally per-partition, partition by PartitionId:
-- Embarrassingly parallel: each partition aggregated independently
SELECT
    PartitionId,
    deviceId,
    System.Timestamp() AS windowEnd,
    AVG(temperature)   AS avgTemp,
    COUNT(*)           AS readings
INTO   [sql-out]
FROM   [eh-in] PARTITION BY PartitionId TIMESTAMP BY eventTimestamp
GROUP BY PartitionId, deviceId, TumblingWindow(minute, 5)
When you need a global aggregate across partitions, do it in two steps so the heavy per-partition work stays parallel and only a small pre-aggregated stream is merged — a WITH step aggregates per partition, a second query combines:
-- Step 1 (parallel, per partition): partial aggregates
WITH PartialCounts AS (
    SELECT deviceId, System.Timestamp() AS w, COUNT(*) AS c
    FROM [eh-in] PARTITION BY PartitionId TIMESTAMP BY eventTimestamp
    GROUP BY PartitionId, deviceId, TumblingWindow(minute, 5)
)
-- Step 2 (small, merges the partials): final aggregate
SELECT deviceId, System.Timestamp() AS w, SUM(c) AS total
INTO [sql-out]
FROM PartialCounts
GROUP BY deviceId, TumblingWindow(minute, 5)
The signs of a silent collapse: raising SUs doesn’t lower the lag; the job diagram (portal → job → query) shows one processing step swallowing all input; a reference JOIN precedes the heavy step; or the GROUP BY lacks the partition key. The diagnostic tell is worth memorising: low SU% with high Watermark Delay means the problem is NOT compute — you’re bottlenecked on parallelism (or a sink), and adding SUs does nothing. High SU% with high delay is the opposite: genuine memory pressure where more SUs (or less state) helps. Always read the two together.
Architecture at a glance
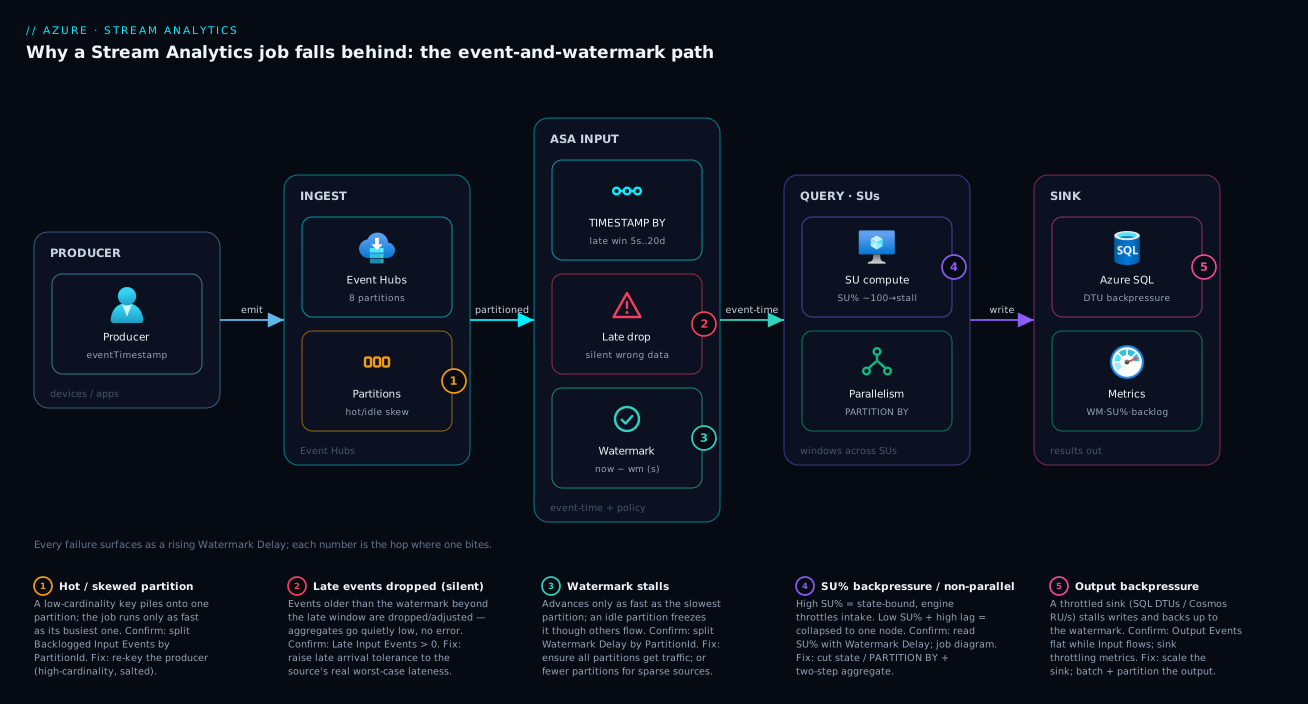
The diagram traces an event from producer to sink and marks the hop where each failure bites, left to right. A producer emits events carrying an eventTimestamp into Event Hubs, sharded across partitions — badge 1, where a skewed key creates a hot partition. The ASA input adapter deserialises and applies TIMESTAMP BY plus the late-arrival/out-of-order policies; badge 2 marks the silent late-event drop, badge 3 the watermark that stalls on an idle partition. Events flow into the windowed query across Streaming Units, where badge 4 marks SU% backpressure and the non-parallel collapse. Finally the output adapter writes to the sink (Azure SQL, Cosmos DB, Blob, or a Function), where badge 5 marks output backpressure — a throttled sink stalling the watermark upstream.
The through-line: every failure surfaces as the same rising Watermark Delay but originates at a different hop, and the combination of metrics tells you which. SU% high → the query node; backlog in one PartitionId → the input; flat Output Events with a stuck watermark → the sink; non-zero Late Input Events → the policy. Confirm the symptom, read the corroborating metric to localise the hop, apply the matching fix.
Real-world scenario
Vaayu Mobility runs a fleet-telemetry pipeline: 40,000 connected scooters push readings every two seconds into Event Hubs (8 partitions, 4 TUs) in Central India, where a Stream Analytics job aggregates five-minute averages per scooter and per city zone into Azure SQL Database for an ops dashboard. The job runs on 6 SUs at about ₹22,000/month; the data team is three engineers.
The incident hit on a Monday rush. The dashboard, normally a few seconds behind, drifted to nine minutes by 09:20 and kept growing. The on-call reflex: restart — it replayed from checkpoint, briefly caught up, then resumed. Second reflex: bump SUs 6 → 18. Nothing happened — Watermark Delay kept rising while SU % Utilization stayed around 35%. The dashboard was now twelve minutes behind during the busiest hour, and ops were dispatching on stale data.
The breakthrough was reading the two metrics together. Low SU% with high Watermark Delay is the textbook signature of a non-parallel query, not a compute shortage — exactly why adding SUs did nothing. The query aggregated GROUP BY zoneId, but zoneId was not the partition key (the producer partitioned by scooterId), so ASA had to repartition every event by zone, collapsing to one node. Eight partitions funnelled into one ceiling; 18 SUs sat across nodes the job couldn’t use.
Two quieter problems lurked. Splitting Backlogged Input Events by PartitionId showed one partition with 3× the backlog — a block of 6,000 depot scooters with sequential IDs hashing to the same partition (skew). And Late Input Events was non-zero: scooters in basement parking buffered ~4 minutes then flushed, but the late tolerance was the default 5 seconds, so those readings were dropped, making battery-health averages quietly wrong.
The fix landed in two parts. That morning: rewrite as a two-step aggregate — a parallel per-partition partial (PARTITION BY PartitionId) feeding a small second step merging by zoneId. Watermark Delay fell from twelve minutes to under ten seconds within one window, on the original 6 SUs (they reverted the pointless bump). The following week: re-key the producer with a salted scooterId so the depot block spread evenly (skew gone), and raise the late arrival tolerance to 300 seconds to capture the basement flushes, accepting a steady ~5-minute delay on the battery aggregates as the price of correct numbers. Live metrics ran sub-ten-second, battery averages were complete, and spend dropped to ₹19,500 — they’d stopped over-provisioning SUs to mask a parallelism bug. The lesson on the wall: “Low SU% with high lag is never a compute problem. Read the two metrics together before you touch the slider.”
The incident as a timeline, because the order of moves is the lesson:
| Time | Symptom | Action taken | Effect | What it should have been |
|---|---|---|---|---|
| 09:20 | Lag at 9 min, climbing | (alert fires) | — | Read Watermark Delay and SU% |
| 09:25 | Lag at 10 min | Restart the job | Brief catch-up, then climbs | Don’t restart blind |
| 09:35 | Lag at 11 min | Bump SUs 6 → 18 | No change; SU% still ~35% | The low SU% was the clue |
| 09:50 | Lag at 12 min | Read SU% + Watermark together | Non-parallel collapse identified | This was the breakthrough |
| 10:05 | Root cause found | Split backlog by PartitionId; check Late Events | Skew + late-drop found too | — |
| 10:20 | Mitigated | Two-step parallel query, revert to 6 SU | Lag → < 10 s | Correct morning-of fix |
| +1 week | Fixed | Re-key producer; late window → 300 s | Skew gone, numbers complete, ₹19,500 | The real fix is query + producer |
Advantages and disadvantages
The managed SQL-over-a-stream model both causes this class of problem and makes it diagnosable:
| Advantages (why this model helps you) | Disadvantages (why it bites) |
|---|---|
| You write SQL, not a distributed-systems framework — windows, joins and aggregation are declarative | The engine hides partitioning and parallelism; a query that looks fine silently collapses to one node |
| Rich first-class metrics (Watermark Delay, SU%, backlog, late events) expose exactly what’s wrong | You must know to read them; the job stays “green” while falling behind or dropping data |
| Watermark + late/out-of-order policies give correct event-time results out of the box | The same policies silently drop late data if mis-set — wrong results with no error |
| Backpressure protects the job from OOM automatically | Backpressure is the lag; it trades freshness for stability with no alarm |
| Scaling is a slider (SUs) and parallel jobs scale near-linearly | Adding SUs does nothing for a non-parallel or sink-bound job — money wasted masking the real bug |
| Checkpointing means a restart resumes, not restarts from zero | A restart can appear to fix lag by replaying faster, teaching the wrong lesson |
| Per-partition processing scales throughput cleanly | One hot/idle partition drags or stalls the whole job; skew is invisible until you split by PartitionId |
The model is right for real-time analytics where you want to ship a query, not operate a Spark/Flink cluster, and where event-time correctness matters. It bites hardest on uneven partition keys (skew), aggregates on a non-partition column (collapse), and buffer-and-flush sources (late events). Every disadvantage is manageable — but only if you know it exists and read the metric that reveals it.
Hands-on lab
Stand up a tiny end-to-end pipeline, watch Watermark Delay react to a non-parallel query, and fix it — on minimal resources you delete at the end. Run in Cloud Shell (Bash); a small Event Hub, a 3-SU job, and Blob output keep cost near zero.
Step 1 — Variables and resource group.
RG=rg-asa-lab
LOC=centralindia
EHNS=ehns-asalab-$RANDOM
EH=telemetry
SA=saasalab$RANDOM   # storage for blob output (lowercase, no dashes)
JOB=asa-lab
az group create -n $RG -l $LOC -o table
Step 2 — Create an Event Hubs namespace and a hub with 4 partitions.
az eventhubs namespace create -n $EHNS -g $RG -l $LOC --sku Standard -o table
az eventhubs eventhub create -n $EH --namespace-name $EHNS -g $RG \
  --partition-count 4 --message-retention 1 -o table
Expected: a hub with partitionCount: 4 — room to demonstrate parallel vs collapsed.
Step 3 — Create a storage account + container for Blob output.
az storage account create -n $SA -g $RG -l $LOC --sku Standard_LRS -o table
az storage container create --account-name $SA -n results -o table
Step 4 — Create the Stream Analytics job (3 SUs) and set the event-ordering policy.
az stream-analytics job create -n $JOB -g $RG -l $LOC \
  --output-error-policy Drop \
  --out-of-order-policy Adjust \
  --order-max-delay 5 \
  --out-of-order-max-delay 0 \
  --data-locale en-US -o table
Expected: a job in the Created state. The order-max-delay 5 is the default 5-second late window.
Step 5 — Add the Event Hub as input and Blob as output in the portal’s Inputs / Outputs blades: input alias eh-in → your hub; output alias blob-out → your storage/results container.
Step 6 — Author a deliberately NON-parallel query — a GROUP BY on a payload field that is not the partition key, forcing a single-node collapse:
SELECT
    deviceId,
    System.Timestamp() AS windowEnd,
    AVG(CAST(temperature AS float)) AS avgTemp,
    COUNT(*) AS readings
INTO [blob-out]
FROM [eh-in] TIMESTAMP BY eventTimestamp
GROUP BY deviceId, TumblingWindow(second, 30)
Step 7 — Start the job and send test events. Start (Start → Now), then push a burst of skewed events (portal Test with sample data, or the Event Hubs Data Explorer). Watch the Monitoring blade.
Step 8 — Observe. Add Watermark Delay and SU % Utilization to the chart. Under load, Watermark Delay rises while SU% stays modest — the non-parallel signature. Split Backlogged Input Events by Partition Id to spot a dominant partition.
Step 9 — Fix it: make the query parallel. Stop the job, partition by PartitionId and group including it, restart:
SELECT
    PartitionId, deviceId,
    System.Timestamp() AS windowEnd,
    AVG(CAST(temperature AS float)) AS avgTemp,
    COUNT(*) AS readings
INTO [blob-out]
FROM [eh-in] PARTITION BY PartitionId TIMESTAMP BY eventTimestamp
GROUP BY PartitionId, deviceId, TumblingWindow(second, 30)
Re-run the same burst: Watermark Delay should stay low because work now spreads across partitions/nodes.
Step 10 — Teardown. Delete everything so you’re not billed:
az group delete -n $RG --yes --no-wait
A running ASA job bills per SU-hour, so deleting (or at least stopping) it is what actually stops the meter.
Common mistakes & troubleshooting
This is the centrepiece — the playbook you keep open when the lag alarm fires: symptom → root cause → confirm (exact metric / portal path) → fix.
| # | Symptom | Root cause | Confirm (exact metric / portal path) | Fix |
|---|---|---|---|---|
| 1 | Output steadily falls behind; Watermark Delay rises and never recovers | SU% backpressure — job is memory/compute-bound on state | Chart SU % Utilization near 100% rising with Watermark Delay | Reduce state (shorter windows, fewer keys) and/or raise SUs if parallel |
| 2 | Raised SUs, nothing changed; SU% stays low while lagging | Non-parallel query collapsed to a single node | SU% low + Watermark Delay high; job diagram shows one step for all input | Re-partition: PARTITION BY PartitionId; two-step aggregate |
| 3 | Backlog grows on one partition; others ~0 | Partition skew — producer key collapses to few partitions | Split Backlogged Input Events by PartitionId | Re-key producer (high-cardinality, even key); salt hot keys |
| 4 | Aggregate counts are low / wrong, no error | Late events dropped beyond the late-arrival tolerance | Late Input Events metric non-zero, sustained | Raise late arrival tolerance to cover real source buffering |
| 5 | Watermark stuck flat-high though throughput looks healthy | An idle partition receives no events; watermark waits for it | Split Watermark Delay by PartitionId; one partition has no Input Events | Ensure traffic on all partitions; design keys to touch all |
| 6 | Watermark stuck; Output Events flat; SU% fine | Output (sink) backpressure — sink throttling stalls upstream | Output Events flat while Input Events flow; Runtime Errors / sink metrics | Scale the sink (DTUs/RU/s); batch output; partition the output |
| 7 | A constant large Watermark Delay that never grows or shrinks | Late arrival tolerance deliberately set high — job is waiting | Check late arrival policy value vs the delay | Not a bug; lower tolerance only if you accept dropping late data |
| 8 | Events seem to land in the wrong time window | Using arrival time (no TIMESTAMP BY) instead of event time |
Inspect the query for TIMESTAMP BY; compare event vs ingest time |
Add TIMESTAMP BY <eventTimeColumn> |
| 9 | Spikes of dropped events; Data Conversion Errors climb | Malformed payloads / schema drift / wrong serialization | Data Conversion Errors metric; resource-log Data conversion entries |
Fix producer schema; correct input serialization/encoding |
| 10 | Job stops or errors on output; Runtime Errors climb | Output schema mismatch or sink rejecting rows | Runtime Errors metric; Activity log; resource-log error events | Align output columns/types; fix sink schema/permissions |
| 11 | Sawtooth lag: catches up then falls behind repeatedly | Bursty input at the edge of capacity | Input Events spikes correlate with Watermark Delay rises | Smooth/buffer producer; raise SUs for headroom; parallelise |
| 12 | Reordered events near window edges are lost | Out-of-order tolerance is 0 and events interleave | Out-of-Order Events metric non-zero | Raise out-of-order tolerance a few seconds; Adjust not Drop |
| 13 | A UDF / Azure ML call makes the whole job lag | A slow function backpressures the pipeline | Function Requests vs Failed Function Requests; latency | Speed up / batch the function; cache; remove from hot path |
| 14 | Restart “fixes” the lag, then it returns within minutes | Restart replays from checkpoint faster, masking the real cause | Lag returns after each restart; underlying metric unchanged | Diagnose the real cause (skew / parallelism / sink); stop restart-as-fix |
| 15 | After scaling Event Hub TUs, ASA still lags | The bottleneck was ASA parallelism or sink, not ingestion | ASA SU% / Watermark unchanged after TU bump | Fix the ASA-side cause; TUs only help if ingestion was throttled |
| 16 | Early events (future timestamps) skew windows | Device clock skew — event time ahead of wall-clock | Early Input Events metric non-zero | Fix device NTP; ASA clamps early events to ~now by default |
Three rows carry a nuance worth stating outright: row 2 (non-parallel collapse) is the highest-leverage fix and the one most often misread as “need more SUs” (the low SU% is the whole tell); row 4 (late drop) is the only failure with no error and no page, so Late Input Events is the only thing that will ever surface it; and row 5 (idle partition) stalls the watermark with zero backlog, because it advances only as fast as the slowest partition.
The error / metric reference
The master playbook is symptom-indexed; this companion is signal-indexed — when a specific metric or log event fires, map it straight to cause and fix. (Watermark Delay / SU% / backlog are covered by playbook rows 1–3.)
| Signal (metric or log event) | What it means | Likely cause | How to confirm | First fix |
|---|---|---|---|---|
| Late Input Events > 0 | Events past the late window dropped/adjusted | Late tolerance too small | The metric itself | Raise late arrival tolerance |
| Out-of-Order Events > 0 | Reorderings beyond tolerance | Out-of-order window 0/too small | The metric itself | Raise out-of-order tolerance; Adjust |
| Early Input Events > 0 | Event time ahead of wall-clock | Device clock skew | The metric itself | Fix device NTP; ASA clamps to ~now |
| Data Conversion Errors > 0 | Deserialization/schema failure | Malformed payload / schema drift / encoding | Metric + resource-log detail | Fix producer schema/serialization |
| Runtime Errors > 0 | Query/output runtime failure | Output schema, sink reject, bad expression | Metric + Activity log + resource log | Align output schema; fix sink/perms |
| Output Events flat | Nothing reaching the sink | Sink blocked, or no windows closing | Compare to Input Events; check sink | Scale/unblock sink; check window logic |
| Failed Function Requests > 0 | UDF / Azure ML calls failing | Slow/failing function | Metric + function logs | Speed up / fix the function |
The metric tells you that something failed, not why. Turn on diagnostic settings → resource logs (the Execution and Authoring categories) to a Log Analytics workspace, and the per-error detail (the bad record, the conversion message, the output failure reason) is queryable in KQL. Metrics are your alarm; resource logs are your microscope.
# Route ASA resource logs to Log Analytics so per-error detail is queryable
az monitor diagnostic-settings create \
  --name asa-diag \
  --resource "$JOB_ID" \
  --workspace $(az monitor log-analytics workspace show -g rg-stream-prod -n law-stream --query id -o tsv) \
  --logs '[{"category":"Execution","enabled":true},{"category":"Authoring","enabled":true}]' \
  --metrics '[{"category":"AllMetrics","enabled":true}]'
// ASA execution errors with detail (Log Analytics) — the microscope behind the metrics
AzureDiagnostics
| where ResourceProvider == "MICROSOFT.STREAMANALYTICS"
| where Category == "Execution"
| where Level == "Error" or Level == "Warning"
| project TimeGenerated, Level, Message_s, Type_s
| order by TimeGenerated desc
Best practices
- Always set
TIMESTAMP BYto your event-time column. Defaulting to arrival time silently buckets by when events arrived, not when they happened — wrong wherever the gap matters. - Match the late arrival tolerance to your source’s real worst-case lateness. Devices that buffer offline for minutes need minutes of tolerance, or their flushed data vanishes with no error. Document the value.
- Make every job embarrassingly parallel by aligning the partition key end to end (input, query, output), with a two-step aggregate for cross-partition results.
- Read SU% and Watermark Delay together, never alone. High SU% + high lag = compute-bound; low SU% + high lag = parallelism or sink bottleneck (SUs won’t help).
- Split metrics by PartitionId during any lag incident — a single aggregate hides skew and idle partitions.
- Alert on leading indicators, not just “job stopped”: Watermark Delay, SU% Utilization, Backlogged Input Events, Late Input Events.
- Keep window state small — shorter windows, lower grouping cardinality, narrow
JOINDATEDIFF, small reference data — to cut the memory that drives backpressure. - Don’t restart the job as a fix. A restart replays from checkpoint and looks like it caught up; the cause is untouched and the lag returns. Diagnose, don’t bounce.
- Right-size the sink to the output rate. A SQL sink out of DTUs or a Cosmos sink throttling RU/s is as much a “Stream Analytics is behind” cause as anything in the engine.
- Turn on resource logs to Log Analytics from day one — metrics are the alarm; the
Executionlogs are the only place per-error detail lives. - Test the parallel path under realistic skew, not uniform synthetic data — uniform data hides the hot-partition and non-parallel-collapse bugs.
The alerts worth wiring before the next incident — leading indicators, not the lagging “job down”:
| Alert on | Signal | Threshold (starting point) | Why it’s leading |
|---|---|---|---|
| Watermark Delay | OutputWatermarkDelaySeconds (Max) |
> your freshness SLO for 5 min | The master falling-behind signal |
| SU saturation | SU % Utilization (Max) | > 80% for 10 min | Predicts backpressure before lag spikes |
| Backlog growth | Backlogged Input Events | rising / > 0 sustained 10 min | Intake outrunning processing |
| Late data loss | Late Input Events | > 0 sustained | Silent wrong-results before anyone notices |
| Output stall | Output Events | == 0 while Input Events > 0 | Sink blocked / no windows closing |
| Conversion errors | Data Conversion Errors | > 0 | Producer schema drift |
Security notes
- Use managed identity for inputs and outputs, not keys. ASA supports a system- or user-assigned managed identity to authenticate to Event Hubs, Azure SQL, Blob, Synapse and more — no shared keys in config. Grant least privilege (e.g.
Azure Event Hubs Data Receiveron the input, a minimal write role on the sink), never Contributor. - Lock input and output behind the network with VNet integration / managed private endpoints, so the job reaches Event Hubs and the sink over the backbone and their firewalls can deny public access.
- Keep secrets out of the query and config — reference managed identity, and where a secret is unavoidable source it from Azure Key Vault, not the job definition.
- Scope the sink’s role to write-only where possible — the job writes results, it doesn’t read or manage the sink; a narrow role limits blast radius if the identity is compromised.
- Don’t leak sensitive fields into logs or outputs — resource logs can capture record detail on conversion errors; keep PII out and project only the columns you need.
- Audit changes through the activity log and manage the job as code (ARM/Bicep) so query/scale/policy changes go through PR, not ad-hoc portal edits.
Secure and resilient pull the same way here: managed identity removes keys that could leak and the silent auth failures of stale/rotated keys; managed private endpoints isolate the input and sink and sidestep the internet-path latency that masquerades as lag; and resource logs both reveal “who changed the query/scale” and give you the diagnostic microscope this whole playbook leans on.
Cost & sizing
The bill drivers and how they interact with the fixes:
- Streaming Units dominate the bill — you pay per SU-hour while the job runs, regardless of data volume. The cheapest path to “keeps up” is not more SUs; it’s a parallel query that uses the SUs you already pay for. Most ASA over-spend is SUs bought to mask a non-parallel or skewed job.
- Right-size SUs to state and parallelism, not volume. A 6-SU parallel job often outruns an 18-SU collapsed one. Start small, watch SU% under realistic load, raise only when SU% is genuinely high and the query is parallel.
- The sink is a separate, easy-to-miss bill and bottleneck. SQL DTUs/vCores, Cosmos RU/s, or a Functions plan all cost money and can backpressure the job — under-provisioning shows up as “ASA is behind,” and the fix is sink capacity, not SUs.
- Event Hubs throughput units are their own upstream line item; throttled ingestion can look like ASA lag, but raising TUs only helps if ingestion was the bottleneck (it usually isn’t).
- Stopping the job stops the SU meter. Dev/test jobs left running overnight bill for nothing; there’s no “scale to zero while running.”
A rough monthly picture for a small production telemetry job: 6 SUs continuous runs ~₹18,000–24,000, plus the sink (~₹8,000–20,000) and Event Hubs (~₹4,000–10,000). Vaayu landed at ₹19,500 after parallelising and right-sizing down — the fix is usually the query, not a bigger slider. What each driver buys:
| Cost driver | What you pay for | Rough INR / month | What it fixes | Watch-out |
|---|---|---|---|---|
| Streaming Units (job) | Per SU-hour while running | ~₹18,000–24,000 (6 SU) | Throughput if parallel | Doesn’t help a non-parallel/skewed job |
| Sink (Azure SQL) | DTUs / vCores | ~₹8,000–20,000 | Output backpressure | Under-sized sink stalls the watermark |
| Sink (Cosmos DB) | RU/s provisioned/autoscale | ~₹10,000–30,000 | Output backpressure | RU/s throttling looks like ASA lag |
| Event Hubs | Throughput / processing units | ~₹4,000–10,000 | Ingestion ceiling | TUs only help if ingestion-bound |
| Log Analytics (logs) | Per-GB ingestion | ~₹1,000–3,000 | Error detail / diagnosis | Sample/scope if very chatty |
Interview & exam questions
1. What is the Watermark Delay metric and what does a growing value mean? It’s the gap in seconds between wall-clock now and the job’s watermark — the event-time up to which the engine is confident it has seen all events. A growing value means the event-time clock is falling behind real time, so results are increasingly stale; it’s the universal “falling behind” signal whatever the cause.
2. Difference between event time and arrival time, and how do you choose? Event time is the payload timestamp declared with TIMESTAMP BY; arrival time is when Event Hubs enqueued the event (used when TIMESTAMP BY is omitted). Event time gives correct “what happened when” windows but exposes you to late/out-of-order events; arrival time advances smoothly but buckets by ingestion time, wrong when sources buffer. Choose event time for correctness, then manage lateness with the tolerance windows.
3. You raise the SUs and the lag doesn’t change, and SU% stays low. What’s wrong? The query is not parallel — collapsed to a single node (often a GROUP BY on a non-partition column or a non-partitioned reference JOIN), so the extra SUs sit unused. Low SU% + high Watermark Delay is the signature; fix by aligning the partition key end to end (PARTITION BY PartitionId, two-step aggregate).
4. Aggregate counts look low but there are no errors. Cause and confirmation? Late-arriving events beyond the late arrival tolerance are silently dropped/adjusted — the window already closed before they arrived. Confirm with Late Input Events (non-zero, sustained); fix by raising the late tolerance to the source’s worst-case lateness, accepting a larger but stable delay.
5. What does the late arrival tolerance do, and what’s the trade-off? It’s how long the job waits for stragglers older than the watermark before refusing them (default 5 s, up to 20 days). A larger window captures more late data but raises Watermark Delay by roughly that amount — latency traded for completeness.
6. How does partition skew cause a job to fall behind, and how do you confirm it? A low-cardinality/collapsing partition key creates a hot partition carrying far more load, and the job runs only as fast as its busiest partition. Confirm by splitting Backlogged Input Events by PartitionId (one dominant partition is the tell); fix producer-side with a high-cardinality, evenly distributed key.
7. What makes a query “embarrassingly parallel”? The partition key is preserved end to end: partitioned input, a query partitioning by that key (PARTITION BY PartitionId or a GROUP BY including it), and per-partition output. Then each partition runs independently on its own node and throughput scales near-linearly with SUs; break the chain anywhere and it collapses to one node.
8. The watermark is stuck high but throughput looks healthy everywhere. Cause? Most likely an idle partition: the watermark advances only as fast as the slowest partition, so one receiving no events freezes it while others flow (confirm by splitting Watermark Delay by PartitionId). The other candidate is output backpressure from a throttled sink — check Output Events (flat?) and the sink’s throttling metrics.
9. SU% is pinned at 100% and lag is rising. What’s happening and the fixes? The job is memory-bound on state and applying backpressure to avoid OOM, which stalls the watermark. In order: reduce state (shorter windows, lower cardinality, narrower joins), then raise SUs if the query is parallel (a non-parallel job can’t use them).
10. Out-of-order tolerance vs late arrival tolerance? Out-of-order (default 0 s, up to 599 s) buffers and reorders recent events that arrive slightly out of sequence; late arrival (default 5 s) decides how long to wait for events older than the watermark. One handles reordering within the recent window, the other true stragglers — both add latency for correctness.
11. Why is restarting a lagging job a bad first move? A restart resumes from checkpoint and replays the backlog, which can temporarily catch up and look like a fix — but the cause (skew, non-parallel, throttled sink) is untouched, so the lag returns within minutes. Diagnose the metric combination instead.
12. Output is Azure SQL and the job lags despite low SU%. Where do you look? At the sink: low SU% with rising lag points away from compute, and a SQL sink out of DTUs/vCores throttles writes, backing up the output and stalling the watermark upstream. Confirm with flat Output Events while Input flows, plus SQL’s DTU/throttling metrics; fix by scaling, batching and partitioning the write.
These map to DP-203 (Azure Data Engineer Associate) — develop a stream processing solution with windowing, partitioning, and late/out-of-order handling — and to monitoring objectives shared with AZ-204 / AZ-104. A compact cert-mapping:
| Question theme | Primary cert | Objective area |
|---|---|---|
| Watermark, event vs arrival time, windowing | DP-203 | Develop stream processing; event-time semantics |
| Late / out-of-order policies | DP-203 | Handle late/duplicate/out-of-order data |
| Partitioning & parallelism (SUs) | DP-203 | Scale and optimize stream processing |
| Metrics, alerts, resource logs | AZ-204 / AZ-104 | Monitor and troubleshoot Azure solutions |
| Sink throughput (SQL/Cosmos) backpressure | DP-203 | Design/optimize the serving/sink layer |
Quick check
- A job’s Watermark Delay sits at exactly 300 seconds and never grows or shrinks; the job is otherwise healthy. What’s the most likely explanation, and is it a bug?
- You raise the SUs from 6 to 18 and the lag doesn’t budge while SU % Utilization stays around 30%. What does that combination tell you?
- Your five-minute averages are quietly low after a network blip on a device fleet, with no error in the portal. Which single metric confirms the cause, and what do you change?
- The watermark is stuck high but every partition you can see is flowing with healthy throughput. Name one cause and how you’d confirm it.
- True or false: increasing the Event Hub’s partition count always fixes partition skew.
Answers
- The late arrival tolerance is set to ~300 s, so the job is waiting that long for stragglers before closing windows. Not a bug — the latency cost of completeness; don’t lower it unless you accept dropping late data.
- The query is not parallel — collapsed to one node, so the extra SUs go unused. Low SU% + high Watermark Delay means the bottleneck is parallelism (or the sink), not compute. Fix by aligning the partition key end to end, not by adding SUs.
- Late Input Events (non-zero, sustained) confirms flushed events arrived after the late window and were dropped/adjusted. Raise the late arrival tolerance to the devices’ realistic offline-buffering window, accepting a larger but stable delay.
- An idle partition receiving no events freezes the global watermark (it advances only as fast as the slowest partition). Confirm by splitting Watermark Delay by PartitionId for a flat watermark with ~zero Input Events. (Output backpressure is the other candidate — check Output Events.)
- False. More partitions help only if the key distributes across them; the same collapsing key still piles onto a few. The durable fix is a high-cardinality key at the producer (and on Standard you can’t change partition count in place anyway).
Glossary
- Watermark — the job’s running estimate of the latest event time it’s confident it has fully seen; the event-time clock windows close against.
- Watermark Delay — the metric
now − watermark, in seconds; how far behind real time the event-time clock has fallen. The universal “falling behind” signal. - Event time — the timestamp inside the payload, declared with
TIMESTAMP BY; used for windowing when present. - Arrival time — when Event Hubs/IoT Hub enqueued the event; used when
TIMESTAMP BYis omitted (never late or out of order, but wrong-time for buffered sources). TIMESTAMP BY— the clause telling ASA which column carries event time; switches the job from arrival-time to event-time semantics.System.Timestamp()— the function returning the event/window timestamp inside the query, to select or group by window time.- Late arrival tolerance — how long the job waits for stragglers older than the watermark (default 5 s, up to 20 days) before dropping/adjusting them.
- Out-of-order tolerance — how much reordering the job absorbs by buffer-and-sort (default 0 s, up to 599 s).
- Error / out-of-order policy —
DropvsAdjust(andRetryvsDropfor output) for events it can’t process in order or in time. - Streaming Unit (SU) — a blended CPU+memory allocation; the compute ceiling window/join state must fit within.
- SU % Utilization — how much of the allocated SU compute/memory is in use; near 100% triggers backpressure.
- Backpressure — the engine slowing intake when memory is scarce, stalling the watermark and raising the delay (a safety behaviour, not an error).
- Backlogged Input Events — events received but not yet processed; a growing per-partition backlog signals a throughput ceiling or skew.
- Partition — an independent shard of the input stream; the unit of parallelism and where skew and idle-partition stalls originate.
- Partition skew — uneven distribution across partitions (a collapsing partition key) creating a hot partition that drags the whole job.
- Embarrassingly parallel — the partition key preserved input→query→output so each partition runs independently and SUs scale throughput.
- Two-step aggregate — aggregate per partition first (parallel), then merge the small partials (cross-partition) to keep heavy work parallel.
- Late / Early / Out-of-Order Input Events — metrics counting events past the late window, ahead of wall-clock, and reordered beyond tolerance.
Next steps
You can now localise any “Stream Analytics is falling behind” or “the numbers are wrong” symptom to a hop and fix it. Build outward:
- Next: Azure Monitor and Application Insights: Full-Stack Observability — the metrics, alerts and KQL that power this whole playbook.
- Related: Event Hubs Fundamentals: Partitions, Consumer Groups, Checkpoints and Offsets for Beginners — partitions are where most of these problems start.
- Related: Metrics vs Log Analytics: Choosing the Right Store for Speed, Cost and Retention — alert on a metric vs query resource logs for per-error detail.
- Related: No Logs Showing Up? Troubleshooting Empty Log Analytics Tables and Ingestion Gaps — if your ASA resource logs aren’t landing.
- Related: Azure Functions Triggers and Bindings for Beginners: Connecting Code to Events Without Boilerplate — when the output is a Function that can backpressure the job.