Where this fits
By Part 5, the landing zone already has its resource hierarchy (Part 1), identity (Part 2), networking (Part 3), and security and detective controls (Part 4) — and Operations & Billing is the layer that makes the running estate observable and accountable. Everything underneath generates two firehoses no enterprise can run blind without: operational telemetry (logs, metrics, traces) and financial telemetry (cost). This phase decides where both firehoses land, who can query them, how long they are retained, and what pages a human when something breaks the budget or the SLO. Because the resource hierarchy lets you aggregate at the Organization node, Operations & Billing is the one phase where you get a genuine single pane of glass — one set of log buckets, one set of monitoring scopes, one BigQuery billing dataset — covering every project the foundation will ever create.
In a nutshell
Picture the operations pillar as the control room and finance office of a large airport. Every gate, runway, baggage belt, and shop — those are your projects — is constantly producing two kinds of signal: what is happening (camera feeds, sensor readings, incident reports = logs, metrics, traces) and what it costs (every till and meter = spend). If each gate kept its own logbook in its own drawer and its own petty-cash tin, nobody could actually run the airport. An incident would mean running gate to gate collecting evidence, and a shop leaving every light on all month would be invisible until the quarterly electricity bill landed.
The operations pillar builds two things the whole airport shares. First, one control room where every feed and sensor lands — that is centralized Cloud Logging and Cloud Monitoring. Second, one finance desk where every till reports — that is BigQuery billing export and budgets. On top of both sits an alarm panel that pages the right team the moment a runway’s on-time SLA slips or a shop blows its budget — that is SLOs, alerting, and budget alerts. The crucial detail: the control room and the finance desk are locked rooms. The shops can stream into them but cannot edit the master logs or cook the books — which is exactly what an auditor needs to trust the record.
Two ideas carry the whole lesson. A sink is the pipe that carries a copy of every log to a central store, and an aggregated sink set at the Organization node with includeChildren=true scoops up every project beneath it in one stroke — that is how you turn thousands of scattered log streams into one governed estate. A metrics scope does the same for monitoring: one nominated project from which an SRE can dashboard and alert across dozens of workloads without project-hopping. Get these two aggregation points right and everything else — retention locks, error-budget alerts, FinOps dashboards — hangs off them.
Level: Advanced · Time: ~36 min
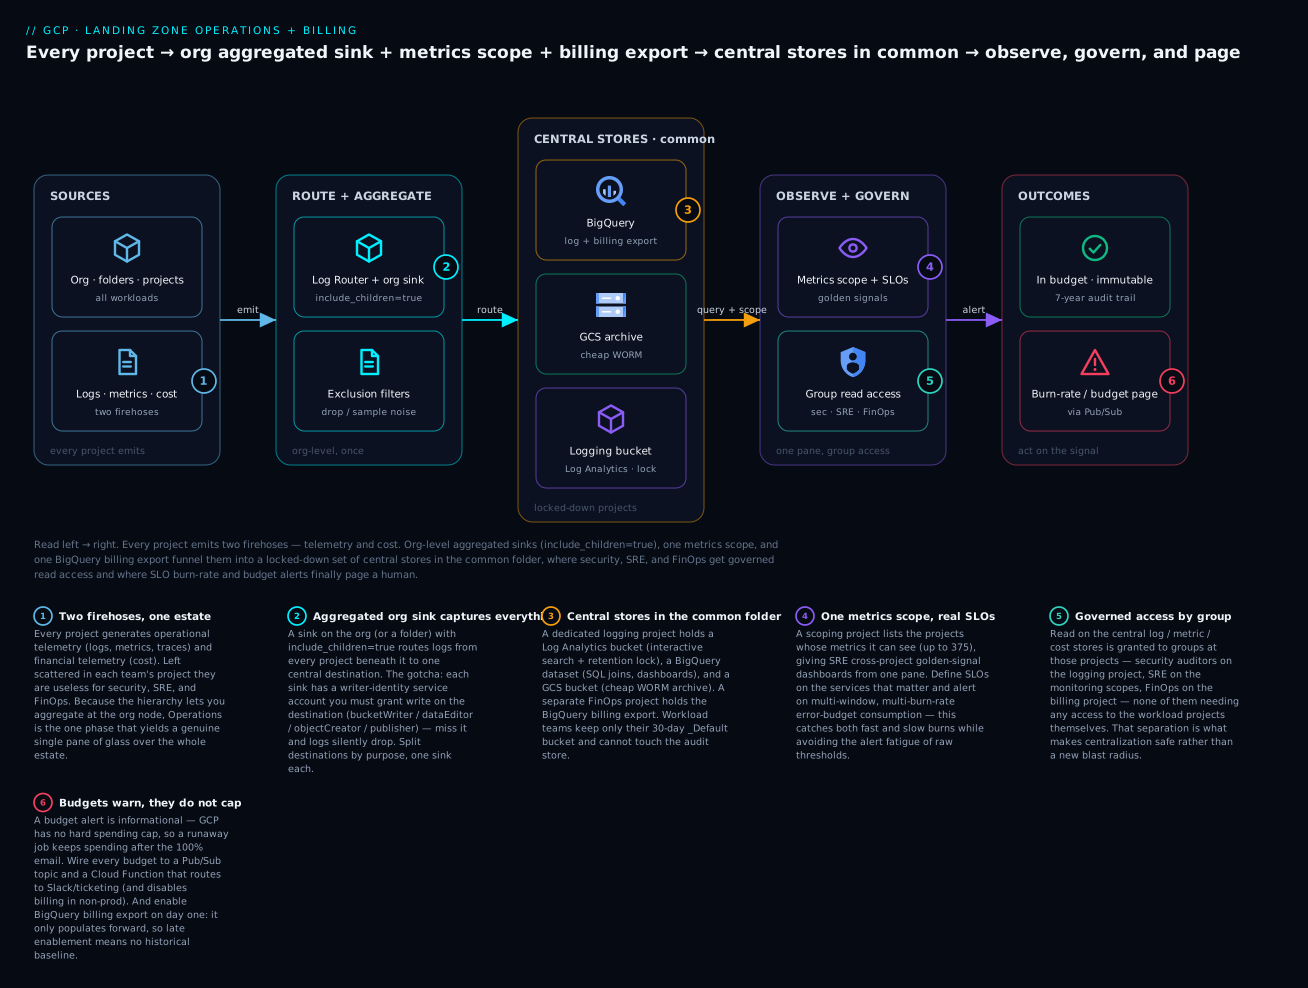
The diagram reads left to right: every project emits telemetry and cost; org-level aggregated sinks, one metrics scope, and one billing export funnel them into a locked-down set of central stores in the common folder; and from there security, SRE, and FinOps get governed read access while burn-rate and budget alerts finally page a human — nobody needing access to the workload projects themselves.
Prerequisites & what you’ll be able to do. This is Part 5 and it leans on the earlier foundation: you’ll want the resource hierarchy and common folder from Part 1 (the sinks, scopes, and FinOps datasets all live in dedicated projects there), the group-based access model from Part 2, and the security and detective controls from Part 4 (centralized logs are the substrate Security Command Center and your SIEM feed off). If you want to go deeper on either service itself, the Cloud Monitoring & Logging operations-suite deep dive and the billing, budgets & discounts deep dive go further than a landing-zone chapter can. Comfort reading a little gcloud, Terraform, and SQL helps but is not required. After this you will be able to:
- Design org-level aggregated log sinks (
includeChildren=true) into a dedicated logging project, split by purpose across a Log Analytics bucket, BigQuery, and a Pub/Sub → SIEM feed. - Lock an audit-log bucket to a compliance retention floor so not even an org admin can shorten or delete it.
- Stand up metrics scopes that give an SRE team one pane over dozens of projects, and alert on multi-window, multi-burn-rate error budgets instead of raw thresholds.
- Turn cost into a monitorable signal with BigQuery billing export and layered budgets wired to Pub/Sub for programmatic response.
- Wire logs, metrics, traces, and cost into one centralized observability operating model with governed, group-based access.
- Avoid the writer-identity, forward-only-export, and no-hard-cap traps that silently break real landing zones.
Cloud Logging — aggregated sinks and log buckets
What it is
Cloud Logging is GCP’s managed log-management service. Every log entry flows first into the Log Router, which evaluates a set of sinks and decides where each entry goes. A sink is filter → destination: an inclusion filter (and optional exclusion filters) written in the Logging query language, pointing at one of four destination types — a Cloud Logging bucket, a BigQuery dataset, a Cloud Storage bucket, or a Pub/Sub topic. Two sinks exist in every project by default: _Required (admin/audit activity, fixed 400-day retention, cannot be modified or disabled) and _Default (everything else, routed to the _Default log bucket, 30-day retention, editable).
The landing-zone pivot is the aggregated sink: a sink created not on a project but on a folder or the Organization node, with the includeChildren flag set true, so it captures logs from every project beneath it and routes them to a central destination. This is the mechanism that turns thousands of per-project log streams into one governed log estate.
Why it matters
Logs that stay scattered in each team’s _Default bucket are useless for security, compliance, and incident response — an investigator would have to query 70 projects individually, and a team with project-level access could tamper with or delete the evidence of their own actions. Centralizing logs solves three problems at once:
- Tamper-resistant retention. Audit logs routed by an org-level aggregated sink land in a bucket in a dedicated, locked-down logging project that workload teams cannot touch. Apply a bucket retention lock and the logs become immutable for the retention window — exactly what auditors (PCI-DSS, SOC 2, RBI/SEBI) demand.
- One place to search. Security and platform teams query a single aggregated destination instead of chasing per-project streams.
- Cost and residency control. You route the high-volume, low-value logs (e.g. Data Access logs, load-balancer request logs) to cheap Cloud Storage or drop them with exclusion filters, while keeping the valuable Admin Activity logs hot and queryable — and you pin every bucket to an approved region.
How to do it well
- Stand up a dedicated logging project under the
commonfolder (from Part 1), owned by the platform/security team, holding the central log buckets and BigQuery log datasets. Nothing else runs there. - Create org-level aggregated sinks with
includeChildren=true, splitting destinations by purpose: a Log Analytics-enabled Logging bucket for interactive security search and retention, a BigQuery dataset for SQL joins and long-term analytics, optionally a Pub/Sub topic for streaming to a SIEM (Chronicle / Google SecOps, Splunk). - Use Log Analytics buckets — they store entries in a Logging bucket but make them queryable with BigQuery SQL via a linked dataset, giving you SQL power without paying to duplicate data into BigQuery storage.
- Cut noise with exclusion filters and the right log buckets. Exclude or sample chatty
_Defaultentries; turn on Data Access audit logs deliberately and route them separately because they are voluminous and expensive. - Lock retention on the audit bucket. Set retention to your compliance floor (e.g. 400+ days) and apply a retention lock so not even an org admin can shorten or delete it.
- Manage it all as code —
google_logging_organization_sink,google_logging_project_bucket_config, and dataset/IAM resources in the foundation Terraform, never click-configured.
Worked example: an immutable org-wide audit sink
Here is the whole audit-logging spine, built in the order that matters — and step 4 is the one everyone forgets. Project IDs and the org ID are placeholders.
export ORG_ID="123456789012"
export LOG_PROJECT="prj-logging"
export REGION="asia-south1"

# 1) A Log Analytics-enabled logging bucket for the audit trail (7-year retention).
gcloud logging buckets create audit-bucket \
  --project="${LOG_PROJECT}" \
  --location="${REGION}" \
  --enable-analytics \
  --retention-days=2555

# 2) Link a BigQuery dataset so the bucket is queryable with standard SQL — no data copy.
gcloud logging links create audit_analytics \
  --project="${LOG_PROJECT}" \
  --location="${REGION}" \
  --bucket=audit-bucket

# 3) The org-level AGGREGATED sink: every project's audit logs → the central bucket.
gcloud logging sinks create org-audit-sink \
  "logging.googleapis.com/projects/${LOG_PROJECT}/locations/${REGION}/buckets/audit-bucket" \
  --organization="${ORG_ID}" \
  --include-children \
  --log-filter='logName:"cloudaudit.googleapis.com"'

# 4) THE GOTCHA — grant the sink's writer-identity SA permission on the destination,
#    or entries are silently discarded. Each sink gets its own writer identity.
WRITER=$(gcloud logging sinks describe org-audit-sink \
  --organization="${ORG_ID}" --format='value(writerIdentity)')

gcloud projects add-iam-policy-binding "${LOG_PROJECT}" \
  --member="${WRITER}" \
  --role="roles/logging.bucketWriter"

# 5) Only once logs are safely landing, LOCK retention — this is irreversible.
gcloud logging buckets update audit-bucket \
  --project="${LOG_PROJECT}" --location="${REGION}" --locked
The writer identity in step 4 is the single most common reason a freshly created sink “isn’t working”: the sink exists, the filter matches, but the destination silently drops every entry because the sink’s service account has no write permission there. The role you grant depends on the destination — roles/logging.bucketWriter for a Logging bucket, roles/bigquery.dataEditor for a BigQuery dataset, roles/storage.objectCreator for a GCS bucket, roles/pubsub.publisher for a Pub/Sub topic.
A second aggregated sink handles analytics into BigQuery and shows off exclusion filters to keep the bill sane:
# Analytics sink → BigQuery, EXCLUDING high-volume, low-value load-balancer 2xx noise.
gcloud logging sinks create org-analytics-sink \
  "bigquery.googleapis.com/projects/${LOG_PROJECT}/datasets/all_logs" \
  --organization="${ORG_ID}" \
  --include-children \
  --use-partitioned-tables \
  --exclusion='name=drop-lb-2xx,filter=resource.type="http_load_balancer" AND httpRequest.status<400'
# Remember to grant THIS sink's writerIdentity roles/bigquery.dataEditor on the dataset.
The same spine as Terraform, so it lives in the foundation pipeline and is reviewed in a PR rather than clicked:
resource "google_logging_project_bucket_config" "audit" {
  project          = var.log_project
  location         = "asia-south1"
  bucket_id        = "audit-bucket"
  retention_days   = 2555   # ~7 years
  enable_analytics = true
  locked           = true   # immutable — cannot be shortened or deleted
}

resource "google_logging_organization_sink" "audit" {
  name             = "org-audit-sink"
  org_id           = var.org_id
  include_children = true
  destination      = "logging.googleapis.com/projects/${var.log_project}/locations/asia-south1/buckets/${google_logging_project_bucket_config.audit.bucket_id}"
  filter           = "logName:\"cloudaudit.googleapis.com/activity\" OR logName:\"cloudaudit.googleapis.com/data_access\""
}

# Grant the sink's auto-created writer identity write on the destination bucket.
resource "google_project_iam_member" "audit_writer" {
  project = var.log_project
  role    = "roles/logging.bucketWriter"
  member  = google_logging_organization_sink.audit.writer_identity
}
Concrete artifacts, decisions, and tools
| Sink destination | Best for | Retention / query model | Cost note |
|---|---|---|---|
| Cloud Logging bucket (Log Analytics on) | Interactive security search + retention | Custom retention (to 3650 days); query via Logs Explorer + BigQuery SQL | Storage billed per GiB beyond the free _Default |
| BigQuery dataset | SQL joins, dashboards, long-term analytics | Table-per-day; standard BQ retention/partition expiry | Pay for streaming insert + BQ storage |
| Cloud Storage bucket | Cheap cold archive, WORM compliance | Lifecycle rules; Bucket Lock for immutability | Cheapest per-GB; not queryable directly |
| Pub/Sub topic | Streaming to SIEM (Chronicle/Splunk) | Transient; consumer-defined | Pay per message; real-time |
| Artifact / decision | GCP service or tool | Notes |
|---|---|---|
| Central log project | Cloud Logging in a dedicated common-folder project |
Locked down to platform/security |
| Org aggregated sinks | google_logging_organization_sink (include_children = true) |
One per destination/purpose |
| Audit log bucket | Logging bucket + retention lock | 400+ days, immutable |
| Log Analytics | Log Analytics-enabled bucket + linked BigQuery dataset | SQL over logs without data duplication |
| Noise control | Exclusion filters, Data Access log config | Drop/sample low-value logs |
| SIEM feed | Pub/Sub → Chronicle / Google SecOps | Real-time detection pipeline |
Cloud Monitoring — metrics, SLOs, and alerting at org scale
What it is
Cloud Monitoring collects metrics, uptime checks, dashboards, SLOs, and alerting for GCP (and AWS/on-prem via the Ops Agent). Its central organizing concept is the metrics scope (formerly “Workspace”). A metrics scope lives in a scoping project and lists the projects whose metrics it can see. By default a project’s scope contains only itself; the landing-zone move is to nominate one or a few scoping projects that have many monitored projects added to their scope, giving an SRE team a single project from which to dashboard and alert across dozens of workloads. (A scoping project can hold up to 375 monitored projects, so very large estates use a small number of scoping projects, typically split by environment.)
Why it matters
Without a deliberate scope design, every team can only see its own project’s metrics and there is no org-wide view of “is the platform healthy?” Centralizing monitoring delivers:
- Cross-project dashboards and alerting from one pane — an SRE on-call sees every production service’s golden signals (latency, traffic, errors, saturation) without project-hopping.
- Consistent SLOs. Define service-level objectives (e.g. 99.9% availability, p99 latency < 300 ms) with error-budget burn-rate alerting uniformly, instead of each team inventing its own thresholds.
- One alerting and on-call spine. Centralized notification channels and alerting policies integrate with PagerDuty/Opsgenie/Slack/email/Pub/Sub, so routing and escalation are governed, not improvised.
How to do it well
- Create dedicated scoping projects (e.g.
prj-mon-prod,prj-mon-nonprod) in thecommonfolder and add workload projects to the appropriate scope — keep production and non-production scopes separate so a noisy dev alert never reaches the prod on-call. - Deploy the Ops Agent as the standard for VM host/app metrics and logs (it supersedes the legacy Monitoring + Logging agents) — bake it into the golden VM image and GKE node config.
- Define SLOs on the services that matter and alert on multi-window, multi-burn-rate error-budget consumption rather than raw thresholds — this is the SRE-recommended pattern that catches both fast and slow burns while avoiding alert fatigue.
- Standardize notification channels and severities centrally; encode alerting policies, dashboards, and SLOs as Terraform /
monitoring-dashboardsJSON so they are versioned and reproducible. - Use uptime checks for external-facing endpoints and Managed Service for Prometheus where teams already run Prometheus, so GKE workloads keep PromQL while metrics land in the same backend.
Worked example: scope membership + a burn-rate alert
Adding a workload project to a scope is one small resource — do it in the project factory so every new project joins automatically:
# Add a workload project to the production metrics scope (the scoping project).
resource "google_monitoring_monitored_project" "web_prod" {
  metrics_scope = "prj-mon-prod"   # the scoping project that owns the scope
  name          = "prj-web-prod"   # the workload project joining the scope
}
Then a centralized notification channel and a fast-burn SLO alert. The magic number 14.4 is the SRE-workbook fast-burn rate: consuming 2% of a 28-day error budget in 1 hour equals burning it 14.4× faster than the steady rate, and that warrants an immediate page.
resource "google_monitoring_notification_channel" "pagerduty" {
  display_name = "SRE on-call (PagerDuty)"
  type         = "pagerduty"
  labels = {
    service_key = "REDACTED"   # inject from Secret Manager — never commit the key
  }
}

variable "slo_id" {
  description = "Full SLO id, e.g. projects/PRJ/services/SVC/serviceLevelObjectives/booking-availability"
  type        = string
}

# Fast burn: page when >2% of the budget burns in 1h (burn rate > 14.4x).
resource "google_monitoring_alert_policy" "slo_fast_burn" {
  display_name = "Booking availability — fast burn (14.4x over 1h)"
  combiner     = "OR"

  conditions {
    display_name = "Burn rate > 14.4 over 1h"
    condition_threshold {
      filter          = "select_slo_burn_rate(\"${var.slo_id}\", \"3600s\")"
      comparison      = "COMPARISON_GT"
      threshold_value = 14.4
      duration        = "0s"
    }
  }

  notification_channels = [google_monitoring_notification_channel.pagerduty.id]
}
You pair this fast-burn policy with a slow-burn one (a lower rate over a longer window — see Going deeper) so a gentle, sustained erosion of the budget still opens a ticket even when no single hour looks alarming.
Concrete artifacts, decisions, and tools
| Discipline | GCP tool / mechanism | KPI to track |
|---|---|---|
| Org-wide metric visibility | Metrics scope + scoping projects | % of prod projects in a monitored scope (→ 100%) |
| Golden-signal collection | Ops Agent, Managed Service for Prometheus | % of fleet running the Ops Agent |
| Reliability targets | Cloud Monitoring SLOs + error budgets | SLO attainment vs target; error-budget burn |
| Proactive alerting | Alerting policies (multi-burn-rate) | Alert precision (page-to-incident ratio) |
| External availability | Uptime checks | Uptime % per critical endpoint |
| On-call routing | Notification channels (PagerDuty/Slack/Pub/Sub) | MTTA / MTTR |
Billing export and budgets — making cost a first-class signal
What it is
A Cloud Billing account pays for one or more projects and is the root of all cost data. By itself the Console gives you reports, but the landing-zone foundation turns cost into queryable, alertable data through two features:
- BigQuery billing export. You enable export from the billing account into a BigQuery dataset, producing three feeds: Standard usage cost (per-SKU, per-project, per-label cost), Detailed usage cost (adds resource-level granularity), and Pricing data. This is the authoritative, row-level source FinOps queries — far richer than the Console reports.
- Budgets and budget alerts. A budget is a named cost threshold (a fixed amount or a percent of last month’s spend) scoped to the billing account, a set of projects, a folder/sub-account, or a label. It fires threshold alerts (e.g. at 50/90/100% of forecast) to billing admins by email and, critically, to a Pub/Sub topic for programmatic response.
A budget alert by itself does not cap spend — GCP has no hard spending cap. The Pub/Sub channel is what lets you act (notify Slack, open a ticket, or in non-prod even disable billing on a runaway project via Cloud Functions).
Why it matters
In an estate of dozens of projects and INR-sensitive budgets, cost surprises come from idle GPUs, forgotten dev environments, egress, and over-provisioned databases. Billing export + budgets make cost a monitorable signal rather than a month-end shock:
- Attribution. With mandatory labels (
env,team,cost-center,app— defined in Part 1) flowing into the export, FinOps can slice 100% of spend by team and environment in BigQuery / Looker Studio. - Early warning. Forecast-based budget alerts page a team before the month closes, and the Pub/Sub hook turns “we noticed in the invoice” into “we got paged on day 9.”
- Optimization inputs. The detailed export plus Active Assist / Recommender (idle VM, idle disk, committed-use-discount, and rightsizing recommendations) drive a continuous cost-reduction backlog.
How to do it well
- Enable BigQuery billing export on day one into a dataset in a dedicated billing/FinOps project under
common; turn on Detailed export if you need resource-level (per-VM) cost. The dataset only populates forward from enablement, so do it early. - Build budgets in layers: one org/billing-account-wide budget, per-environment budgets, per-team (label-scoped) budgets, and tight per-project budgets in development so a forgotten notebook pages the owning team.
- Wire every budget to Pub/Sub, not just email, and subscribe a Cloud Function that routes to Slack/ticketing — and in non-prod sandboxes, optionally one that disables billing on egregious overruns.
- Apply committed-use discounts (CUDs) and Spot VMs deliberately for steady-state and fault-tolerant workloads, and review Recommender CUD/rightsizing suggestions monthly.
- Build a Looker Studio (or BigQuery) FinOps dashboard off the export, sliced by
env,team,cost-center, with month-over-month trend and anomaly highlighting; treat Cost Anomaly Detection alerts as first-class.
Worked example: a per-dev-project budget that actually acts
Billing export is enabled in the Console (Billing → Billing export → BigQuery export, choosing Standard and/or Detailed and pointing at a dataset in prj-finops) or via the Cloud Billing API — there is no gcloud command for it, and it populates only forward from the moment you enable it, which is why day-one matters. Budgets, however, are fully scriptable:
export BILLING_ACCOUNT="0X0X0X-0X0X0X-0X0X0X"
export FINOPS_PROJECT="prj-finops"

# A tight per-dev-project budget wired to Pub/Sub for programmatic response.
gcloud billing budgets create \
  --billing-account="${BILLING_ACCOUNT}" \
  --display-name="dev-web-monthly" \
  --budget-amount=50000INR \
  --filter-projects="projects/prj-web-dev" \
  --threshold-rule=percent=0.5 \
  --threshold-rule=percent=0.9,basis=forecasted-spend \
  --threshold-rule=percent=1.0 \
  --all-updates-rule-pubsub-topic="projects/${FINOPS_PROJECT}/topics/budget-alerts"
The Pub/Sub topic is the whole point: a Cloud Function subscribed to budget-alerts receives a JSON message on every threshold crossing (with costAmount, budgetAmount, and the threshold percent) and can route a 90% alert to Slack and — in dev sandboxes only — call the Billing API to disable billing on a project that blows past 150%. That is what converts an informational email into an action that kills a runaway GPU notebook. The same budget as code:
resource "google_billing_budget" "dev_web" {
  billing_account = var.billing_account
  display_name    = "dev-web-monthly"

  budget_filter {
    projects = ["projects/${var.dev_web_project_number}"]   # NOTE: project NUMBER, not ID
  }

  amount {
    specified_amount {
      currency_code = "INR"
      units         = "50000"
    }
  }

  threshold_rules {
    threshold_percent = 0.5
  }
  threshold_rules {
    threshold_percent = 0.9
    spend_basis       = "FORECASTED_SPEND"
  }
  threshold_rules {
    threshold_percent = 1.0
  }

  all_updates_rule {
    pubsub_topic = google_pubsub_topic.budget_alerts.id
  }
}
Once the export dataset is flowing, this is the FinOps attribution query — net cost (usage minus credits) by team, for the last 30 days, straight off the Standard export:
-- Net spend by team, last 30 days. Credits are a separate repeated field and are negative.
SELECT
  (SELECT value FROM UNNEST(labels) WHERE key = 'team') AS team,
  project.id AS project_id,
  ROUND(
    SUM(cost) + SUM(IFNULL((SELECT SUM(c.amount) FROM UNNEST(credits) AS c), 0)),
    2) AS net_cost_inr
FROM `prj-finops.billing_export.gcp_billing_export_v1_XXXXXX`
WHERE _PARTITIONTIME >= TIMESTAMP_SUB(CURRENT_TIMESTAMP(), INTERVAL 30 DAY)
GROUP BY team, project_id
ORDER BY net_cost_inr DESC
Concrete artifacts, decisions, and tools
| Capability | GCP service / mechanism | Output |
|---|---|---|
| Row-level cost data | BigQuery billing export (Standard / Detailed / Pricing) | Per-SKU, per-project, per-label cost tables |
| Cost thresholds | Cloud Billing budgets (amount or % of prior month) | 50/90/100% forecast alerts |
| Programmatic response | Budget → Pub/Sub + Cloud Function | Slack/ticket; non-prod billing disable |
| Attribution | Labels (env,team,cost-center,app) |
FinOps slicing in BigQuery/Looker |
| Optimization | Active Assist / Recommender, CUDs, Spot VMs | Idle/rightsize/CUD recommendations |
| Anomaly detection | Cost Anomaly Detection | Alert on unexpected spend spikes |
| Reporting | Looker Studio on the export dataset | Trended FinOps dashboards |
Centralized observability across the org
What it is
The previous three sub-components each produce a central destination; centralized observability is the discipline of wiring them into one coherent operating model so that logs, metrics, traces, errors, and cost are all aggregated, correlated, and access-controlled from the top of the hierarchy. The GCP building blocks beyond Logging and Monitoring are Cloud Trace (distributed tracing), Error Reporting (aggregated exceptions), Cloud Profiler (continuous CPU/heap profiling), and the Google Cloud Observability dashboards that stitch them together — all feeding, or fed by, the central logging project, the monitoring scoping projects, and the billing/FinOps project.
Why it matters
Centralization is what converts data you happen to collect into an operating capability:
- Correlated incident response. An on-call engineer pivots from an alert → the trace → the exact log lines → the offending release, across projects, in one console — instead of stitching evidence by hand across team silos.
- Governed access. Read access to the central log/metric/cost stores is granted to groups (Part 2) at the logging/monitoring/billing projects — security gets audit logs, SRE gets metrics, FinOps gets cost — without anyone needing access to the workload projects themselves.
- Resilience and exit. Streaming logs to a SIEM via Pub/Sub and exporting to BigQuery/Cloud Storage gives you a copy outside any single team’s blast radius and an analytics/retention store independent of the hot path.
How to do it well
- Treat the
commonfolder as the observability home: the logging-sink project, the monitoring scoping projects, the billing/FinOps project, and the SIEM ingestion project all live there, separated from workloads and protected by org policy. - Standardize structured logging (JSON payloads with
trace/spanIdfields) so logs auto-correlate to traces in the console — this is the single biggest multiplier for correlated debugging. - Define the RACI for the three telemetry planes: security owns the audit-log sink + SIEM, SRE owns monitoring scopes + SLOs + on-call, FinOps owns billing export + budgets — with the platform team owning the Terraform that provisions all three.
- Push it all left into the foundation pipeline so a new project automatically inherits the org sink, is added to a monitoring scope, carries cost labels, and shows up in dashboards — observability by construction, not by retrofit.
- Feed detective controls (Part 4): the centralized logs are the substrate for Security Command Center and Chronicle/Google SecOps detections, closing the loop between operations and security.
| Observability plane | Central destination (in common) |
Primary owner | Key GCP tools |
|---|---|---|---|
| Logs / audit | Logging-sink project + SIEM project | Security | Aggregated org sinks, Log Analytics, Pub/Sub→Chronicle |
| Metrics / SLOs | Monitoring scoping projects | SRE | Metrics scope, SLOs, alerting, Ops Agent, Prometheus |
| Traces / errors / profiles | Per-app, surfaced centrally | Service teams + SRE | Cloud Trace, Error Reporting, Cloud Profiler |
| Cost | Billing/FinOps project | FinOps | BigQuery billing export, budgets, Recommender, Looker |
Real-world enterprise scenario
Sahyadri Health Networks is a fictional ₹3,000-crore hospital and diagnostics group (≈US$360M revenue, ~600 engineers) running patient-facing apps, a diagnostics-imaging pipeline, and a clinical data lake on GCP. They are bound by Indian data-residency rules and DPDP, must keep audit trails for clinical systems for 7 years, and have been burned twice by runaway dev spend on GPU notebooks for imaging ML. Their hierarchy (from Part 1) is the hybrid pattern with bootstrap and common folders and three product domains — Patient Apps, Imaging, and Clinical Data — across prod / nonprod / dev, ~55 projects total.
Cloud Logging. In the common folder they stand up prj-logging, owned by the security team. Two organization-level aggregated sinks (include_children = true) route everything: one to a Log Analytics-enabled Logging bucket (audit-bucket, pinned to asia-south1, retention 2,555 days = 7 years, retention lock applied) for tamper-proof clinical audit trails, and one to a BigQuery dataset for analytics. A third sink streams to a Pub/Sub topic feeding Google SecOps (Chronicle) for real-time detection. Data Access audit logs are enabled on the Clinical Data projects and routed separately; exclusion filters drop chatty health-check and load-balancer logs to control cost. Workload teams retain only their _Default 30-day buckets; they cannot touch the central audit bucket.
Cloud Monitoring. Two scoping projects — prj-mon-prod and prj-mon-nonprod — sit in common; all 55 workload projects are added to the appropriate scope. The Ops Agent is baked into the golden VM image and GKE node pools. SRE defines SLOs on the patient-booking and imaging-upload services (99.9% availability, p95 latency < 400 ms) with multi-burn-rate error-budget alerting routed through PagerDuty and a #sre-oncall Slack channel via centralized notification channels. Uptime checks watch the public booking and portal endpoints; the imaging team’s existing Prometheus exporters feed Managed Service for Prometheus so they keep PromQL.
Billing export & budgets. prj-finops in common hosts the Detailed BigQuery billing export (resource-level, so they can see per-GPU-VM cost). Budgets are layered: one org-wide budget, three per-domain (label-scoped) budgets, and tight per-project budgets on every development project at ₹50,000/month forecast. Every budget publishes to Pub/Sub; a Cloud Function routes 90% alerts to Slack and, in dev sandboxes only, disables billing on a project that blows past 150% — directly killing the runaway-GPU pattern. A Looker Studio dashboard slices spend by env, team, cost-center, with month-over-month trend; Recommender CUD and idle-VM suggestions feed a monthly FinOps review.
Centralized observability. All teams emit structured JSON logs with trace/spanId, so the console auto-links logs to Cloud Trace spans and Error Reporting groups. Read access is group-based: gcp-security-auditors on prj-logging, gcp-sre-oncall on the monitoring scopes, gcp-finops on prj-finops — none of them needing access to workload projects. The whole wiring is in the foundation Terraform so every newly factory-created project inherits the org sink, joins a monitoring scope, and carries cost labels automatically.
Artifacts produced. A dedicated prj-logging, prj-mon-{prod,nonprod}, and prj-finops set of projects; two org aggregated sinks + a SIEM Pub/Sub sink as google_logging_organization_sink; a retention-locked 7-year audit bucket; metrics-scope membership for all 55 projects; SLOs and multi-burn-rate alert policies as code; a Detailed BigQuery billing export; layered budgets with a Pub/Sub-triggered guardrail Cloud Function; and a Looker Studio FinOps dashboard.
Measurable outcome (6 months): audit-log coverage went from per-project and mutable to 100% centralized, immutable for 7 years — accepted by their clinical-systems auditor as the trail of record. Mean time to acknowledge production incidents dropped from ~25 minutes to under 4 minutes with centralized golden-signal dashboards and burn-rate paging. FinOps now attributes 100% of spend by team and environment, and the dev per-project budgets + auto-disable guardrail cut idle dev/GPU spend by ~44%, eliminating the runaway-notebook surprises entirely.
Going deeper
The Log Router, sink precedence, and why sinks don’t compete. A single log entry is evaluated against every sink in scope — the project’s _Required and _Default sinks plus any aggregated sinks on the parent folders and the org — and it is written to the destination of every sink whose filter it matches. Sinks do not consume or steal entries from one another, so an audit event can land in the _Required bucket, the org audit bucket, and the SIEM Pub/Sub topic simultaneously; that is a feature, not double-billing at the routing layer. The one exception is an intercepting sink (an org/folder sink created with --intercept-children), which does divert matching child logs so they no longer reach the child’s own _Default — use it only when you deliberately want to stop teams seeing certain logs locally. Routing is evaluated in the resource’s region and is essentially free; you pay for ingestion into the _Default/analytics buckets and for storage beyond the included retention, not for the act of routing a copy to a bucket you own.
Log storage economics and Log Analytics internals. Cloud Logging’s cost driver is ingestion (a generous free tier per project per month, then per-GiB), not query. Routing already-ingested logs to a second Logging bucket in the same org does not re-charge ingestion, which is why the central-bucket pattern is affordable. Log Analytics upgrades a bucket so its entries are stored in an analytics-optimized format and become queryable with BigQuery SQL; creating a linked dataset (gcloud logging links create) exposes that bucket to BigQuery without copying the data into BigQuery-managed storage — you get SQL joins across logs at Logging-bucket storage prices. Encrypt sensitive buckets with CMEK (--cmek-kms-key-name) so the log store honours the same key policy as the data it describes. And remember Data Access audit logs are off by default for good reason — they are enormous; enable them per-service through the project/org IAM audit config and route them to a cheaper destination or sample them, or they will dominate the Logging bill.
Metrics scope ceilings, MQL vs PromQL, and cardinality. A scoping project can monitor up to 375 projects; a single monitored project can belong to multiple scopes at once, so you can have a broad SRE scope and a narrow team scope over the same workloads. The scoping project is just an ordinary project you nominate as the pane of glass — it does not copy or re-ingest anyone’s metrics, it only grants visibility, so quotas and billing stay with the source project. GKE teams keep PromQL via Managed Service for Prometheus, which stores Prometheus metrics in the same Monitoring backend; you can query with PromQL or MQL. The silent killer at scale is label cardinality — a metric labelled with a unbounded value like user_id or request_id explodes into millions of time series, spiking both cost and query latency; treat metric labels as a small, bounded set.
Multi-window, multi-burn-rate — the actual numbers. Your error budget for a window is (1 − SLO) × window; a 99.9% SLO over 28 days permits ~40 minutes of downtime. Burn rate is how fast you are spending that budget relative to steady state (1× spends it exactly over the window). The SRE-workbook pattern pairs a fast and a slow signal so you page on real emergencies and ticket on slow erosion, each gated on a long and a short window together to prevent flapping:
| Severity | Budget consumed | Long window | Burn rate | Action |
|---|---|---|---|---|
| Fast burn | 2% | 1 hour | 14.4× | Page immediately |
| Medium burn | 5% | 6 hours | 6× | Page |
| Slow burn | 10% | 3 days | 1× | Ticket |
The Terraform earlier implements the top row with select_slo_burn_rate(slo, "3600s") > 14.4; add policies for the other rows, each with its own window and threshold.
Billing export schema, currency, and the no-hard-cap reality. The Standard export gives per-SKU, per-project, per-label rows; Detailed adds a resource.name so you can attribute cost to an individual VM or disk (essential for the per-GPU visibility in the scenario); Pricing exports your rate card. cost and credits are separate fields — net cost = cost + sum(credits) and credits are negative — so a query that ignores credits overstates spend. Amounts are in the billing account’s currency; multi-currency estates normalize in the query or dashboard. Budgets scope by billing account, project, folder/sub-account, label, or service, and their creditTypesTreatment decides whether alerts fire on gross or net. The hard truth: there is no spending cap on GCP — the 100% alert is informational, so the Pub/Sub → Cloud Function → disable billing pattern is the only real brake, and it is dangerous (disabling billing stops the project and can delete resources), so reserve it for sandboxes and pair it with Cost Anomaly Detection for early, softer warnings.
IAM for the three telemetry planes. Grant least-privilege read at each central project: roles/logging.viewer (and roles/logging.privateLogViewer for Data Access logs, which are gated separately) to security on prj-logging; roles/monitoring.viewer to SRE on the scoping projects; roles/billing.viewer plus BigQuery dataset roles to FinOps on prj-finops. Sink administration needs roles/logging.configWriter at the org for aggregated sinks — a powerful role, kept to the platform SA. Protect the logging project itself with a deletion lien and an org policy that restricts who can modify sinks, and consider Access Approval / Access Transparency as the meta-audit over the auditors.
Version and API caveats. Use the v2 Logging surface (Logging buckets, google_logging_* resources) — the legacy per-project export sinks are superseded. Monitoring is on API v3; SLOs and burn-rate alerting require the SLO objects, not raw metric thresholds. gcloud billing budgets is now GA (it lived under alpha/beta for years — old runbooks still show the beta path). The Ops Agent supersedes the legacy Monitoring and Logging agents, which are end-of-life — standardize on it in your images. Managed Service for Prometheus is GA. When you codify org policy around this fabric, use the v2 Org Policy API (google_org_policy_policy) consistent with Part 1.
Practice challenges
Work each one before opening the solution — predicting the effective behaviour is the whole skill here, so commit to an answer first. They escalate from a first sink to the burn-rate math and the cost-guardrail that decides a real incident.
Challenge 1 (beginner). You must guarantee every project’s Admin Activity audit logs — current and future — are centralized and cannot be altered or deleted for a compliance window. Name the sink type, the flag, the destination, and what makes it immutable.
<details> <summary>Solution</summary>
An organization-level aggregated sink created with --include-children, routing logName:"cloudaudit.googleapis.com/activity" to a Cloud Logging bucket in a dedicated logging project. Immutability comes from setting --retention-days to the compliance floor and then applying a retention lock (gcloud logging buckets update ... --locked).
Why: the org-level aggregated sink captures every project beneath the org automatically — including ones created later — and the retention lock makes the bucket write-once for the window, so not even an org admin can shorten or delete it. </details>
Challenge 2 (beginner). You created an org sink to a BigQuery dataset in another project, the filter is correct, but no rows ever appear. What single step did you miss?
<details> <summary>Solution</summary>
You did not grant the sink’s writer identity permission on the destination. Fetch it and grant the right role:
WRITER=$(gcloud logging sinks describe org-analytics-sink \
  --organization="${ORG_ID}" --format='value(writerIdentity)')
gcloud projects add-iam-policy-binding prj-logging \
  --member="${WRITER}" --role="roles/bigquery.dataEditor"
Why: every sink writes as its own service account; without write permission on the destination (bigquery.dataEditor for BigQuery, logging.bucketWriter for a bucket, pubsub.publisher for Pub/Sub, storage.objectCreator for GCS) entries are silently discarded.
</details>
Challenge 3 (intermediate). An SRE team needs a single dashboard and alerting pane across 40 production projects. What do you create, and what is the ceiling on this approach?
<details> <summary>Solution</summary>
Nominate a scoping project (e.g. prj-mon-prod) and add each of the 40 workload projects as a monitored project in its metrics scope — one google_monitoring_monitored_project resource per project, wired into the project factory. The ceiling is 375 monitored projects per scope; beyond that (or to separate prod from nonprod) you use several scoping projects.
Why: the metrics scope grants cross-project visibility from one pane without copying metrics; a project can also join multiple scopes if teams need both a broad and a narrow view. </details>
Challenge 4 (intermediate). Your BigQuery bill from logs has tripled. Give two levers that cut it substantially without losing your compliance audit logs.
<details> <summary>Solution</summary>
- Exclusion filters / sampling on the high-volume, low-value streams (load-balancer 2xx, health checks) so they never reach the expensive analytics destination —
--exclusion=name=...,filter=...on the sink. - Stop enabling Data Access audit logs everywhere — they are off by default because they are enormous; enable them only where compliance requires and route them to a cheaper destination (a Logging bucket or GCS), separate from the hot BigQuery analytics path.
Why: Admin Activity (the compliance-critical logs) are low-volume and stay; the cost is dominated by chatty Data Access and request logs, which you sample or reroute rather than delete wholesale. </details>
Challenge 5 (advanced). Define the fast-burn alert for a 99.9% availability SLO over 28 days that should page when 2% of the error budget is consumed within one hour. State the burn-rate threshold and the window, and give the condition expression.
<details> <summary>Solution</summary>
Threshold 14.4× over a 1-hour window:
select_slo_burn_rate("<SLO resource id>", "3600s") > 14.4
Why: 2% of a 28-day budget spent in 1 hour is 14.4 times the steady-state rate (0.02 × (28×24h / 1h) = 14.4). Pair it with a slow-burn policy (e.g. 6× over 6h, 1× over 3d) so gradual erosion still opens a ticket without a page.
</details>
Challenge 6 (advanced). A developer’s GPU notebook is racking up cost. The budget’s 100% email fired hours ago, but spend keeps climbing. Explain why, and give the mechanism that actually stops it — plus its main risk.
<details> <summary>Solution</summary>
Why it keeps spending: a GCP budget is informational only — there is no hard spending cap — so the 100% alert changes nothing on its own. The brake: wire the budget to a Pub/Sub topic and subscribe a Cloud Function that, on a threshold message past (say) 150% for a dev project, calls the Cloud Billing API to disable billing on that project. Risk: disabling billing halts the project and can cause resource deletion/data loss, so restrict this guardrail to sandbox/dev projects, gate it on labels, and never point it at production. </details>
Common beginner mistakes
- “A sink moves logs out of the project.” A sink copies/routes a matching entry to a destination; it does not remove it from the source. One entry can match many sinks and be written to all of them, and the
_Required/_Defaultbuckets keep their own copies unless you add an exclusion. Right model: sinks fan out copies; only an intercepting sink diverts child logs. - “Creating the org sink is enough.” The sink’s writer-identity service account must be granted write on the destination or every entry is silently dropped. Right model: create sink → read
writerIdentity→ grant the destination-specific role → then verify rows land. - “An aggregated sink means I’ll see child logs in the org node’s Logs Explorer.” No — an aggregated sink routes to a destination. To read the aggregated logs you query the destination bucket/dataset, not the org’s Logs Explorer. Right model: aggregation is about where logs land, not a magic org-wide view pane.
- “A metrics scope copies metrics into the scoping project.” It grants visibility only; metrics stay in their source project and billing/quotas are unaffected. Right model: a scope is a read lens over many projects, not a data warehouse.
- “A budget caps spend.” It does not — GCP has no hard cap, so a runaway job keeps spending after the 100% email. Right model: budgets inform; to act you need Pub/Sub + a response function.
- “Billing export is retroactive.” It populates only forward from the moment you enable it — enable on day one or you have no historical baseline. Right model: turn on BigQuery billing export before workloads land.
- “More alerts make us safer.” Raw-threshold alerting either pages constantly (fatigue) or misses slow burns. Right model: define SLOs and alert on multi-window, multi-burn-rate error-budget consumption.
- “Turn on all audit logs everywhere for completeness.” Data Access logs are off by default because they are huge and can dominate the bill. Right model: enable them surgically where compliance requires and route them separately.
Deliverables & checklist
Common pitfalls
- Leaving logs in per-project
_Defaultbuckets. Investigators must hunt across dozens of projects, and a team can delete the evidence of its own actions. Avoid: org-level aggregated sinks into a locked-down central logging project, with a retention lock on the audit bucket. - Turning on Data Access audit logs everywhere without routing them. They are enormous and can dominate the Logging bill. Avoid: enable Data Access logs only where compliance requires, route them to their own (cheaper) destination, and use exclusion filters to sample.
- Forgetting that billing export only populates forward. Teams enable export months into the build and have no historical cost data to baseline against. Avoid: enable BigQuery billing export on day one, before workloads land.
- Assuming a budget caps spend. A budget alert is informational; GCP has no hard cap, so a runaway job keeps spending after the 100% email. Avoid: wire budgets to Pub/Sub and a response function (Slack/ticket, and billing-disable in non-prod) so alerts trigger action.
- Alerting on raw thresholds instead of error budgets. Static thresholds either page constantly (fatigue) or miss slow burns. Avoid: define SLOs and use multi-window, multi-burn-rate alerting that catches fast and slow burns with far fewer false pages.
- Not adding new projects to the monitoring scope / sink. A project created after the foundation was built silently has no central metrics, alerts, or labels. Avoid: bake sink inheritance, scope membership, and cost labels into the project-factory so observability is automatic by construction.
Glossary
- Cloud Logging: GCP’s managed log-management service; every entry passes through the Log Router.
- Log Router: the engine that evaluates all sinks and routes a copy of each log entry to every matching destination.
- Sink: a
filter → destinationrule that routes matching log entries to a Logging bucket, BigQuery, Cloud Storage, or Pub/Sub. - Aggregated sink: a sink on a folder or the Organization node with
includeChildren=truethat captures logs from every project beneath it. includeChildren: the flag that turns a folder/org sink into an aggregated one covering all descendant projects._Requiredsink: the built-in sink for admin/audit activity, fixed 400-day retention, cannot be modified or disabled._Defaultsink: the built-in sink for everything else, routed to the_Defaultbucket at 30-day retention; editable.- Intercepting sink: an org/folder sink (
--intercept-children) that diverts matching child logs so they no longer reach the child’s own_Default. - Writer identity: the service account a sink writes as; it must hold write permission on the destination or entries are silently dropped.
- Log bucket: the storage container for logs in a project (
_Required,_Default, or custom); has a region and a retention period. - Log Analytics: an upgrade to a Logging bucket that makes its entries queryable with BigQuery SQL.
- Linked dataset: a BigQuery dataset that exposes a Log Analytics bucket to SQL without copying the data into BigQuery storage.
- Exclusion filter: a rule on a sink or bucket that drops or samples matching entries to control volume and cost.
- Data Access audit logs: logs of reads/writes to data; off by default, very high-volume, enabled per-service and usually routed separately.
- Retention lock: a setting that makes a Logging bucket’s retention immutable — it cannot be shortened or the bucket deleted for the window.
- Cloud Monitoring: GCP’s metrics, dashboards, uptime-check, SLO, and alerting service.
- Metrics scope: the set of projects a scoping project can see metrics for (up to 375); grants visibility, not a data copy.
- Scoping project: the project that owns a metrics scope and acts as the SRE pane of glass over many workloads.
- Monitored project: a workload project added to a scoping project’s metrics scope.
- Ops Agent: the current unified agent for VM host/app metrics and logs; supersedes the legacy Monitoring and Logging agents.
- Managed Service for Prometheus: GCP’s managed Prometheus backend, letting teams keep PromQL while metrics land in Monitoring.
- SLI (Service Level Indicator): a measured signal of service health, e.g. the ratio of successful requests.
- SLO (Service Level Objective): a target for an SLI over a window, e.g. 99.9% availability over 28 days.
- Error budget: the allowed failure for a window,
(1 − SLO) × window; the currency burn-rate alerting spends. - Burn rate: how fast the error budget is being consumed relative to steady state (1× spends it exactly over the window).
- Multi-window, multi-burn-rate alerting: the SRE pattern of pairing fast and slow burn signals, each gated on a long and short window, to page on emergencies and ticket on slow erosion.
- Notification channel: a destination for alerts — PagerDuty, Opsgenie, Slack, email, or Pub/Sub.
- Alerting policy: the rule that fires notifications when a condition (e.g. a burn-rate threshold) is met.
- Uptime check: a synthetic probe of an external endpoint’s availability and latency.
- Cloud Billing account: the payment root that pays for one or more projects and is the source of all cost data.
- BigQuery billing export: an export of cost data to BigQuery — Standard (per-SKU/project/label), Detailed (adds resource-level), and Pricing.
- Budget: a named cost threshold scoped to an account, projects, folder, label, or service; fires threshold alerts.
- Budget alert: an informational notification at a threshold percent; it does not cap spend.
- Committed Use Discount (CUD): a discount for committing to steady-state usage over 1–3 years.
- Spot VM: deeply discounted, preemptible compute for fault-tolerant workloads.
- Recommender / Active Assist: GCP’s recommendation engine for idle-resource, rightsizing, and CUD optimization.
- Cost Anomaly Detection: automatic alerting on unexpected spend spikes off the billing data.
- Looker Studio: GCP’s dashboarding tool, commonly built over the billing export for FinOps reporting.
- Cloud Trace / Error Reporting / Cloud Profiler: distributed tracing, aggregated-exception, and continuous-profiling services that complete the observability picture.
- Security Command Center (SCC): GCP’s security posture and threat-detection service, fed by the centralized logs (Part 4).
- SIEM / Chronicle (Google SecOps): the security analytics platform that a Pub/Sub log sink can stream to for real-time detection.
commonfolder: the landing-zone folder (Part 1) that houses the shared logging, monitoring, and FinOps projects.- Structured logging: emitting logs as JSON (with
trace/spanId) so they auto-correlate to traces in the console. - Single pane of glass: one consolidated view — buckets, scopes, billing dataset — over the whole estate, the goal of this phase.
What’s next
Part 6 of Google Cloud Landing Zone Design turns to Platform Automation & the Foundation Pipeline — the Terraform foundation, Cloud Build/Infrastructure Manager CI/CD, the project factory, and the policy-as-code that provisions and governs every layer you have built across this series.