When something breaks on a Linux box, the machine has almost always already told you why — you just have to know where it wrote it down. Logs are the flight recorder. A service that refuses to start, an SSH login that’s suddenly rejected, a process that vanished in the night, a disk that filled to 100% — every one of these left a trail. The difference between a beginner and an operator is not that the operator guesses better; it’s that the operator opens the right log, filters to the right ten lines, and reads the answer.
The catch is that modern Linux has two logging worlds running side by side, and beginners routinely look in the wrong one. There’s the systemd journal — a binary, structured, indexed database that you query with journalctl — and there’s the traditional syslog world of plain-text files under /var/log that you read with less, grep, and tail. They overlap, they duplicate each other, and on most distros they’re both live at once. Understand how the two coexist and you’ll never again grep a file that doesn’t have the message while the answer sits in the journal.
This lesson builds that model from the ground up and then makes it practical: journalctl in real depth, the syslog protocol (facilities, severities, and the priority number), rsyslog for routing and central logging, the /var/log tour with the Debian-versus-RHEL naming differences that trip everyone up, dmesg and the kernel ring buffer, logrotate so logs don’t eat the disk, and a “something broke — where do I look” playbook you’ll come back to for years. Type the commands as you go on a throwaway VM or WSL.
Why this matters
Three concrete situations, all of which you will hit:
- A service won’t start and
systemctl statusonly shows a red line. The status output gives you the last few log lines, but the actual stack trace, config-parse error, or “port already in use” message is onejournalctl -u <service> -eaway. Beginners stare at the status and give up; operators read the journal and fix it in a minute. - Someone can’t log in, or you suspect a break-in attempt. Authentication events —
sudo,sshd, PAM, failed passwords — go to a specific place (/var/log/auth.logon Debian,/var/log/secureon RHEL, and the journal). Knowing that file exists turns “SSH is broken” into “here are the twelve failed attempts from one IP.” - The disk hit 100% and everything is failing. Nine times out of ten on a small box,
/var/log(or the journal) filled up. If you don’t know that logs self-rotate, self-vacuum, and can be capped, you’ll delete the wrong thing in a panic. If you do, it’sjournalctl --vacuum-size, alogrotaterun, and a config cap.
The mental model to hold onto is a pipeline: sources (your apps and the kernel) emit messages → a store (the journal, and/or text files) keeps them → tools (journalctl, grep, dmesg) let you read them → retention (journald’s self-vacuum, logrotate) stops them growing forever. Everything below is detail on those four stages. This lesson pairs naturally with the deeper systemd material in Systemd units, services, targets & journald — here we go deep on the logs; there you manage the units that produce them.
The two logging worlds and how they coexist
Before systemd, Linux logging was simple to describe and painful to use: a daemon called syslogd (later rsyslogd) listened on a socket, received text messages tagged with a facility and a severity, and appended them as lines to files under /var/log. That’s it. Plain text, one line per event, grep to search. Simple — but there was no structure (every app formatted its line differently), no indexing (searching meant scanning whole files), and no reliable link between a message and the process that produced it.
Systemd introduced systemd-journald (the “journal”), which flips the model. Every message is stored as a structured record — a set of key/value fields — in a binary, indexed file. The human message is just one field (MESSAGE=); alongside it journald automatically records who sent it (_PID=, _UID=, _COMM=, _SYSTEMD_UNIT=), when (__REALTIME_TIMESTAMP), how severe it is (PRIORITY=), which boot it belongs to (_BOOT_ID=), and dozens more. Because it’s indexed, journalctl -u nginx -p err -b answers “errors from nginx this boot” instantly, without you ever naming a file.
Here’s the part beginners miss: on a typical modern distro, both worlds are running. journald is always there (it’s part of systemd and captures everything — stdout/stderr of every service, syslog() calls, and the kernel buffer). rsyslog is often also installed, and it typically reads from the journal and writes the familiar text files so that decades of tooling, scripts, and muscle memory keep working. So the same “Failed password” line can exist in both the journal and /var/log/auth.log at the same time. Neither is wrong; they’re two views of the same stream.
How does that duplication actually happen? By one of two mechanisms. Either rsyslog loads the imjournal module and pulls structured entries straight out of the journal (the RHEL default), or journald is told to push to the classic syslog socket with ForwardToSyslog=yes in journald.conf, which rsyslog reads via imuxsock. Either way the journal is the source of truth and rsyslog is a consumer that produces text files. This also settles a question every operator eventually asks — do I even need rsyslog? On a single instance where you only ever run journalctl, often no: many minimal cloud images ship without it and lose nothing. You want rsyslog the moment you need text files for legacy tooling or forwarding to a central server — the two jobs the journal doesn’t do on its own.
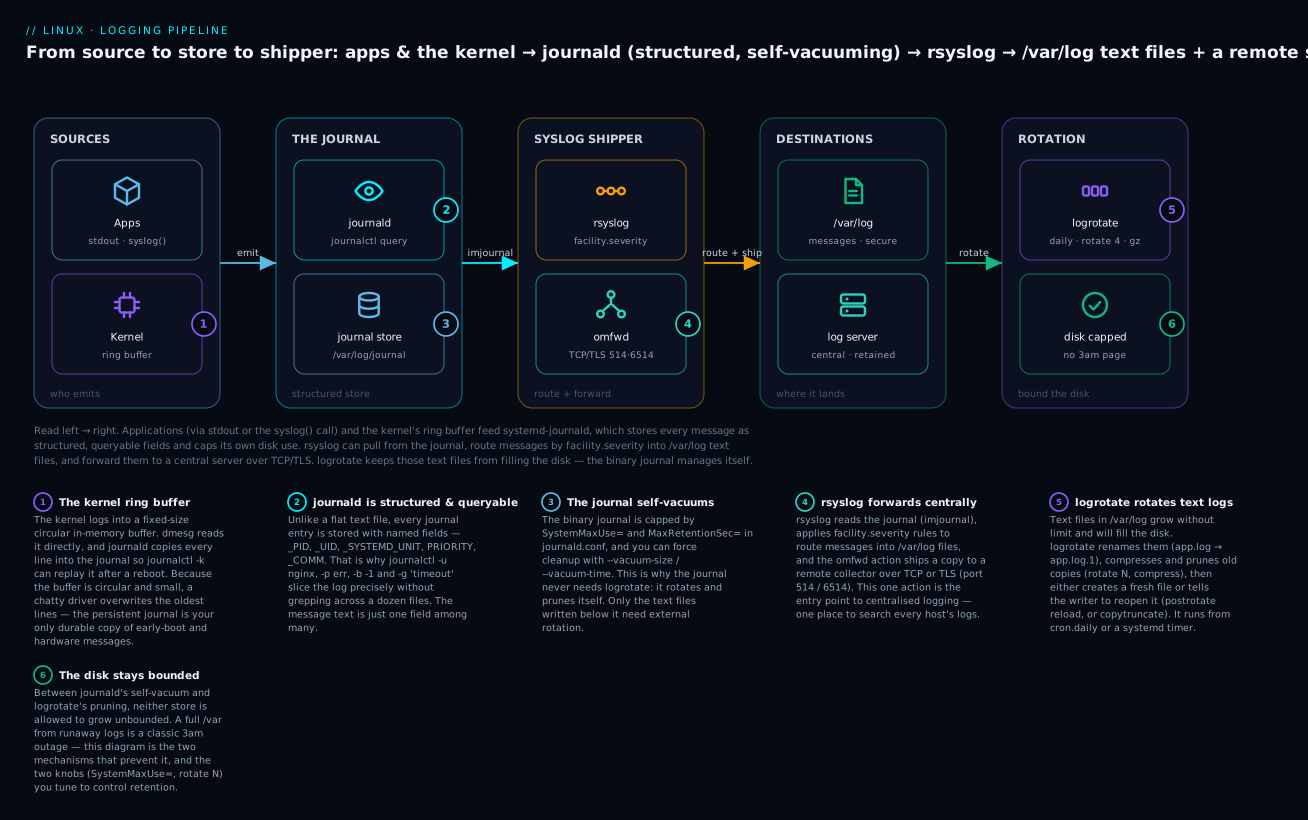
Walk the diagram left to right: your apps write to stdout or call syslog(), and the kernel fills its ring buffer; all of it lands in journald, the structured store. From there rsyslog can pull a copy, apply routing rules, drop lines into /var/log text files, and forward them to a central server. logrotate keeps those text files bounded; the journal caps itself. Learn this shape once and every command below has an obvious place to live.
| Dimension | systemd journal (journald) | Traditional syslog (rsyslog → text) |
|---|---|---|
| Format | Binary, structured (key=value fields) | Plain text, one line per event |
| Read with | journalctl (only) |
less / grep / tail / awk |
| Location | /run/log/journal (volatile) or /var/log/journal (persistent) |
/var/log/*.log, /var/log/messages, … |
| Indexed / queryable | Yes — by unit, priority, boot, PID, time | No — full-text scan every time |
| Survives reboot | Only if persistent storage is enabled | Yes (files on disk) |
| Structured metadata | Rich, automatic (_SYSTEMD_UNIT, _UID, …) |
None — whatever the app printed |
| Retention | Self-managed (SystemMaxUse=, vacuum) |
External — needs logrotate |
| Remote / central | Not natively (needs a forwarder) | Native (omfwd, @@host) |
| Always present? | Yes, on any systemd distro | Only if rsyslog/syslog-ng installed |
The practical rule: reach for journalctl first — it’s always there, it’s structured, and it can filter to exactly what you need. Drop to /var/log text files when (a) an app writes its own file that journald never sees (nginx access logs, for example), (b) rsyslog is forwarding them somewhere the journal isn’t, or © you’re on an older or minimal system where the journal is volatile and yesterday’s entries are already gone.
journalctl in depth: querying the systemd journal
journalctl is the single most useful command in this lesson. Run it with no arguments and it prints the entire journal, oldest first, paged through less (so / searches, q quits, G jumps to the end). That’s rarely what you want — the power is in the filters, and they compose: unit and priority and time and boot, all at once.
A note on permissions before you start: to read the full system journal you must be root or a member of the systemd-journal group (some distros also grant adm or wheel). As an ordinary user you’ll often see only your own session’s messages, or “No journal files were found.” sudo journalctl is the quick fix; adding your user to systemd-journal is the durable one.
Following, tailing, and jumping to the end
journalctl -e                 # jump straight to the END (newest), still paged
journalctl -n 50              # the last 50 lines then exit (like tail)
journalctl -f                 # FOLLOW — live tail, new lines appear as they arrive
journalctl --no-pager         # dump raw to stdout (for piping into grep/awk/less)
journalctl -r                 # reverse: newest first
-f (follow) is what you leave running in one terminal while you reproduce a problem in another — the logging equivalent of tail -f. -e and -n are how you glance at “what just happened” without scrolling through history.
Filtering by unit — the workhorse
# All logs for one service, this boot, jumped to the end:
journalctl -u nginx.service -e

# Follow a service live (the single most common troubleshooting command):
journalctl -u ssh -f

# Two units at once (repeat -u):
journalctl -u nginx -u php8.2-fpm --since "10 min ago"
-u <unit> restricts to one systemd unit and is how you answer “why did this service fail?” You can drop the .service suffix. On Debian/Ubuntu the SSH unit is ssh; on RHEL/Fedora it’s sshd — a naming gap that catches everyone.
This boot, last boot, and time windows
The journal knows about boots. Each reboot starts a new boot ID, and you can address them by offset — 0 is the current boot, -1 the previous one, and so on. This is invaluable for “the box rebooted itself last night — what happened just before?”
journalctl -b                 # everything since THIS boot
journalctl -b -1              # everything from the PREVIOUS boot (the crash!)
journalctl --list-boots       # table of known boots with their offsets & IDs

# Time windows — natural-language or absolute:
journalctl --since "2026-07-09 08:00:00" --until "2026-07-09 09:00:00"
journalctl --since "1 hour ago"
journalctl --since yesterday --until today
journalctl -u nginx --since "09:30" --until "09:45"   # a tight 15-minute slice
--since/--until accept yesterday, today, now, "2 days ago", "09:00", and full timestamps. Combine a time window with -u and -p and you can zoom to the exact minute a service died.
Priority (severity) filtering
-p filters by priority, which is the syslog severity level (0 = most severe, 7 = least). Give it a single level and journald shows that level and everything more severe (numerically lower). Give it a LOW..HIGH range to bound both ends.
journalctl -p err -b          # errors and worse (0–3), this boot
journalctl -p warning         # warnings and worse (0–4)
journalctl -p err..alert      # only err, crit, alert (a 3..1 range)
journalctl -u nginx -p err --since today   # today's nginx errors only
The level names and numbers (emerg 0 … debug 7) are the syslog severities we tabulate in full in the next section — the same scale journald reuses. A frequent “why is my log empty?” moment is running -p err when the only messages are info/notice: nothing is that severe, so nothing prints.
Kernel messages
journalctl -k                 # kernel (dmesg-style) messages, THIS boot
journalctl -k -b -1           # kernel messages from the PREVIOUS boot
journalctl -k -p err          # kernel errors only
-k is journalctl limited to kernel messages (equivalent to _TRANSPORT=kernel). Unlike dmesg, which reads the volatile in-memory ring buffer that’s wiped on reboot, journalctl -k -b -1 can show you the kernel log from before a crash — provided the journal is persistent. That single capability is why persistent journald matters (next section).
Field filters — the structured superpower
Because every entry is structured, you can match on any field with FIELD=VALUE. Multiple different fields are ANDed; the same field repeated is ORed; a bare + separates OR-groups.
journalctl _PID=1234          # everything logged by PID 1234
journalctl _UID=0             # everything logged as root
journalctl _COMM=sshd         # by command name (the executable)
journalctl _SYSTEMD_UNIT=cron.service    # like -u, but exact
journalctl _UID=1000 _COMM=sudo          # AND: sudo runs by user 1000
journalctl _SYSTEMD_UNIT=nginx.service + _SYSTEMD_UNIT=ssh.service  # OR

journalctl -F _SYSTEMD_UNIT   # LIST every value a field takes (capital -F)
| Field | Matches | Example |
|---|---|---|
_PID= |
Process ID that logged | journalctl _PID=1 (pid 1 = systemd) |
_UID= |
User ID of the sender | journalctl _UID=33 (www-data) |
_GID= |
Group ID of the sender | journalctl _GID=0 |
_COMM= |
Command / executable name | journalctl _COMM=sudo |
_EXE= |
Full path to the executable | journalctl _EXE=/usr/sbin/sshd |
_SYSTEMD_UNIT= |
Owning systemd unit | journalctl _SYSTEMD_UNIT=nginx.service |
_HOSTNAME= |
Host that logged it | (useful on a central collector) |
_BOOT_ID= |
Specific boot | pair with --list-boots |
PRIORITY= |
Exact severity (0–7) | journalctl PRIORITY=3 (only err) |
SYSLOG_FACILITY= |
Syslog facility number | journalctl SYSLOG_FACILITY=10 (authpriv) |
-F <field> |
Lists all values of a field | journalctl -F _COMM |
Output formats and grep
-o changes how each entry is rendered — from the terse default to full structured dumps to machine-readable JSON. -g (grep) filters the MESSAGE field by a regex, and -x adds catalog explanations for known messages.
journalctl -u nginx -o cat            # message text ONLY (no timestamp/host) — clean for piping
journalctl -u nginx -o verbose        # EVERY field of every entry (what -o cat hides)
journalctl -u nginx -o json-pretty    # structured JSON — feed to jq or a log shipper
journalctl -o short-iso               # default layout but with ISO-8601 timestamps
journalctl -g 'timeout|refused'       # grep MESSAGE for a regex (smart-case)
journalctl -u ssh -g 'Failed password' -p info    # grep + unit + priority together
journalctl -xe                        # the classic: end of journal, with -x explanations
-o format |
Shows | Use it for |
|---|---|---|
short (default) |
time host unit: message |
Everyday reading |
short-iso |
Same, ISO-8601 timestamps | Unambiguous times, cross-TZ |
short-precise |
Microsecond timestamps | Ordering fast events |
cat |
message only |
Piping to grep/awk, clean copy |
verbose |
All fields per entry | Discovering fields to filter on |
json / json-pretty |
One JSON object per entry | jq, shipping to ELK/Loki |
export |
Binary-safe serialization | Backing up / transferring journals |
-o verbose is how you discover what you can filter on: run it on one interesting entry, read the field names, then filter by them. For parsing the text files (not the journal) you’ll lean on grep/awk/sed — covered in Text processing: grep, sed, awk, cut, sort.
Here is the flag reference to bookmark:
| Flag | Meaning | Example |
|---|---|---|
-u UNIT |
One systemd unit | journalctl -u nginx |
-f |
Follow (live tail) | journalctl -f |
-e |
Jump to end | journalctl -e |
-n N |
Last N lines | journalctl -n 100 |
-r |
Reverse (newest first) | journalctl -r |
-b / -b -1 |
This / previous boot | journalctl -b -1 |
--list-boots |
All known boots | — |
--since / --until |
Time window | --since "1 hour ago" |
-p LEVEL |
Priority ≤ LEVEL (or A..B range) |
-p err |
-k |
Kernel messages | journalctl -k |
FIELD=VALUE |
Structured field filter | _UID=0 |
-F FIELD |
List a field’s values | -F _SYSTEMD_UNIT |
-g PATTERN |
Grep the MESSAGE field | -g 'oom' |
-o FORMAT |
Output format | -o json-pretty |
-x |
Add catalog explanations | journalctl -xe |
--no-pager |
No less, raw stdout |
for pipes |
--disk-usage |
Space the journal uses | — |
--vacuum-size / --vacuum-time |
Prune the journal | --vacuum-time=2weeks |
Persistent vs volatile, disk usage, and rate-limiting
By default on many distros the journal is volatile — it lives in /run/log/journal, which is a tmpfs (RAM), and it is wiped on every reboot. That’s why a fresh Ubuntu box can show you journalctl -b but returns nothing for -b -1: there was no previous boot on disk. A persistent journal lives in /var/log/journal and survives reboots. Whether you get one is controlled by Storage= in /etc/systemd/journald.conf:
Storage= value |
Where the journal lives | Survives reboot? |
|---|---|---|
auto (default) |
/var/log/journal if that directory exists, else /run |
Only if the dir exists |
persistent |
/var/log/journal (created if missing) |
Yes |
volatile |
/run/log/journal (RAM) |
No |
none |
Nowhere — journald forwards but stores nothing | No |
To make the journal persistent, the reliable one-liner is to create the directory (with auto, that alone flips it) or set Storage=persistent, then restart journald:
# Enable a persistent journal:
sudo mkdir -p /var/log/journal
sudo systemd-tmpfiles --create --prefix /var/log/journal   # correct owner/mode
sudo systemctl restart systemd-journald
journalctl --list-boots        # now accumulates across reboots
The journal manages its own size — this is the reason it never needs logrotate. Retention is governed by a handful of journald.conf knobs, and you can force cleanup on demand:
journalctl --disk-usage
# Archived and active journals take up 1.2G in the file system.

sudo journalctl --vacuum-size=500M    # shrink the journal to at most 500 MB
sudo journalctl --vacuum-time=2weeks  # delete journal files older than 2 weeks
sudo journalctl --vacuum-files=5      # keep only the 5 most recent journal files
sudo journalctl --rotate              # rotate now (start a fresh active file)
journalctl --verify                   # integrity-check the journal files
journald.conf directive |
Controls | Typical value |
|---|---|---|
Storage= |
Volatile vs persistent | auto / persistent |
SystemMaxUse= |
Max total space (persistent) | SystemMaxUse=1G |
SystemKeepFree= |
Min free space to leave on the FS | SystemKeepFree=15% |
SystemMaxFileSize= |
Max size per journal file before rotate | SystemMaxFileSize=128M |
RuntimeMaxUse= |
Max space for the volatile journal | RuntimeMaxUse=200M |
MaxRetentionSec= |
Delete entries older than this | MaxRetentionSec=1month |
MaxFileSec= |
Force rotate a file after this age | MaxFileSec=1week |
ForwardToSyslog= |
Also hand messages to rsyslog | yes |
One more journald behaviour that surprises people: rate-limiting. To stop a crash-looping service from filling the disk with the same line a million times a second, journald drops messages beyond a burst threshold and inserts a marker: “Suppressed 3172 messages from …”. The controls live in journald.conf:
| Directive | Default | Meaning |
|---|---|---|
RateLimitIntervalSec= |
30s |
The sliding window |
RateLimitBurst= |
10000 |
Max messages per window per service |
If you’re legitimately losing important lines, raise RateLimitBurst (or set it to 0 to disable, which you’d only do while debugging). You can also override it per-service in the unit with LogRateLimitIntervalSec=/LogRateLimitBurst=. Seeing “Suppressed N messages” is a symptom, not a bug — it means something is logging far too much.
The syslog world: facilities, severities, rsyslog & central logging
Even in a journald world you have to understand syslog, because it’s the protocol every network device, appliance, and legacy daemon speaks, and it’s the vocabulary journald itself reuses (-p, SYSLOG_FACILITY=). A syslog message carries two small numbers: a facility (roughly who is talking — the subsystem) and a severity (how bad it is). Together they form the priority (PRI).
Facilities — who is talking
| Code | Keyword | Subsystem |
|---|---|---|
| 0 | kern |
Kernel messages |
| 1 | user |
Generic user-level (the default for logger) |
| 2 | mail |
Mail system (postfix, sendmail) |
| 3 | daemon |
System daemons without their own facility |
| 4 | auth |
Security / authorization |
| 5 | syslog |
Messages from the syslog daemon itself |
| 6 | lpr |
Line-printer subsystem |
| 7 | news |
Usenet news |
| 8 | uucp |
UUCP subsystem |
| 9 | cron |
Clock / cron daemon |
| 10 | authpriv |
Security / authorization, private (sudo, sshd, PAM) |
| 11 | ftp |
FTP daemon |
| 16–23 | local0–local7 |
Free for your own apps |
The two you’ll use most: authpriv (facility 10) is where authentication events go — sudo, sshd, PAM — which is why the auth log is a separate, tighter-permissioned file. And local0–local7 are reserved for you: point your own application at local3 and route it to its own file without colliding with anything built-in.
Severities — how bad it is
| Code | Keyword | Meaning | You act… |
|---|---|---|---|
| 0 | emerg |
System is unusable | Now, everything’s down |
| 1 | alert |
Action needed immediately | Now |
| 2 | crit |
Critical condition | Urgently |
| 3 | err |
Error condition | Soon |
| 4 | warning |
Warning condition | Investigate |
| 5 | notice |
Normal but significant | Note it |
| 6 | info |
Informational | Context |
| 7 | debug |
Debug-level | Only when debugging |
This is the same 0–7 scale journalctl -p uses. Lower number = more severe. “Show me errors and worse” means -p err, i.e. levels 0–3.
The priority number
The single wire value at the front of a raw syslog message — the <34> you’ll see if you ever tcpdump port 514 — is the priority (PRI), computed as:
PRI = facility × 8 + severity
So an authpriv (10) message at crit (2) severity has PRI = 10 × 8 + 2 = 82, transmitted as <82>. You rarely compute this by hand, but knowing the formula demystifies the numbers in packet captures and rsyslog internals — and it’s a favourite exam question. Watch the terminology: rsyslog’s “priority” is this combined PRI number, while journald’s “priority” (-p, PRIORITY=) is just the severity (0–7). Same word, two meanings.
rsyslog: rules and routing
rsyslog is the modern syslog daemon on most distros. Its job is to receive messages (from the journal, the local socket, the kernel, and the network) and route them to destinations based on rules. Config lives in /etc/rsyslog.conf, with drop-in snippets in /etc/rsyslog.d/*.conf (put your own rules there, not in the main file). The classic rule (still perfectly valid) is a selector — facility.severity — followed by an action (usually a file path):
# /etc/rsyslog.d/50-custom.conf — selector  <TAB>  action

authpriv.*          /var/log/secure          # all auth-private events → secure
mail.*              -/var/log/maillog        # leading - = async write (don't fsync each line)
cron.*              /var/log/cron
kern.*              /var/log/kern.log
*.info;mail.none;authpriv.none;cron.none  /var/log/messages   # everything info+, minus 3 facilities
*.emerg             :omusrmsg:*              # emergencies → wall to all logged-in users
local3.*            /var/log/myapp.log       # your app's local3 → its own file
Read the selector precisely: mail.info means facility mail, severity info and above (more severe). Modifiers refine it — mail.=info is only info, mail.!=info is everything except info, and .none excludes a facility entirely (that’s how /var/log/messages gets “everything except mail, authpriv, and cron”, which have their own files). *.* is everything.
| Selector | Matches |
|---|---|
mail.info |
mail facility, info and more severe |
mail.=info |
mail facility, only info |
mail.!=info |
mail facility, everything except info |
*.err |
Any facility, err and worse |
authpriv.* |
All severities of authpriv |
cron.none |
Nothing from cron (used to exclude) |
*.* |
Everything |
The daemon loads modules to gather and emit messages. You seldom touch these on a stock box, but you need to recognise them:
| Module | Role |
|---|---|
imuxsock |
Input: the local /dev/log socket (apps calling syslog()) |
imjournal |
Input: read structured messages from the journal |
imklog |
Input: the kernel log |
imtcp / imudp |
Input: receive remote syslog over TCP / UDP |
omfile |
Output: write to a file (the default file action) |
omfwd |
Output: forward to a remote server |
After any change, validate then restart — never restart blind:
sudo rsyslogd -N1                 # check config syntax, change nothing
sudo systemctl restart rsyslog    # apply
logger -p local3.info "rsyslog test line"   # emit a test message
tail -n1 /var/log/myapp.log       # confirm it routed
Central logging: forwarding with omfwd
The moment you have more than a couple of servers, you want logs in one place — a central collector you can search across the whole fleet, and that survives a box being wiped. rsyslog does this natively with the omfwd action. The legacy shorthand is compact; the modern RainerScript form is explicit and is what you should write today:
# Legacy shorthand (still works):
*.*  @logserver.example.com:514      # single @  = UDP  (fire-and-forget, can drop)
*.*  @@logserver.example.com:514     # double @@ = TCP  (reliable, ordered)

# Modern RainerScript (preferred — explicit, with a disk queue for reliability):
action(type="omfwd"
       target="logserver.example.com" port="514" protocol="tcp"
       action.resumeRetryCount="-1"                 # retry forever if the server is down
       queue.type="linkedList" queue.size="10000")  # buffer in RAM if it can't send
| Syntax | Transport | Reliability |
|---|---|---|
@host:514 |
UDP | Fire-and-forget — silently drops under load |
@@host:514 |
TCP | Reliable, ordered, back-pressured |
omfwd + queue.* |
TCP + on-disk/RAM queue | Survives collector downtime |
omfwd + gtls |
TCP over TLS | Encrypted + reliable (port 6514) |
For anything crossing an untrusted network, wrap it in TLS (RFC 5425, conventionally port 6514) so credentials and internal hostnames aren’t sent in clear text:
global(DefaultNetstreamDriver="gtls"
       DefaultNetstreamDriverCAFile="/etc/rsyslog.d/ca.pem")
action(type="omfwd" target="logserver.example.com" port="6514" protocol="tcp"
       StreamDriver="gtls" StreamDriverMode="1" StreamDriverAuthMode="x509/name")
On the collector you enable the matching input — module(load="imtcp") input(type="imtcp" port="514") — open the firewall, and route incoming messages into per-host files with a template. Templates let you control the on-disk format and path using message properties:
# On the central server: file per host, per program.
template(name="perHost" type="string"
         string="/var/log/remote/%HOSTNAME%/%PROGRAMNAME%.log")
module(load="imtcp")
input(type="imtcp" port="514")
*.*  action(type="omfile" dynaFile="perHost")
Properties like %HOSTNAME%, %PROGRAMNAME%, %timegenerated%, %syslogpriority%, and %msg% are the property replacer — the same mechanism that formats every line rsyslog writes. This one server, with one imtcp input and one templated output, is the seed of a real centralised-logging platform (the next step up being an aggregator like Loki, Graylog, or an ELK/OpenSearch stack that indexes what rsyslog ships it).
The /var/log tour and the kernel ring buffer
Even with the journal, you must know the /var/log neighbourhood — because apps write there directly, because forwarded/central logs land there, and because half of production tooling reads there. The big gotcha is naming: Debian/Ubuntu and RHEL/Fedora call the same logs different things.
| Purpose | Debian / Ubuntu | RHEL / Fedora / Rocky | Read with |
|---|---|---|---|
| General system messages | /var/log/syslog |
/var/log/messages |
less, tail -f |
| Authentication (sudo, ssh, PAM) | /var/log/auth.log |
/var/log/secure |
grep, tail -f |
| Kernel ring-buffer log | /var/log/kern.log |
(folded into messages) |
less / journalctl -k |
| Boot-time kernel snapshot | /var/log/dmesg |
/var/log/dmesg |
less |
| Service/boot startup | /var/log/boot.log |
/var/log/boot.log |
less |
| Cron jobs | (in syslog) or /var/log/cron.log |
/var/log/cron |
grep CRON |
| Mail system | /var/log/mail.log |
/var/log/maillog |
less |
| Package manager | /var/log/dpkg.log, apt/ |
/var/log/dnf.log (yum.log) |
less |
| SELinux / audit | (usually absent) | /var/log/audit/audit.log |
ausearch, less |
| Web server | /var/log/nginx/, /var/log/apache2/ |
/var/log/nginx/, /var/log/httpd/ |
per-vhost files |
| Login records (binary) | /var/log/wtmp, btmp, lastlog |
same | last, lastb, lastlog |
Two things to internalise. First, /var/log/wtmp, /var/log/btmp, and /var/log/lastlog are binary — cat them and you get garbage; you read them with dedicated commands (below). Second, the single most-visited troubleshooting file is the auth log, and its name is distro-dependent — auth.log on Debian, secure on RHEL. Memorise both. When a file’s contents look identical to something in the journal, that’s expected: rsyslog wrote it from the journal.
dmesg and the kernel ring buffer
The kernel can’t write to a file — the filesystem is userspace and may not even be mounted early in boot — so it logs into a ring buffer: a fixed-size, circular chunk of kernel memory. When it fills, the oldest lines are overwritten. dmesg prints that buffer, and it’s where hardware, driver, filesystem, and out-of-memory events surface.
dmesg -H                 # Human: pager + relative human timestamps + colour
dmesg -T                 # translate timestamps to wall-clock dates
dmesg -w                 # WAIT/follow — live-tail new kernel messages
dmesg -l err,warn        # only error- and warning-level lines
dmesg -x                 # decode the facility & level of each line
dmesg | grep -i -e error -e fail -e oom     # quick scan for trouble
| Flag | Effect |
|---|---|
-H |
Human-readable: pager, colour, relative times |
-T |
Wall-clock timestamps (can drift after suspend/resume) |
-w |
Follow — wait for and print new messages |
-l LEVEL |
Filter by level (err, warn, crit, …) |
-f FAC |
Filter by facility (kern, daemon, …) |
-x |
Decode facility/level as text prefixes |
-c / -C |
Read-and-clear / clear the buffer |
The classic thing you hunt for in dmesg is the OOM killer. When the box runs out of memory, the kernel picks a victim process and kills it to survive, leaving an unmistakable trail:
sudo dmesg -T | grep -i -A1 'killed process'
# [Thu Jul  9 03:14:22 2026] Out of memory: Killed process 2468 (mysqld)
#   total-vm:8419236kB, anon-rss:6291456kB, file-rss:0kB, oom_score_adj:0
If a service “randomly disappeared” overnight and its own logs just stop mid-sentence, this is the first place to look — the kernel killed it, and systemd then logged a Main process exited. Because the ring buffer is volatile, prefer journalctl -k -b -1 to inspect a previous boot’s kernel log; dmesg only ever shows the current one.
⚠️ On Ubuntu (and any box with kernel.dmesg_restrict=1), an unprivileged dmesg fails with read kernel buffer failed: Operation not permitted. Use sudo dmesg, or read journalctl -k instead — the journal copy is readable by the systemd-journal/adm group.
logrotate: keeping text logs from eating the disk
The journal caps itself; text files do not. An app that logs to /var/log/myapp.log will grow it forever until the disk is full and the whole box falls over. logrotate is the standard tool that periodically renames, compresses, prunes, and re-creates those files so they stay bounded. It isn’t a daemon — it’s a program run on a schedule, from /etc/cron.daily/logrotate on older systems or a systemd timer (logrotate.timer → logrotate.service) on modern ones. (Timers are covered in Scheduling: cron, at & systemd timers.)
Global defaults live in /etc/logrotate.conf, and each package drops a snippet into /etc/logrotate.d/ for its own logs. A typical snippet:
# /etc/logrotate.d/myapp
/var/log/myapp/*.log {
    daily                 # rotate once a day
    rotate 14             # keep 14 old copies, then delete the oldest
    compress              # gzip rotated copies (.1.gz, .2.gz, …)
    delaycompress         # but don't compress the MOST-recent rotation yet
    missingok             # don't error if the log is absent
    notifempty            # skip rotation if the file is empty
    create 0640 myapp adm # after rotating, make a fresh empty file with these perms
    sharedscripts         # run postrotate once for the whole glob, not per file
    postrotate
        systemctl reload myapp >/dev/null 2>&1 || true   # tell the app to reopen its log
    endscript
}
| Directive | What it does |
|---|---|
daily / weekly / monthly |
Rotation frequency |
rotate N |
Keep N rotated copies, then discard |
size 100M / maxsize / minsize |
Rotate when the file exceeds a size |
compress |
Gzip rotated files |
delaycompress |
Delay compression by one cycle (pair with reopen-lazy apps) |
missingok |
Don’t fail if the log is missing |
notifempty |
Skip rotation of empty files |
create MODE OWNER GROUP |
Recreate the log after rotating, with these perms |
copytruncate |
Copy-then-truncate in place instead of rename+create |
dateext |
Suffix with a date (-20260709) instead of .1 |
olddir DIR |
Move rotated files elsewhere |
maxage N |
Delete rotated files older than N days |
su USER GROUP |
Rotate as a specific user (for locked-down dirs) |
postrotate … endscript |
Run a command after rotating (usually reload the writer) |
sharedscripts |
Run pre/postrotate once per glob, not once per file |
The one gotcha that catches everyone: create vs copytruncate
The default rotation strategy is rename + create: logrotate renames myapp.log → myapp.log.1 and creates a new empty myapp.log. But if the writing process is still holding the old file open, it keeps writing to myapp.log.1 (same inode) and the new myapp.log stays empty. The fix is postrotate — signal the app (systemctl reload, or kill -HUP) so it reopens the path.
copytruncate sidesteps that for apps you can’t signal: logrotate copies the contents to .1 and then truncates the original in place, so the process’s open file descriptor stays valid and keeps writing to the same (now-empty) file. The cost is a tiny race window — anything written between the copy and the truncate is lost.
| Strategy | How it works | Use when | Risk |
|---|---|---|---|
create (default) |
Rename old → .1, create fresh log |
The app reopens on signal (add postrotate) |
New file stays empty if app never reopens |
copytruncate |
Copy contents, truncate original in place | The app can’t be told to reopen | Loses lines written during the copy→truncate race |
Testing and forcing a rotation
Never wait a day to find out your rule is wrong — debug it dry:
sudo logrotate -d /etc/logrotate.conf        # DEBUG: dry-run, print the plan, change NOTHING
sudo logrotate -d /etc/logrotate.d/myapp     # debug just one snippet
sudo logrotate -vf /etc/logrotate.conf       # -f FORCE rotation now (+ -v verbose)
-d (debug) implies verbose and makes no changes — read its output to see exactly which files it would rotate and why (or why it would skip them). -f forces a rotation even if the schedule says it isn’t due yet — how you test a fresh snippet immediately. logrotate remembers when it last rotated each file in a state file (/var/lib/logrotate/logrotate.status on RHEL, /var/lib/logrotate/status on Debian); if a rule “won’t rotate,” that state file usually thinks it already did today — -f overrides it. ⚠️ Watch permissions: getting create’s mode/owner wrong (or forgetting su) can leave the new log unreadable by the service, and it silently stops logging.
Writing to logs and tracking logins
You’ll also write to the log stream — from scripts, cron jobs, and deploy hooks — and you’ll audit who logged in. Two small commands handle writing:
logger "deploy started"                       # → journal + syslog, facility user, severity notice
logger -t deploy -p local3.info "build 4821 shipped"   # custom tag + facility.severity
logger -s -p local3.err "migration FAILED"    # -s also echoes to stderr (for scripts)
echo "disk almost full" | logger -t diskcheck # pipe a command's output into the log

wall "Reboot in 5 minutes — save your work"   # broadcast to ALL logged-in terminals
wall < /etc/motd                              # broadcast a file
logger is the correct way for a shell script to log — it goes through the same pipeline as everything else, so journalctl -t deploy finds it and your rsyslog rules route it. wall (“write all”) broadcasts to every logged-in TTY, which is how you warn users before a reboot.
To capture the entire output of a command — both stdout and stderr — into the journal under its own identifier, use systemd-cat. It’s the clean way to make an ad-hoc job’s output land in journalctl alongside everything else, properly tagged and prioritised:
systemd-cat -t backup -p info ./nightly-backup.sh   # both streams → journal, tagged 'backup'
journalctl -t backup -e                             # read exactly that run back
For login history there are four tools reading the binary accounting files:
| Command | Reads | Shows |
|---|---|---|
who |
/run/utmp |
Who is logged in right now (user, TTY, login time) |
w |
/run/utmp + /proc |
Who’s on and what they’re running (+ load average) |
last |
/var/log/wtmp |
Login/logout history, plus reboots (last reboot) |
lastb |
/var/log/btmp |
Failed login attempts (root only) — brute-force detector |
lastlog |
/var/log/lastlog |
The last login time for every account |
who                     # vinod  pts/0  2026-07-09 09:02 (10.0.0.5)
w                       # + load average and each session's current command
last -n 10              # last 10 logins/logouts
last reboot             # every boot — a reboot timeline
sudo lastb -n 20        # last 20 FAILED logins — spot a brute-force by IP
journalctl -u ssh -g 'Failed password'   # the same, from the journal, with detail
sudo lastb is your fast brute-force check: a wall of Failed entries from one IP against root or admin is an attack in progress. Cross-reference with journalctl -u ssh -g 'Failed password' for the full context (source IP, username tried, timestamp).
The “something broke — where do I look” playbook
This is the section to internalise. Most incidents fall into a handful of shapes, and each has a first place to look. Memorise the mapping and you’ll diagnose in seconds instead of flailing.
| Symptom | First place to look | Command |
|---|---|---|
| A service won’t start / keeps restarting | Its journal, jumped to the end | journalctl -u <svc> -e (then -xe, -p err) |
| Service died overnight, logs cut off | Kernel OOM killer, then the unit | journalctl -k -b -1 -g oom → journalctl -u <svc> -b -1 -e |
| Can’t SSH in / auth failing | The auth log | journalctl -u ssh -e · /var/log/auth.log (Deb) · /var/log/secure (RHEL) |
| Suspected break-in / brute-force | Failed logins | sudo lastb · journalctl -u ssh -g 'Failed password' |
| Hardware / disk / driver flakiness | Kernel ring buffer | sudo dmesg -T -l err,warn · journalctl -k -p err |
Disk full because of /var/log |
Sizes, then vacuum + rotate | du -sh /var/log/* · journalctl --disk-usage → --vacuum-size=500M; logrotate -f |
| Cron job didn’t run | Cron facility | journalctl -u cron · /var/log/cron (RHEL) · grep CRON /var/log/syslog |
| App error but nothing in the journal | The app’s own file | ls /var/log/<app>/ · tail -f /var/log/nginx/error.log |
| “Suppressed N messages” | journald rate-limit | raise RateLimitBurst= in journald.conf |
| Reboot cause unknown | Boot list + previous boot | journalctl --list-boots → journalctl -b -1 -p err -e |
The disk-full case deserves a full walkthrough because it’s the one that pages you:
df -h /var                            # confirm /var (or /) is the full filesystem
sudo du -sh /var/log/* | sort -rh | head   # find the biggest offenders
journalctl --disk-usage               # how much is the journal?
sudo journalctl --vacuum-size=500M    # reclaim journal space immediately
sudo logrotate -vf /etc/logrotate.conf   # force-rotate + compress the text logs
# Then make it permanent: set SystemMaxUse= in journald.conf, and fix the
# logrotate rule for whatever grew (add/lower `rotate`, add `compress`).
Notice the pattern: reclaim now (vacuum, force-rotate), then cap forever (config). Deleting a live log file by hand is the wrong move — if a process still holds it open, the space isn’t freed until the process closes it, and you’ve lost the data with nothing to show for it. Truncate (: > file) or rotate instead.
Hands-on lab
Run this on a throwaway Ubuntu or Rocky/RHEL VM, or WSL. A few steps need sudo. (Bare containers often ship without a running journald or rsyslog — a VM or WSL is the reliable environment.) Each step lists the command, what you should see, and what just happened.
1. See both worlds at once.
journalctl -n 5 --no-pager        # newest 5 journal entries
ls -lh /var/log/ | head           # the text-file world
tail -n 3 /var/log/syslog 2>/dev/null || sudo tail -n 3 /var/log/messages
You should see structured journal lines and familiar text files. What just happened: you looked at the same system through both windows — the binary journal and the plain-text /var/log.
2. Inject a message and find it in both places.
logger -t lab -p local3.warning "hello from the logging lab"
journalctl -t lab -n 3 --no-pager                 # find it in the journal by tag
journalctl -p warning -g 'logging lab' -n 3 --no-pager   # find it by priority + grep
You should see your line come back, tagged lab. What just happened: logger pushed one message into the pipeline; you retrieved it two different ways — by tag and by priority+grep.
3. Slice by unit, time, and priority.
journalctl -u ssh -n 20 --no-pager        # (use -u sshd on RHEL)
journalctl -b -p err --no-pager | tail     # this boot's errors, if any
journalctl --since "10 min ago" -p warning --no-pager | tail
What just happened: you composed filters — unit, boot, time, priority — the core skill of reading the journal.
4. Explore boots and structured fields.
journalctl --list-boots            # how many boots are recorded?
journalctl -o verbose -n 1 --no-pager   # EVERY field of the newest entry
journalctl _COMM=sudo -n 5 --no-pager   # everything sudo logged
If --list-boots shows only boot 0, your journal is volatile. What just happened: you saw the raw fields that make journald queryable, and whether your journal survives reboots.
5. Check journal disk usage and (safely) vacuum.
journalctl --disk-usage
sudo journalctl --vacuum-time=2d       # remove journal data older than 2 days
⚠️ Vacuuming permanently deletes old journal data — fine on a lab box, think twice on a server you might need history from. What just happened: you saw journald’s self-managed retention, the reason it never needs logrotate.
6. Read the kernel ring buffer.
sudo dmesg -H | tail -n 15        # recent kernel messages, human-readable
sudo dmesg -l err,warn | tail     # only errors and warnings
What just happened: you read hardware/driver/kernel events straight from the ring buffer — where OOM kills and disk errors surface.
7. Write and debug a logrotate rule.
sudo mkdir -p /var/log/lab && echo "line 1" | sudo tee /var/log/lab/app.log
sudo tee /etc/logrotate.d/lab >/dev/null <<'EOF'
/var/log/lab/*.log {
    daily
    rotate 3
    compress
    missingok
    notifempty
    copytruncate
}
EOF
sudo logrotate -d /etc/logrotate.d/lab     # DRY-RUN: read the plan, no changes
sudo logrotate -vf /etc/logrotate.d/lab    # FORCE it, verbosely
ls -l /var/log/lab/                        # app.log + app.log.1 (or .1.gz next cycle)
You should see the debug plan, then a forced rotation producing app.log.1. What just happened: you wrote, dry-ran, and force-executed a rotation rule — exactly how you’d validate one in production before trusting the timer.
8. Review login history.
last -n 5           # recent logins + reboots
sudo lastb -n 5     # recent FAILED logins (may be empty on a clean box)
who ; w             # who's on now, and what they're doing
What just happened: you read the binary accounting files through their proper tools — the audit trail for who accessed the box.
9. Clean up.
⚠️ rm -rf deletes recursively with no undo — double-check the paths before you press Enter; these are the two lab artefacts you created above, nothing else.
sudo rm -rf /var/log/lab /etc/logrotate.d/lab
What just happened: removed the lab artefacts so nothing lingers.
Common mistakes and troubleshooting
| Symptom | Cause | Fix |
|---|---|---|
journalctl -b -1 says “no journal files” / only boot 0 exists |
Journal is volatile (RAM), wiped each reboot | mkdir -p /var/log/journal; set Storage=persistent; systemctl restart systemd-journald |
journalctl shows nothing / “No journal files” as a normal user |
Not in the systemd-journal (or adm/wheel) group |
sudo journalctl, or usermod -aG systemd-journal <user> then re-login |
| “Suppressed 4213 messages from …” in the log | journald rate-limiting a chatty service | Raise RateLimitBurst=/RateLimitIntervalSec= (or fix the app spewing logs) |
After logrotate, app.log stays empty; app.log.1 keeps growing |
App holds the old fd open; never reopened the path | Add postrotate reload (kill -HUP/systemctl reload), or use copytruncate |
dmesg: read kernel buffer failed: Operation not permitted |
kernel.dmesg_restrict=1 (Ubuntu default) |
sudo dmesg, or read journalctl -k instead |
Disk at 100%, deleting a big /var/log file didn’t free space |
A process still holds the deleted file open | Truncate instead: : > /var/log/big.log, or restart the writer; then cap it |
| rsyslog rule added but no new file appears | Config not reloaded, or a syntax error | rsyslogd -N1 to validate, then systemctl restart rsyslog |
| Central logs never arrive at the collector | Firewall/port, UDP vs TCP mismatch, or TLS misconfig | Check `ss -tlnp |
logrotate “won’t rotate” a growing file |
State file thinks it already rotated today; or not due | logrotate -f; inspect /var/lib/logrotate/ state; check the schedule directive |
Auth failures invisible — you grepped the wrong file |
Distro naming: auth.log (Debian) vs secure (RHEL) |
Use journalctl -u ssh/SYSLOG_FACILITY=10, which is distro-neutral |
Three gotchas that cause the most lost hours:
Volatile journals lie by omission. The single most common “the logs don’t have it” moment is looking for a previous boot on a box whose journal is volatile. There’s nothing there because RAM was cleared on reboot. Always confirm with journalctl --list-boots; if you only ever see boot 0, enable persistence before the incident you’ll wish you had it for. On cloud images this is frequently the default.
The empty-file-after-rotation trap. When a daemon keeps its log file open and logrotate renames it out from under the daemon, the daemon happily keeps writing to the now-renamed inode while the freshly created file stays at zero bytes. You “fixed” nothing and lost visibility. The rule: any rotation with create needs a postrotate that tells the writer to reopen (a reload or HUP); if you can’t signal the writer, use copytruncate and accept its small race. Nginx and most systemd services reload cleanly; some third-party apps only understand copytruncate.
Deleting a held-open log doesn’t free the disk. Under pressure, people rm the giant log file — and df still shows the disk full, because the writing process holds the file descriptor and the kernel won’t reclaim the blocks until that process closes or dies. Use : > file (truncate) or restart/rotate the writer. lsof +L1 lists exactly these “deleted but still open” files when you’re hunting for phantom disk usage.
Cheat-sheet
| Task | Command |
|---|---|
| Follow a service live | journalctl -u <svc> -f |
| A service’s recent logs, end | journalctl -u <svc> -e (or -xe) |
| Errors this boot | journalctl -p err -b |
| Previous boot’s log | journalctl -b -1 |
| Kernel log (persistent) | journalctl -k (prev boot: -k -b -1) |
| Time window | journalctl --since "1 hour ago" --until now |
| Grep the message field | journalctl -g 'pattern' |
| Filter by user / PID / cmd | journalctl _UID=0 · _PID=123 · _COMM=sudo |
| All fields of an entry | journalctl -o verbose -n1 |
| Journal size / vacuum | journalctl --disk-usage · --vacuum-size=500M · --vacuum-time=2weeks |
| Make journal persistent | mkdir -p /var/log/journal && systemctl restart systemd-journald |
| Kernel ring buffer | dmesg -H · follow dmesg -w · errors dmesg -l err |
| Auth log | Debian /var/log/auth.log · RHEL /var/log/secure |
| General log | Debian /var/log/syslog · RHEL /var/log/messages |
| Validate rsyslog config | rsyslogd -N1 then systemctl restart rsyslog |
| Forward to a server (TCP) | rsyslog: *.* @@logserver:514 |
| Write to the log | logger -t tag -p local3.info "msg" |
| Broadcast to all TTYs | wall "message" |
| logrotate dry-run / force | logrotate -d <conf> · logrotate -vf <conf> |
| Failed logins / who’s on | sudo lastb · last · who · w |
| PRI number | PRI = facility × 8 + severity |
Interview and exam questions
Q: What is the fundamental difference between the systemd journal and traditional syslog files?
A: The journal is a binary, structured, indexed store — every entry carries named fields (_SYSTEMD_UNIT, _UID, PRIORITY, …) and you query it with journalctl, filtering by unit/priority/boot/time without scanning files. Syslog files are plain text, one line per event, unstructured, read with grep/less. On a modern box both coexist: rsyslog typically reads the journal and writes the familiar text files.
Q: The journal is empty for the previous boot. Why, and how do you fix it?
A: The journal is volatile (in /run, RAM) and was wiped on reboot. Make it persistent: mkdir -p /var/log/journal (with Storage=auto that alone flips it) or set Storage=persistent in /etc/systemd/journald.conf, then systemctl restart systemd-journald. Verify with journalctl --list-boots.
Q: Show all error-and-worse messages for nginx from the previous boot.
A: journalctl -u nginx -b -1 -p err. -u scopes the unit, -b -1 the previous boot, -p err severity 0–3.
Q: How is a syslog priority (PRI) computed, and how does it differ from journald’s priority?
A: PRI = facility × 8 + severity — the combined wire value (e.g. authpriv(10)+crit(2) = <82>). journald’s “priority” (-p, PRIORITY=) is just the severity 0–7. Same word, different scope.
Q: -p err — what exactly does it show, and how would you show only err and warning?
A: A single level shows that level and everything more severe (lower number): -p err = severities 0–3. For a bounded set use a range: -p warning..err (i.e. 4…3) shows only warning and err.
Q: A service logs to a file, you set up logrotate, but after rotation the new file stays empty. Why?
A: The process still holds the old file descriptor and keeps writing to the renamed inode. Fix with a postrotate that reloads/HUPs the app so it reopens the path, or use copytruncate (copy then truncate in place) if the app can’t be signalled.
Q: Why doesn’t the journal need logrotate, but text logs do?
A: journald self-manages retention via SystemMaxUse=/MaxRetentionSec= and on-demand --vacuum-* — it rotates and prunes its own binary files. Text files under /var/log grow unbounded and need an external tool (logrotate) to rename, compress, prune, and re-create them.
Q: (RHCSA-style) Configure rsyslog to forward all logs to logs.example.com over TCP, reliably.
A: In /etc/rsyslog.d/60-fwd.conf: legacy *.* @@logs.example.com:514, or RainerScript action(type="omfwd" target="logs.example.com" port="514" protocol="tcp" queue.type="linkedList" action.resumeRetryCount="-1"). Then rsyslogd -N1 and systemctl restart rsyslog. @@ = TCP (reliable), @ = UDP (lossy).
Q: A process died overnight and its own log just stops. Where do you look first?
A: The kernel OOM killer: journalctl -k -b -1 -g oom (or dmesg -T | grep -i 'killed process'). If the kernel killed it for memory, you’ll see Out of memory: Killed process …, then the unit’s Main process exited in journalctl -u <svc> -b -1.
Q: How do you find recent failed SSH login attempts?
A: sudo lastb (from /var/log/btmp) for the raw list, and journalctl -u ssh -g 'Failed password' for source IPs and usernames. A flood from one IP is a brute-force in progress.
Q: dmesg fails with “Operation not permitted” for a normal user. Why?
A: kernel.dmesg_restrict=1 (Ubuntu’s default) restricts the ring buffer to privileged users. Use sudo dmesg, or read the journal’s copy with journalctl -k, which the systemd-journal/adm group can read.
Q: The disk is full from logs. Walk through fixing it without losing more than necessary.
A: du -sh /var/log/* | sort -rh to find the offender and journalctl --disk-usage for the journal. Reclaim now: journalctl --vacuum-size=500M and logrotate -vf. Cap forever: SystemMaxUse= in journald.conf, and tune the rotate/compress rule for the file that grew. Never rm a held-open file (df won’t shrink) — truncate with : > file or restart the writer.
Key takeaways
- Two worlds, one stream. The binary systemd journal (query with
journalctl) and the plain-text/var/logfiles (read withgrep/less) coexist on modern Linux — usually the same messages, two views. Reach forjournalctlfirst; it’s always present and structured. journalctlcomposes filters. Combine-u(unit),-p(severity),-b/-b -1(boot),--since/--until(time), field matches (_UID=,_COMM=), and-g(grep) to zoom from a whole system to ten lines in one command.- Persistence is a choice. A volatile journal is wiped on reboot — you can’t investigate a crash you have no record of.
mkdir -p /var/log/journal(+ restart journald) makes it durable; confirm with--list-boots. - syslog vocabulary is everywhere. Facility (who) + severity (how bad) →
PRI = facility×8 + severity. It’s how rsyslog routes (facility.severity /path) and how journald reuses the 0–7 severity scale for-p. - The journal self-vacuums; text logs need logrotate.
SystemMaxUse=/--vacuum-*bound the journal;logrotate(from cron or a timer) renames, compresses, prunes, and re-creates text files — mindcreatevscopytruncateso you don’t rotate into an empty file. dmesg/journalctl -kis the kernel’s story. Hardware, drivers, filesystem errors, and the OOM killer live here. The ring buffer is volatile — usejournalctl -k -b -1for a previous boot.- Have the playbook ready. Service failing →
journalctl -u <svc> -xe; auth →auth.log/secure; kernel/hardware →dmesg/-k; disk full →du /var/log+ vacuum +logrotate -f; break-in →lastb. Knowing where first is the whole skill.